Vesica Pisces and WYNN
Chargers are doing really really well and the marine layer is a butt kicker this afternoon so the family is just staying put and relaxing …I enjoy coming up to the computer and drawing w/ my crayons. it’s relaxing .. sometimes, just to prove to myself I’m NOT crazy in the truest sense of the word (I can promise you, I still am) I’ll just pick a stock and “draw” – circles, squares, angles and just “prove” to myself that YES This stuff does work.
so I took WYNN … no reason, trust me.
OBTW – here’s some work on the WYNN top and the fall from grace so to speak: https://bartscharts.com//?s=wynn
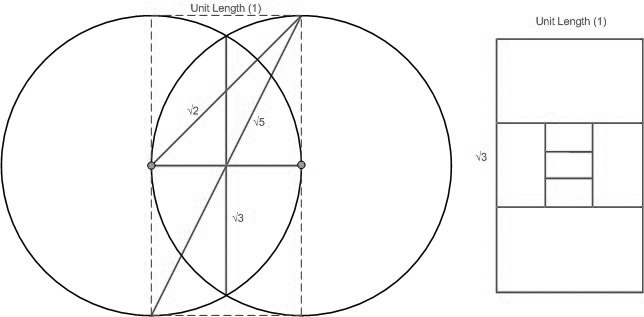
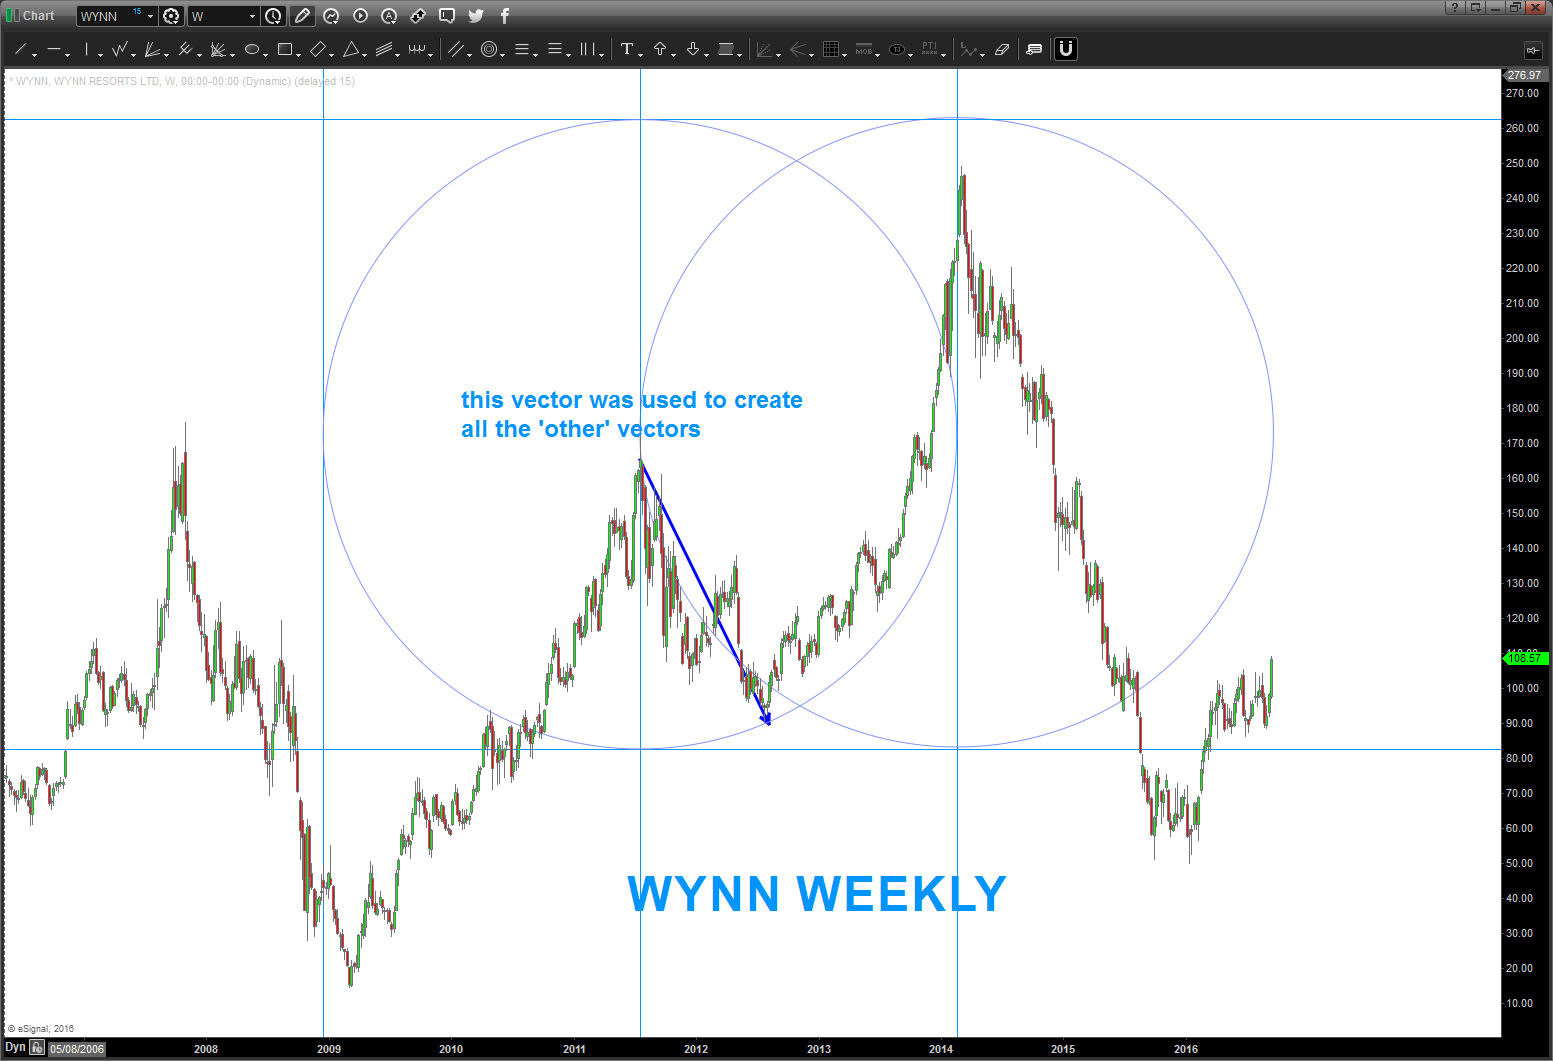
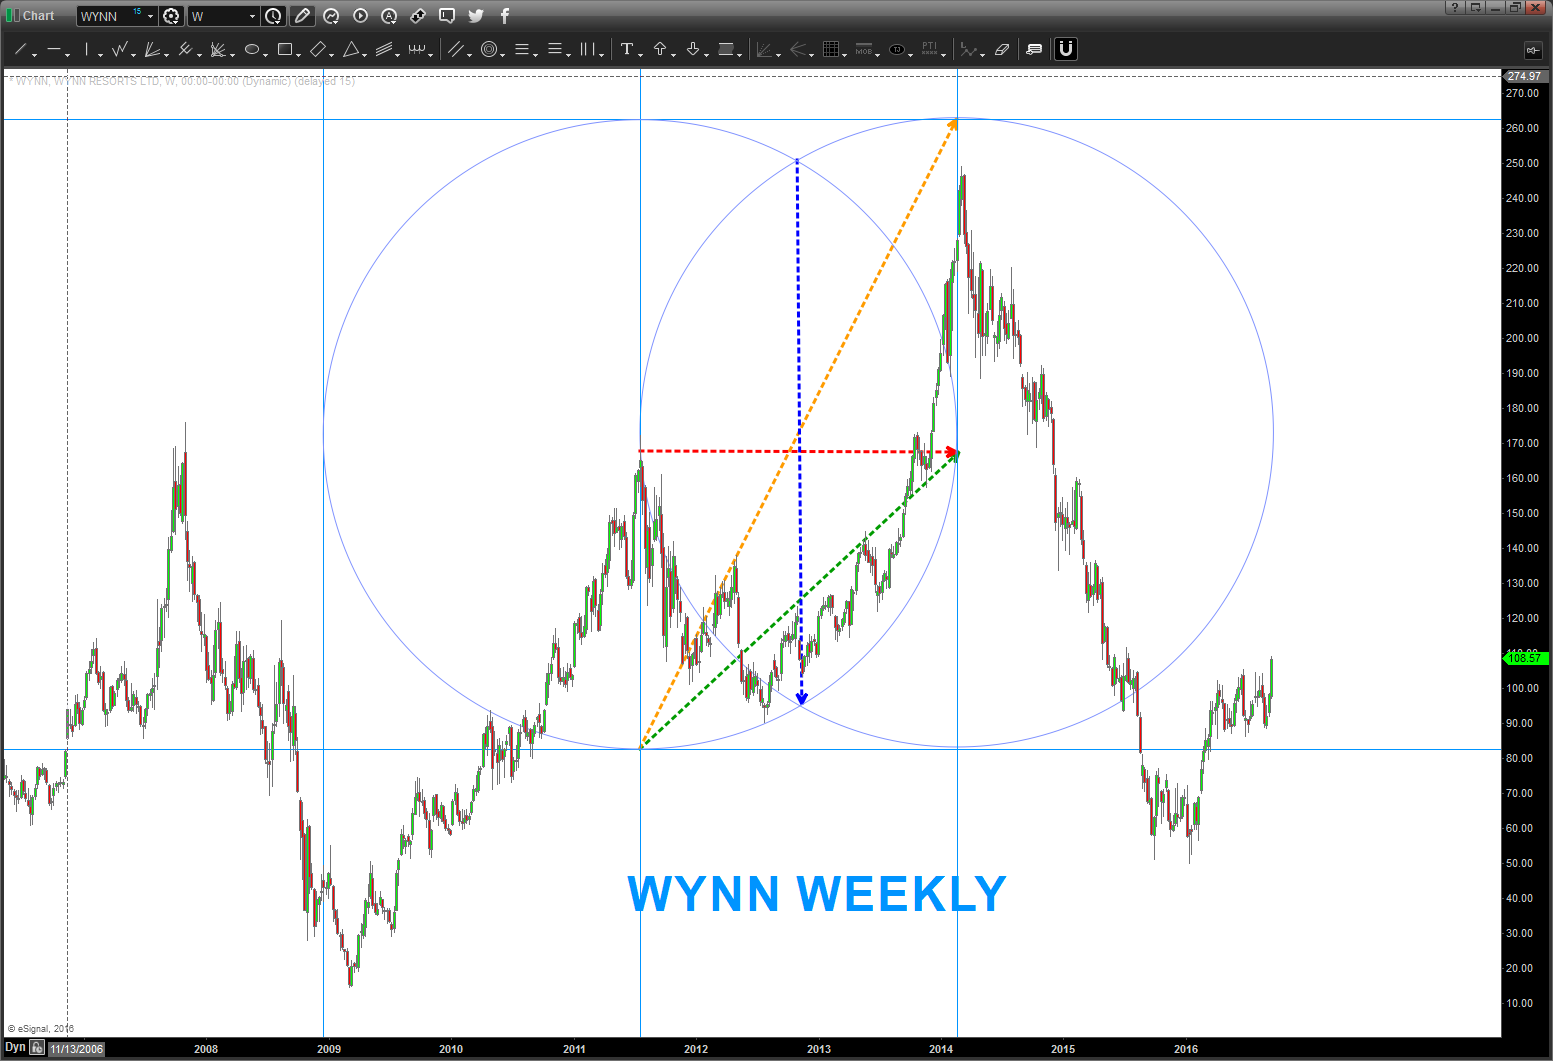
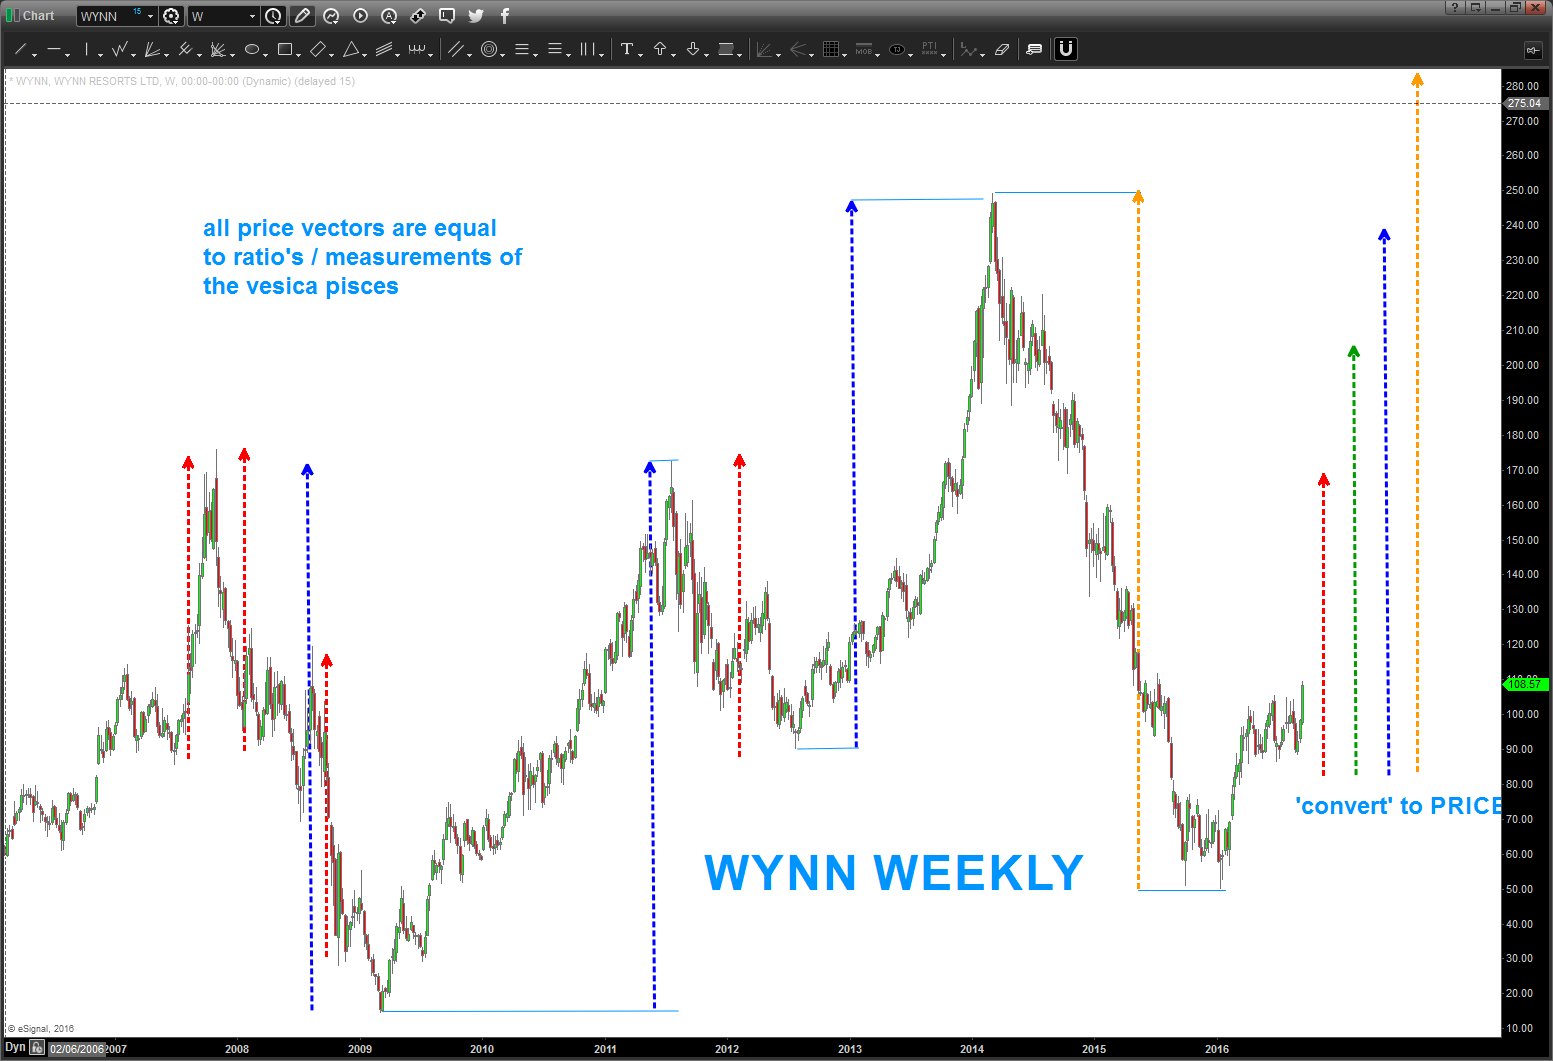
Anyway … look at the chart on a LONG TERM basis and just pick a vector .. draw that vector as the radius of the circle and then draw the remaining vectors which compromise the remaining aspects of the Vesica Pisces. (OBTW and note – they are all square roots of the numbers 1-5. :))
Here’s the charts … I didn’t make this up, I picked WYNN and did the Vesica Pisces.
I’m pretty sure I know why it works (it ONLY works to help you manage risk) but on another note … I know why this “stuff” works … 😉