XOM update
09/2015/2016 – short zone appears to hold. break below 86 on a daily or weekly close will seek 80 for starts.

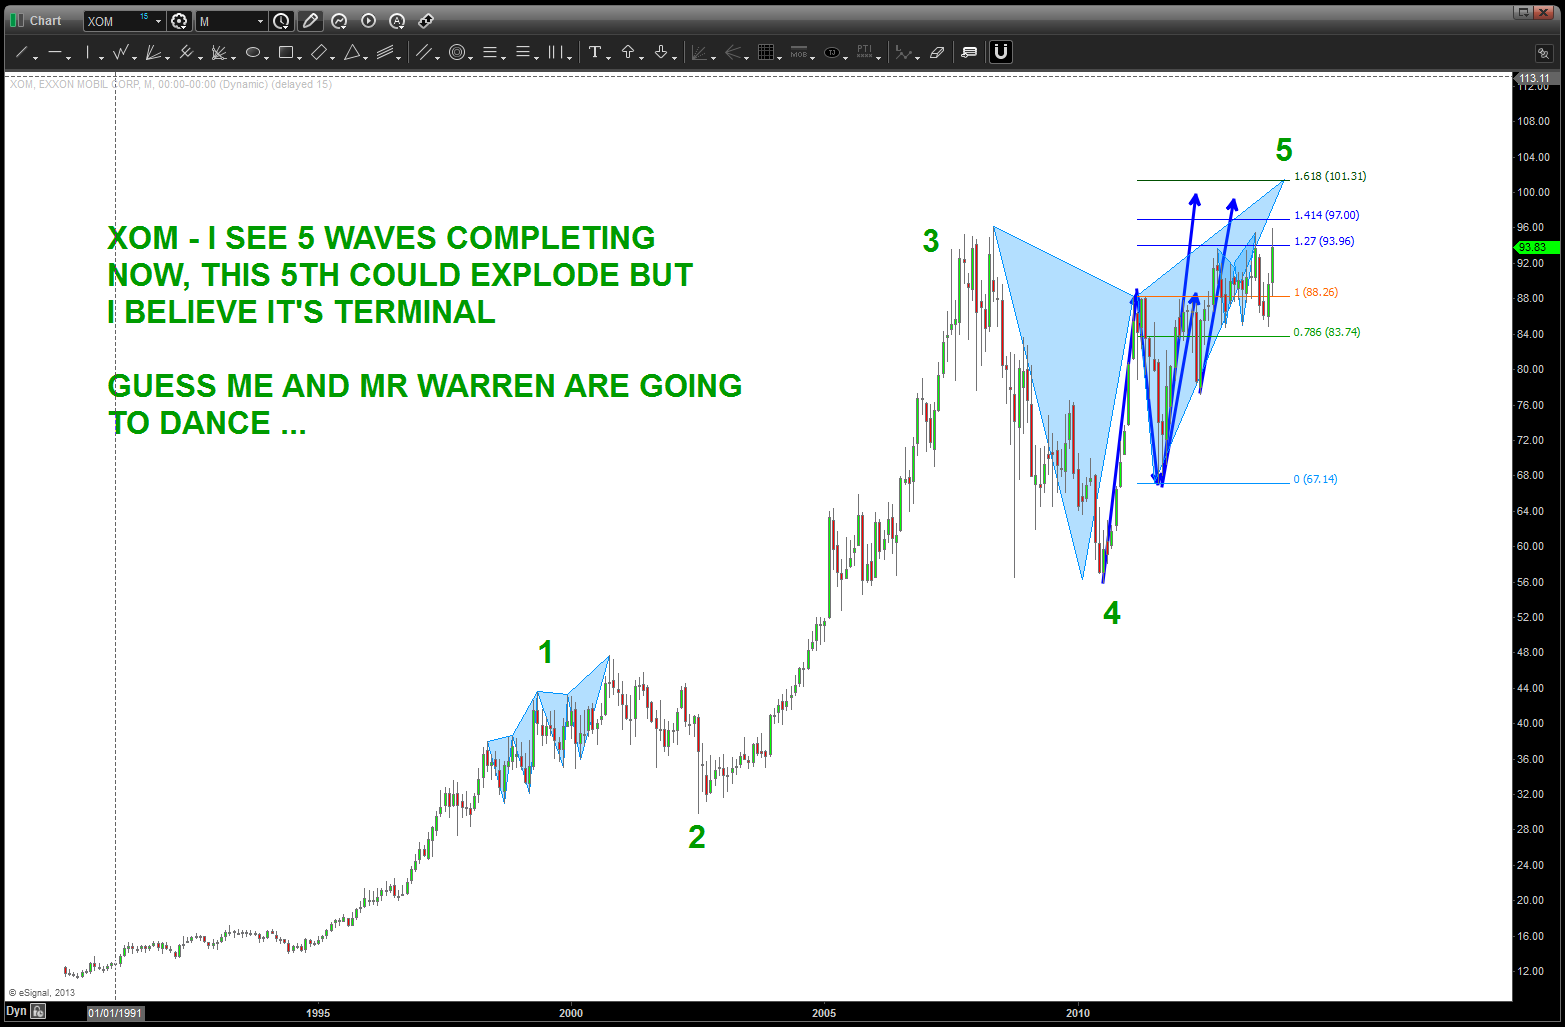
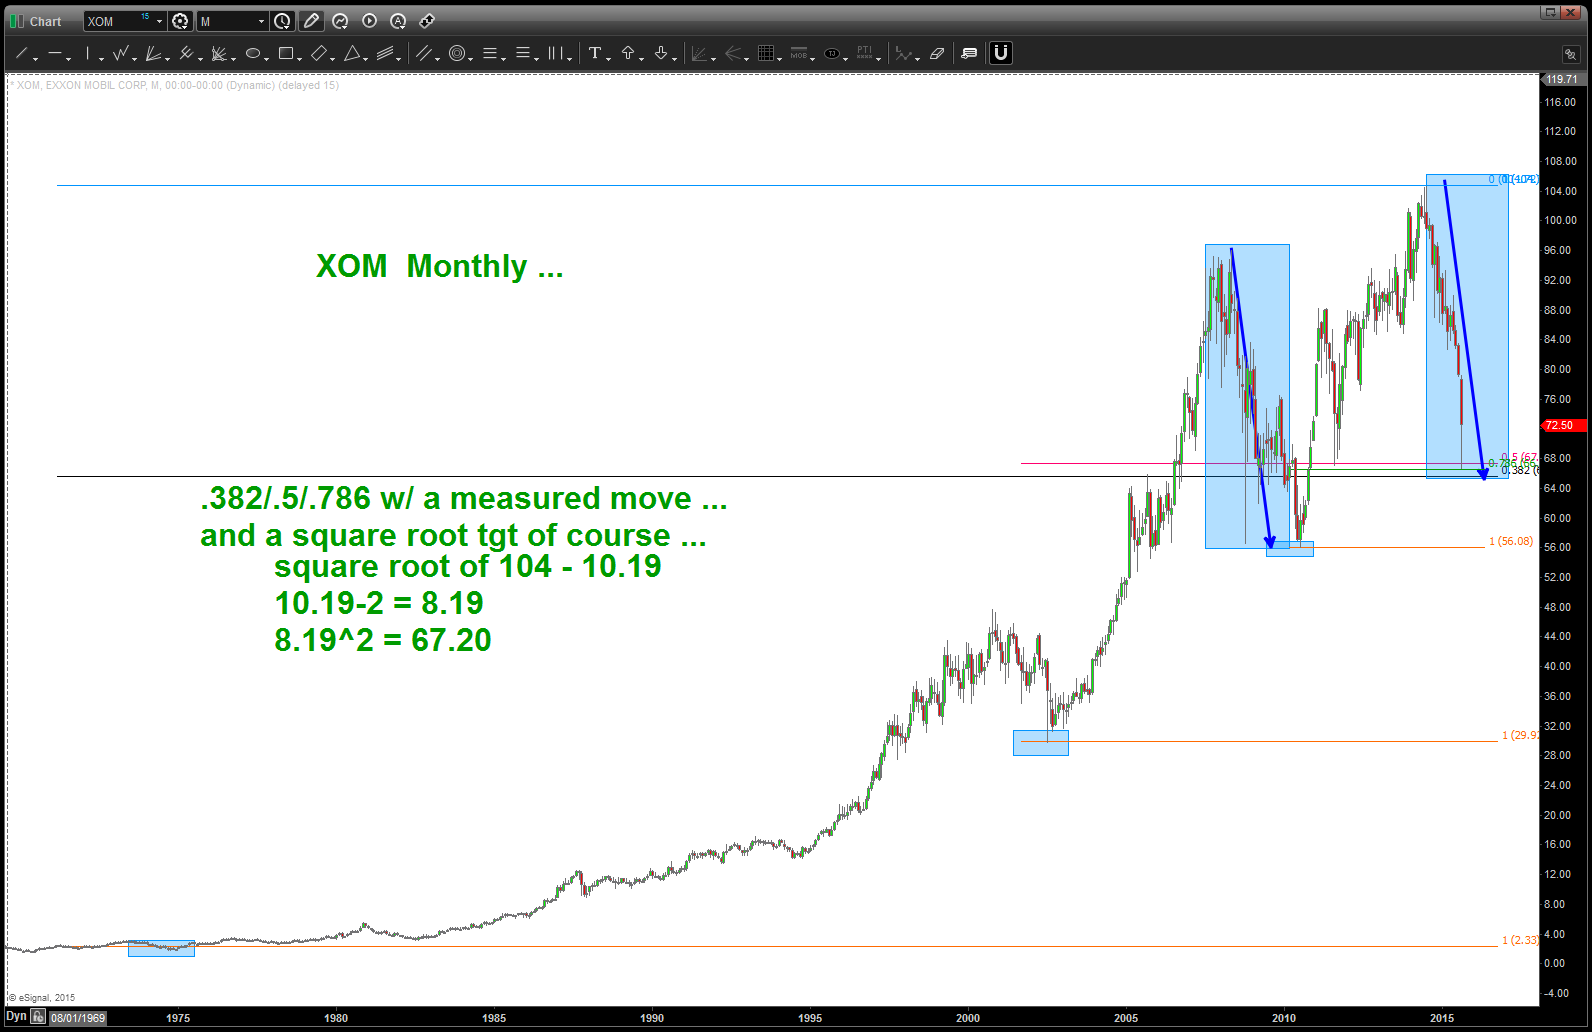
04/24/2016 – the “zone” shown below has worked and XOM is rallying in 3 waves. IF the thesis that the high at 104 was a big top THEN this pattern shown below should work. If not, then it will continue higher. This is a very nice sell pattern.
please read the entire post from the bottom to the top to understand what could possibly going on here ….
thanks and hope you have had/are having a good weekend.
Bart

folks – I am sorry that I didn’t post this earlier as this ranks up there as a “no brainer” in my simple mind …
- the ENTIRE KEY is the square root target
- IF square root targets lie on top of 3 Fibonacci retracements and a measured move then Lions (square root target), Tigers (measured move) and Bears (pardon the pun – retracement levels) it is “usually” market magic.
also, the pattern from November 2013 is included. was looking for 101-102. shoot me …
strategy is key here .. as you can see we do have a target a little lower also BUT that daily candle is impressive, wouldn’t you say?