Under Armour ($UA)
Posted on October 26, 2016 1 Comment
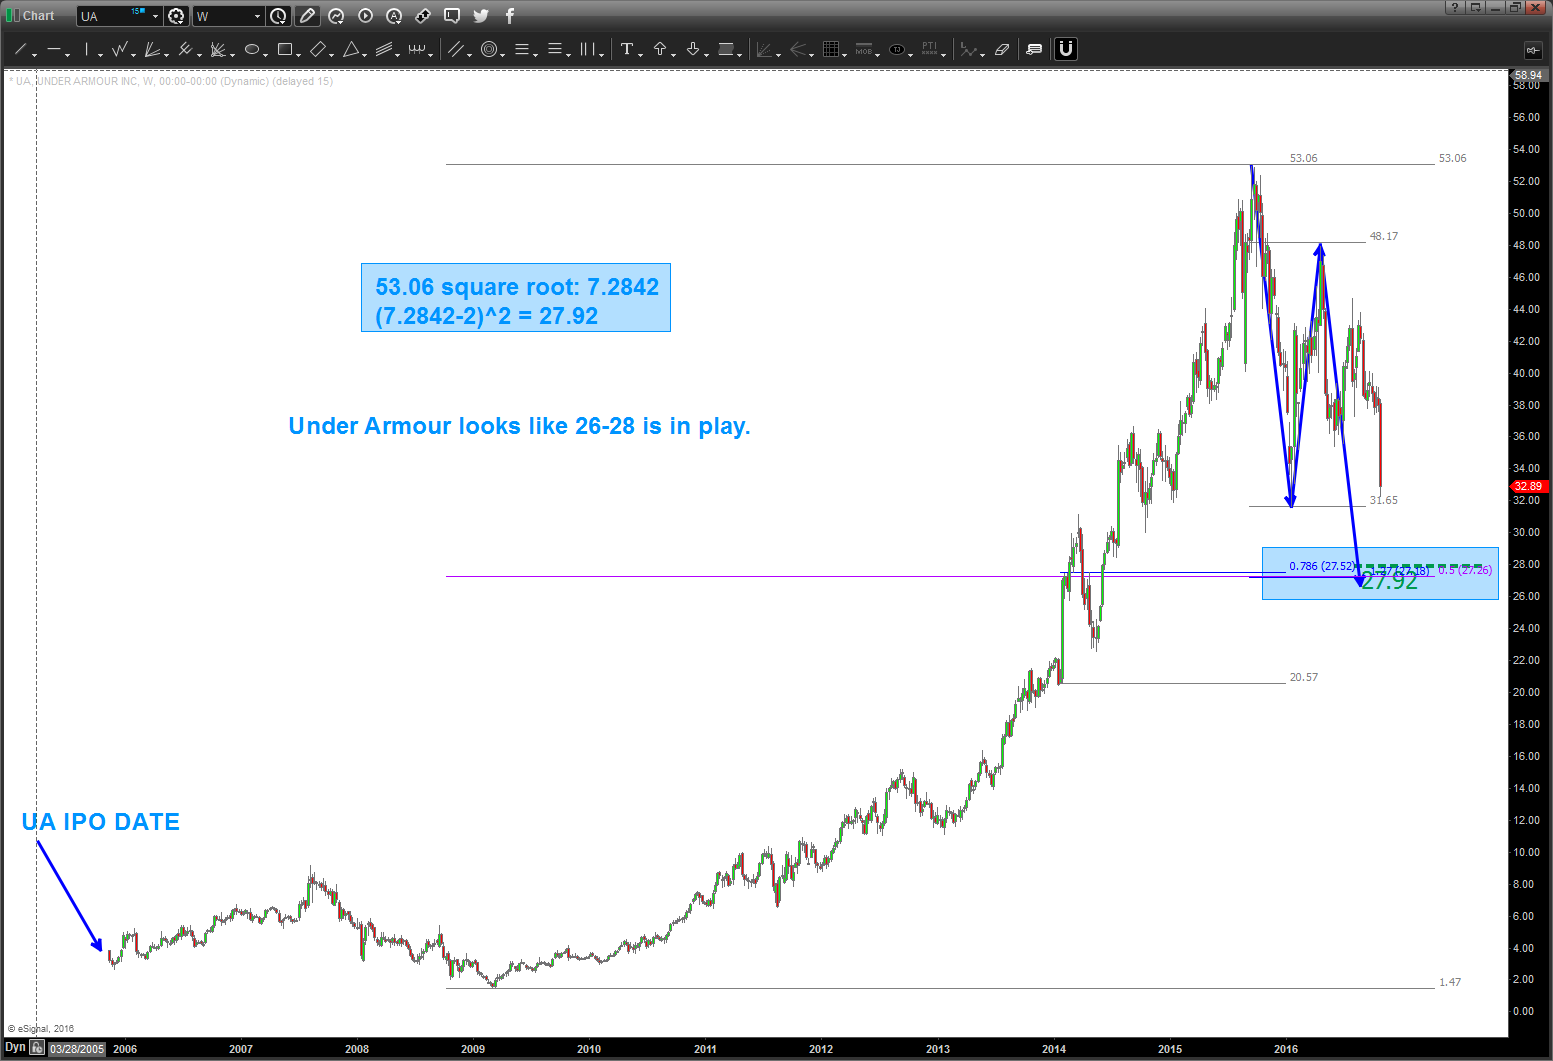
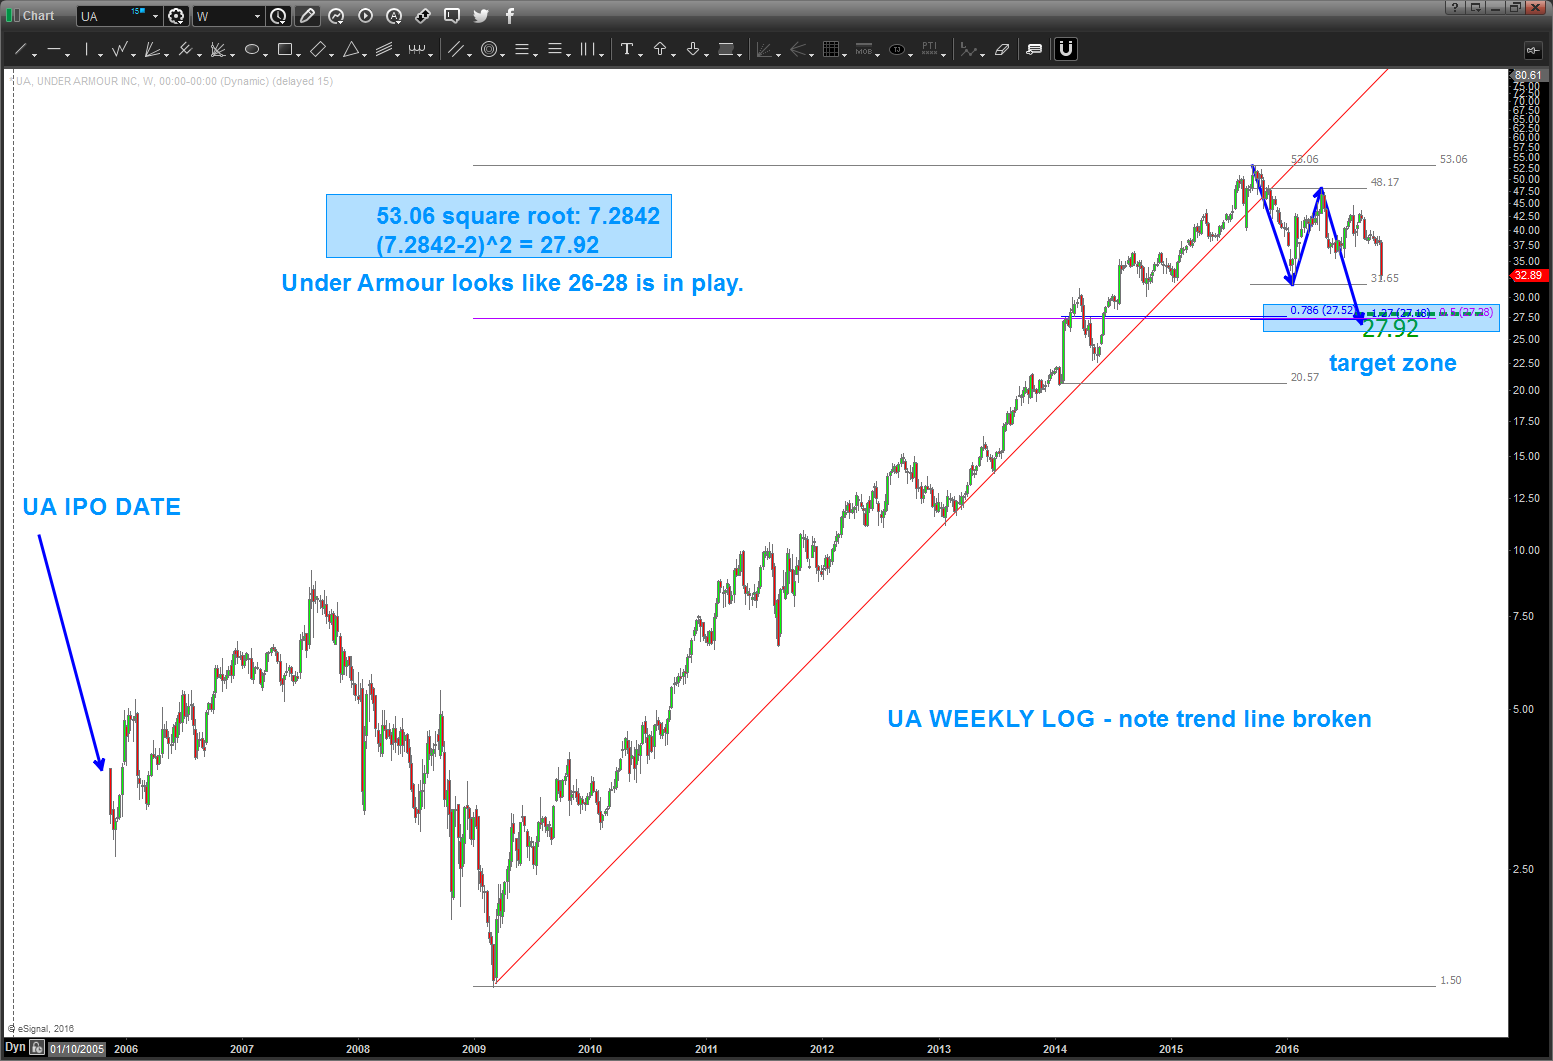
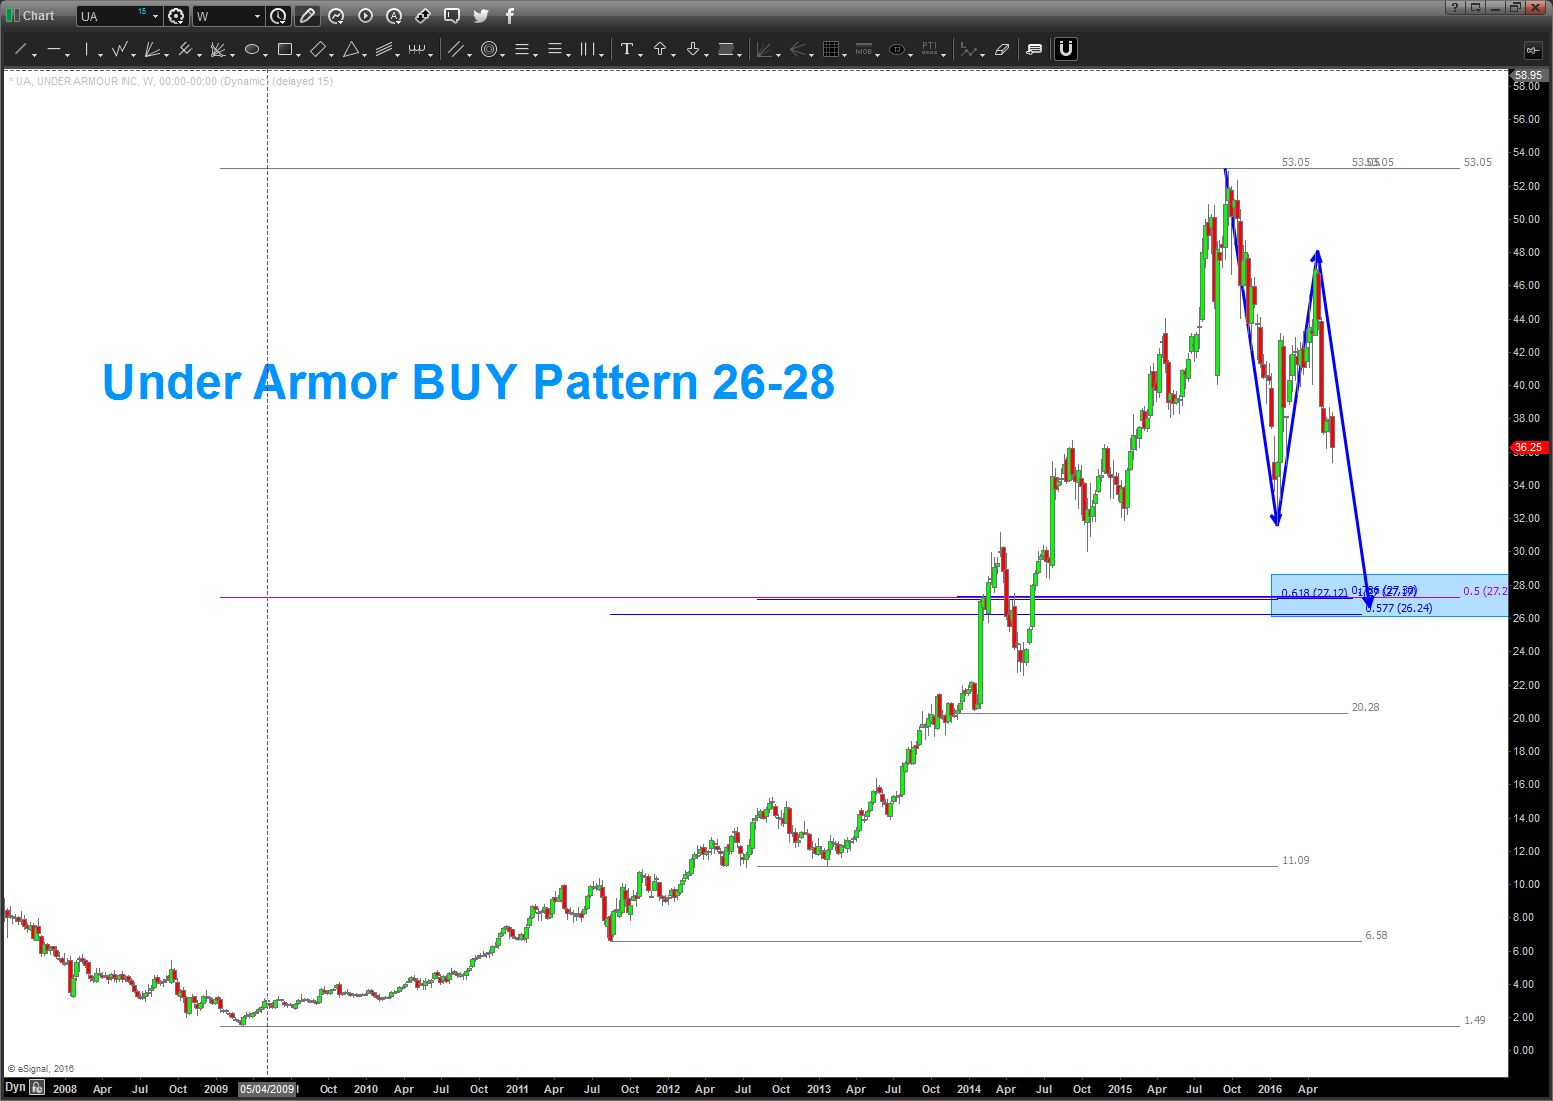
10/25/2016 – I was asked to take a look at Under Armour back in June. I saw this pattern – again – had ZERO idea if it would get down there. As a pattern recognition dude, that’s the pattern .. .as of today, appears it’s going to make that level. Some thoughts …
- this is the first ‘true’ BUY pattern since it’s IPO and after a spectacular and somewhat parabolic run.
- caution w/ the size of the candles coming down – that denotes thrust and patterns fail when huge thrusts hits the levels
- note the square root target hits – basically – right at the BUY pattern. That, my friends, is good.
- remember, the square root target is using the Gann Square of 9. One trip around the wheel is equal to the square root of the base number (in this case the high of 53.06) -2 and then resquared. That’s how it works …
- the second chart is a long term log look at UA. NOTE – it broke it’s fabulous run .. so, this selling pressure is expected. that’s what happens when long term log trend lines are broken.
- this pattern fails – IMHO – with a daily close below 25.
Loonie, OSX, Crude – time for another inflection? UPDATE
Posted on October 25, 2016 Leave a Comment
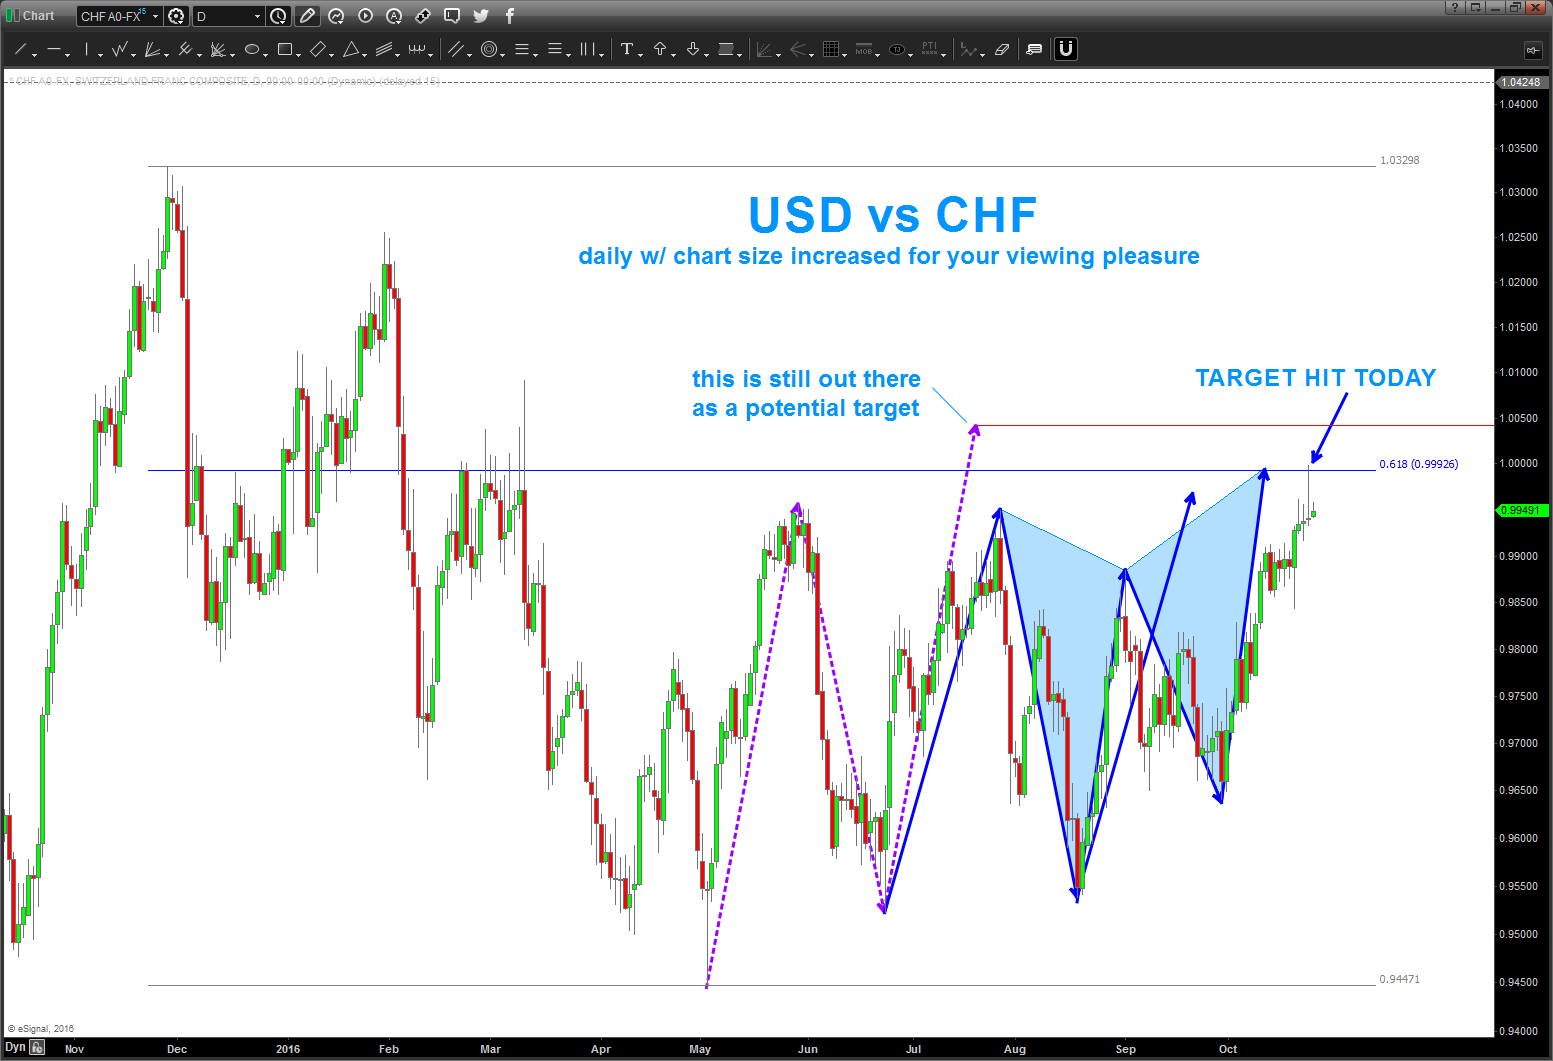
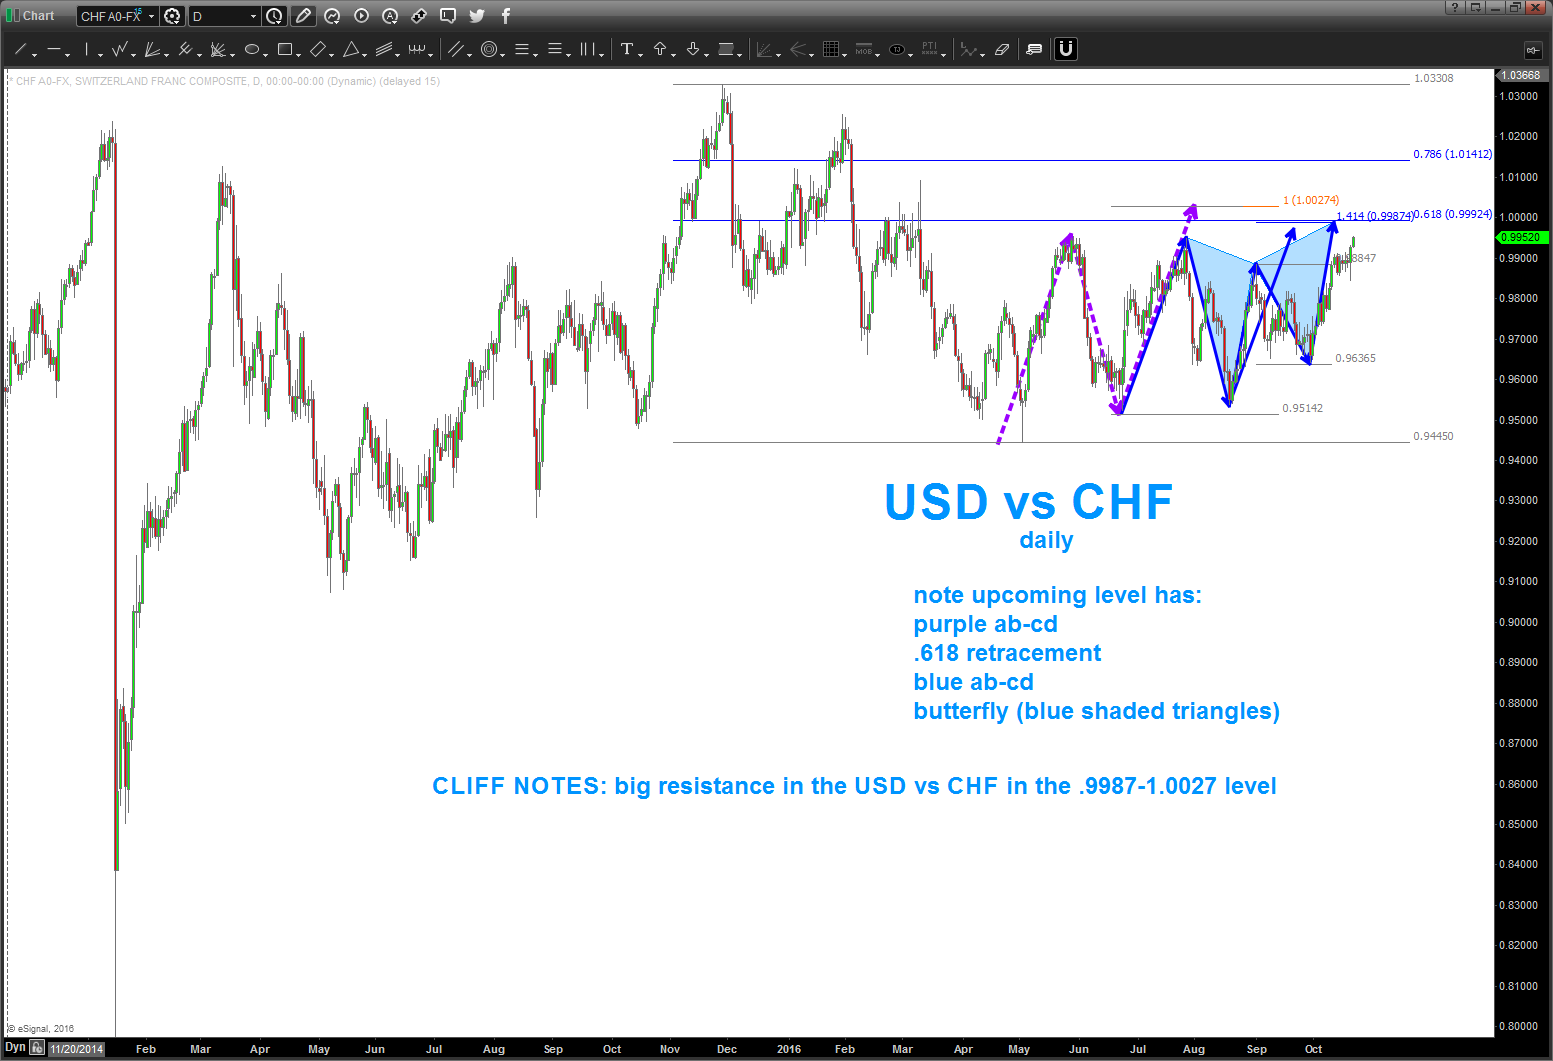
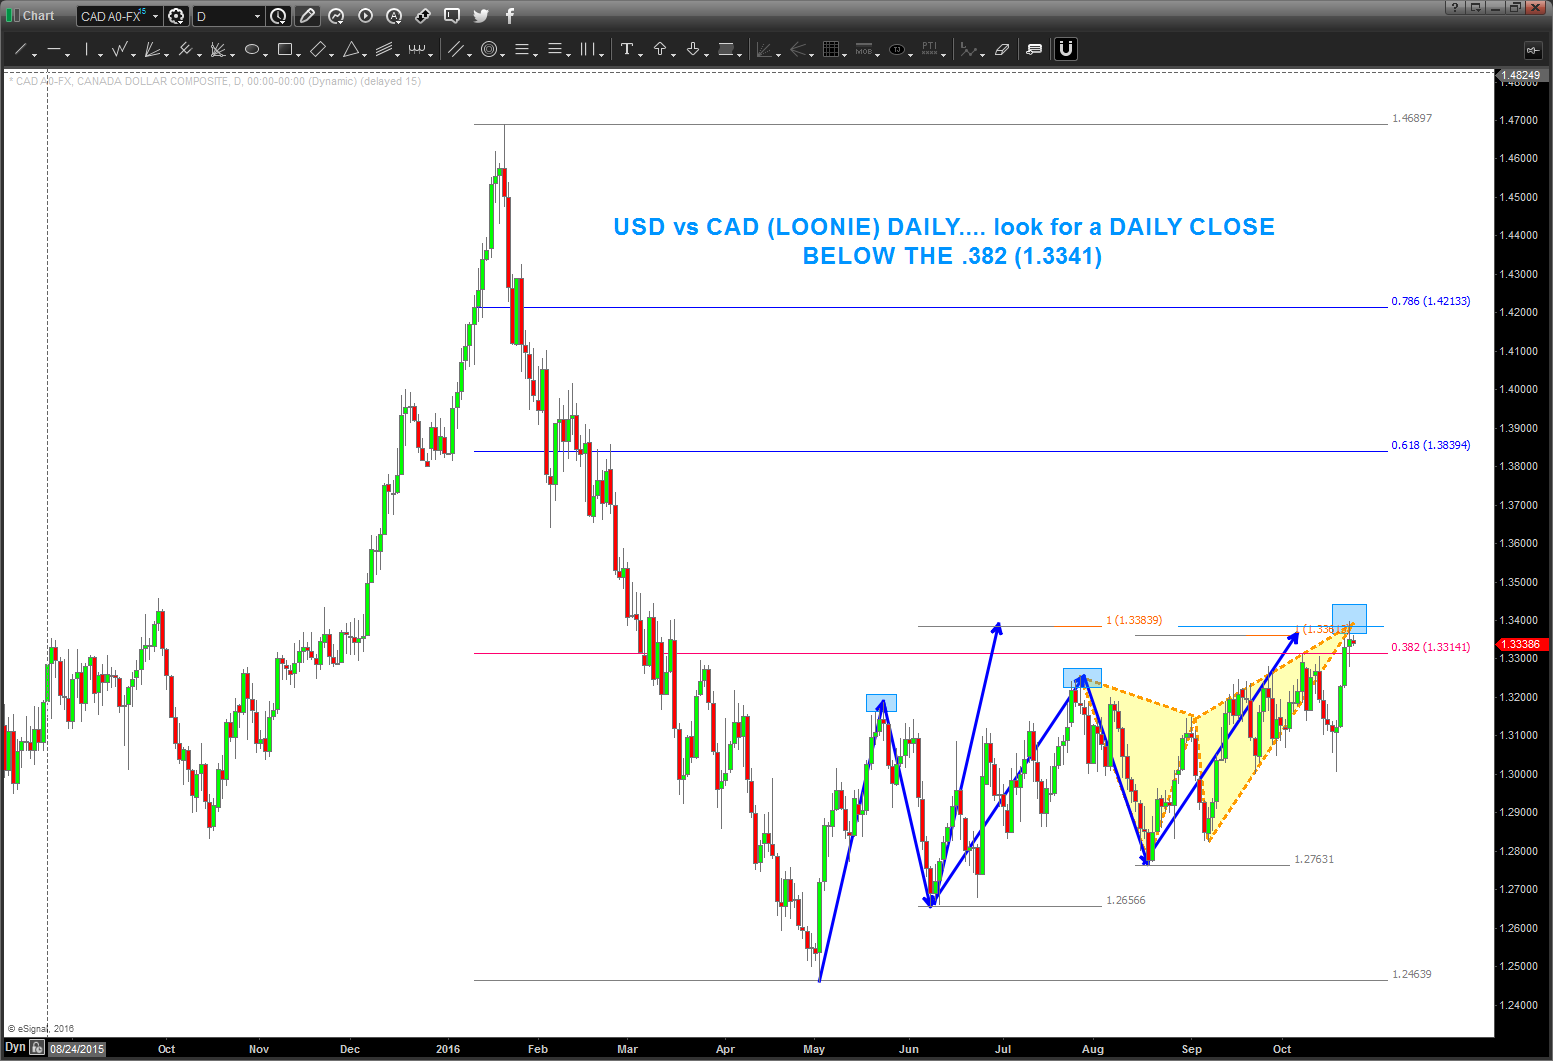
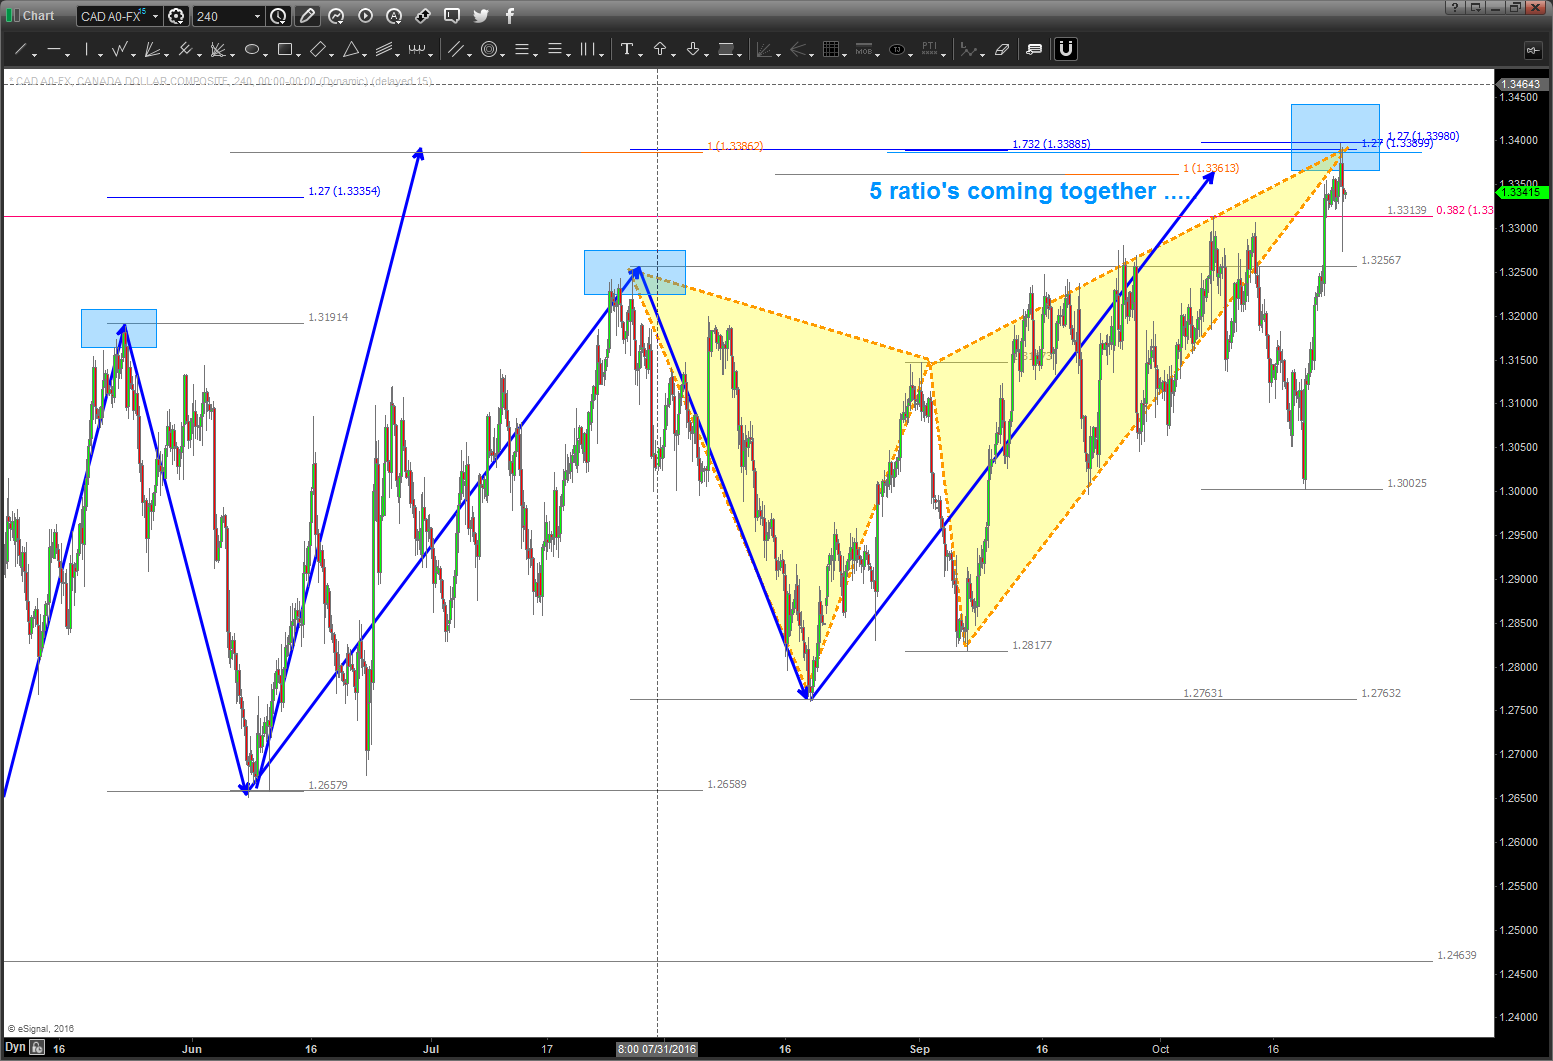
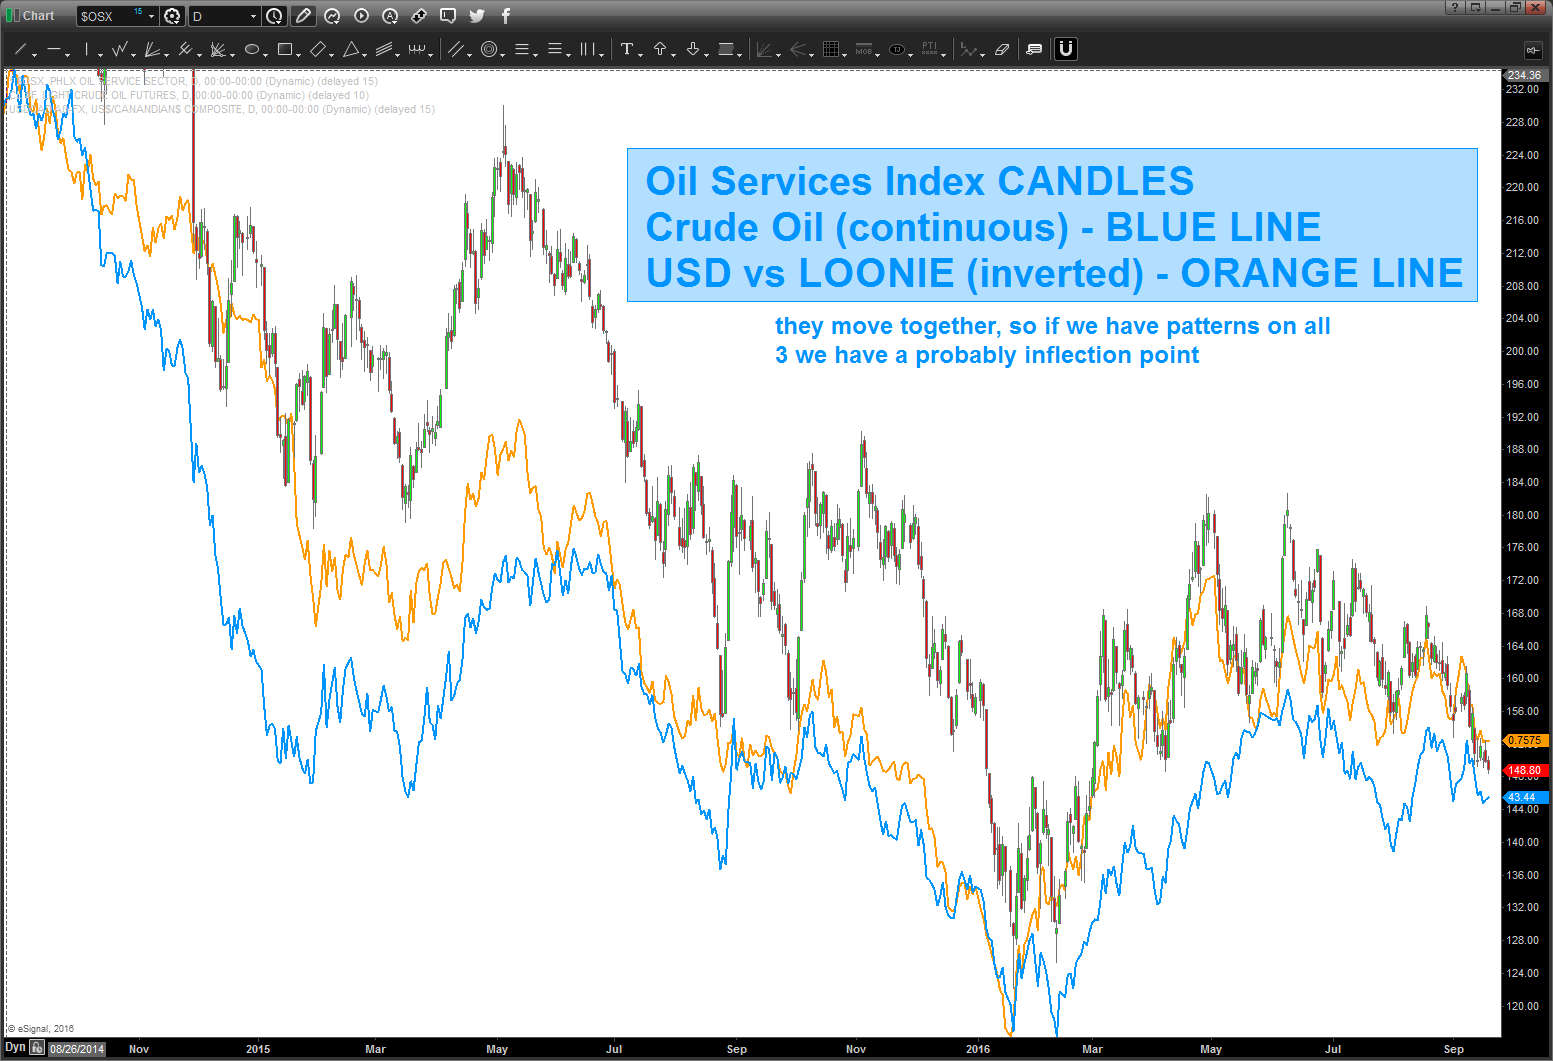
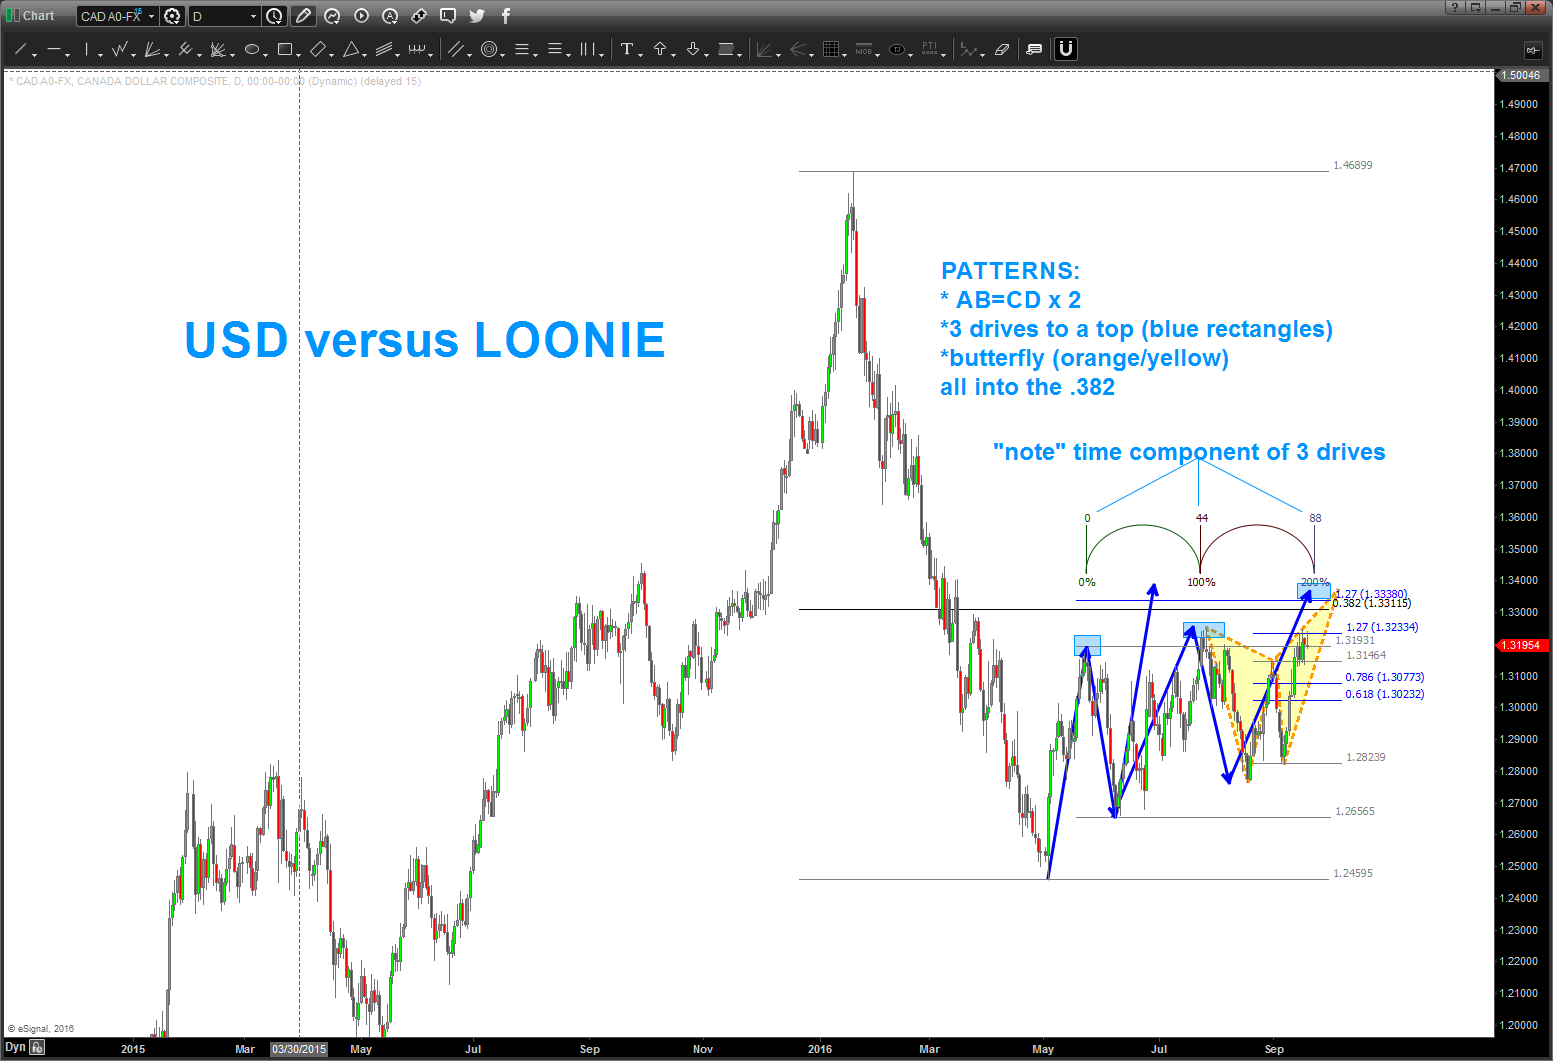
10/24/2016 – target hit on the USD vs LOONIE. Watch this one carefully. It “appears” that everyone is thinking of a big breakout but, as you can see, we had multiple targets coming into play and they were hit today.
WATCH FOR A DAILY CLOSE BACK BENEATH CHANNEL OR THE .382 as shown.
go ahead and follow this link if you want to follow some real time PATTERNS w/ technical analysis and the correlation between the 3 items in the subject line: https://bartscharts.com//?s=LOONIE
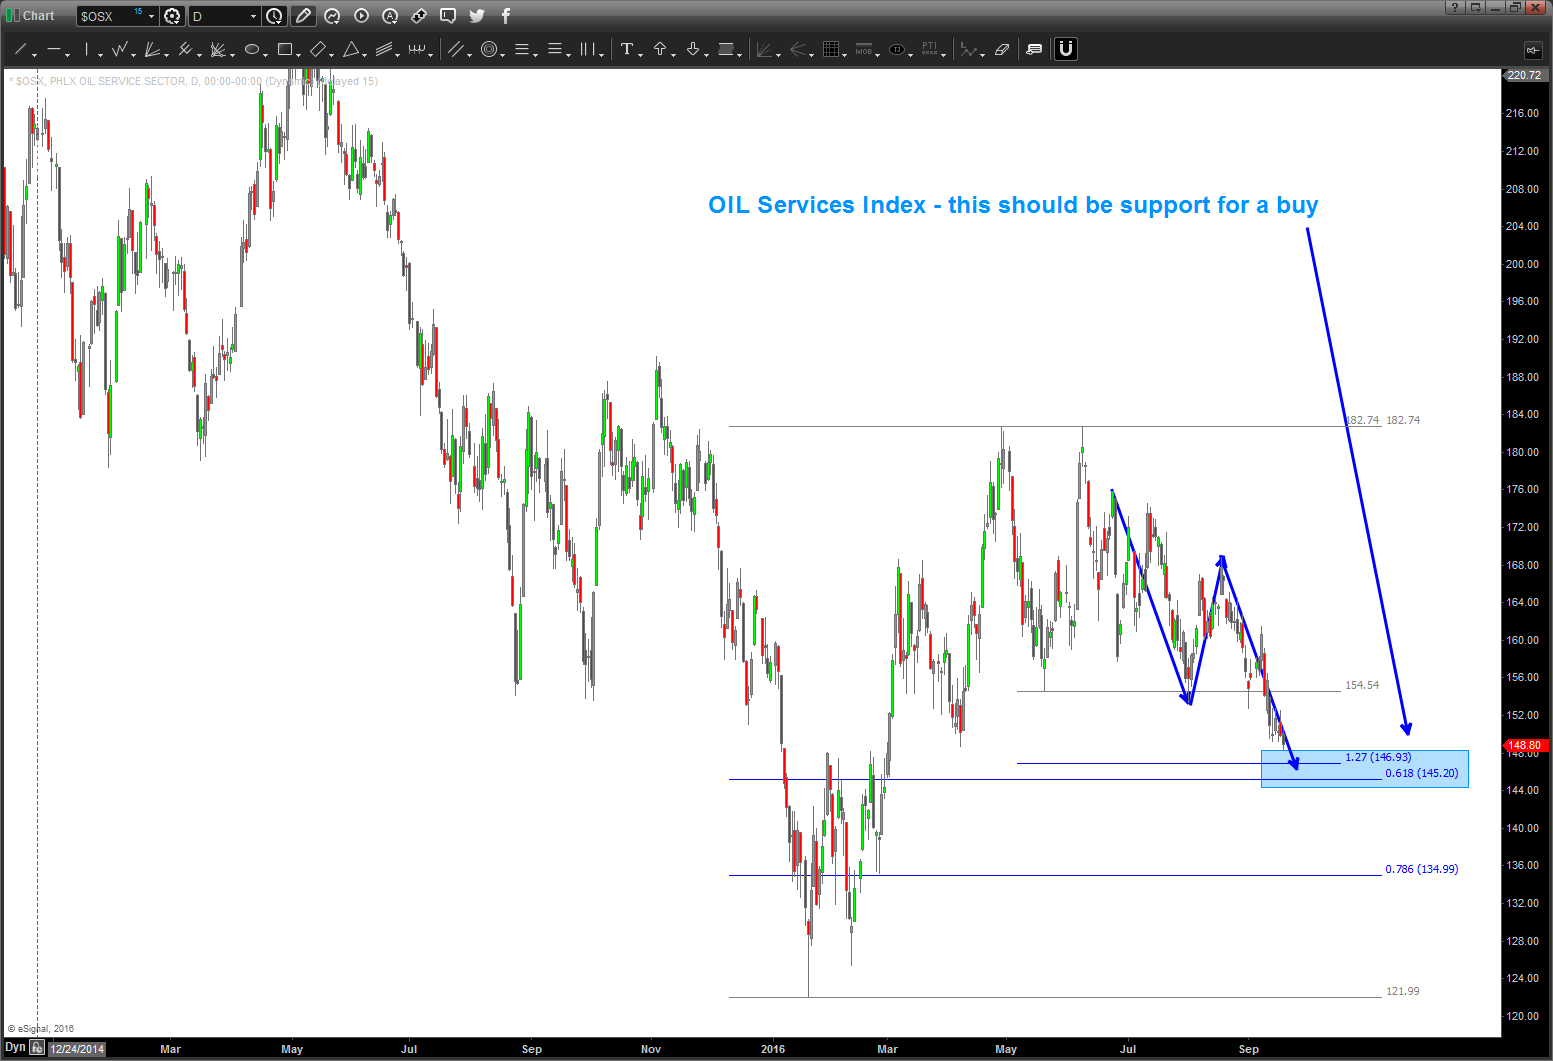
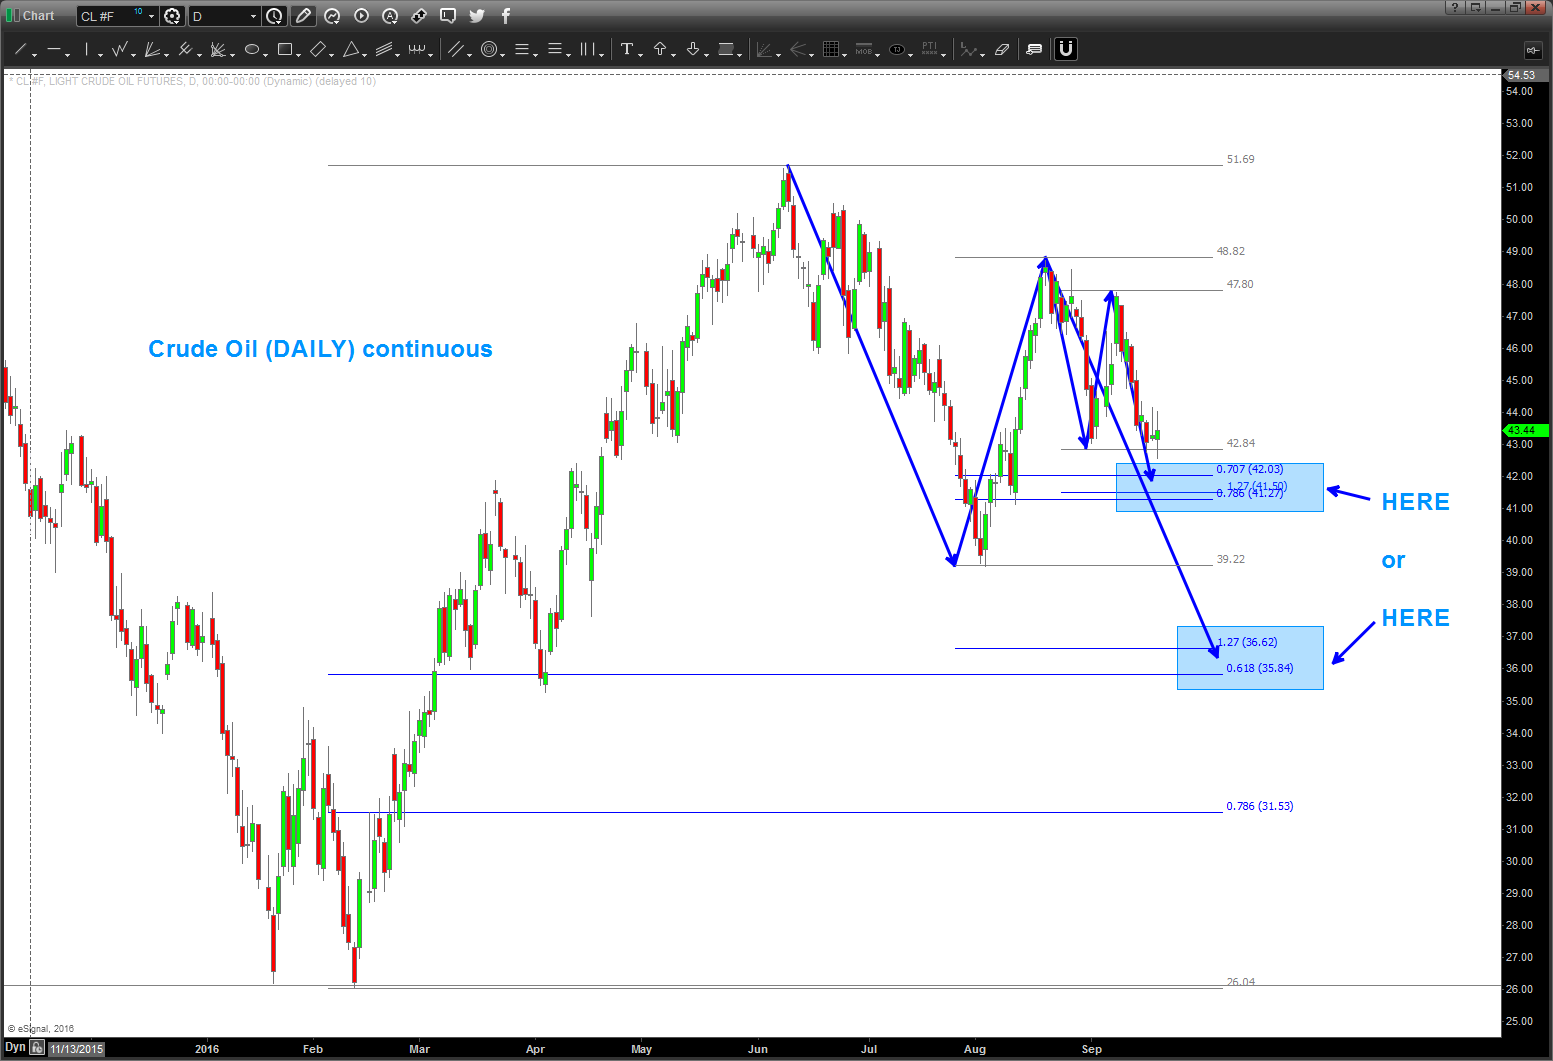
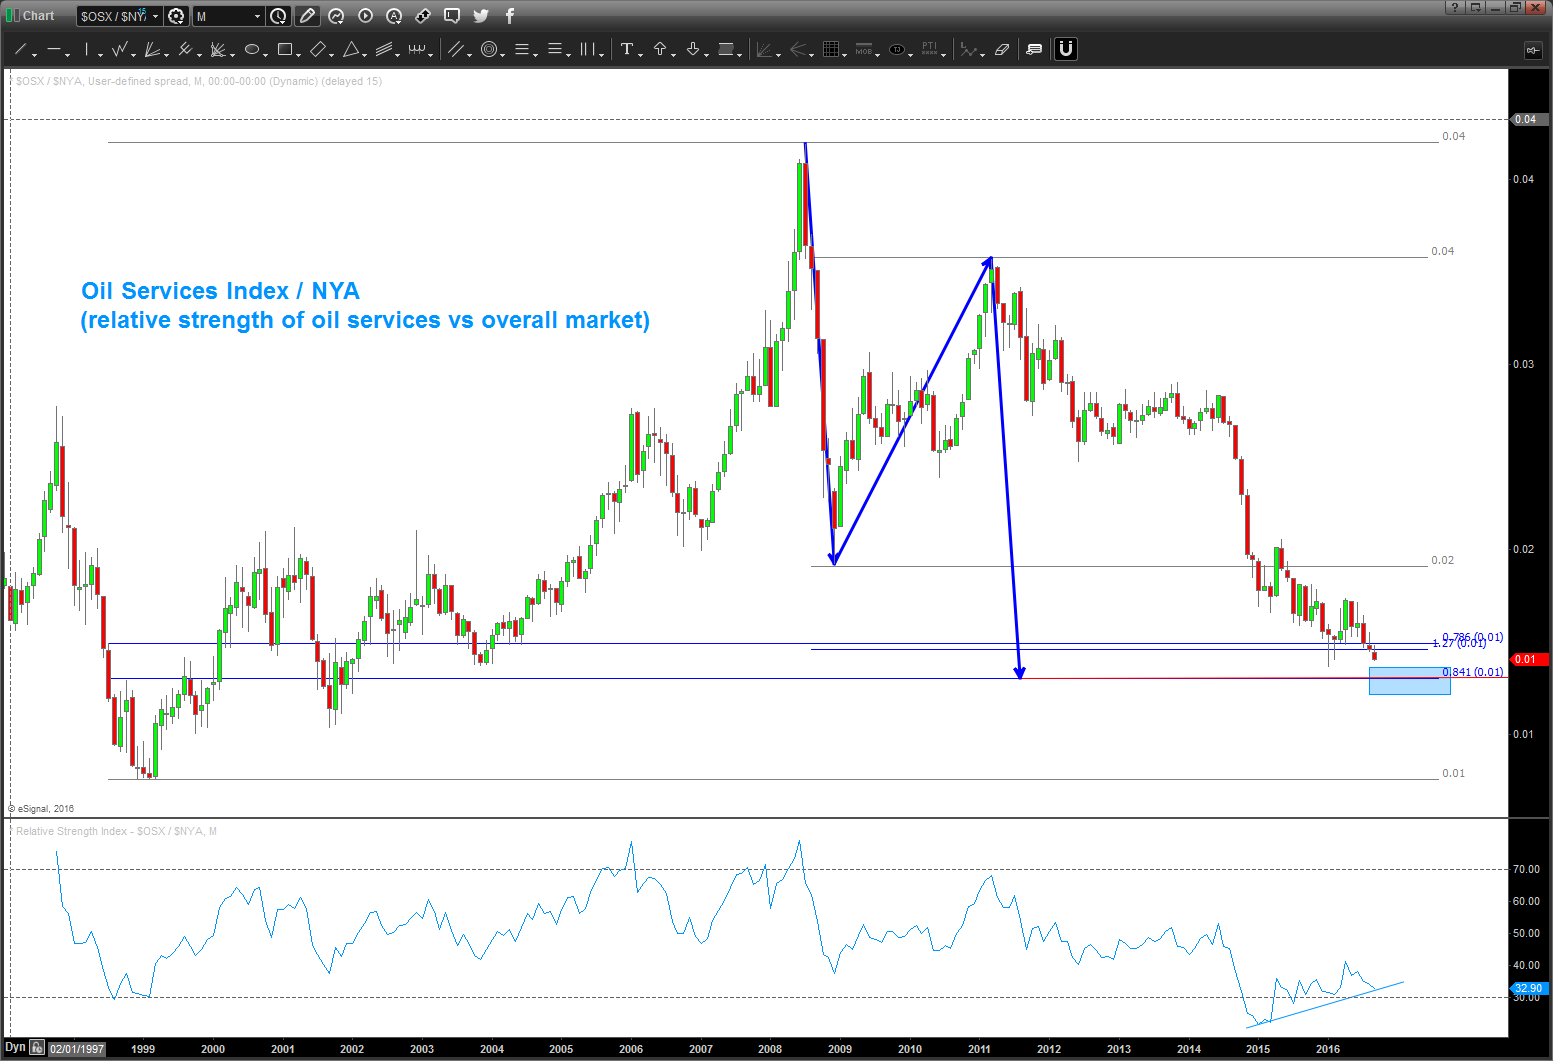
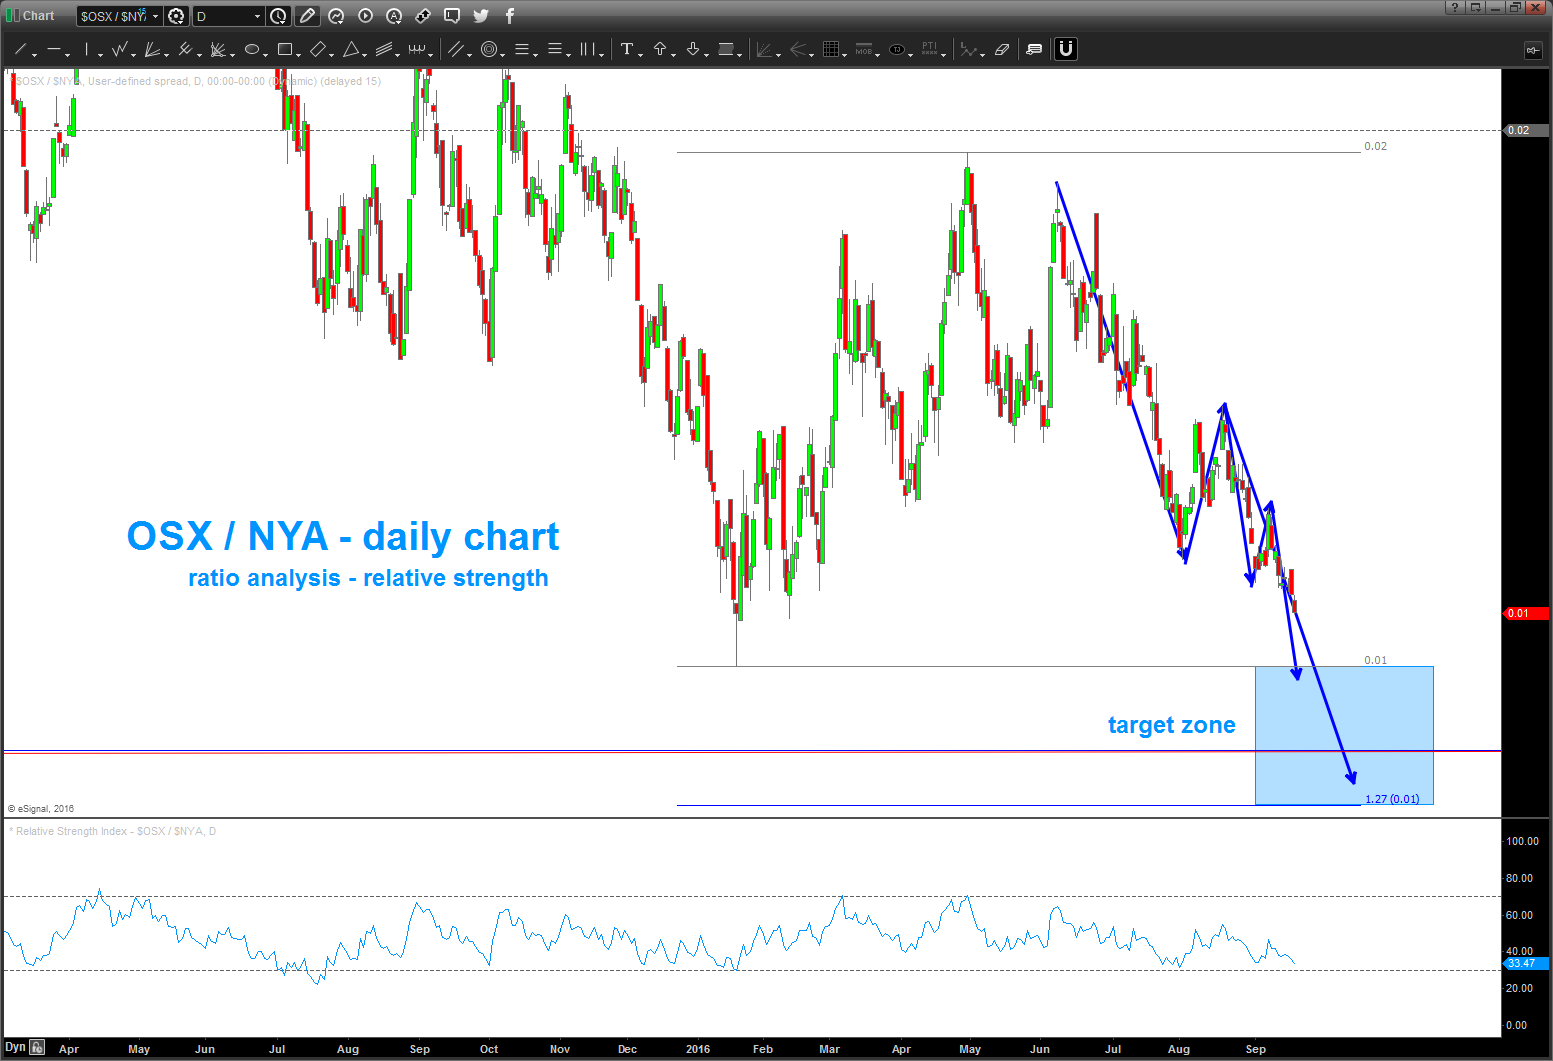
appears we are at another critical juncture:
- Crude – 2 buy patterns present.
- OSX – buy level indicated
- USD vs LOONIE – multiple patterns present for another move in LOONIE strength.
again, these are just patterns folks … but we have a very clearly defined demarcation line for the next move to begin.
stay tuned
Bart
charts below, let me know if you have any questions.
FXB
Posted on October 23, 2016 1 Comment
right now – WAIT – on FXB.
note, it like bullish divergence … i.e. price goes lower and the RSI rises.
believe we’ll find support in the 110-114 and 94-95. w/out bullish divergence would hold off, for now.
Bart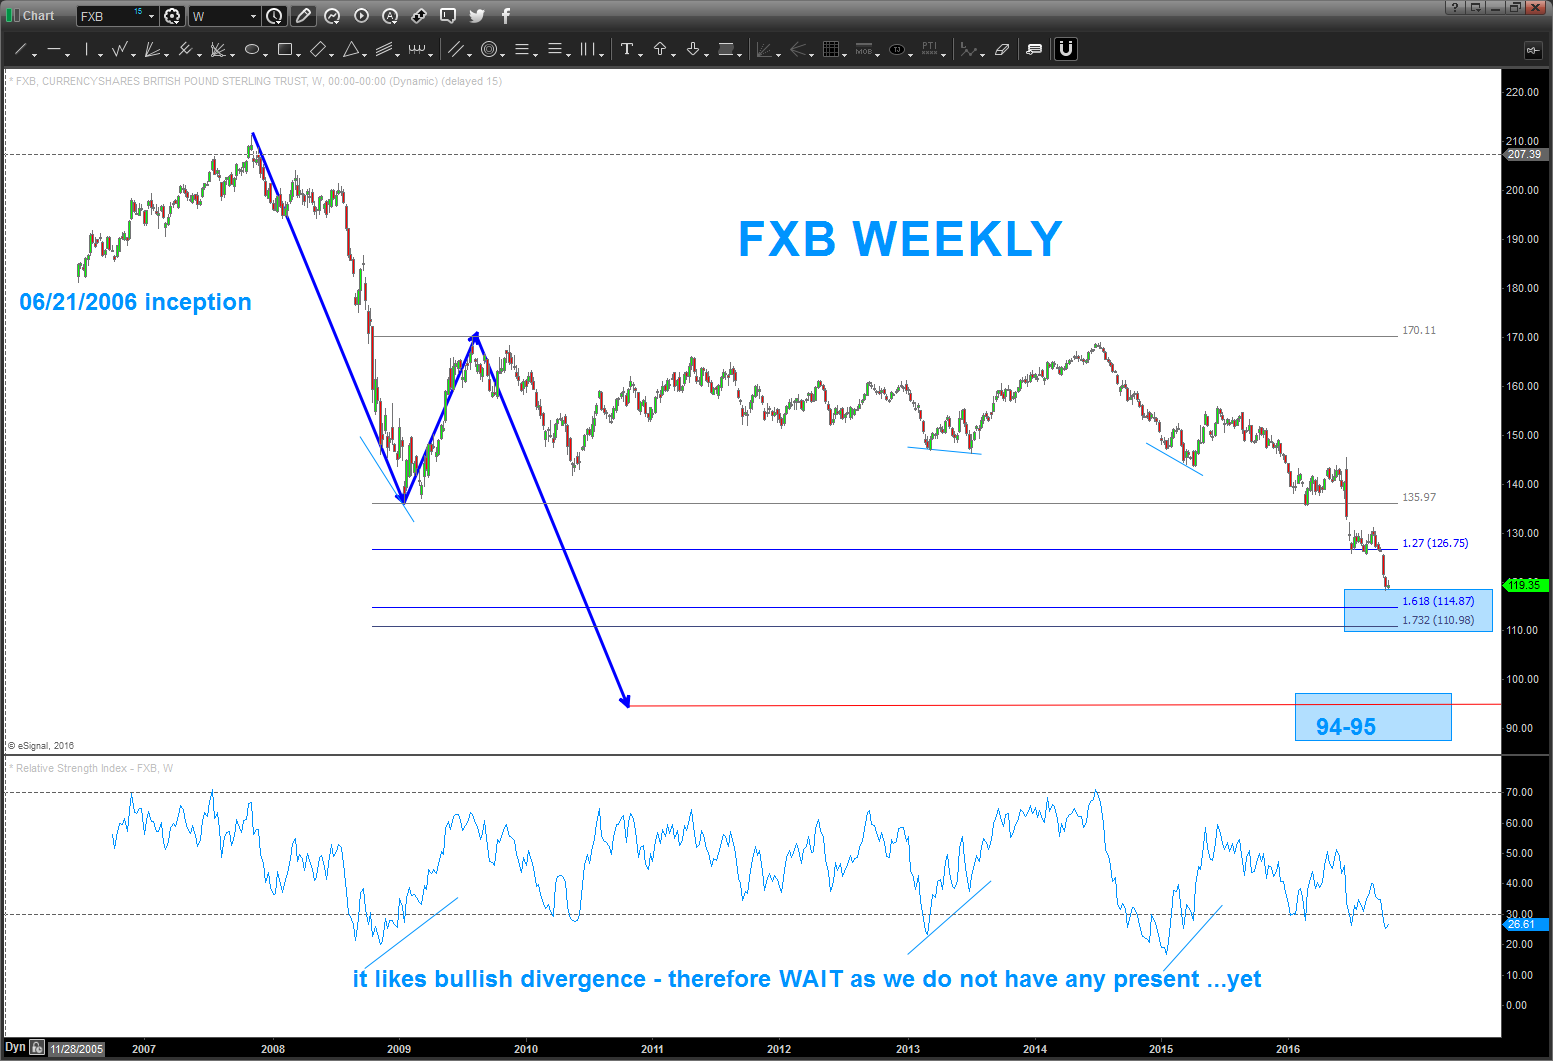
“With You …”
Posted on October 23, 2016 3 Comments
“how is paddleboarding?”
this entire trading journey has been one amazing adventure … it’s taught me so much about natural law, myself, my weakness, drawdowns, keeping investors, losing investors, making money, losing money, pitching in NYC, pitching in Texas, the River X Group, the GTA Group, the 3 BILLION DOLLAR LUNCH (yes, ask me about it) … man, what a ride.
but, as I was putting together a presentation for some people that I’ll do on a webinar, it came to me that – in fact – this is NATURAL LAW and everything is VIBRATION. PERIOD …it’s simply amazing this journey called LIFE.
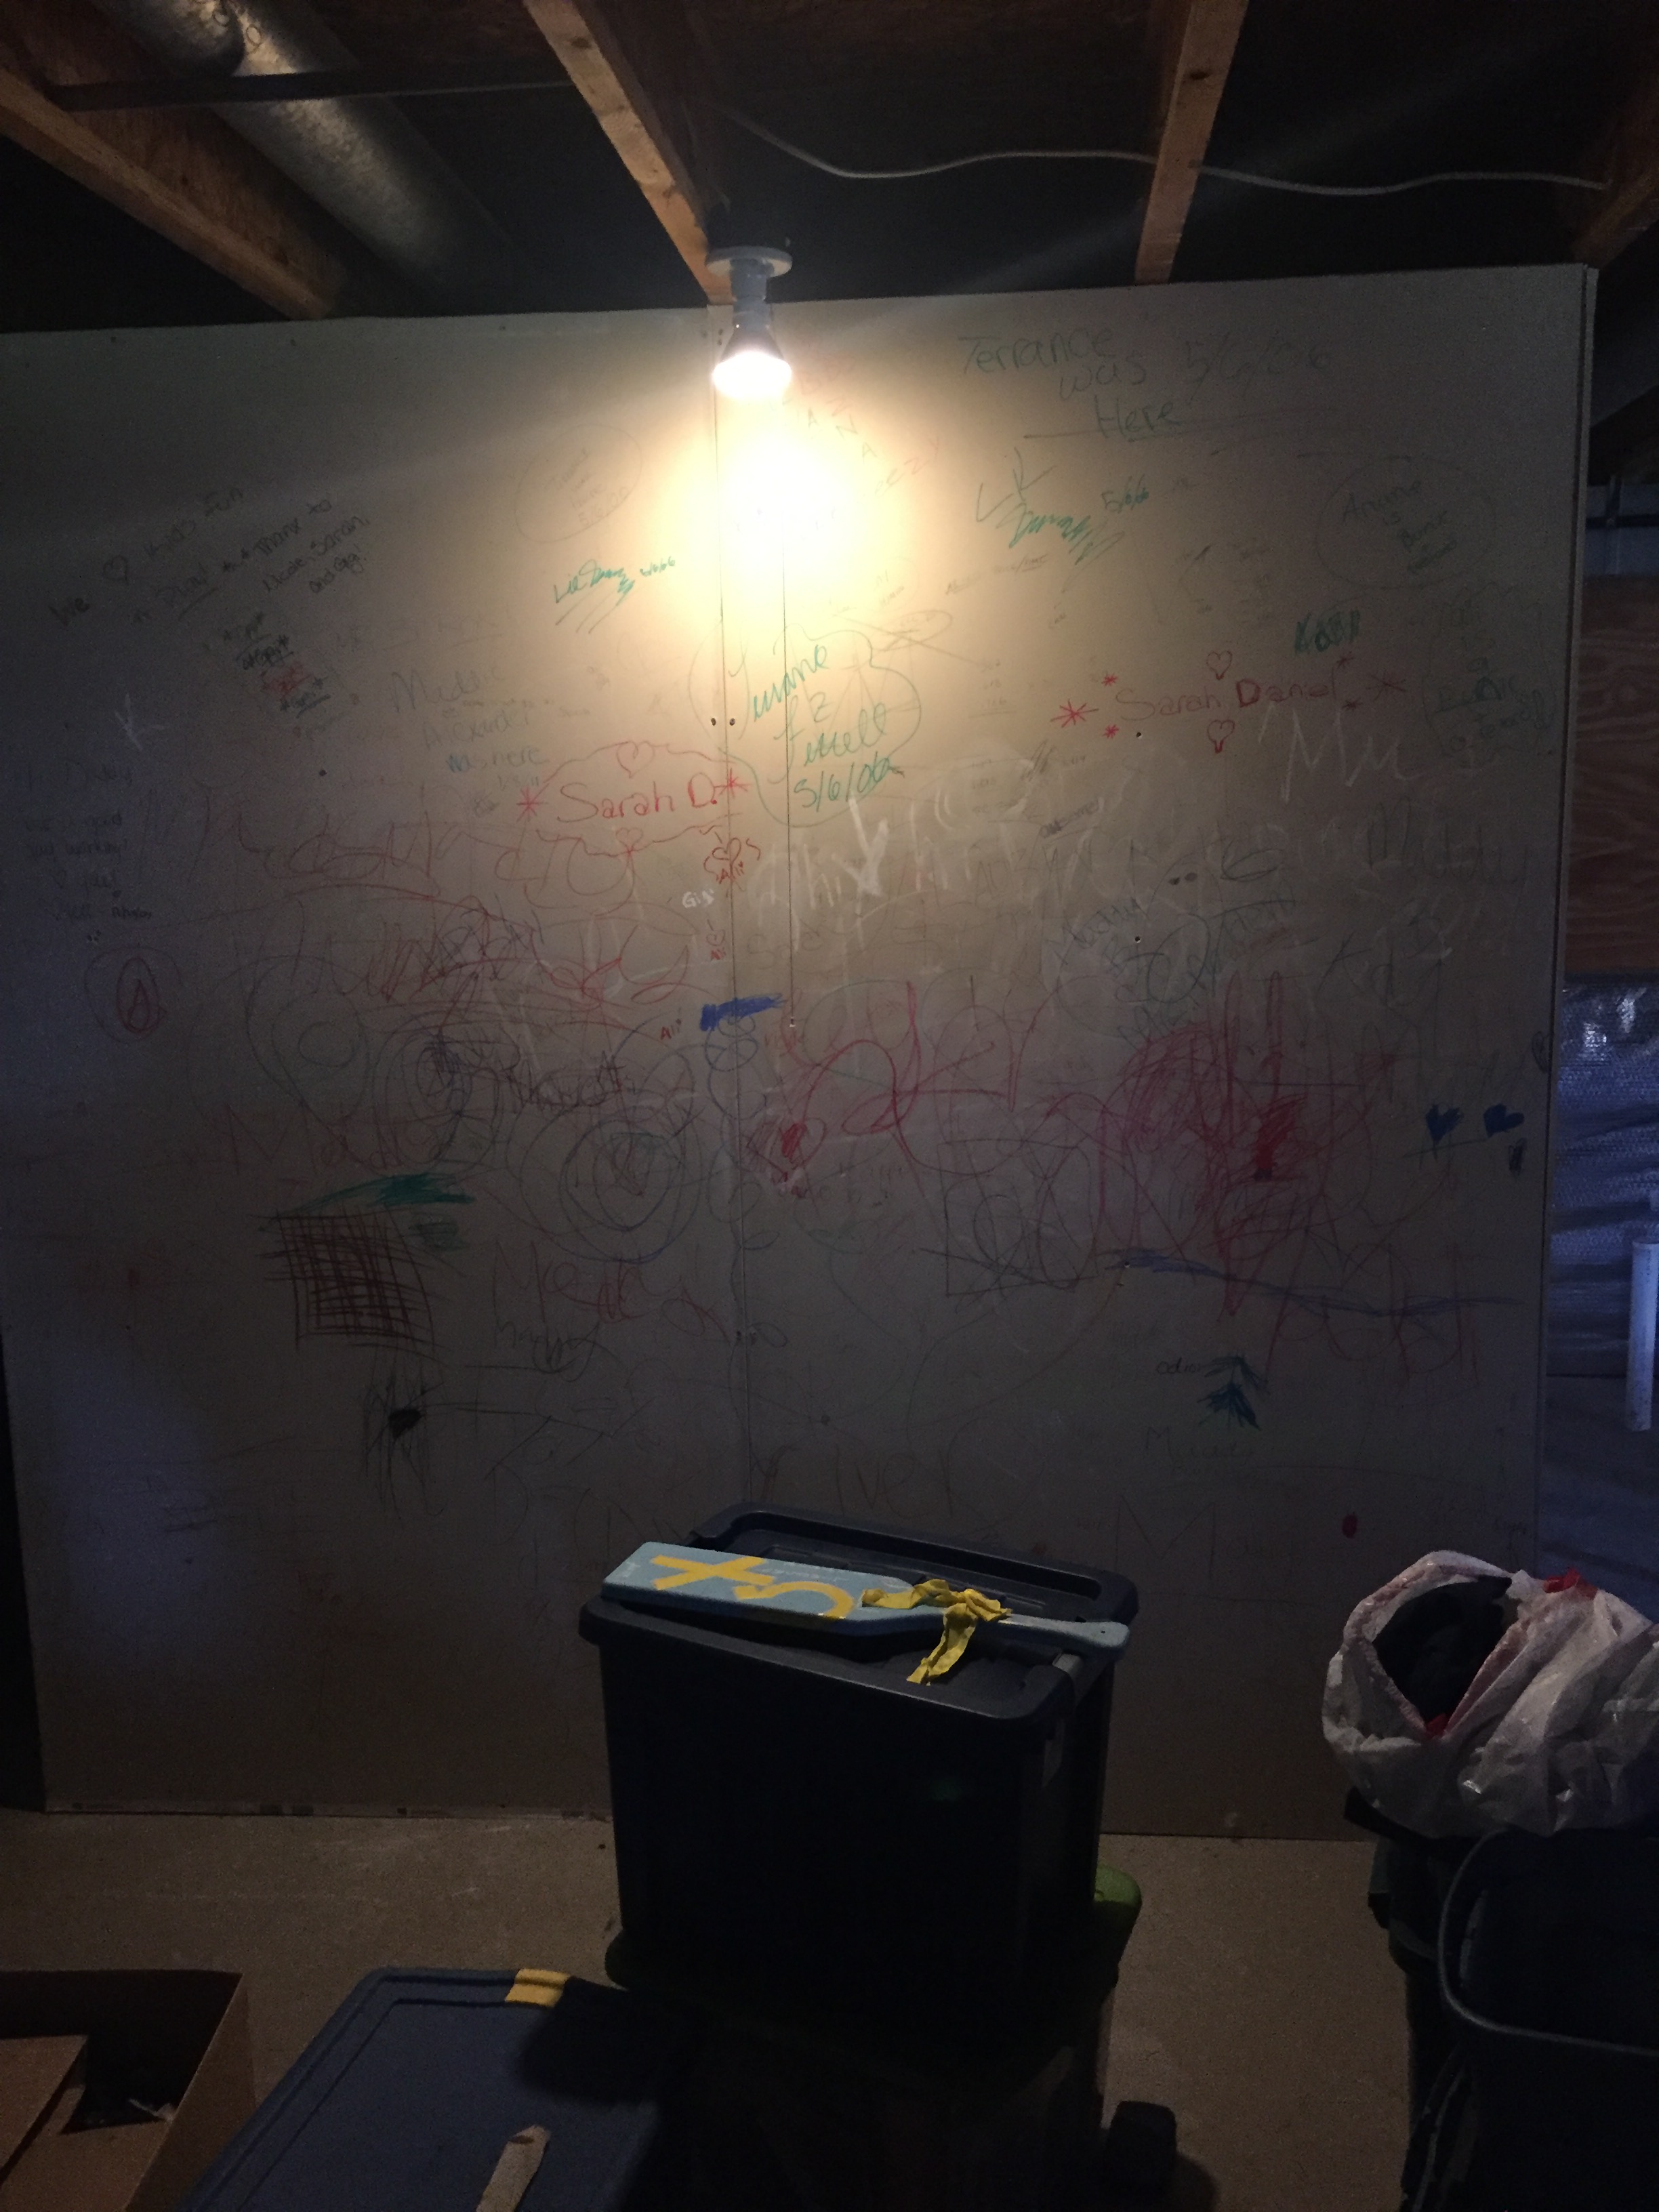
here’s where it all began for me … yes, an unfinished basement in Northern VA where I had my buddy Hose help me hang some drywall and some frames. it was a very dark corner of the house and I would go in there, put Pink Floyd on and just “figure it out.” My kids would write on the walls and have all kinds of fun w/ it .. didn’t even know they were behind me as I was so immersed in what? Immersed in understanding the meaning of life …there, I said it.
I learned, thru trading, two principles to being a successful “fill in the blank here” (hint: there is where you put trader)
- THERE IS ONLY LOVE
- THERE IS ONLY GOD.
NOBODY KNOWS when the journey around the sun will end physically…but in learning about vibrations, music and sacred geometry I’ve come to EXPERIENCE the other side and realize YOU will never end.
WITH YOU DUDE .. you know who you are and keep rolling and laughing and loving. OK?
I AM
Bart

MSFT Microsoft
Posted on October 20, 2016 Leave a Comment
10/20/2016 – it’s hard being a musical chartist. inherently you find yourself a contrarian (which you really aren’t) because you just see patterns and music and harmony w/ form, balance and proportion. yes, I get it, MSFT is all the rage because it got to new time highs. but who was ‘talking’ about it when it was about to complete an EXACT pattern based on music and geometry (see below) in/around 13-14 dollars. nobody …also, note, the chart below showing the BUY was “real time” in that, as my faithful readers know, I try really hard to not “should have” or “would have” or “could have” on the chart ….
so, w/ the monster gap up to new highs that opens up the 72-74 area for the next pattern.

note the strength in MSFT .. .618 from Monthly charts (projections) usually cause more resistance.
enjoy.
Bart
Here is the BUY on MSFT – some amazing harmony, form, proportion and balance. Just take one second and look at that chart … no idea what is going on w/ their fundamentals and, it was quite the “crazy” time for it to find support during the 2009 thump. But … a PATTERN is a PATTERN is a PATTERN. so, here’s the BUY on MSFT issued in March 2009.
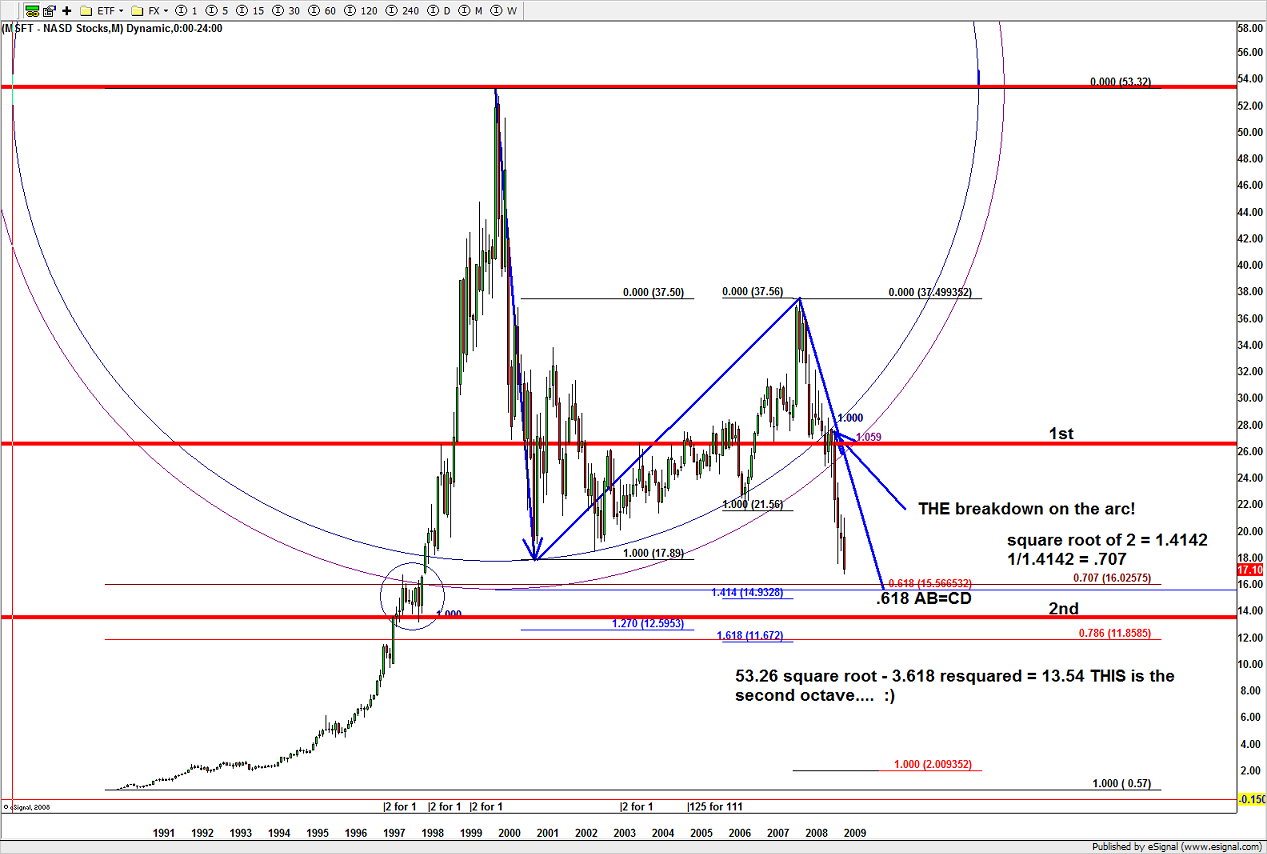
BUY on MSFT in March 2009
so, where are we now?
we are approaching the .618 from the all time high on decreasing volume and an overall market that “should” be correcting. Time to take some off and get ready for the next wave …in my humble opinion. (note – 50-52 is still a target.)
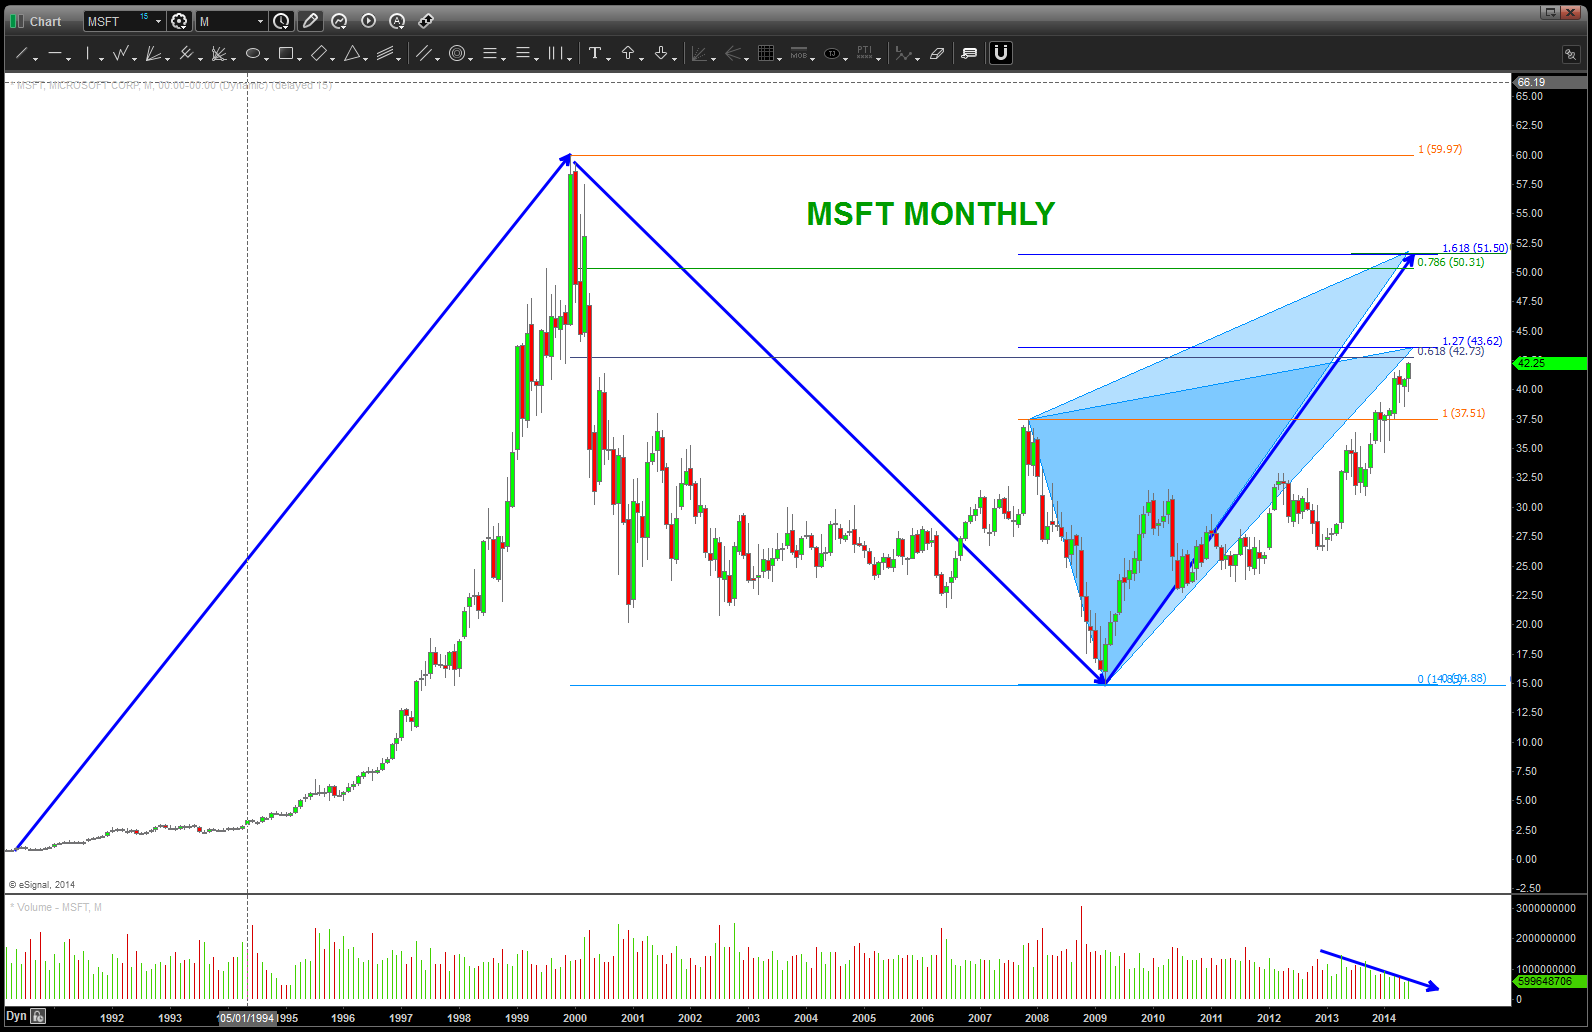
MSFT approaching resistance zones – watch closely or take some off the table
TWTR update as of July 21, 2018
Posted on October 19, 2016 Leave a Comment
7/21/2018 – FWIW, got a new paddle and it rocks. spent time yesterday in the water paddling w/ a buddy up near Dana Point CA. most epic …
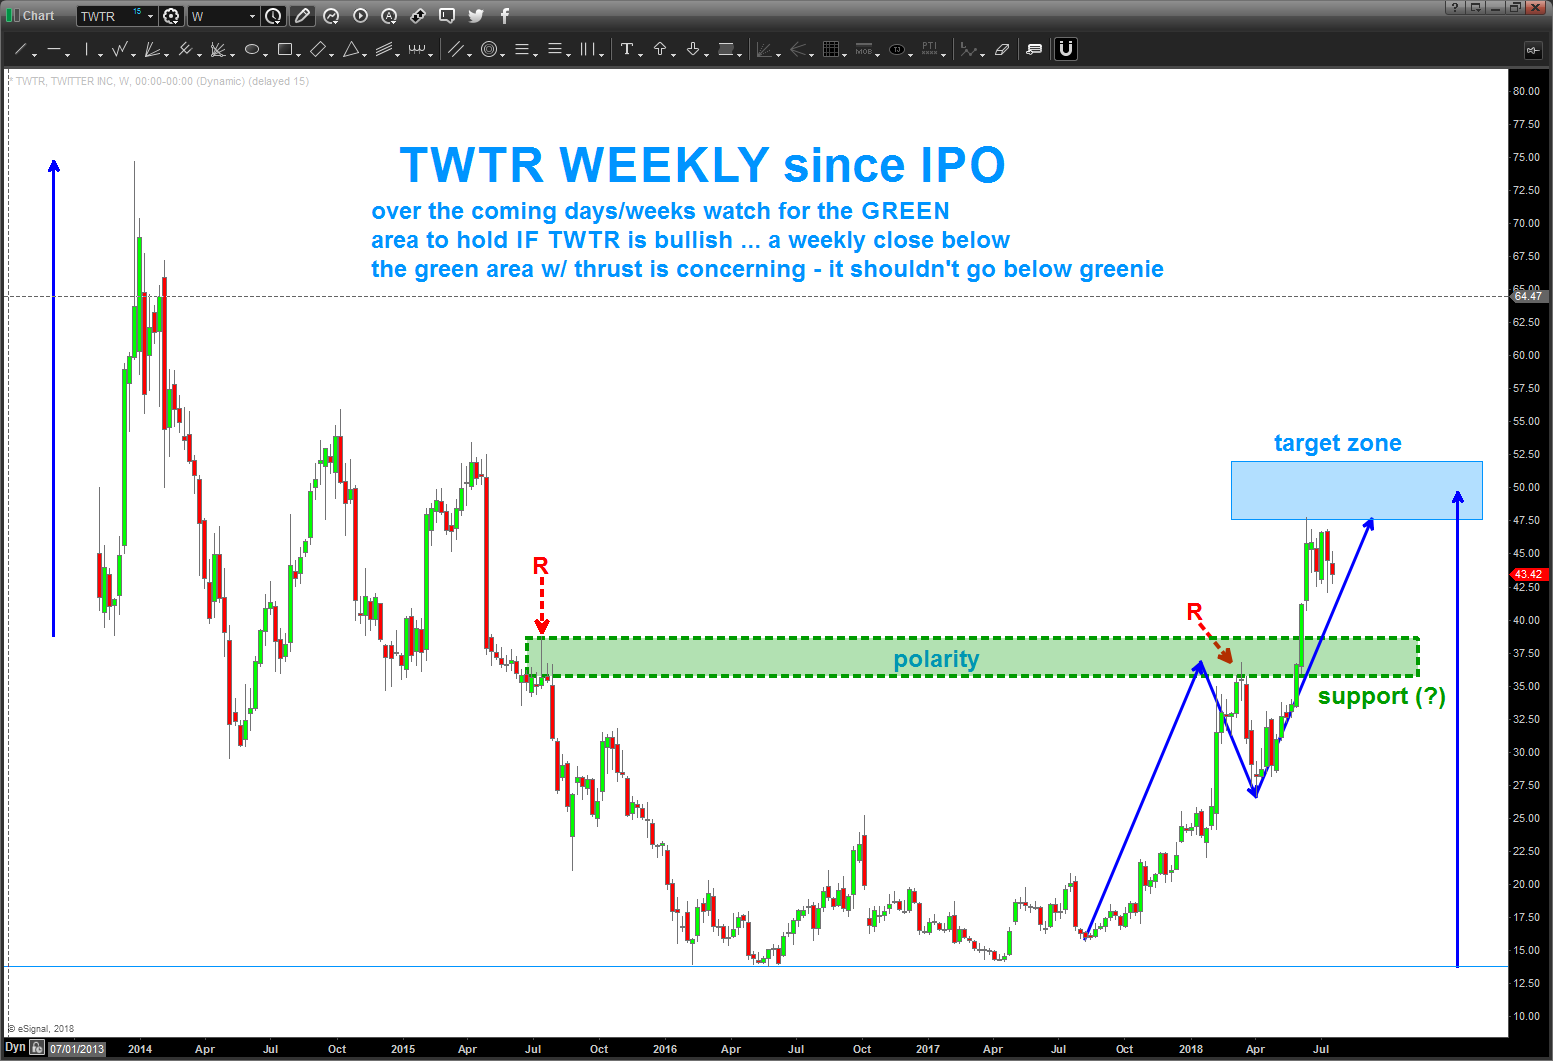
anyhoo, as you read below we have hit the lower end of the target area. take a second and think about it – roughly a month ago we came up w/ targets for the price to respect. NOTHING about fundamentals – all patterns, measured move and blah blah. TWTR went up and tagged em’ and looks heavy …
so, IF still a BULL (I’m neither a BULL or a BEAR – just a pattern dude) then the highlighted green area below SHOULD hold (think polarity principle) and TWTR SHOULD start another leg up in/around that area. If we get a weekly close below the lower area, i would start thinking of cutting it or lightning the long position.
enjoy, get out in the water …
Bart
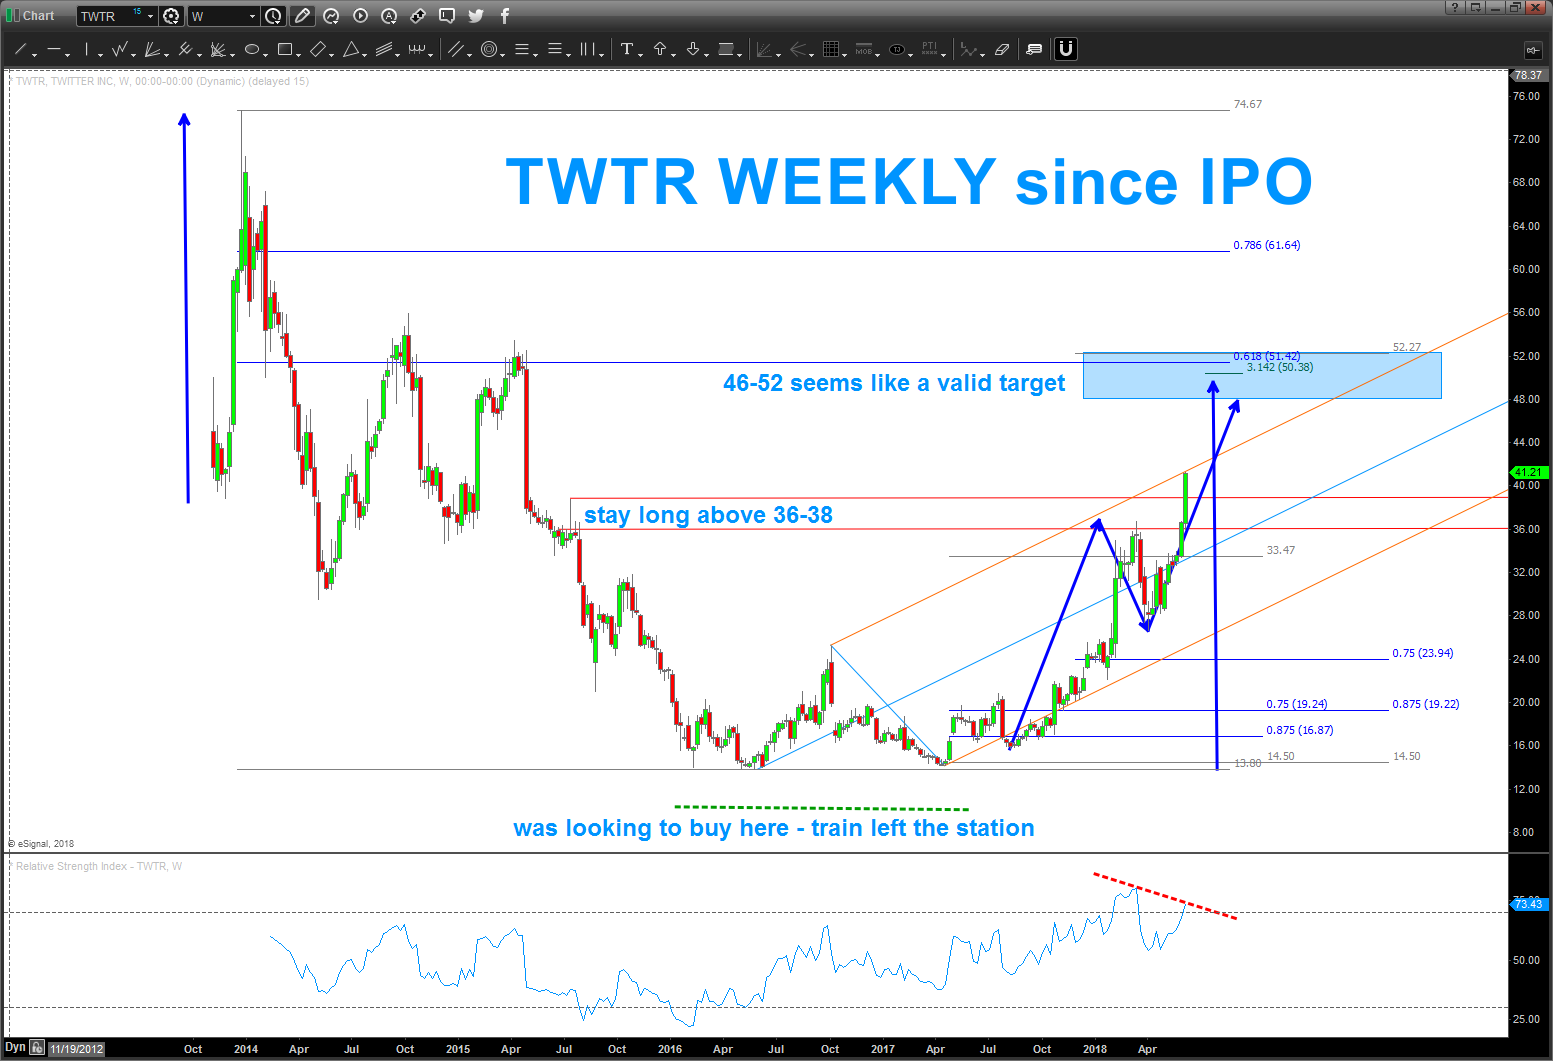
06/09/2018 – train left the station on me for TWTR. never reached the $10 ish pattern level. Oh well, “better to be out of the market wishing you were in than in the market and wishing you were out …”
for those long this puppy we have a VERY strong target zone of 46-52.
using some polarity, would stay long into this zone as long as we don’t break down below 36-38 on a weekly closing basis.
TWTR got the Trump Bump I guess … LOL (just making a joke folks, no need for any chaotic political commentary.
Off to surf … w/ a sub par paddle. Snapped my good one last night for a sunset paddle … bummer.
Bart
________________________________________________________________________________________________________________________________________________________
10/18/2016 -if you have read my blog, you know that I really don’t have a clue about the fundamentals or anything like that. pure patterns, all the time.
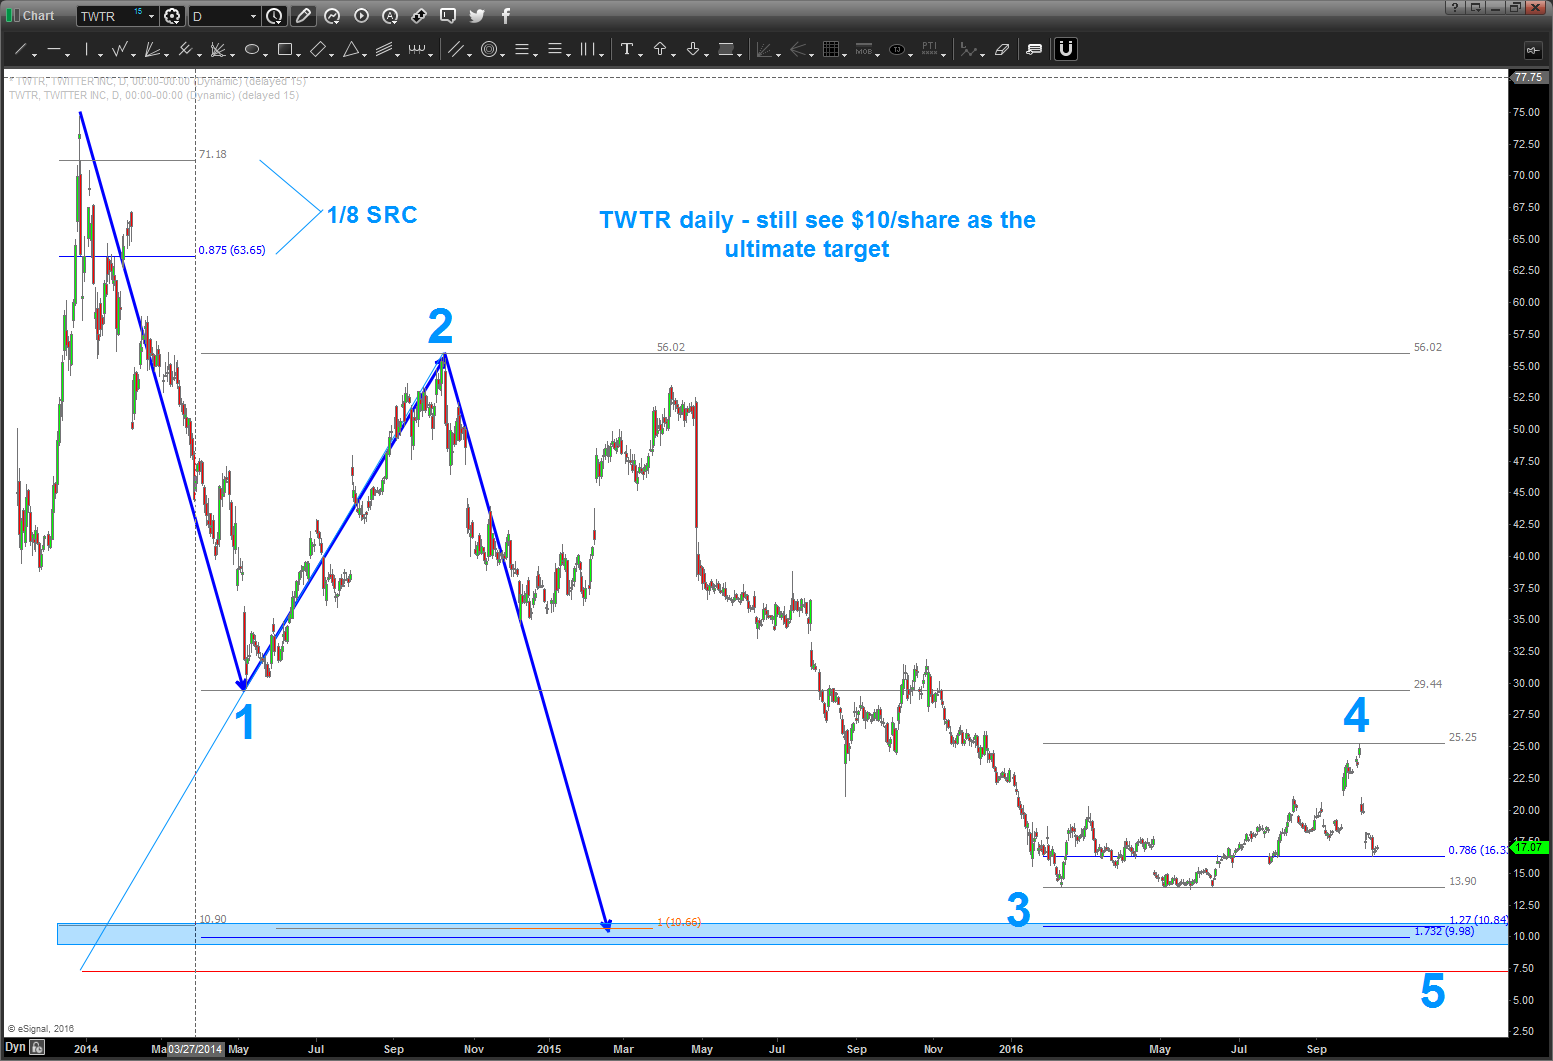
I’ve been doing work on TWTR (just search for TWTR in the search on my blog) and you can see that the 10 area was the long term target. when it got down to about 13 and took off I was like “oh well, didn’t hit the pattern, so next.”
but something happened and now we are resting on the .786 . if that breaks to the downside then it appears ready to perhaps go towards the pattern in/around 9-10.
stay tuned …
B