MSFT Microsoft
10/20/2016 – it’s hard being a musical chartist. inherently you find yourself a contrarian (which you really aren’t) because you just see patterns and music and harmony w/ form, balance and proportion. yes, I get it, MSFT is all the rage because it got to new time highs. but who was ‘talking’ about it when it was about to complete an EXACT pattern based on music and geometry (see below) in/around 13-14 dollars. nobody …also, note, the chart below showing the BUY was “real time” in that, as my faithful readers know, I try really hard to not “should have” or “would have” or “could have” on the chart ….
so, w/ the monster gap up to new highs that opens up the 72-74 area for the next pattern.

note the strength in MSFT .. .618 from Monthly charts (projections) usually cause more resistance.
enjoy.
Bart
Here is the BUY on MSFT – some amazing harmony, form, proportion and balance. Just take one second and look at that chart … no idea what is going on w/ their fundamentals and, it was quite the “crazy” time for it to find support during the 2009 thump. But … a PATTERN is a PATTERN is a PATTERN. so, here’s the BUY on MSFT issued in March 2009.
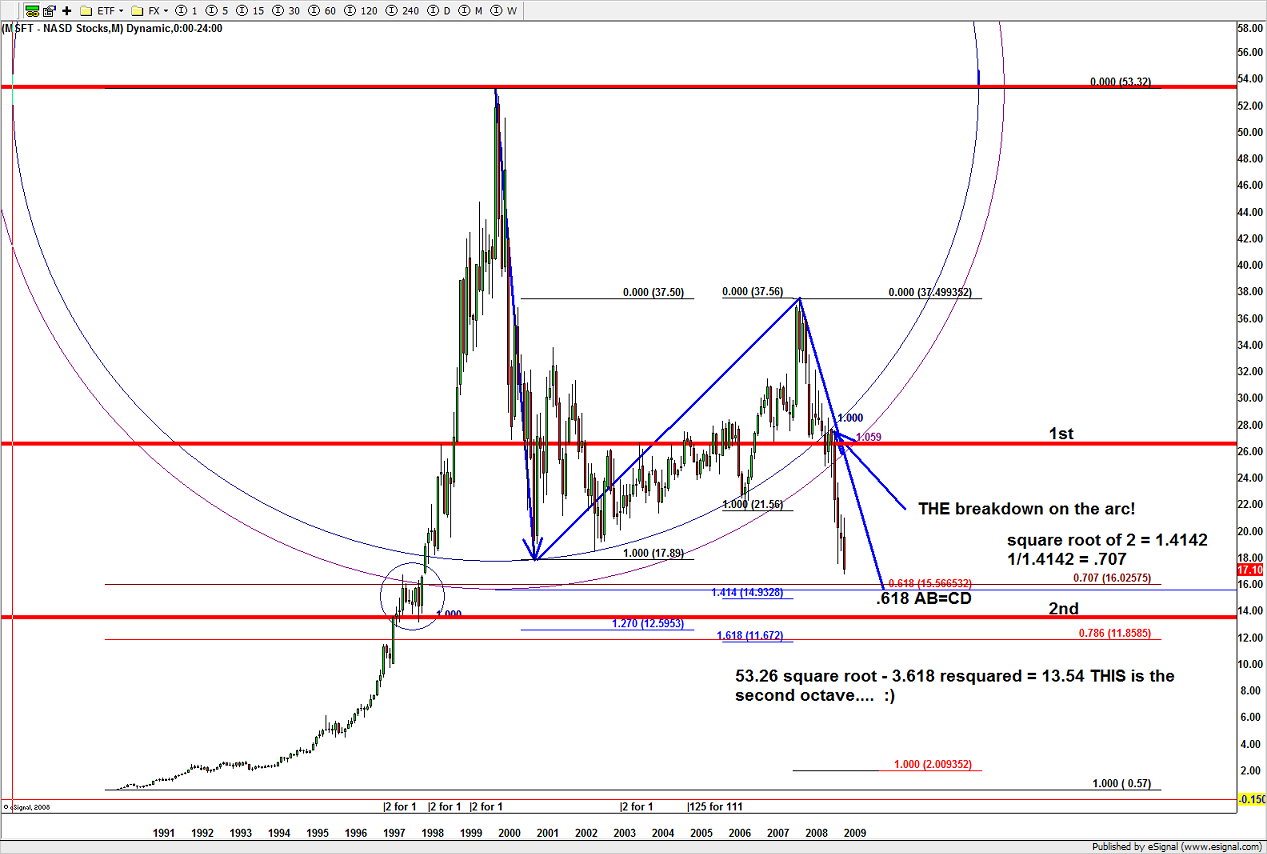
BUY on MSFT in March 2009
so, where are we now?
we are approaching the .618 from the all time high on decreasing volume and an overall market that “should” be correcting. Time to take some off and get ready for the next wave …in my humble opinion. (note – 50-52 is still a target.)
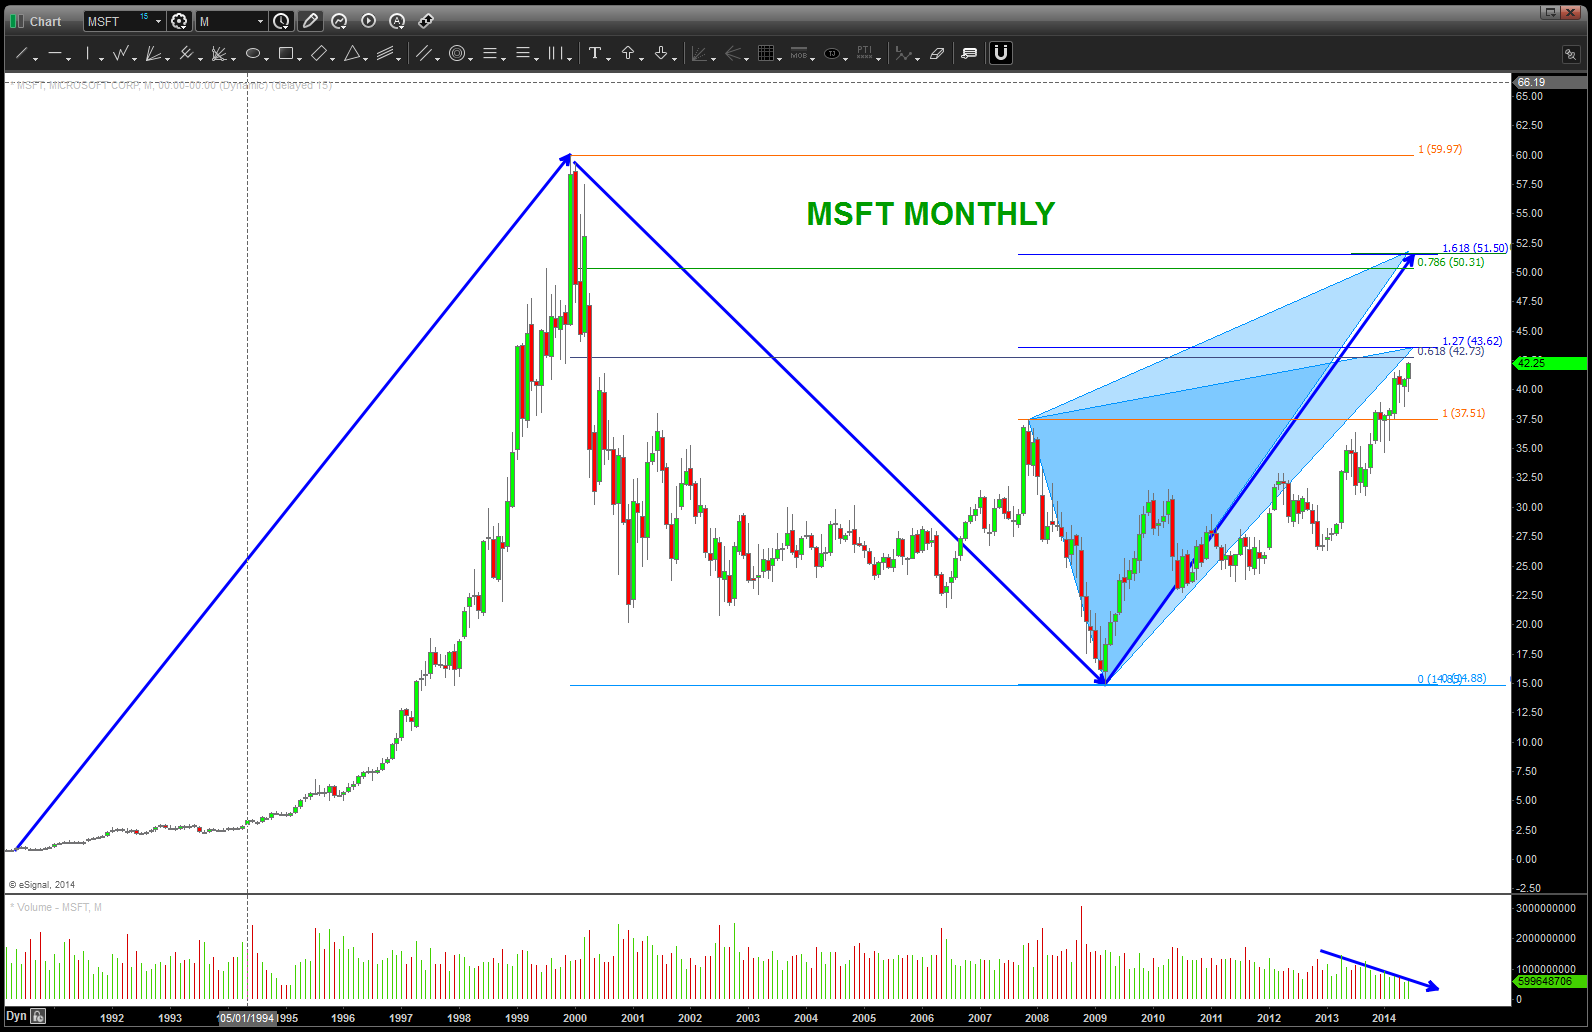
MSFT approaching resistance zones – watch closely or take some off the table
