Under Armour ($UA)
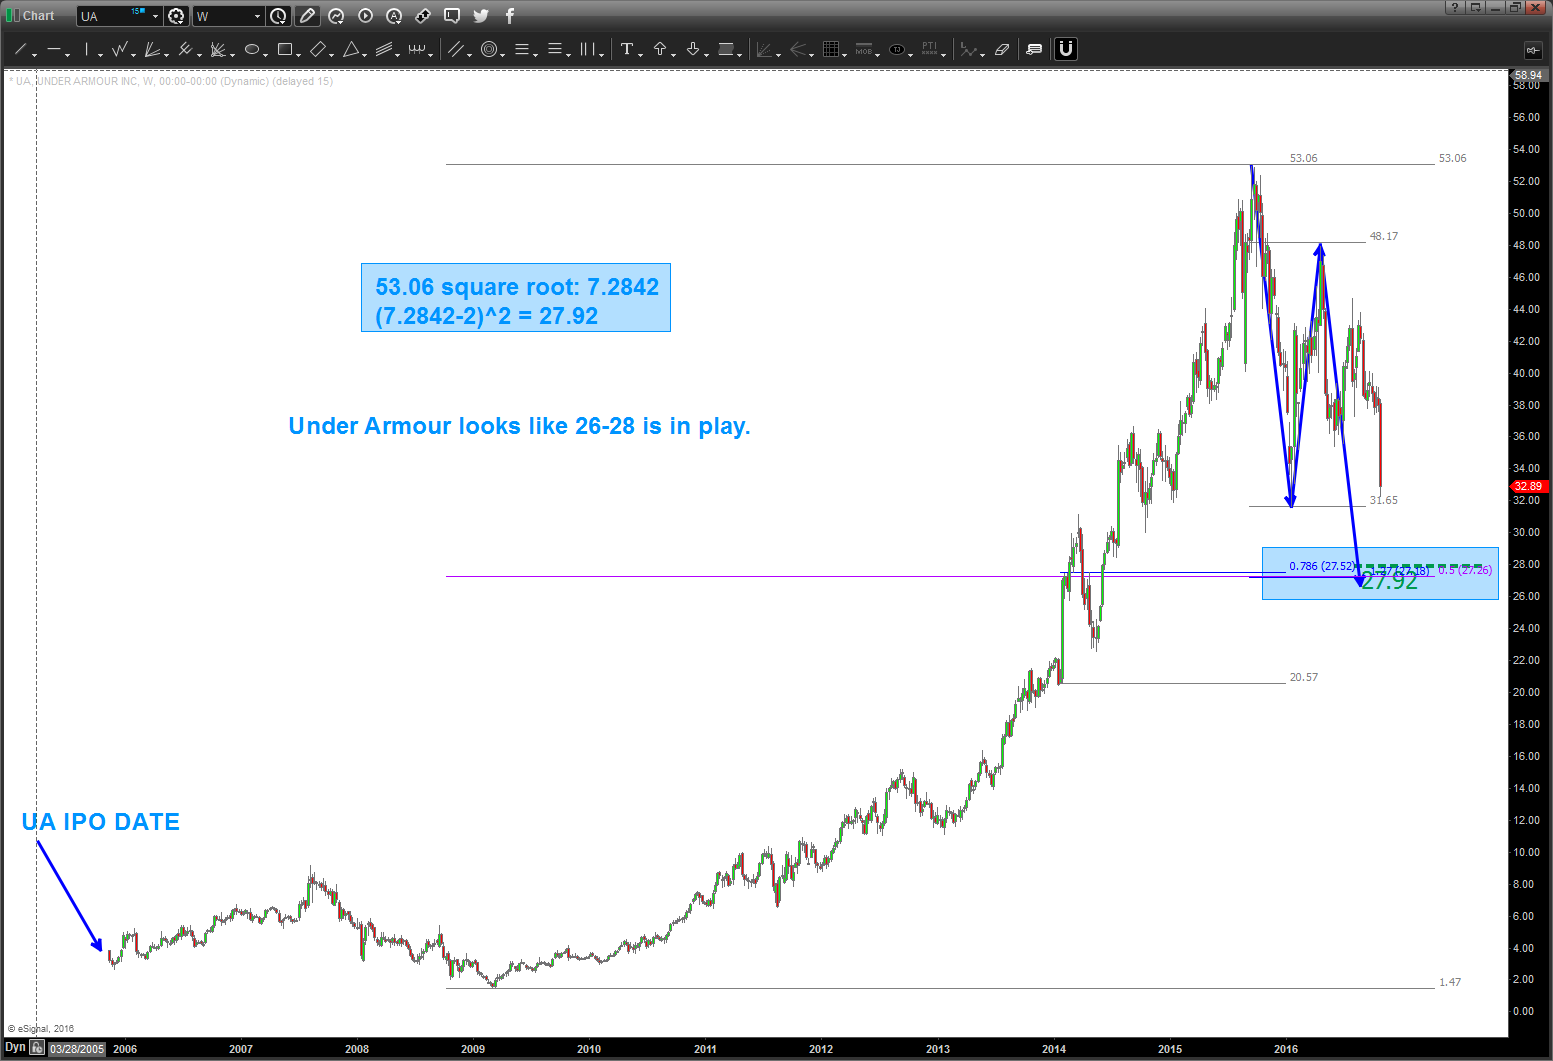
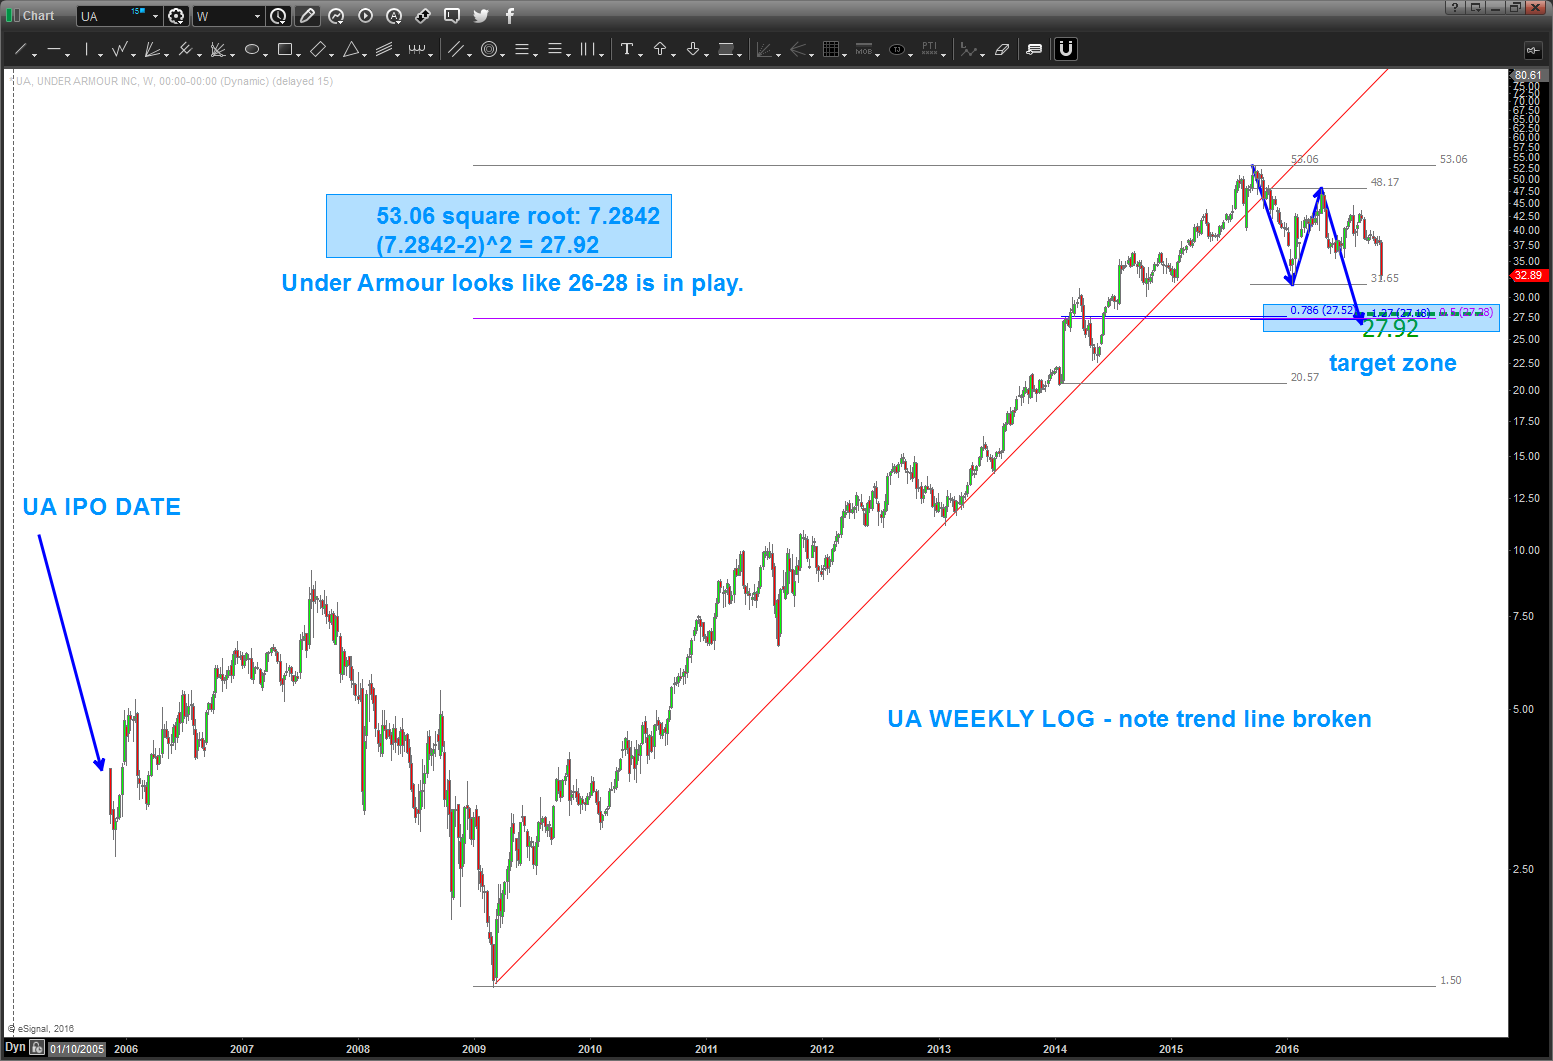
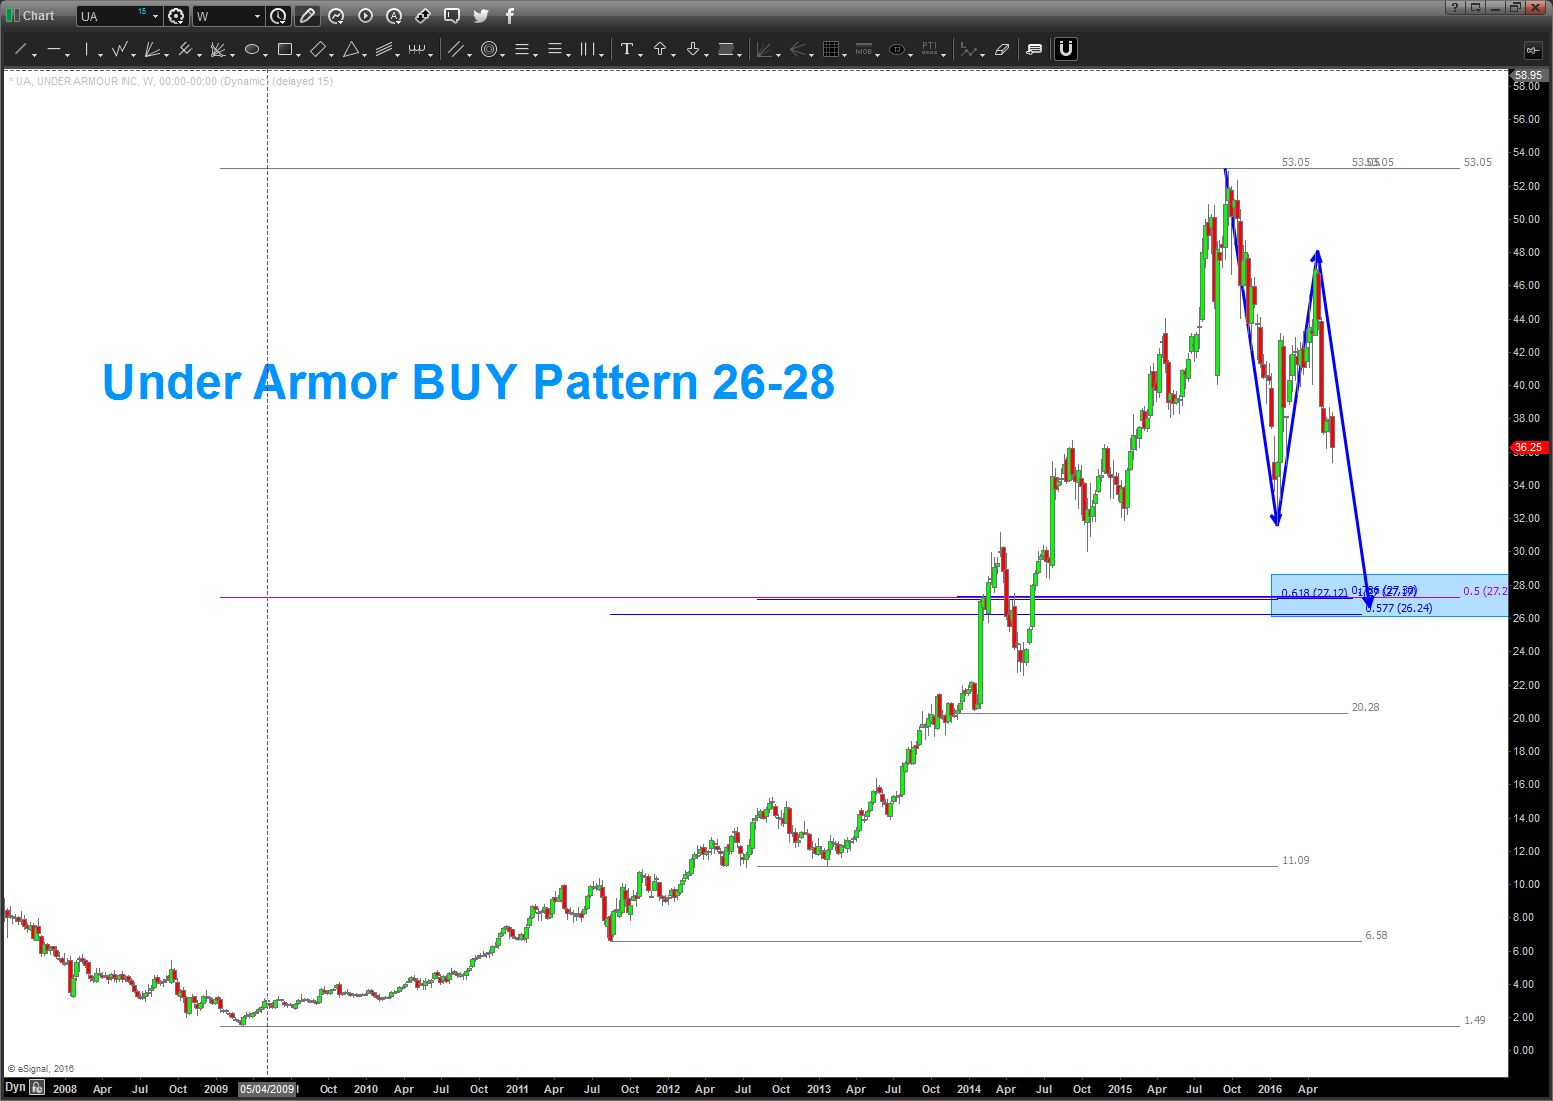
10/25/2016 – I was asked to take a look at Under Armour back in June. I saw this pattern – again – had ZERO idea if it would get down there. As a pattern recognition dude, that’s the pattern .. .as of today, appears it’s going to make that level. Some thoughts …
- this is the first ‘true’ BUY pattern since it’s IPO and after a spectacular and somewhat parabolic run.
- caution w/ the size of the candles coming down – that denotes thrust and patterns fail when huge thrusts hits the levels
- note the square root target hits – basically – right at the BUY pattern. That, my friends, is good.
- remember, the square root target is using the Gann Square of 9. One trip around the wheel is equal to the square root of the base number (in this case the high of 53.06) -2 and then resquared. That’s how it works …
- the second chart is a long term log look at UA. NOTE – it broke it’s fabulous run .. so, this selling pressure is expected. that’s what happens when long term log trend lines are broken.
- this pattern fails – IMHO – with a daily close below 25.

Pingback: Under Armour Stock (UAA) Nearing “Buy” Level Support | See It Market