Loonie, OSX, Crude – time for another inflection? UPDATE to the UPDATE
Posted on November 5, 2016 Leave a Comment
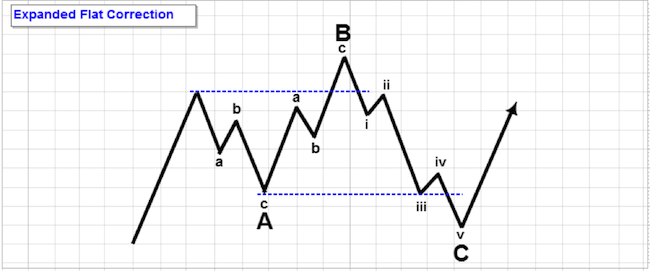
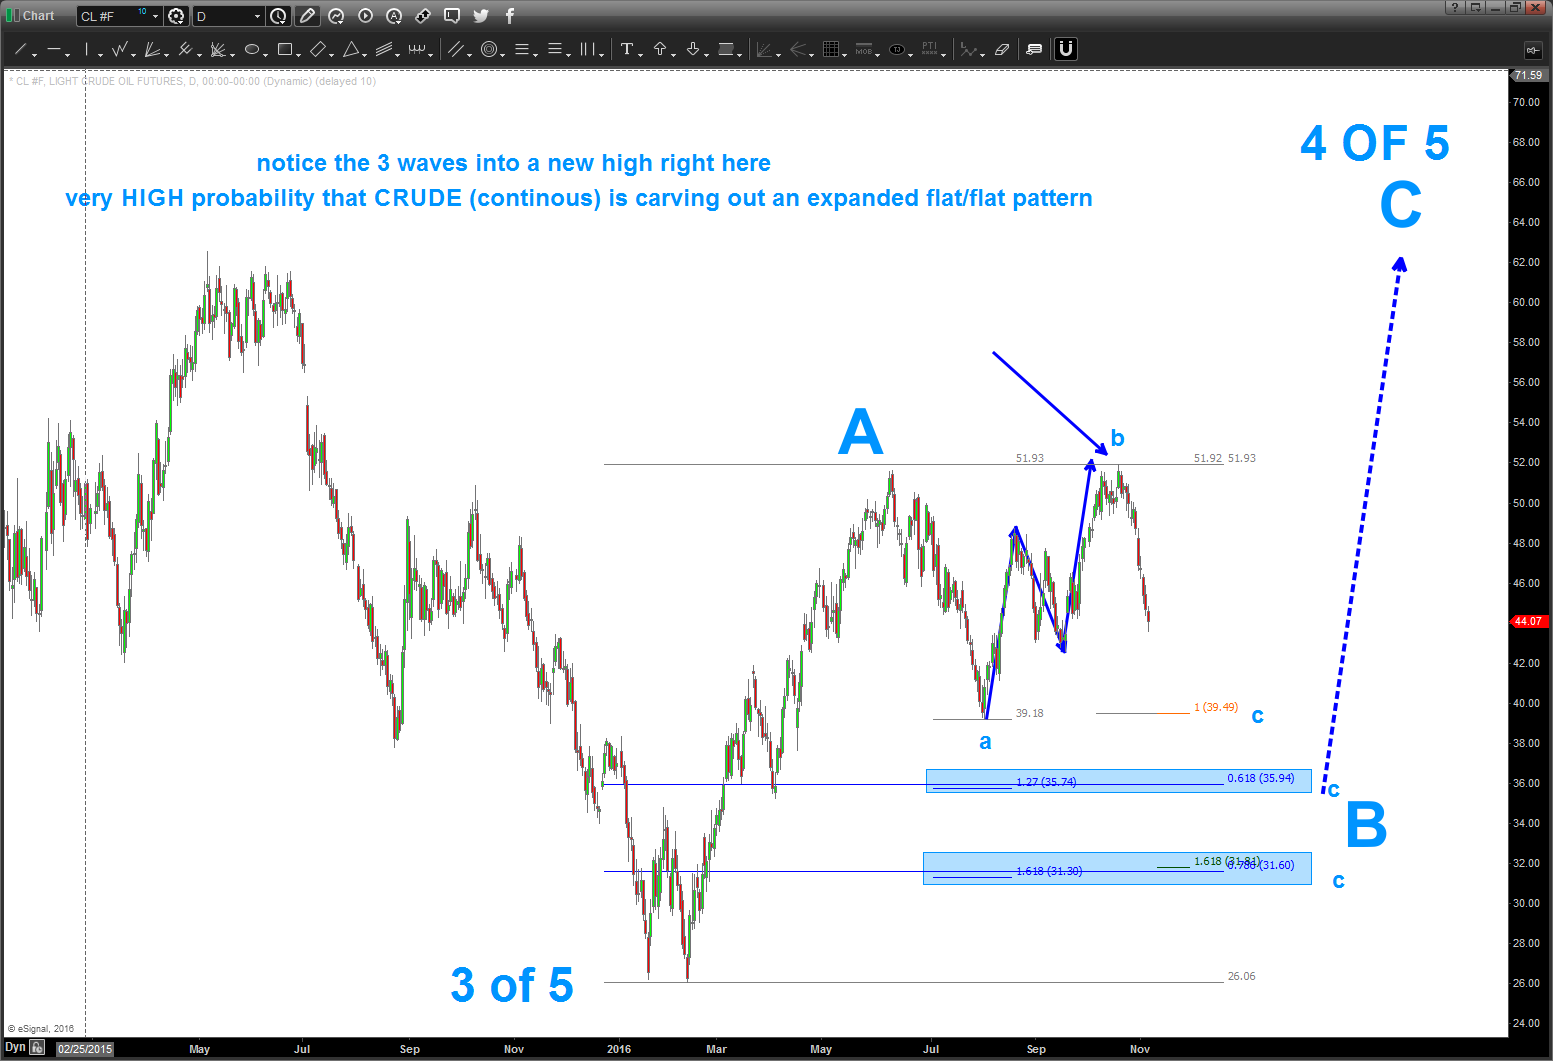
11/5/2016 – Crude Continuous is giving us a nice “heads up” that this move is CORRECTIVE in the scheme of a much larger corrective pattern to finish a big big 4. the market corrects (most of the time) in 3 waves labeled A-B-C …in this case let’s follow the set up:
- $26 dollars was the END of 3 of 5
- $51 was the top of A
- the 51.92 slight new high (NOTE WAS IN 3 WAVES) was a ‘minor’ b wave and this move lower is ‘c’ to finish the a-b-c sequence of B.
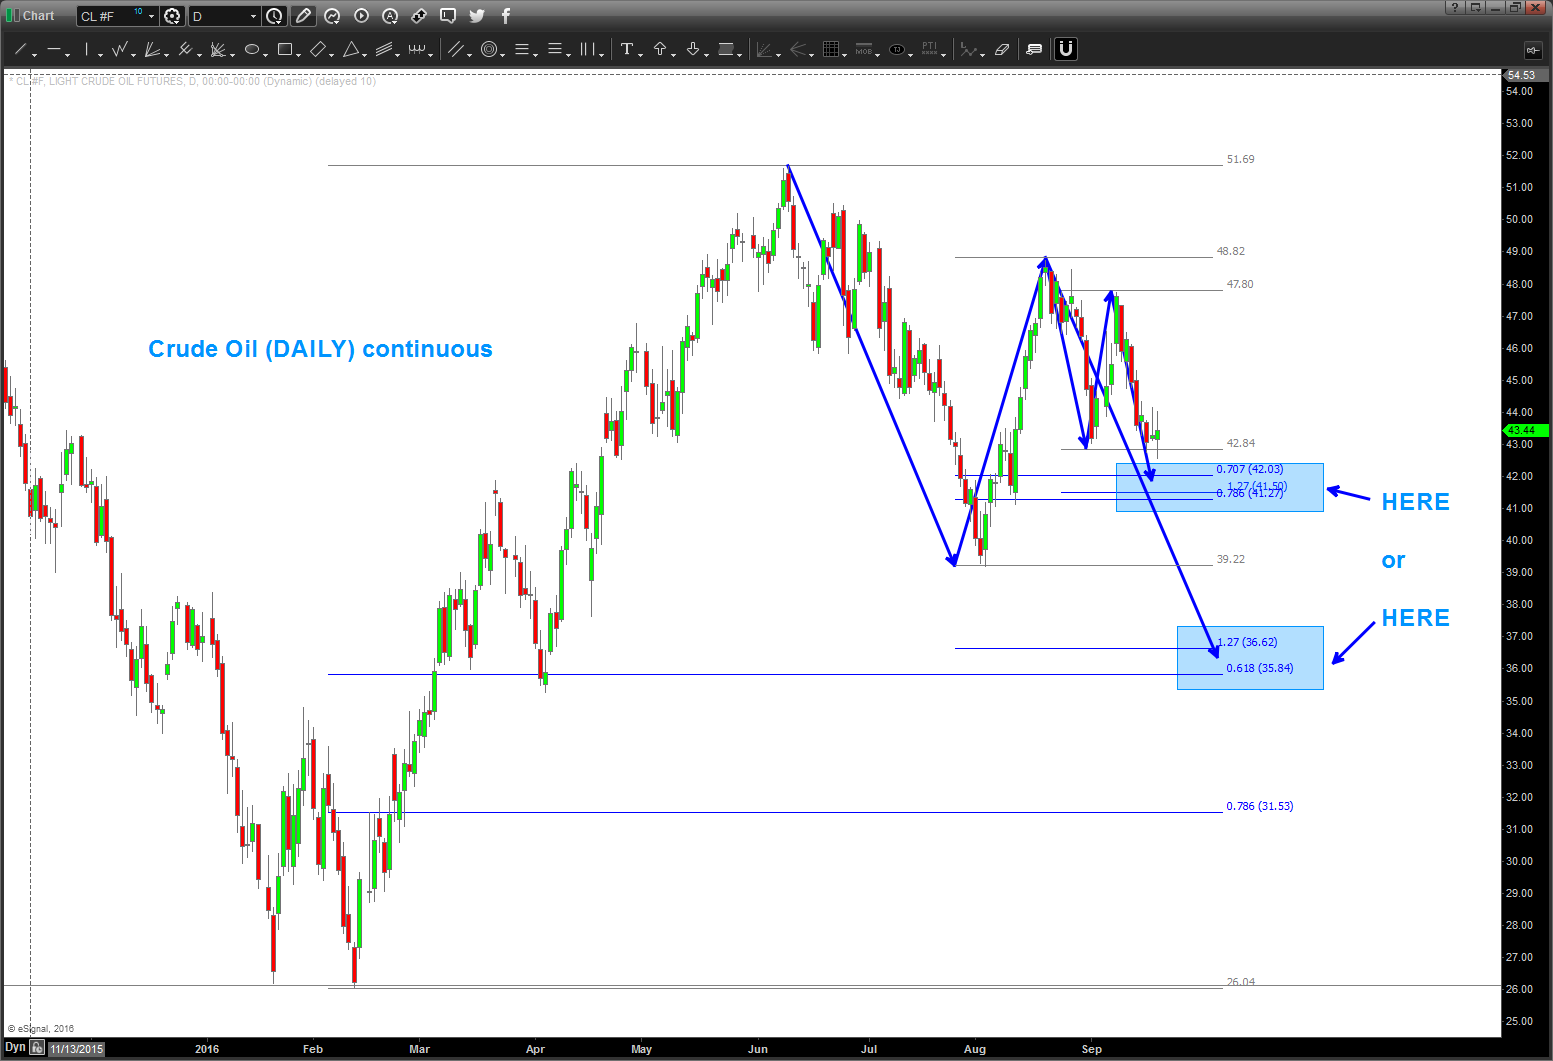
- the ‘usual’ relationship is 1.618*a = c and note all of the ratio’s come together in/around 31.30-31.60. THAT’s a GREAT BUY for crude.
- Else – we could just be arcing out a FLAT and 38 holds it and if we have 5 waves down into 35.70-35.90 that could be it.
- either way … we are moving into a very nice BUY of crude.
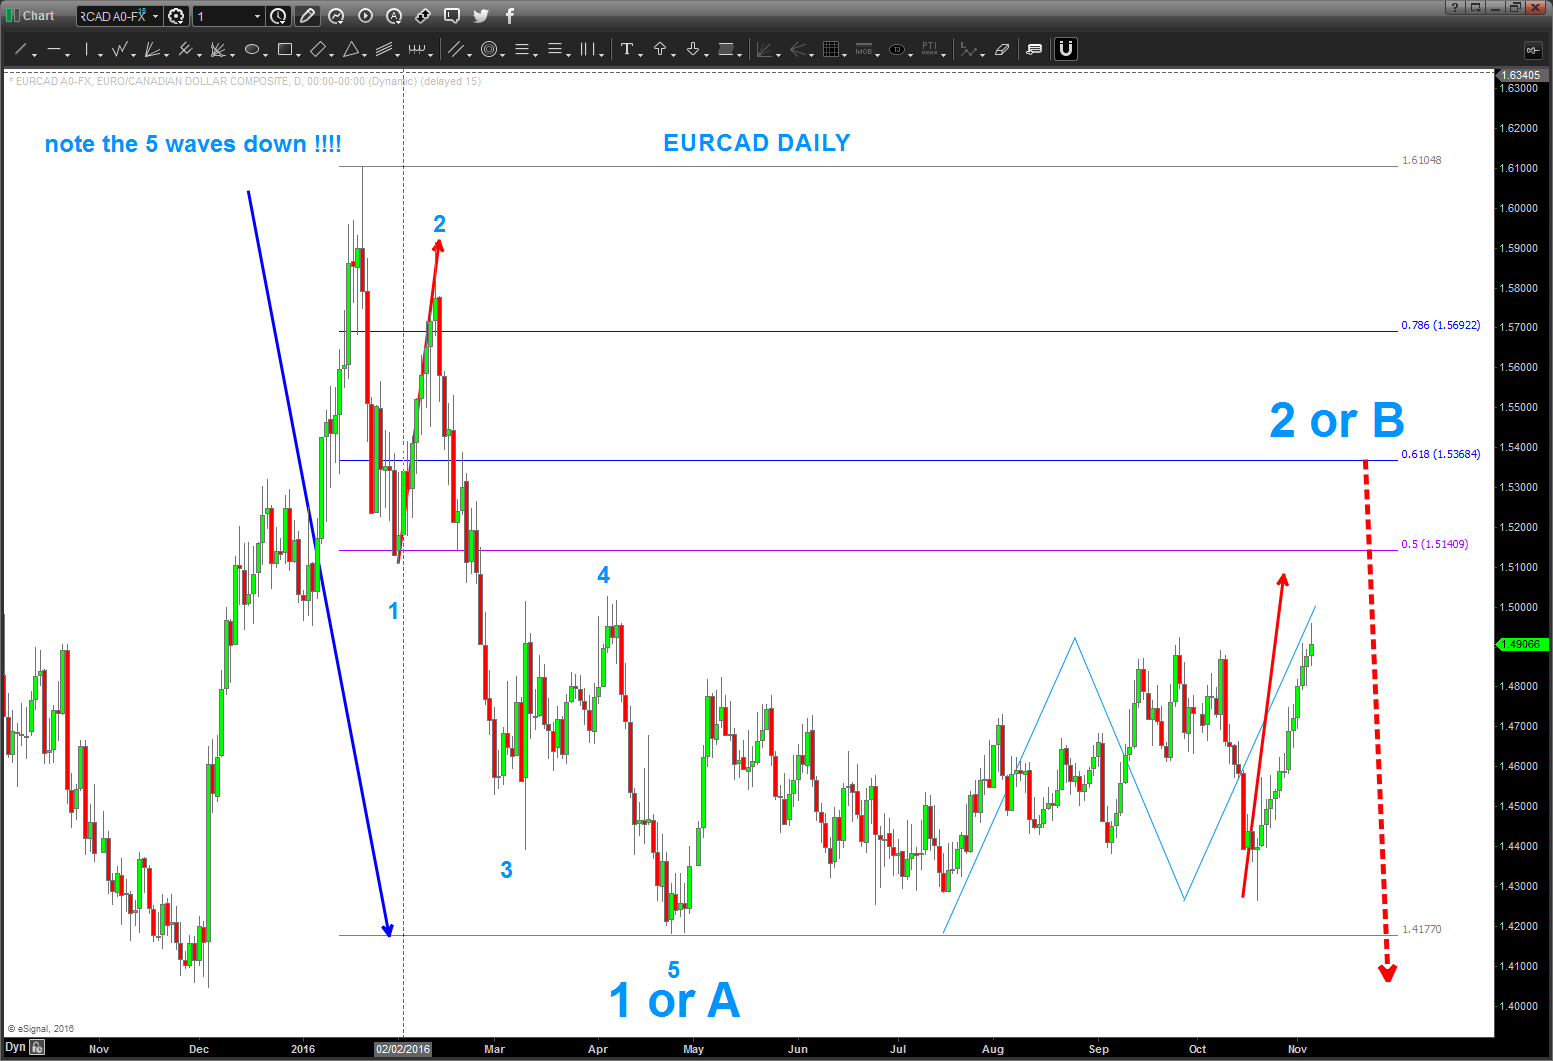
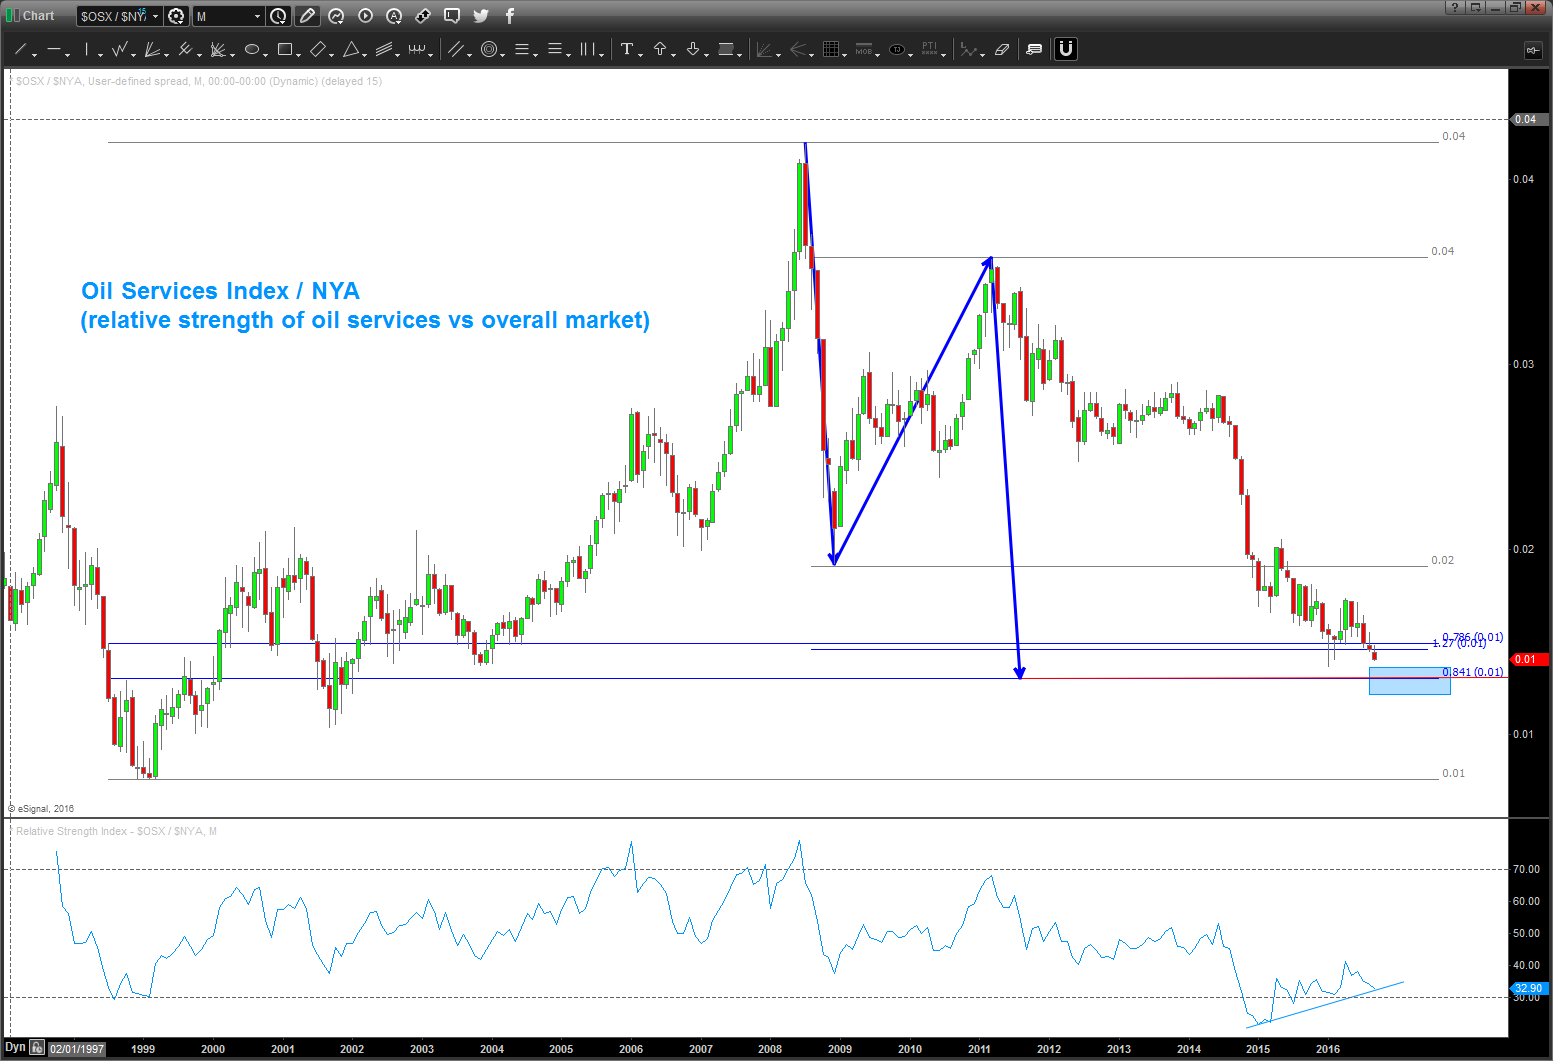
Until we hit that bottom .. the LOONIE will probably not strengthen and churn/burn in around these levels or a little higher. be patient, the move is coming.
here’s the ideal pattern we are watching:
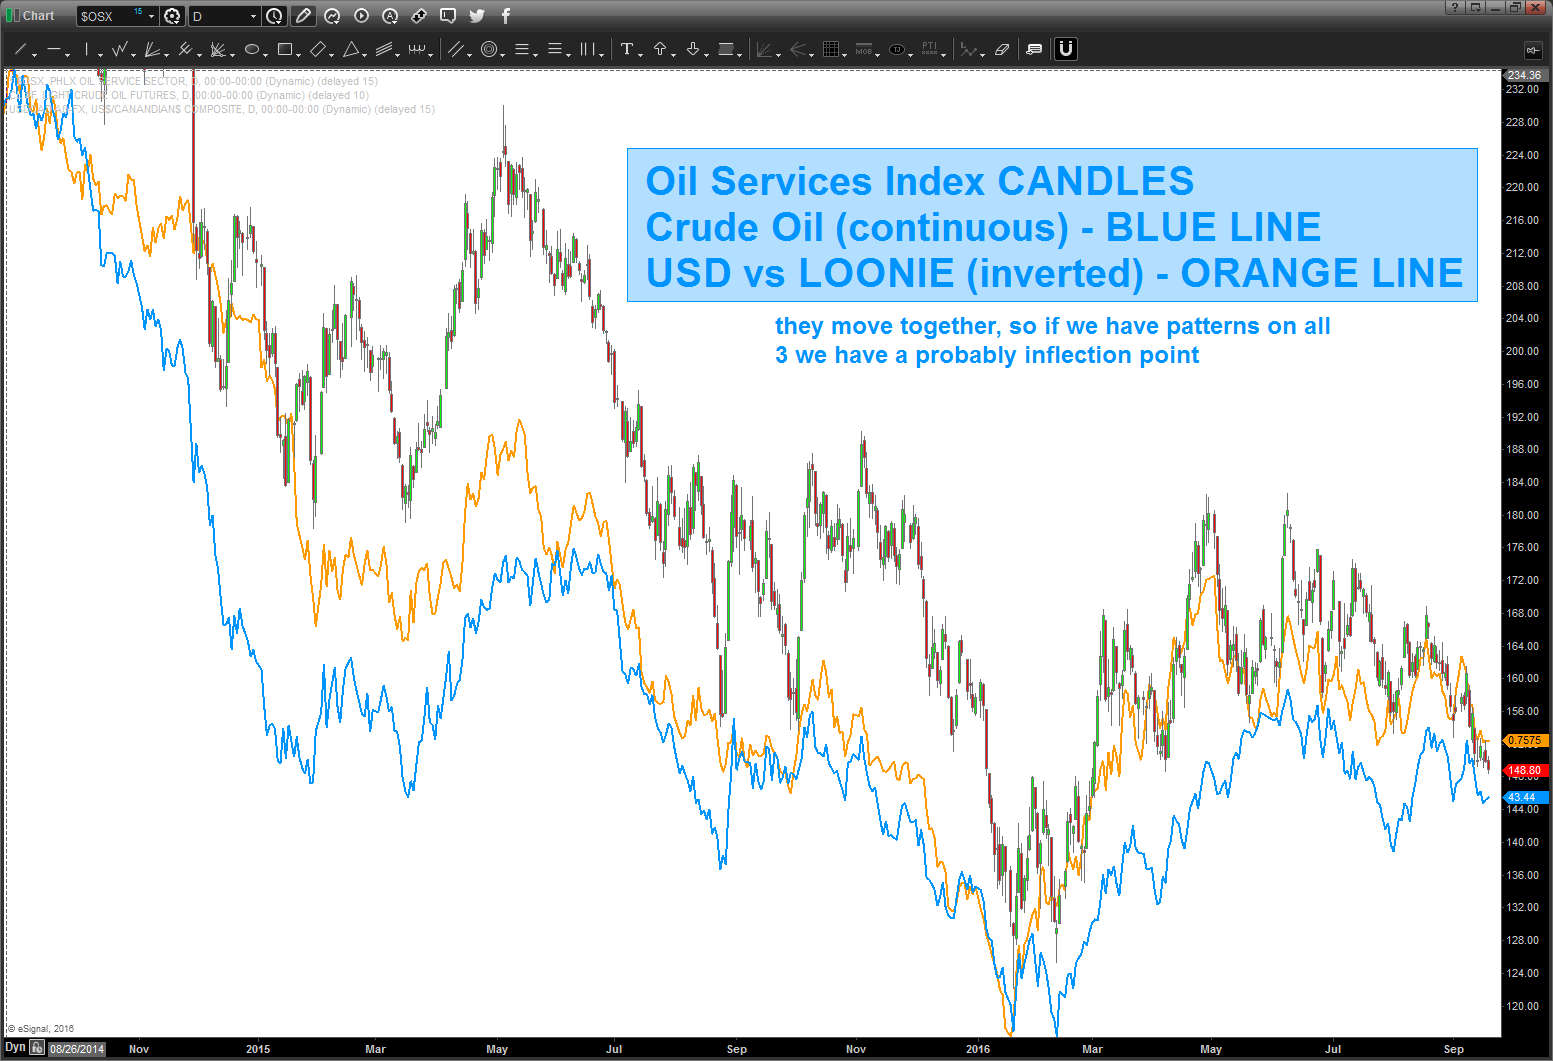
here’s crude:
here’s Loonie vs EURO and USD:
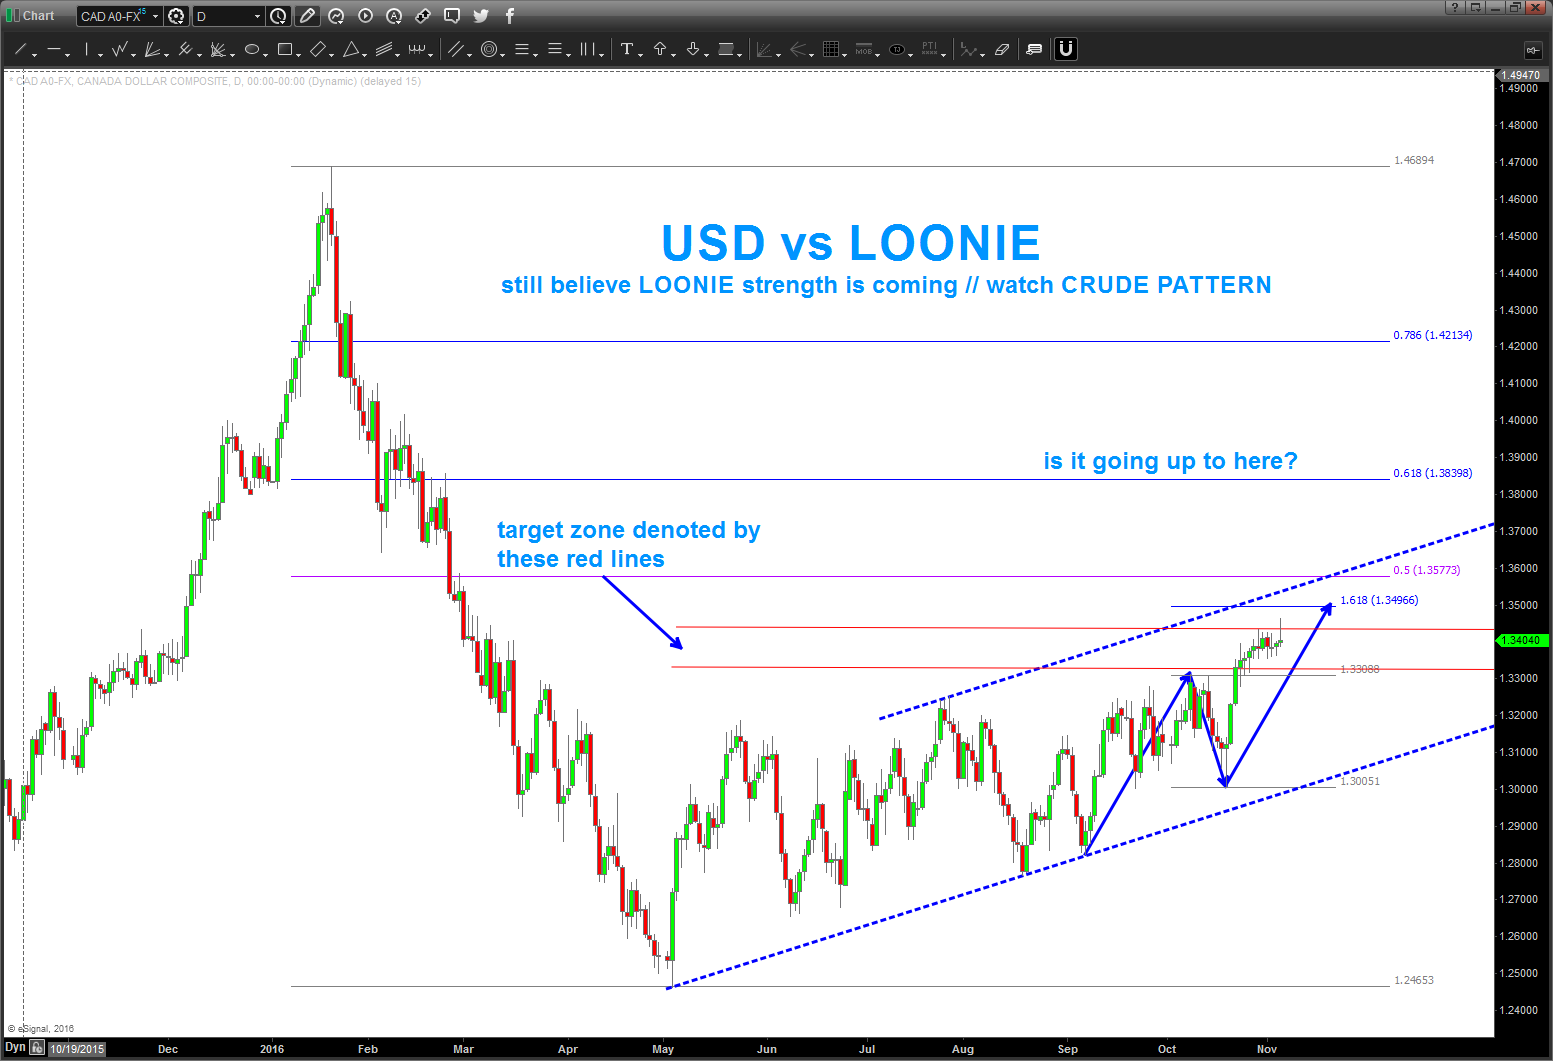
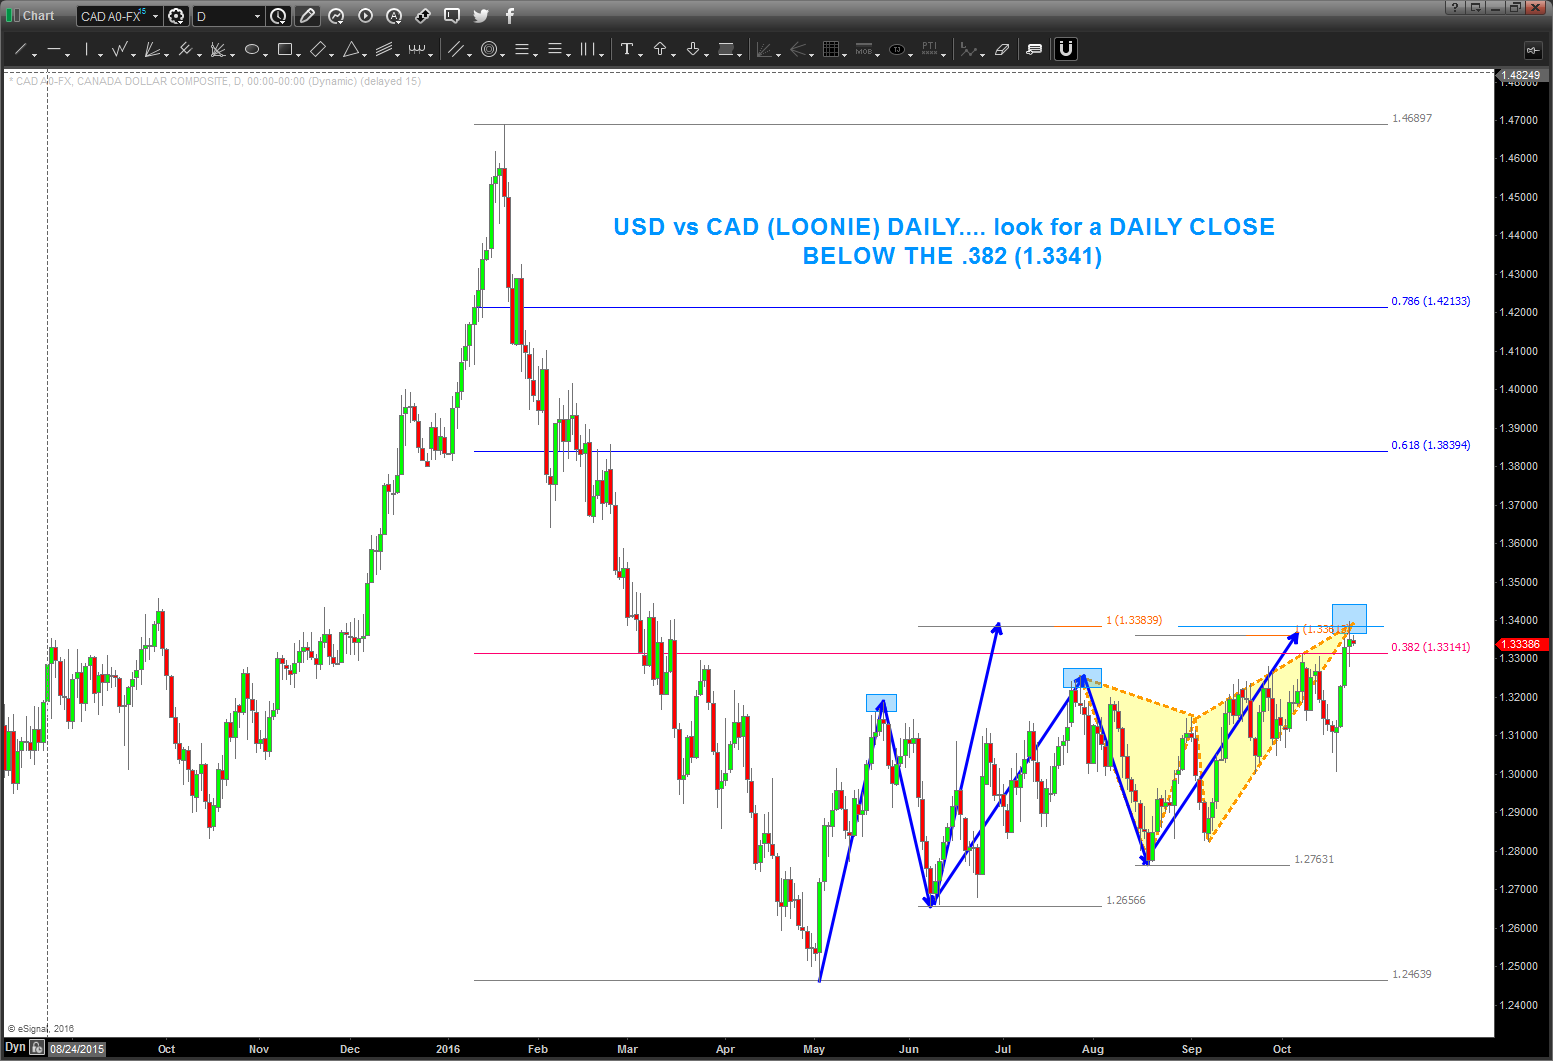
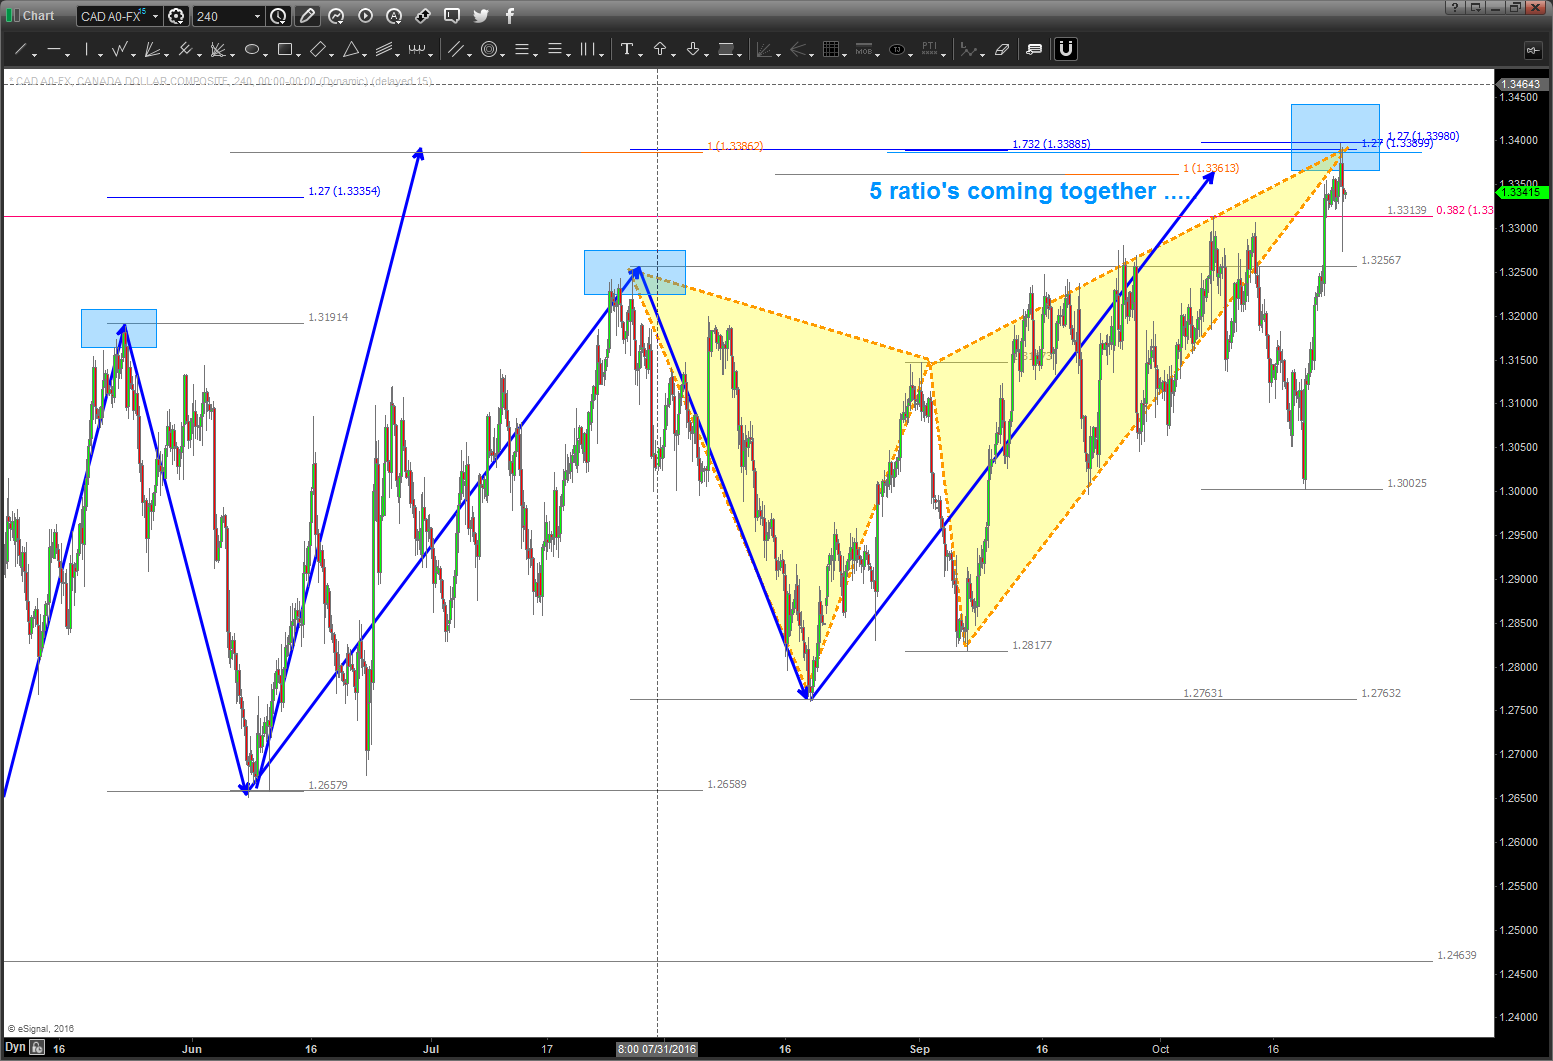
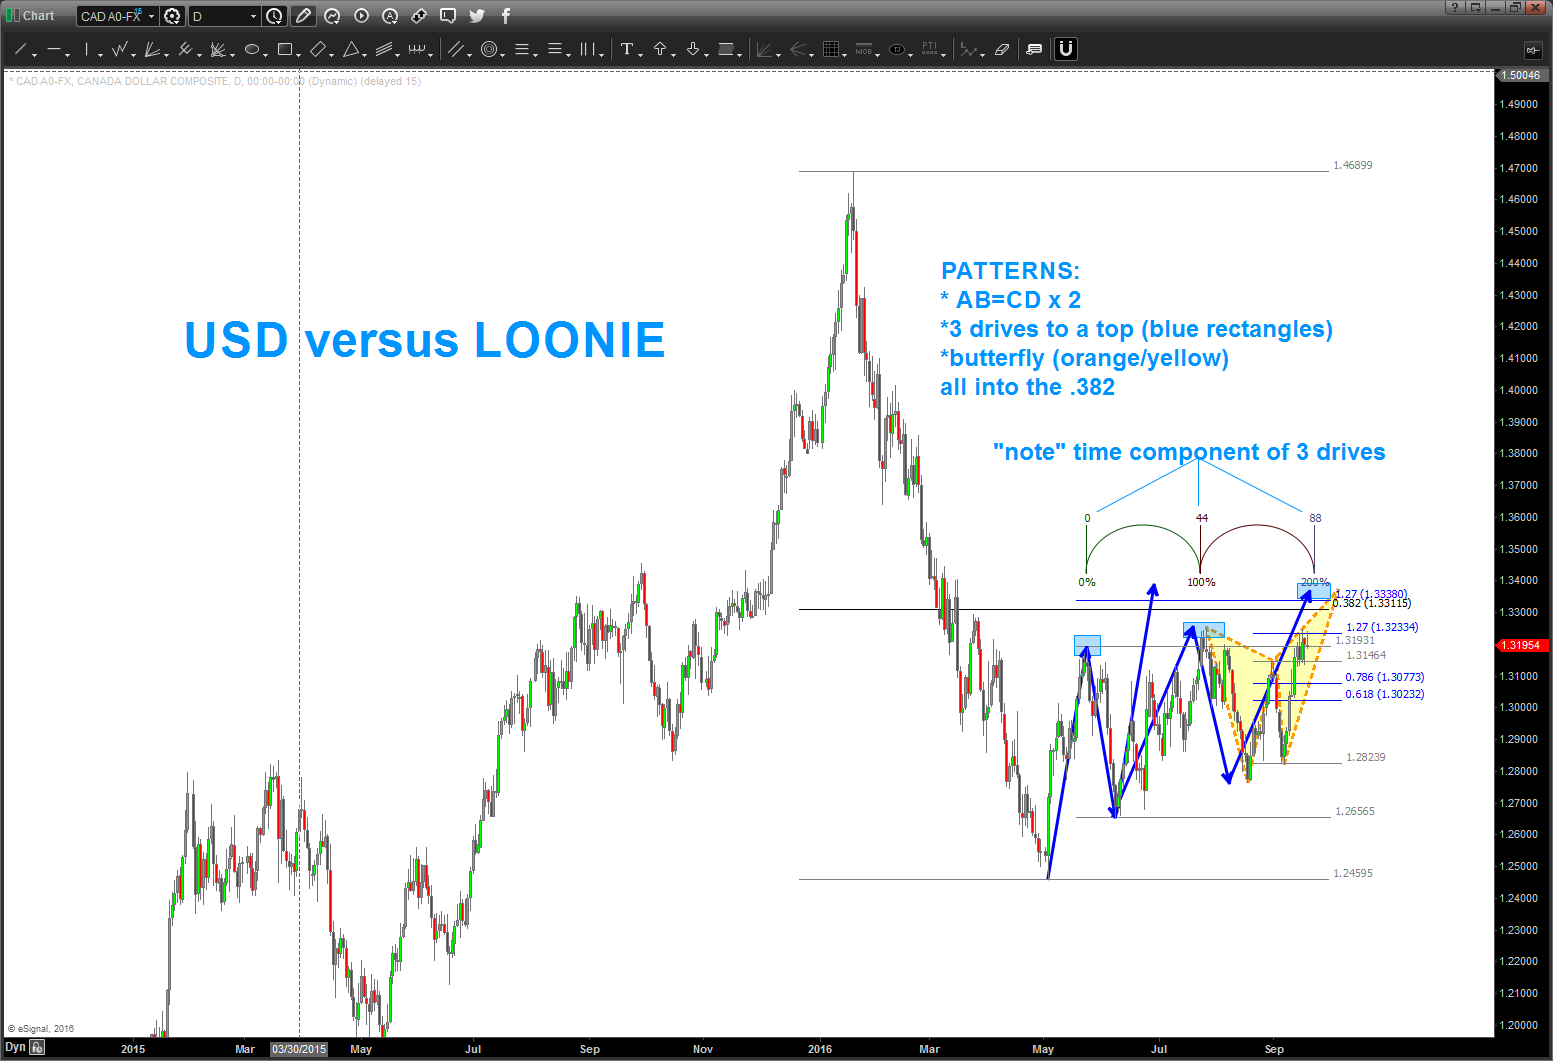
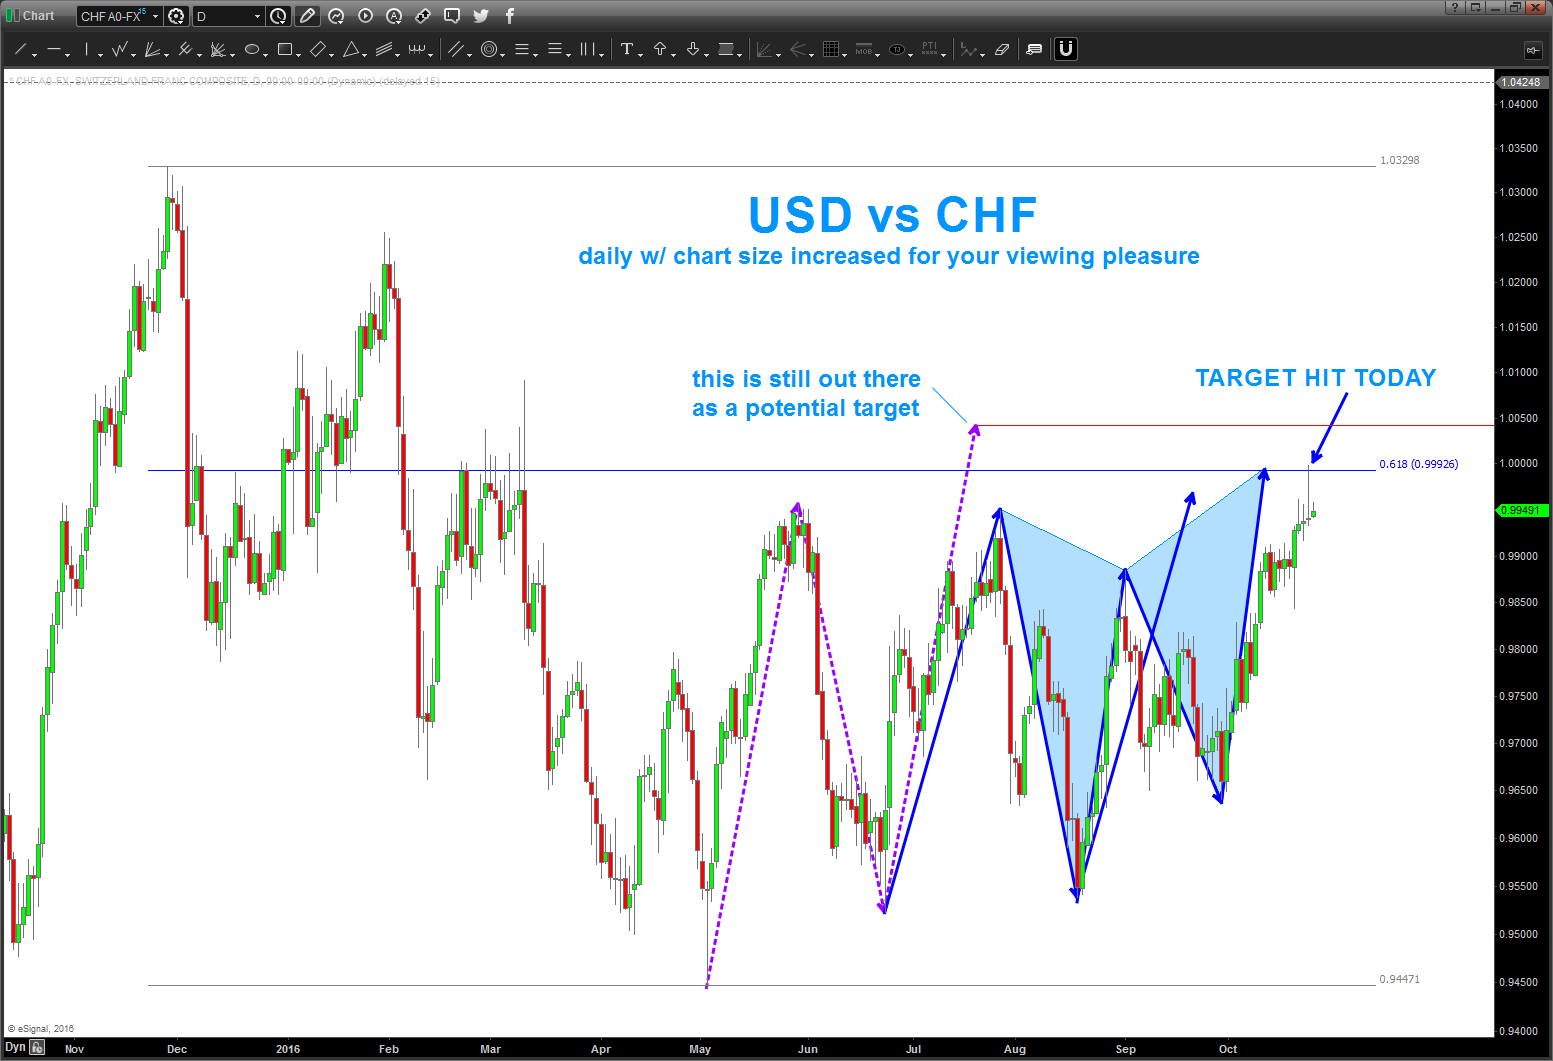
10/24/2016 – target hit on the USD vs LOONIE. Watch this one carefully. It “appears” that everyone is thinking of a big breakout but, as you can see, we had multiple targets coming into play and they were hit today.
WATCH FOR A DAILY CLOSE BACK BENEATH CHANNEL OR THE .382 as shown.
go ahead and follow this link if you want to follow some real time PATTERNS w/ technical analysis and the correlation between the 3 items in the subject line: https://bartscharts.com//?s=LOONIE
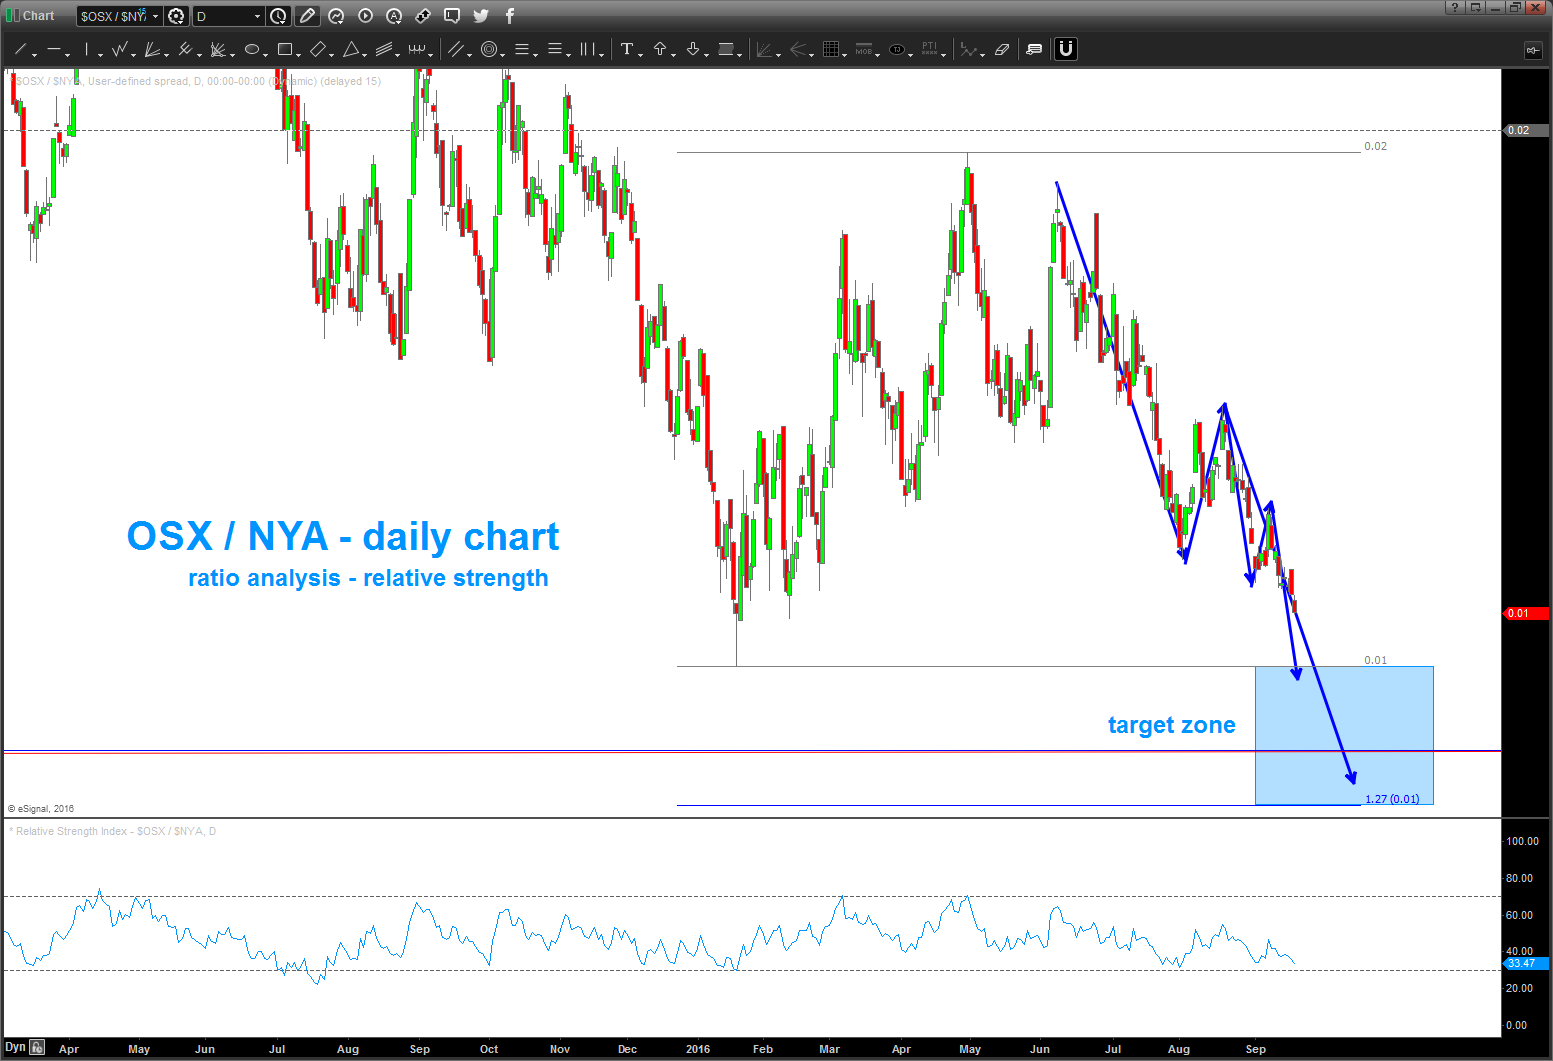
appears we are at another critical juncture:
- Crude – 2 buy patterns present.
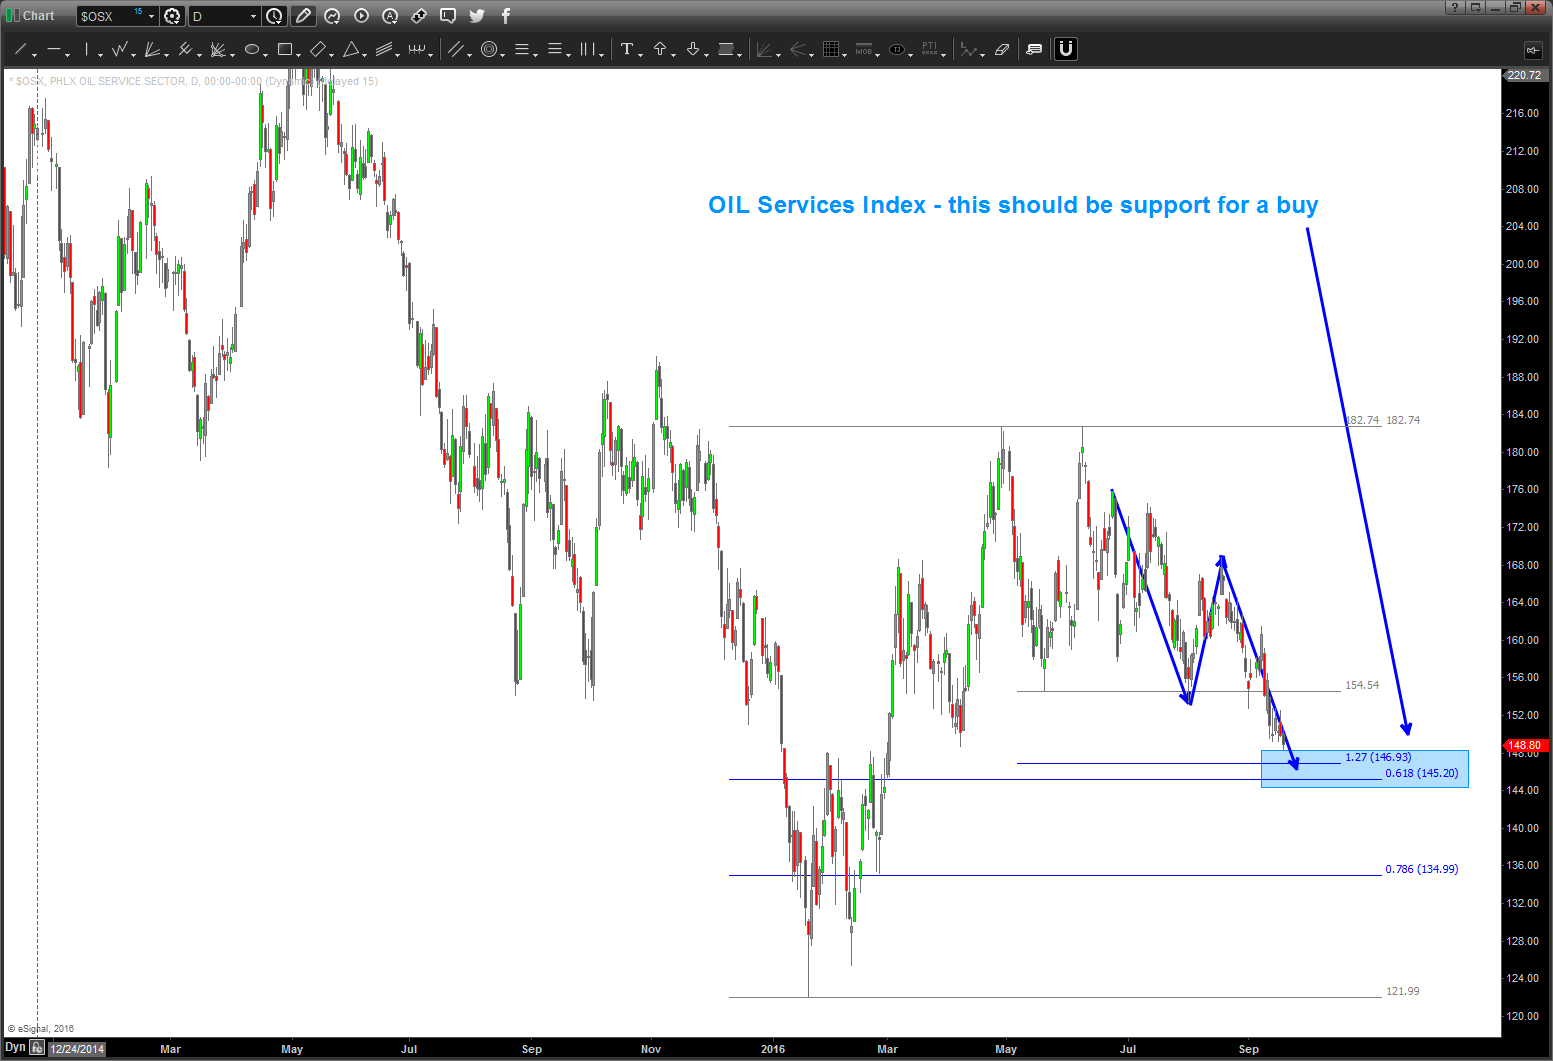
- OSX – buy level indicated
- USD vs LOONIE – multiple patterns present for another move in LOONIE strength.
again, these are just patterns folks … but we have a very clearly defined demarcation line for the next move to begin.
stay tuned
Bart
charts below, let me know if you have any questions.
the FANG GANG- where are we now
Posted on November 5, 2016 Leave a Comment
11/5/2016 – I really enjoying blogging for Andy @seeitmarket. he’s such a great dude, great family and he’s created one of the best resources for quality and professional research. Over the past year or so (yes, year or so) he’s given me the opportunity to blog/write for his site. Every once in a while I’ll text him and say “what do you want” and he’ll give me some ideas. Over a year ago he told me to start watching the FANG gang. So, I did …
F- Facebook
A – Amazon, Apple (you pick)
N- Netflix
G- Google
over the past couple months, these stocks have been responsible for 25% of the NASDAQ’s gain. That’s a heck of a lot of exposure ….but, in the end, the geometry told the story. here’s the story …
Facebook: http://www.seeitmarket.com/facebook-stock-update-fb-big-moving-coming-soon-16078/
Amazon – http://www.seeitmarket.com/shares-amazon-amzn-nearing-top-trading-15950/
Apple – http://www.seeitmarket.com/aapl-stock-update-heres-bullish-aapl-buy-setup-15618/
Netflix – http://www.seeitmarket.com/netflix-reverses-could-icahns-move-mark-nflx-stock-top-14506/ (note, this one went to a 1.27 x AB-CD pattern)
Google – http://www.seeitmarket.com/alphabet-stock-googl-critical-time-price-juncture-investing-16218/
what the articles show is these stocks are hitting / have hit MAJOR targets and, well, believe it or not could be in for some very very turbulent times in the coming weeks/months.
Stay tuned, but if history is any guide, one would expect some clear leadership from these names but they have hit major patterns and square outs SO … not sure what the fundamentals are telling us but based on this past weeks action they appear to respecting the geometry/vibration/patterns present based, simply, on numbers and math and music and blah blah blah.
stay tuned and let me know if you have any questions.
Navy over Notre Dame – woot woot.
Bart
Banking Index- they don’t get any better than this … PATTERNS at their finest. (sorry, changed the title)
Posted on October 29, 2016 2 Comments
Wow, doing some chart surfing before I try to Stand Up Paddleboard after my son’s basketball game (TRY is the operative word) and simply jamming to “I am the Highway” by Soundgarden … isn’t Chris Cornell’s voice simply fantastic. I find when I get in “state” I see things and, well, its simply enjoyable.
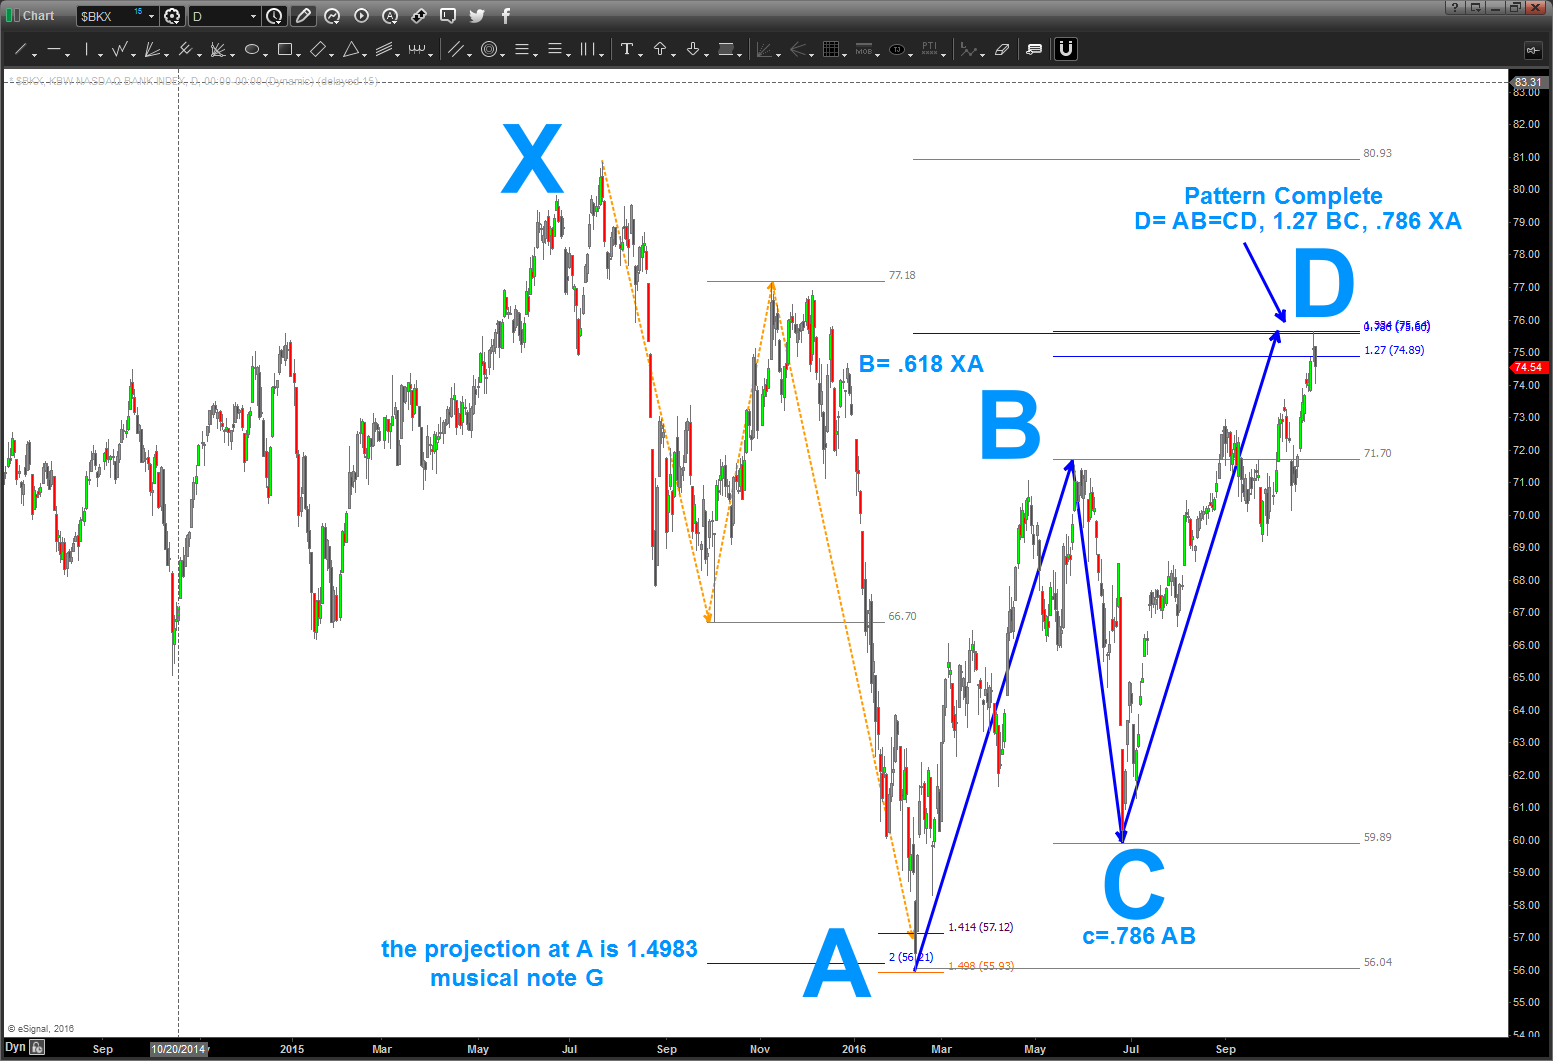
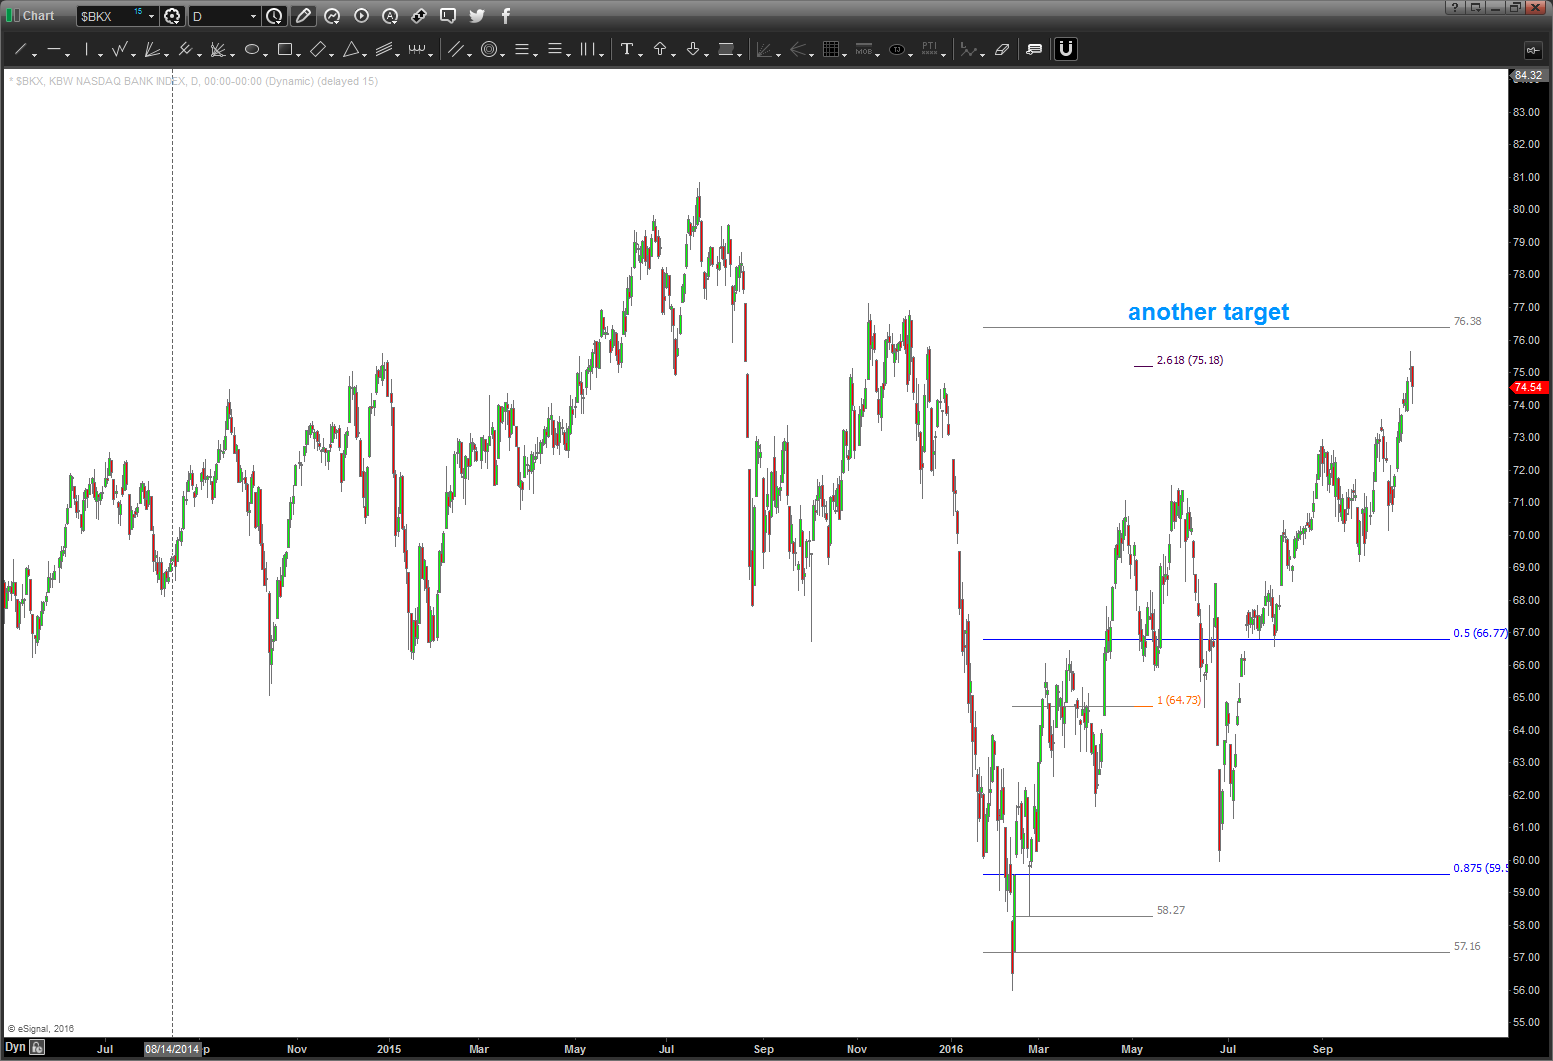
Not sure why, but after I saw the 3 ratio’s coming together on GS I said “self, wonder what the banking index is doing.” And, not kidding, is was a simple as that …
BOOM there she was .. the anatomy of a PERFECT sell PATTERN. Folks, when you have an AB=CD, a 1.27 extension hit on a .786 retracement – it’s ‘usually’ market magic.
BANKS SHOULD BE SOLD and they SHOULD ONLY BE SOLD BECAUSE WE KNOW THAT WE ARE WRONG PRECISELY IN/AROUND 76. Perhaps give it the old high around 80. Your call – it’s all RISK CONTROL BUT these types of patterns only come along like this every so often.
I’m going to spend some time showing how the pattern unfolds and the ratio’s playing ….
It’s a simple as PROJECT, EXTEND, RETRACE.
I am not your autumn moon, I am the night …. rock on, ok?
Bart
SOAPBOX: as you study this chart (study and do it for yourself) realize that this is a banking index. and, I submit, the entire world isn’t buying/selling at these ratio’s a some preconceived point
Goldman Sachs flirting w/ a top-top cycle and the dreaded neckline
Posted on October 29, 2016 Leave a Comment
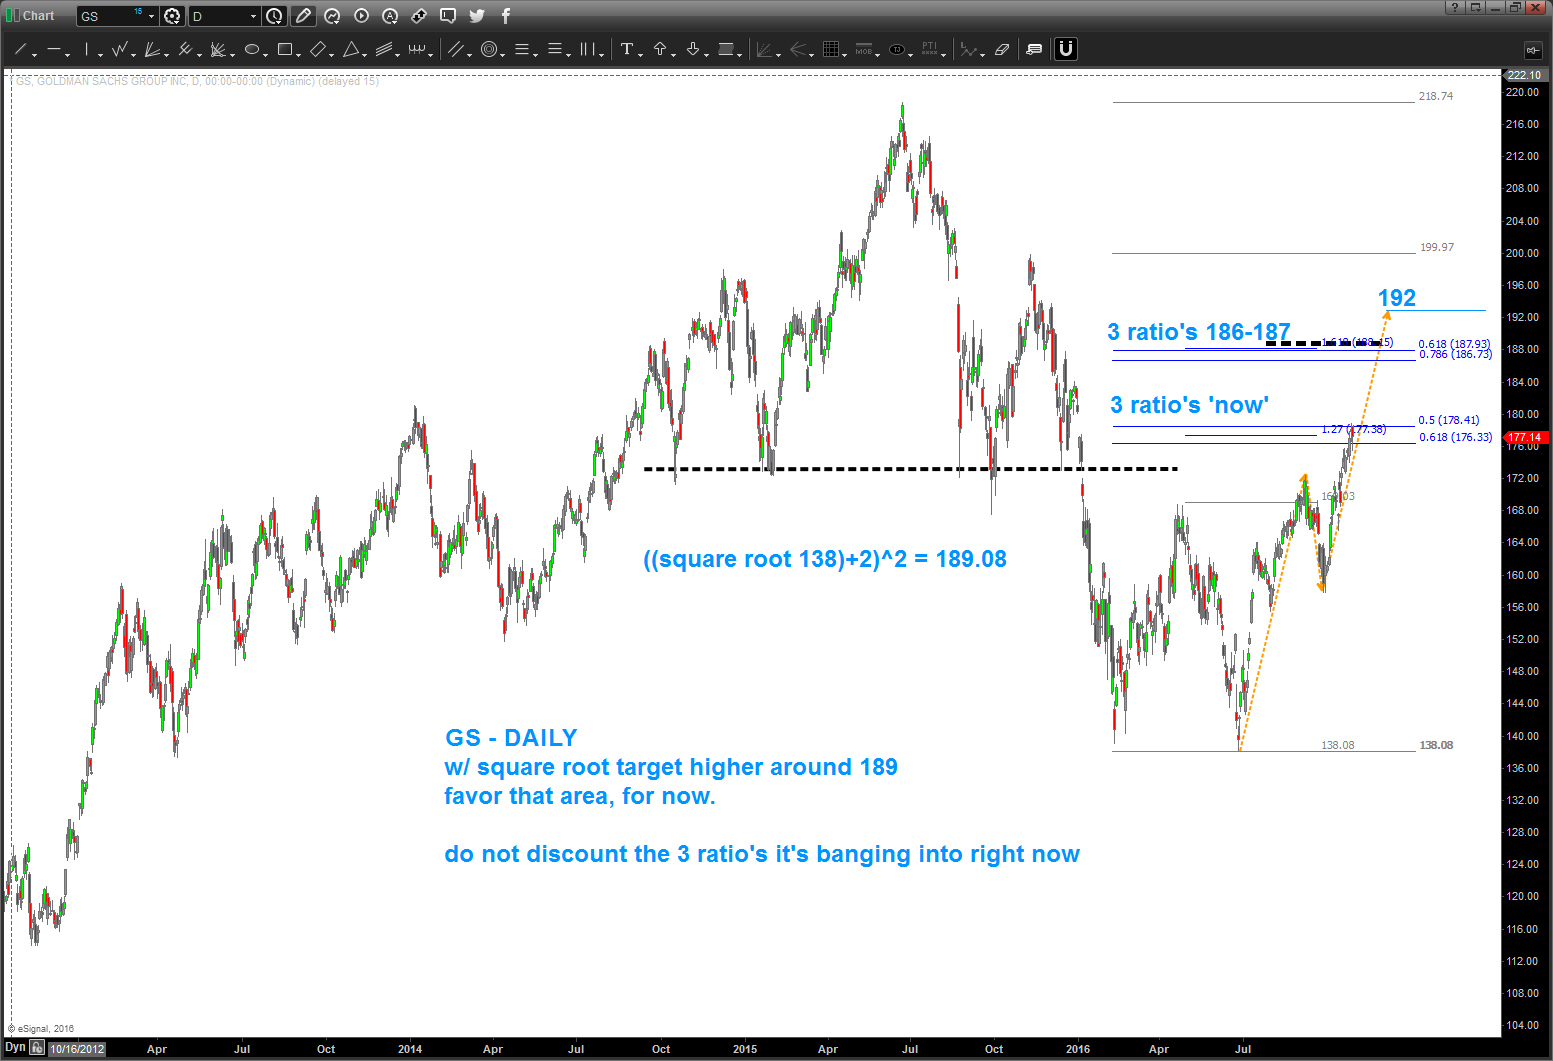
10/29/2016 – so, per below the neckline broke and if you do some work, you’ll see the technical principle of using the head to the neckline as the ‘basic’ projection technique yielded support …
now, were back to the intersection of 3 ratios now or a little higher .. if you notice, the square root target is a little higher in the 3 ratios so were at or near a very important point for GS in the future.
AGAIN, remember, it’s all probability, right? So, if Goldman is able to make it thru (on a daily or weekly close) thru two sets of 3 ratio’s it’s strong folks …
to the charts .. hitting the surf today, a gorgeous day in San Diego.
rock on, ok?
B
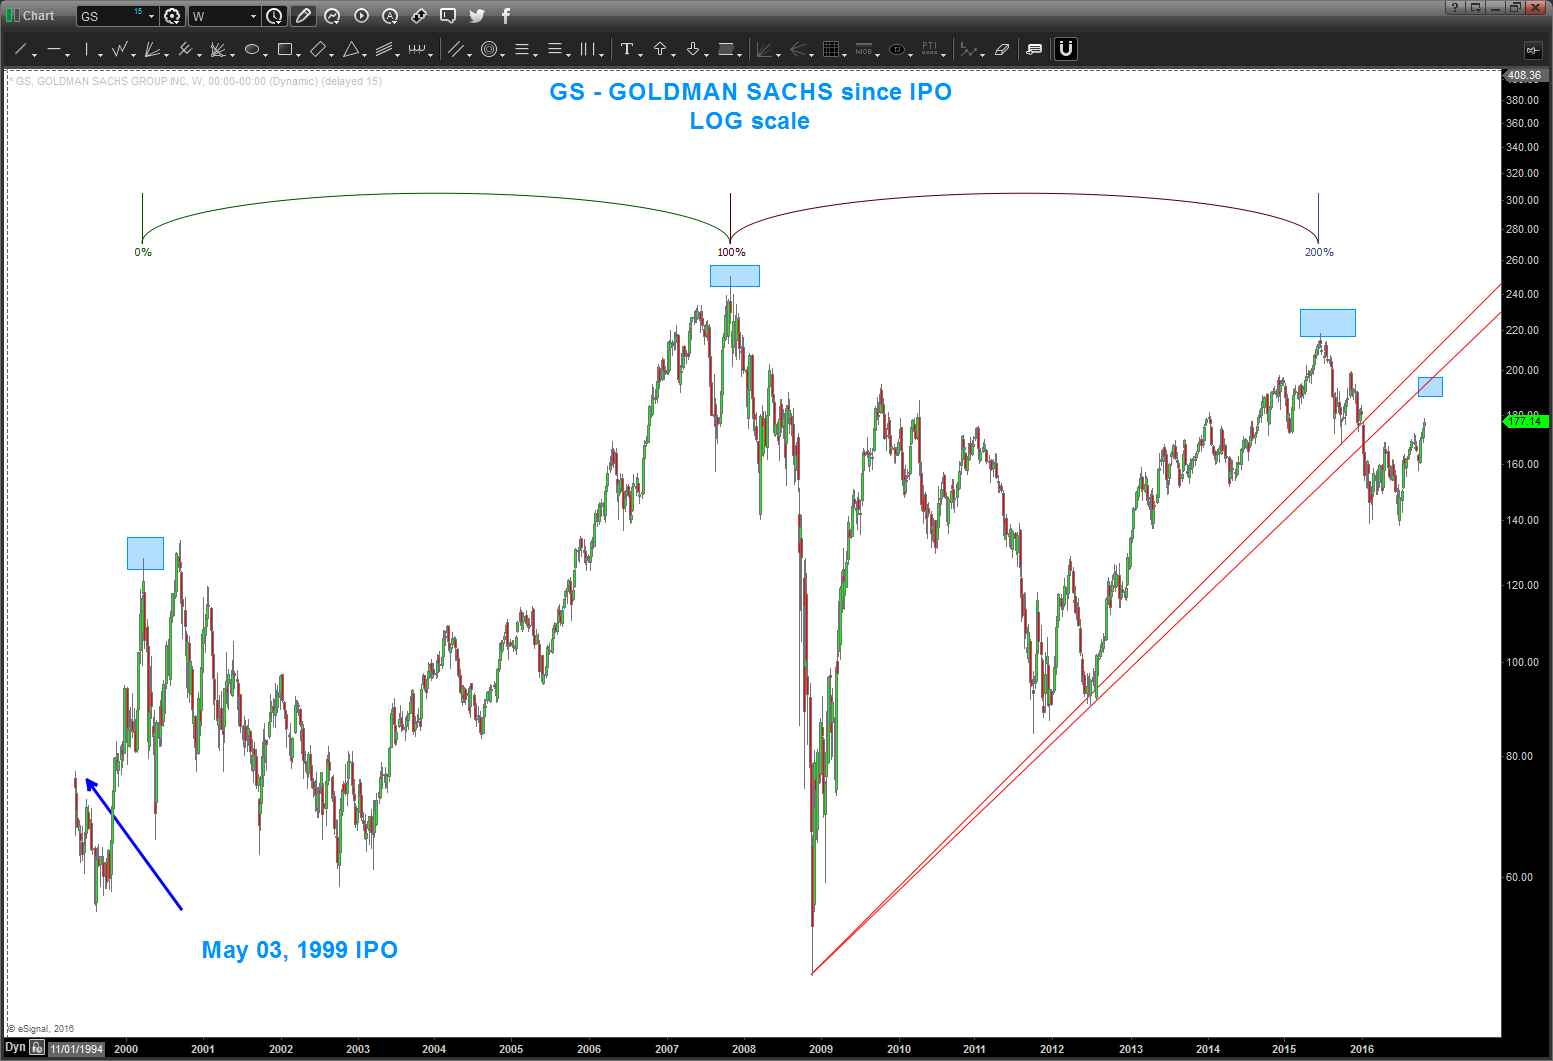
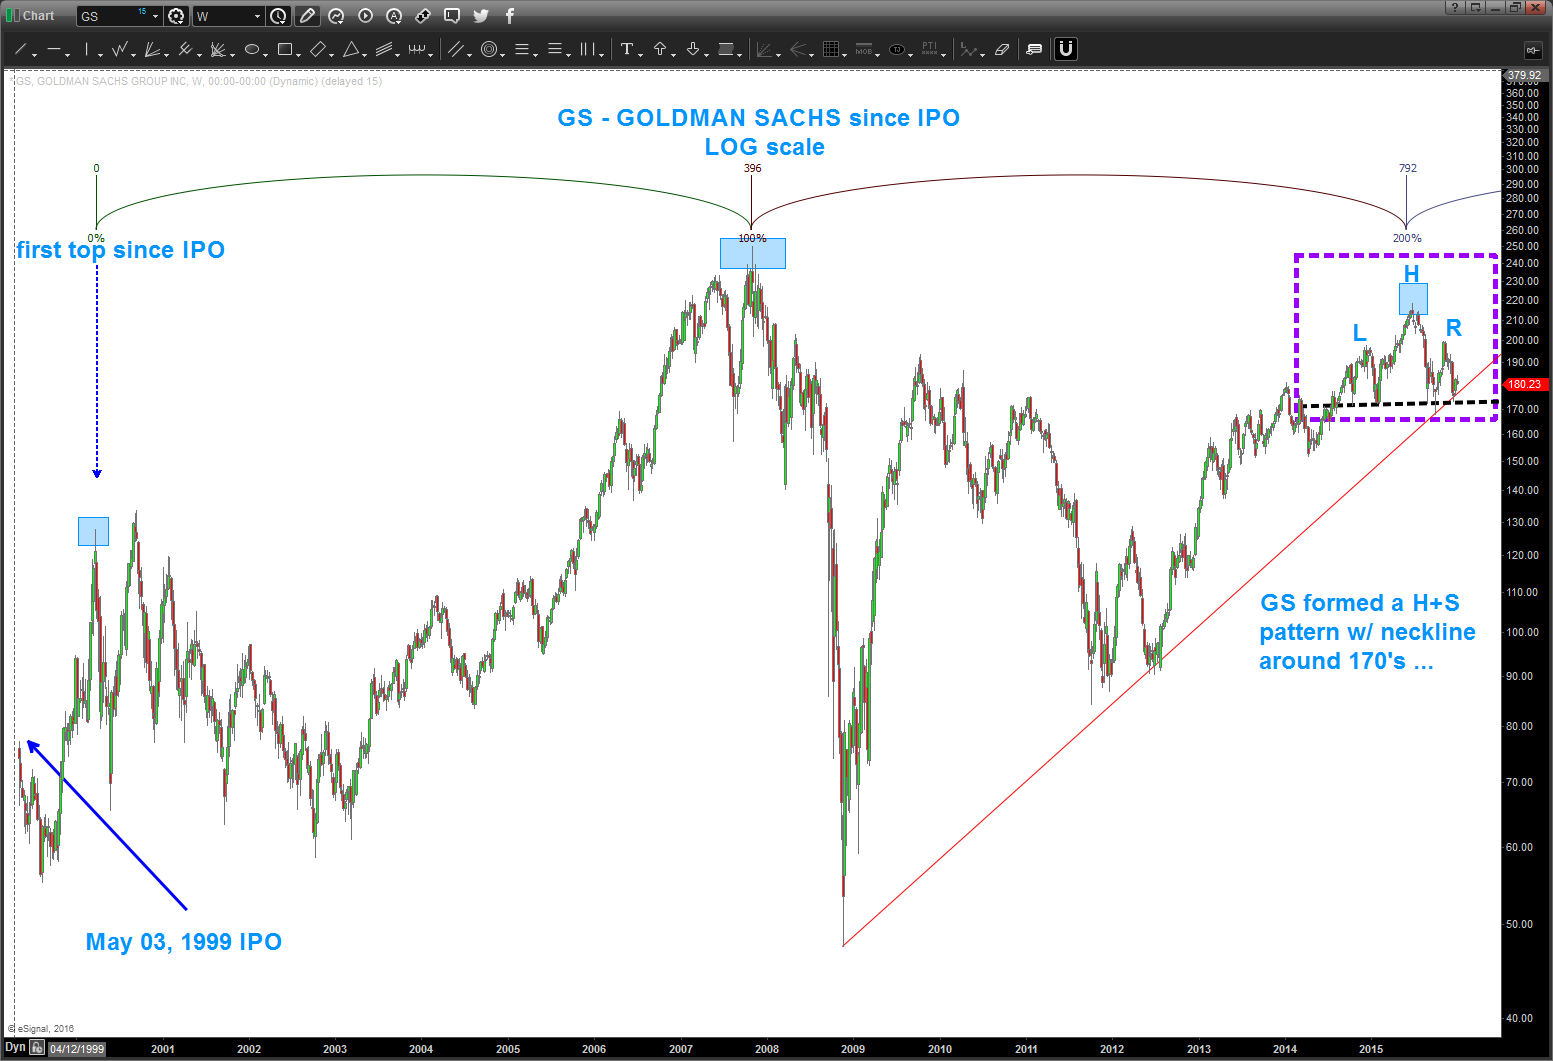
w/ the breaking of the red trend line from 2009 and the neckline at 170 believe GS will be in trouble w/ this occurring.
it very well could go higher and attack my upper target, but just not sure if it’s going to get there … we’ll see.
keep any eye on this one .. first confirmation is a break (daily/weekly close below) of the red trend line and then the neckline around 170. that should put tremendous pressure on the GS bulls, so to speak.
also, note the high-high cycle that is working since the IPO. this “balances” the chart very nicely. my thesis, for now is we are moving back down RIGHT TO LEFT off that first high from the early 2000’s and a PERCENTAGE CORRECTION of that magnitude is a minimal first target if/when we break trendlines mentioned above.
just an FYI .. that “percentage correction” is roughly 122 to 58 or 50% ….so the low 100’s isn’t out of the question.
Under Armour ($UA)
Posted on October 26, 2016 1 Comment
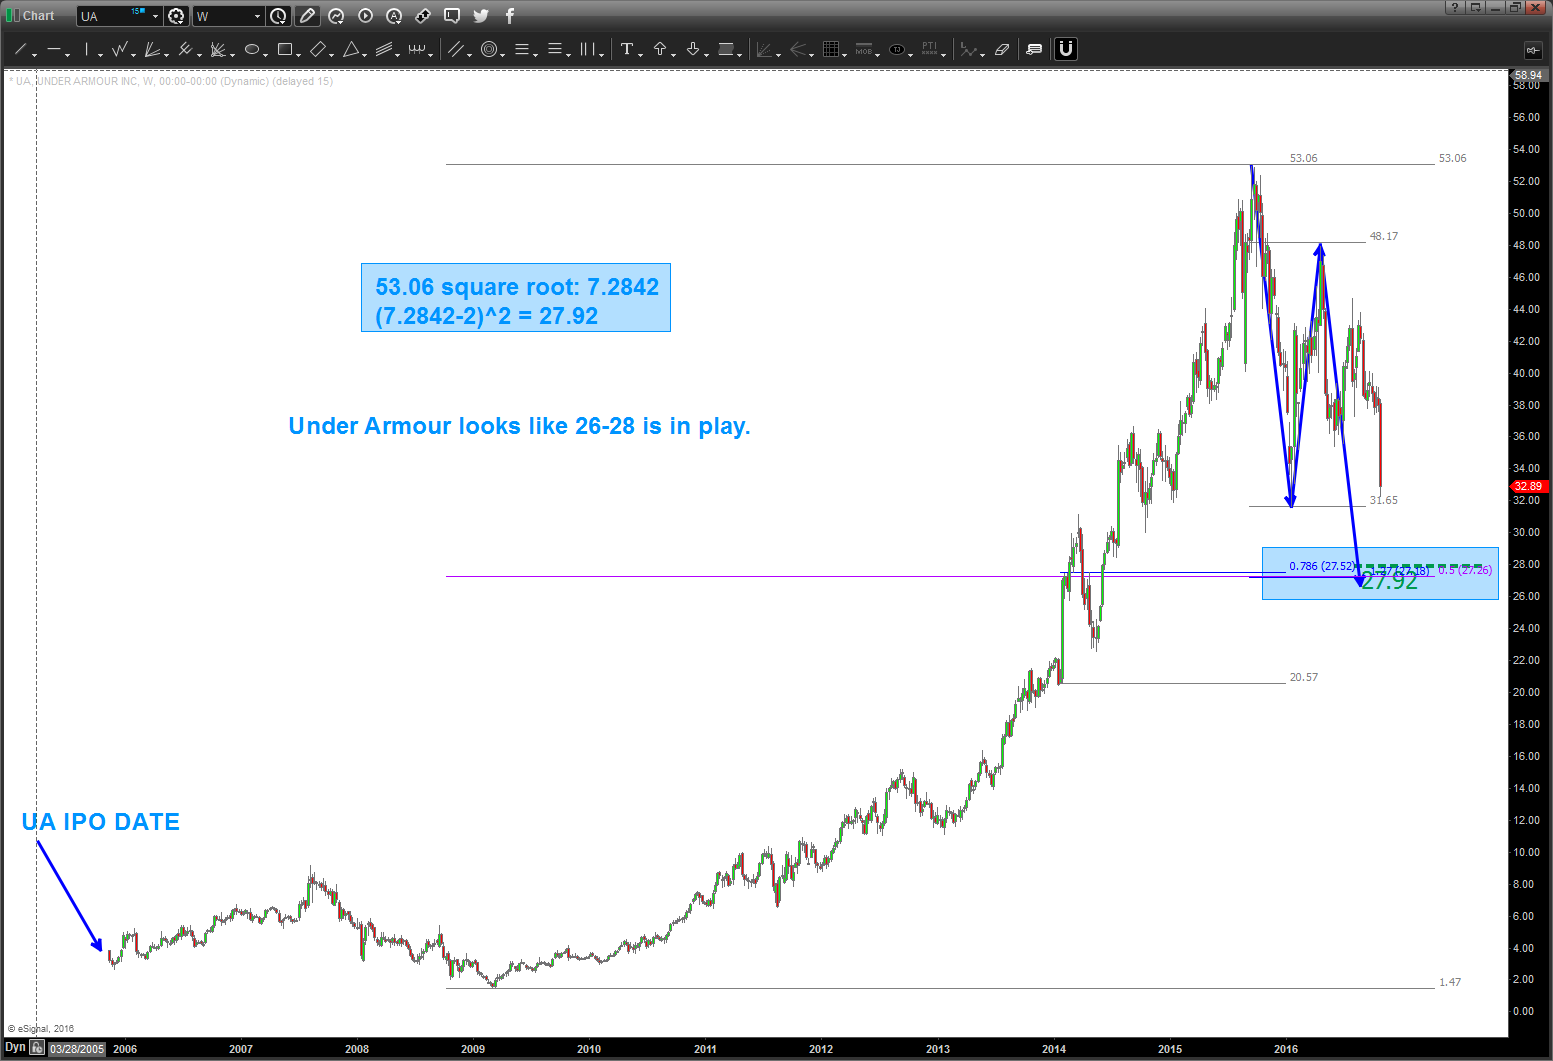
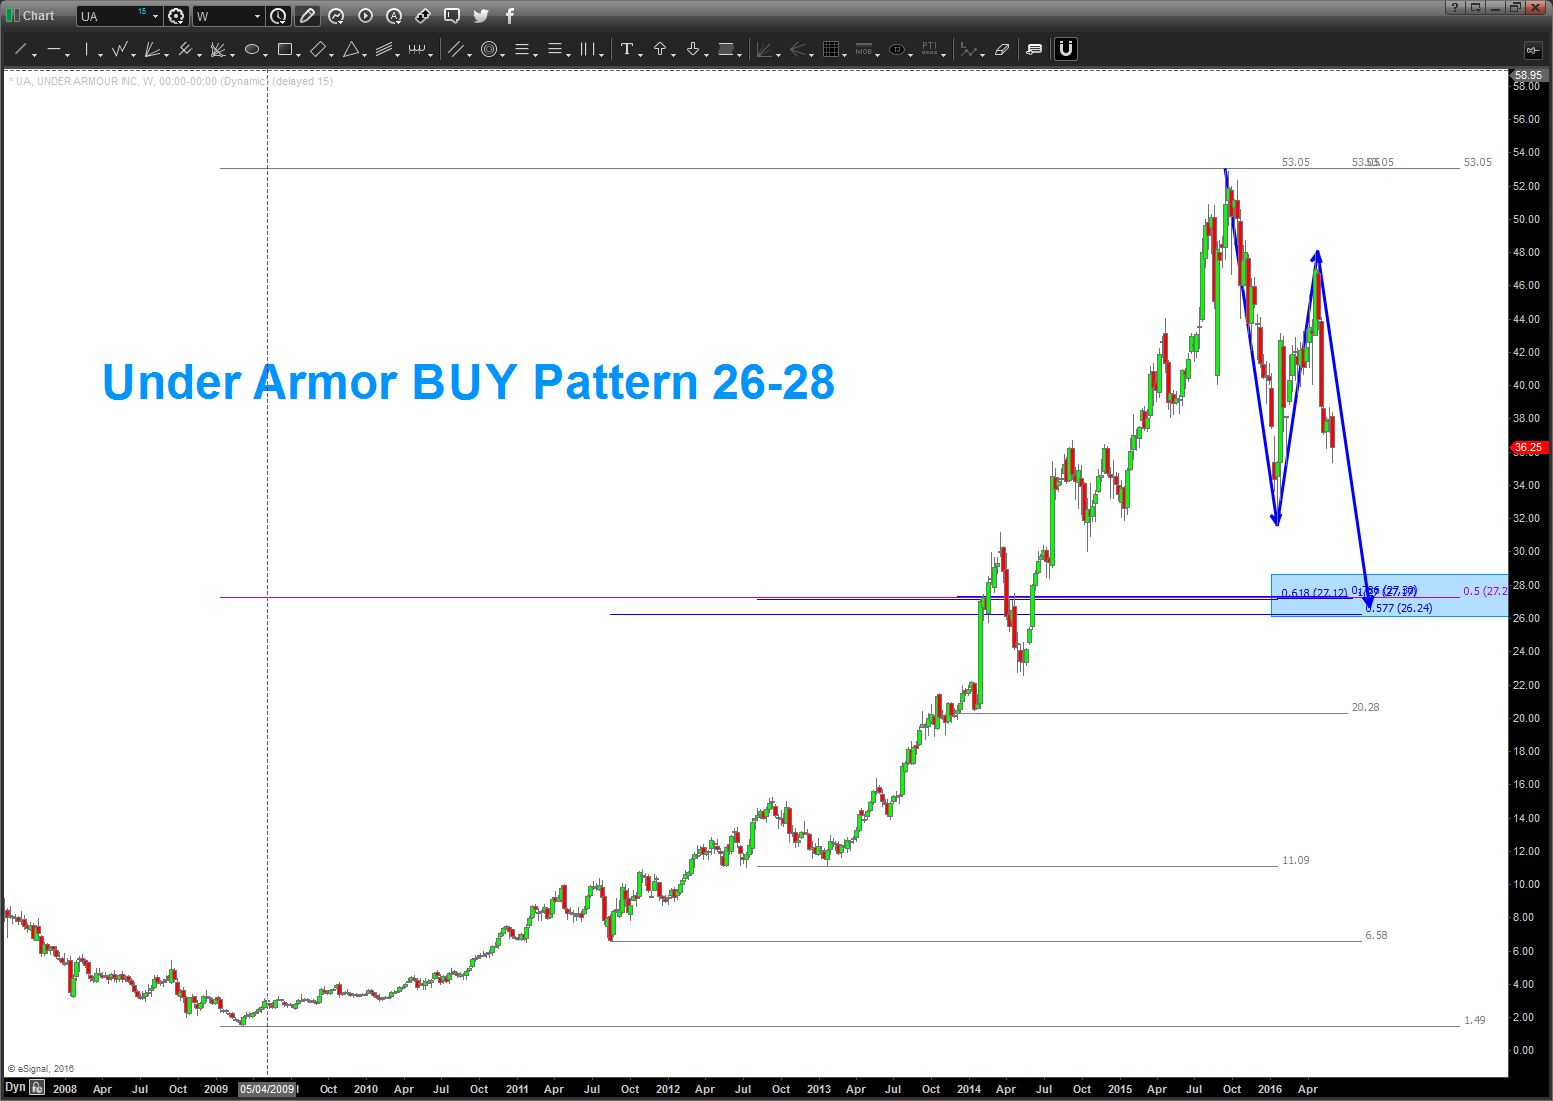
10/25/2016 – I was asked to take a look at Under Armour back in June. I saw this pattern – again – had ZERO idea if it would get down there. As a pattern recognition dude, that’s the pattern .. .as of today, appears it’s going to make that level. Some thoughts …
- this is the first ‘true’ BUY pattern since it’s IPO and after a spectacular and somewhat parabolic run.
- caution w/ the size of the candles coming down – that denotes thrust and patterns fail when huge thrusts hits the levels
- note the square root target hits – basically – right at the BUY pattern. That, my friends, is good.
- remember, the square root target is using the Gann Square of 9. One trip around the wheel is equal to the square root of the base number (in this case the high of 53.06) -2 and then resquared. That’s how it works …
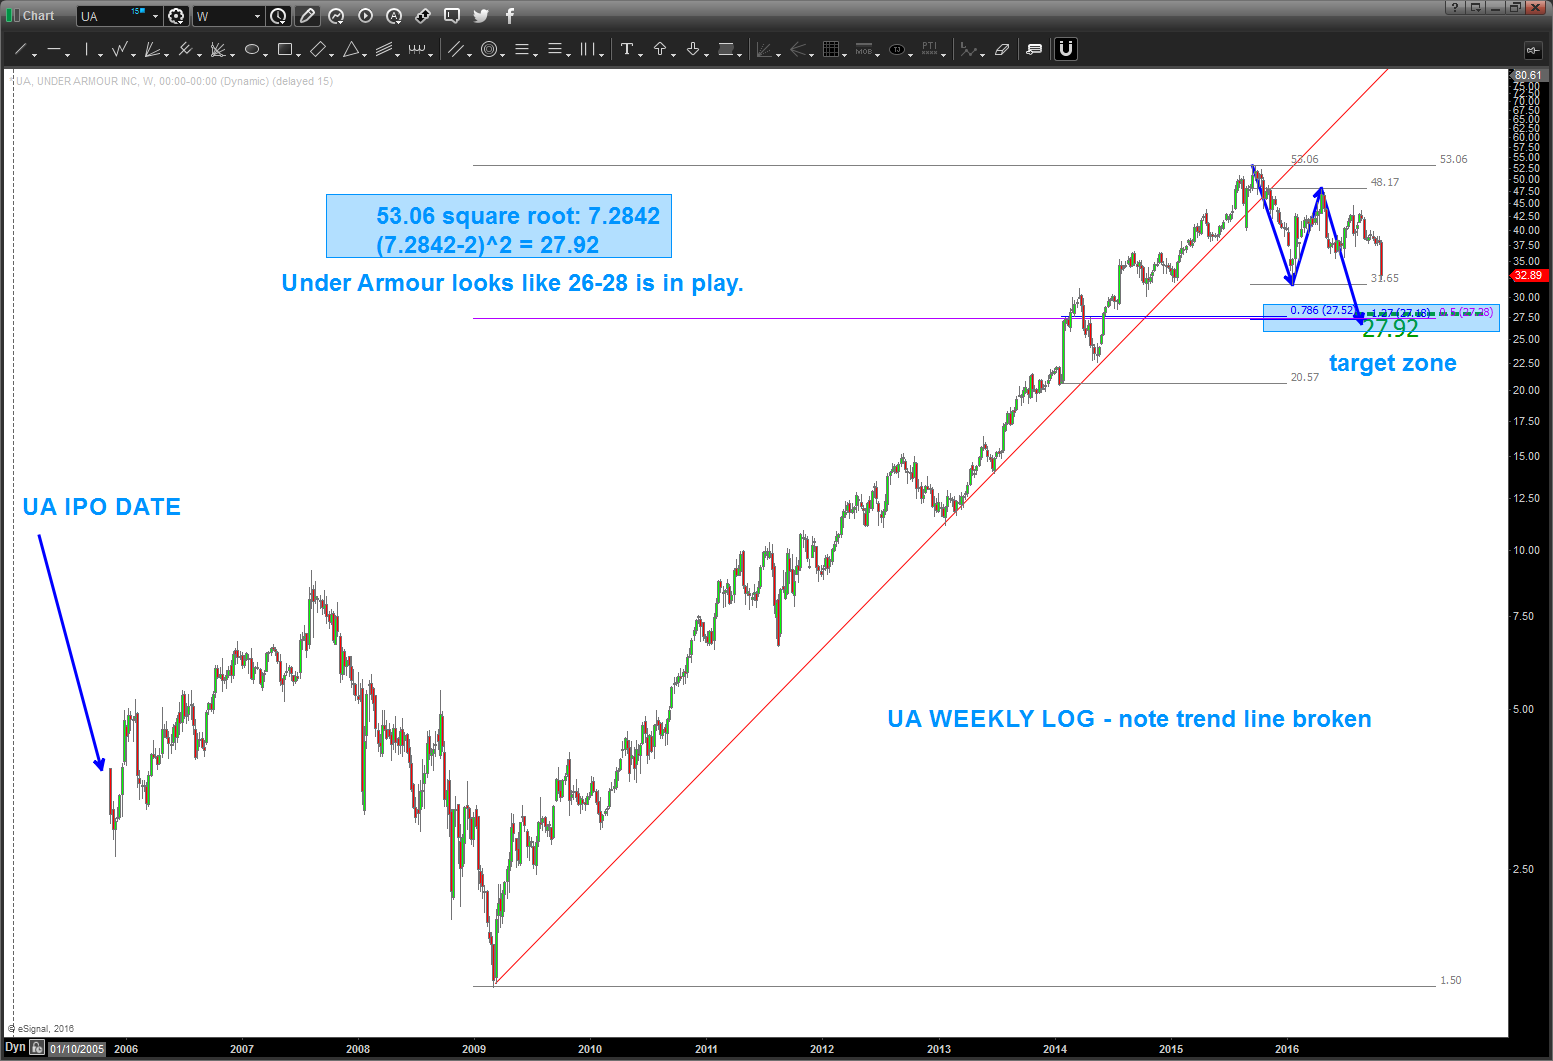
- the second chart is a long term log look at UA. NOTE – it broke it’s fabulous run .. so, this selling pressure is expected. that’s what happens when long term log trend lines are broken.
- this pattern fails – IMHO – with a daily close below 25.
Loonie, OSX, Crude – time for another inflection? UPDATE
Posted on October 25, 2016 Leave a Comment
10/24/2016 – target hit on the USD vs LOONIE. Watch this one carefully. It “appears” that everyone is thinking of a big breakout but, as you can see, we had multiple targets coming into play and they were hit today.
WATCH FOR A DAILY CLOSE BACK BENEATH CHANNEL OR THE .382 as shown.
go ahead and follow this link if you want to follow some real time PATTERNS w/ technical analysis and the correlation between the 3 items in the subject line: https://bartscharts.com//?s=LOONIE
appears we are at another critical juncture:
- Crude – 2 buy patterns present.
- OSX – buy level indicated
- USD vs LOONIE – multiple patterns present for another move in LOONIE strength.
again, these are just patterns folks … but we have a very clearly defined demarcation line for the next move to begin.
stay tuned
Bart
charts below, let me know if you have any questions.
FXB
Posted on October 23, 2016 1 Comment
right now – WAIT – on FXB.
note, it like bullish divergence … i.e. price goes lower and the RSI rises.
believe we’ll find support in the 110-114 and 94-95. w/out bullish divergence would hold off, for now.
Bart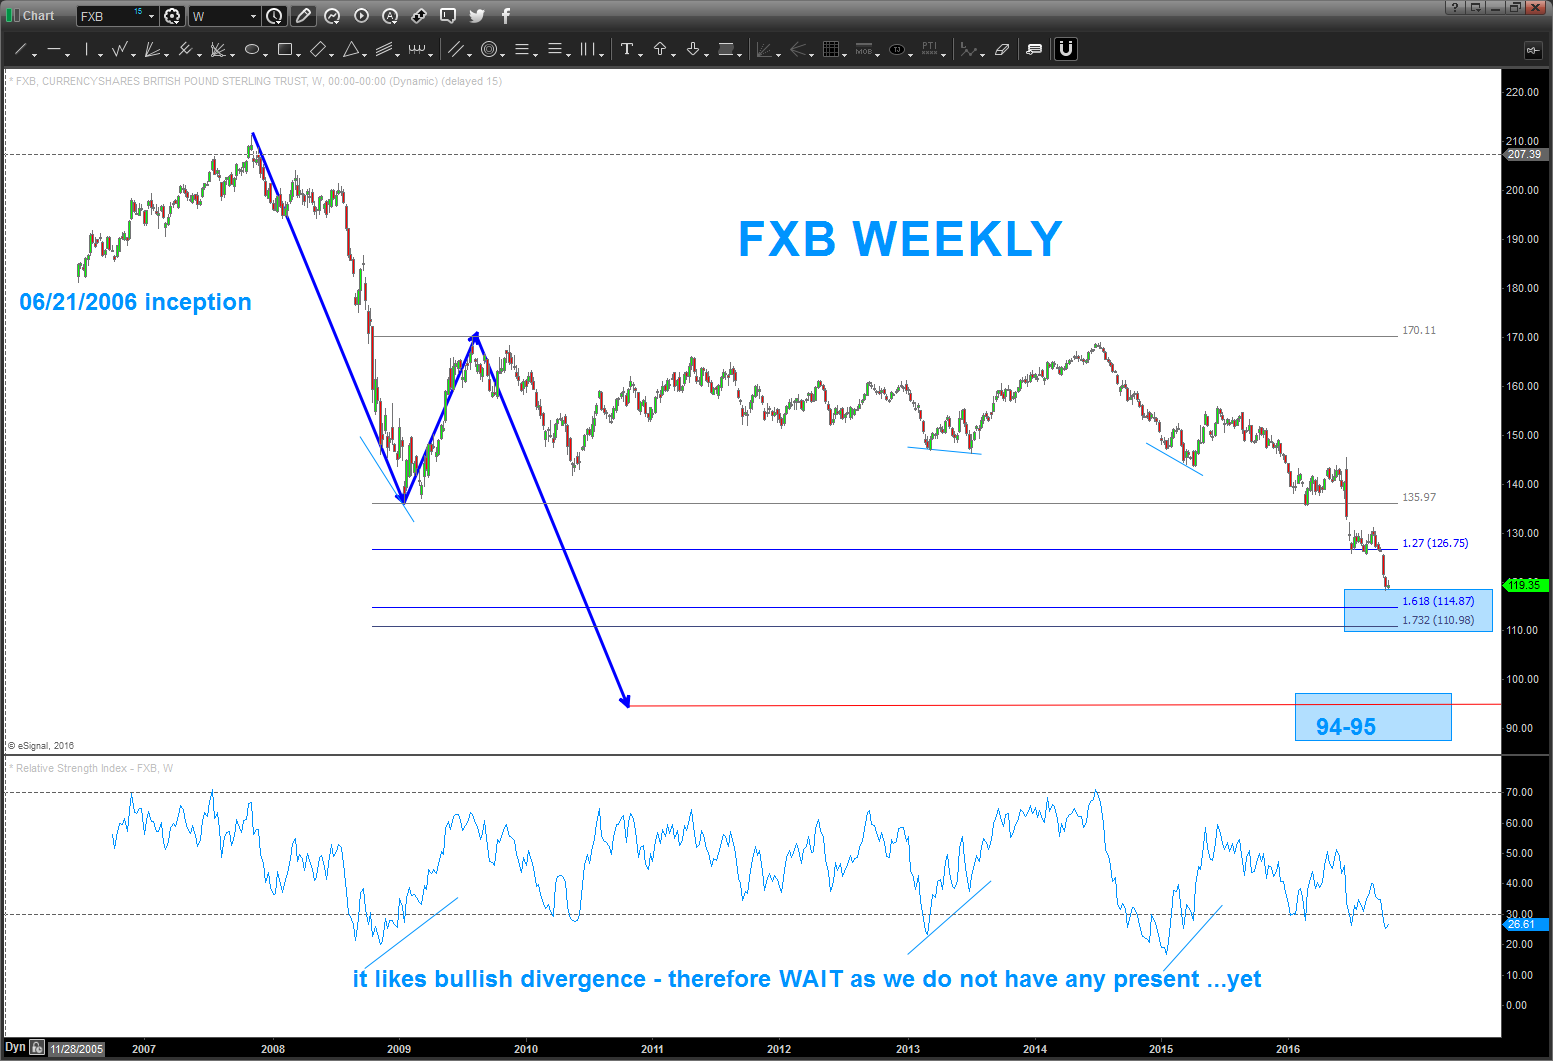
“With You …”
Posted on October 23, 2016 3 Comments
“how is paddleboarding?”
this entire trading journey has been one amazing adventure … it’s taught me so much about natural law, myself, my weakness, drawdowns, keeping investors, losing investors, making money, losing money, pitching in NYC, pitching in Texas, the River X Group, the GTA Group, the 3 BILLION DOLLAR LUNCH (yes, ask me about it) … man, what a ride.
but, as I was putting together a presentation for some people that I’ll do on a webinar, it came to me that – in fact – this is NATURAL LAW and everything is VIBRATION. PERIOD …it’s simply amazing this journey called LIFE.
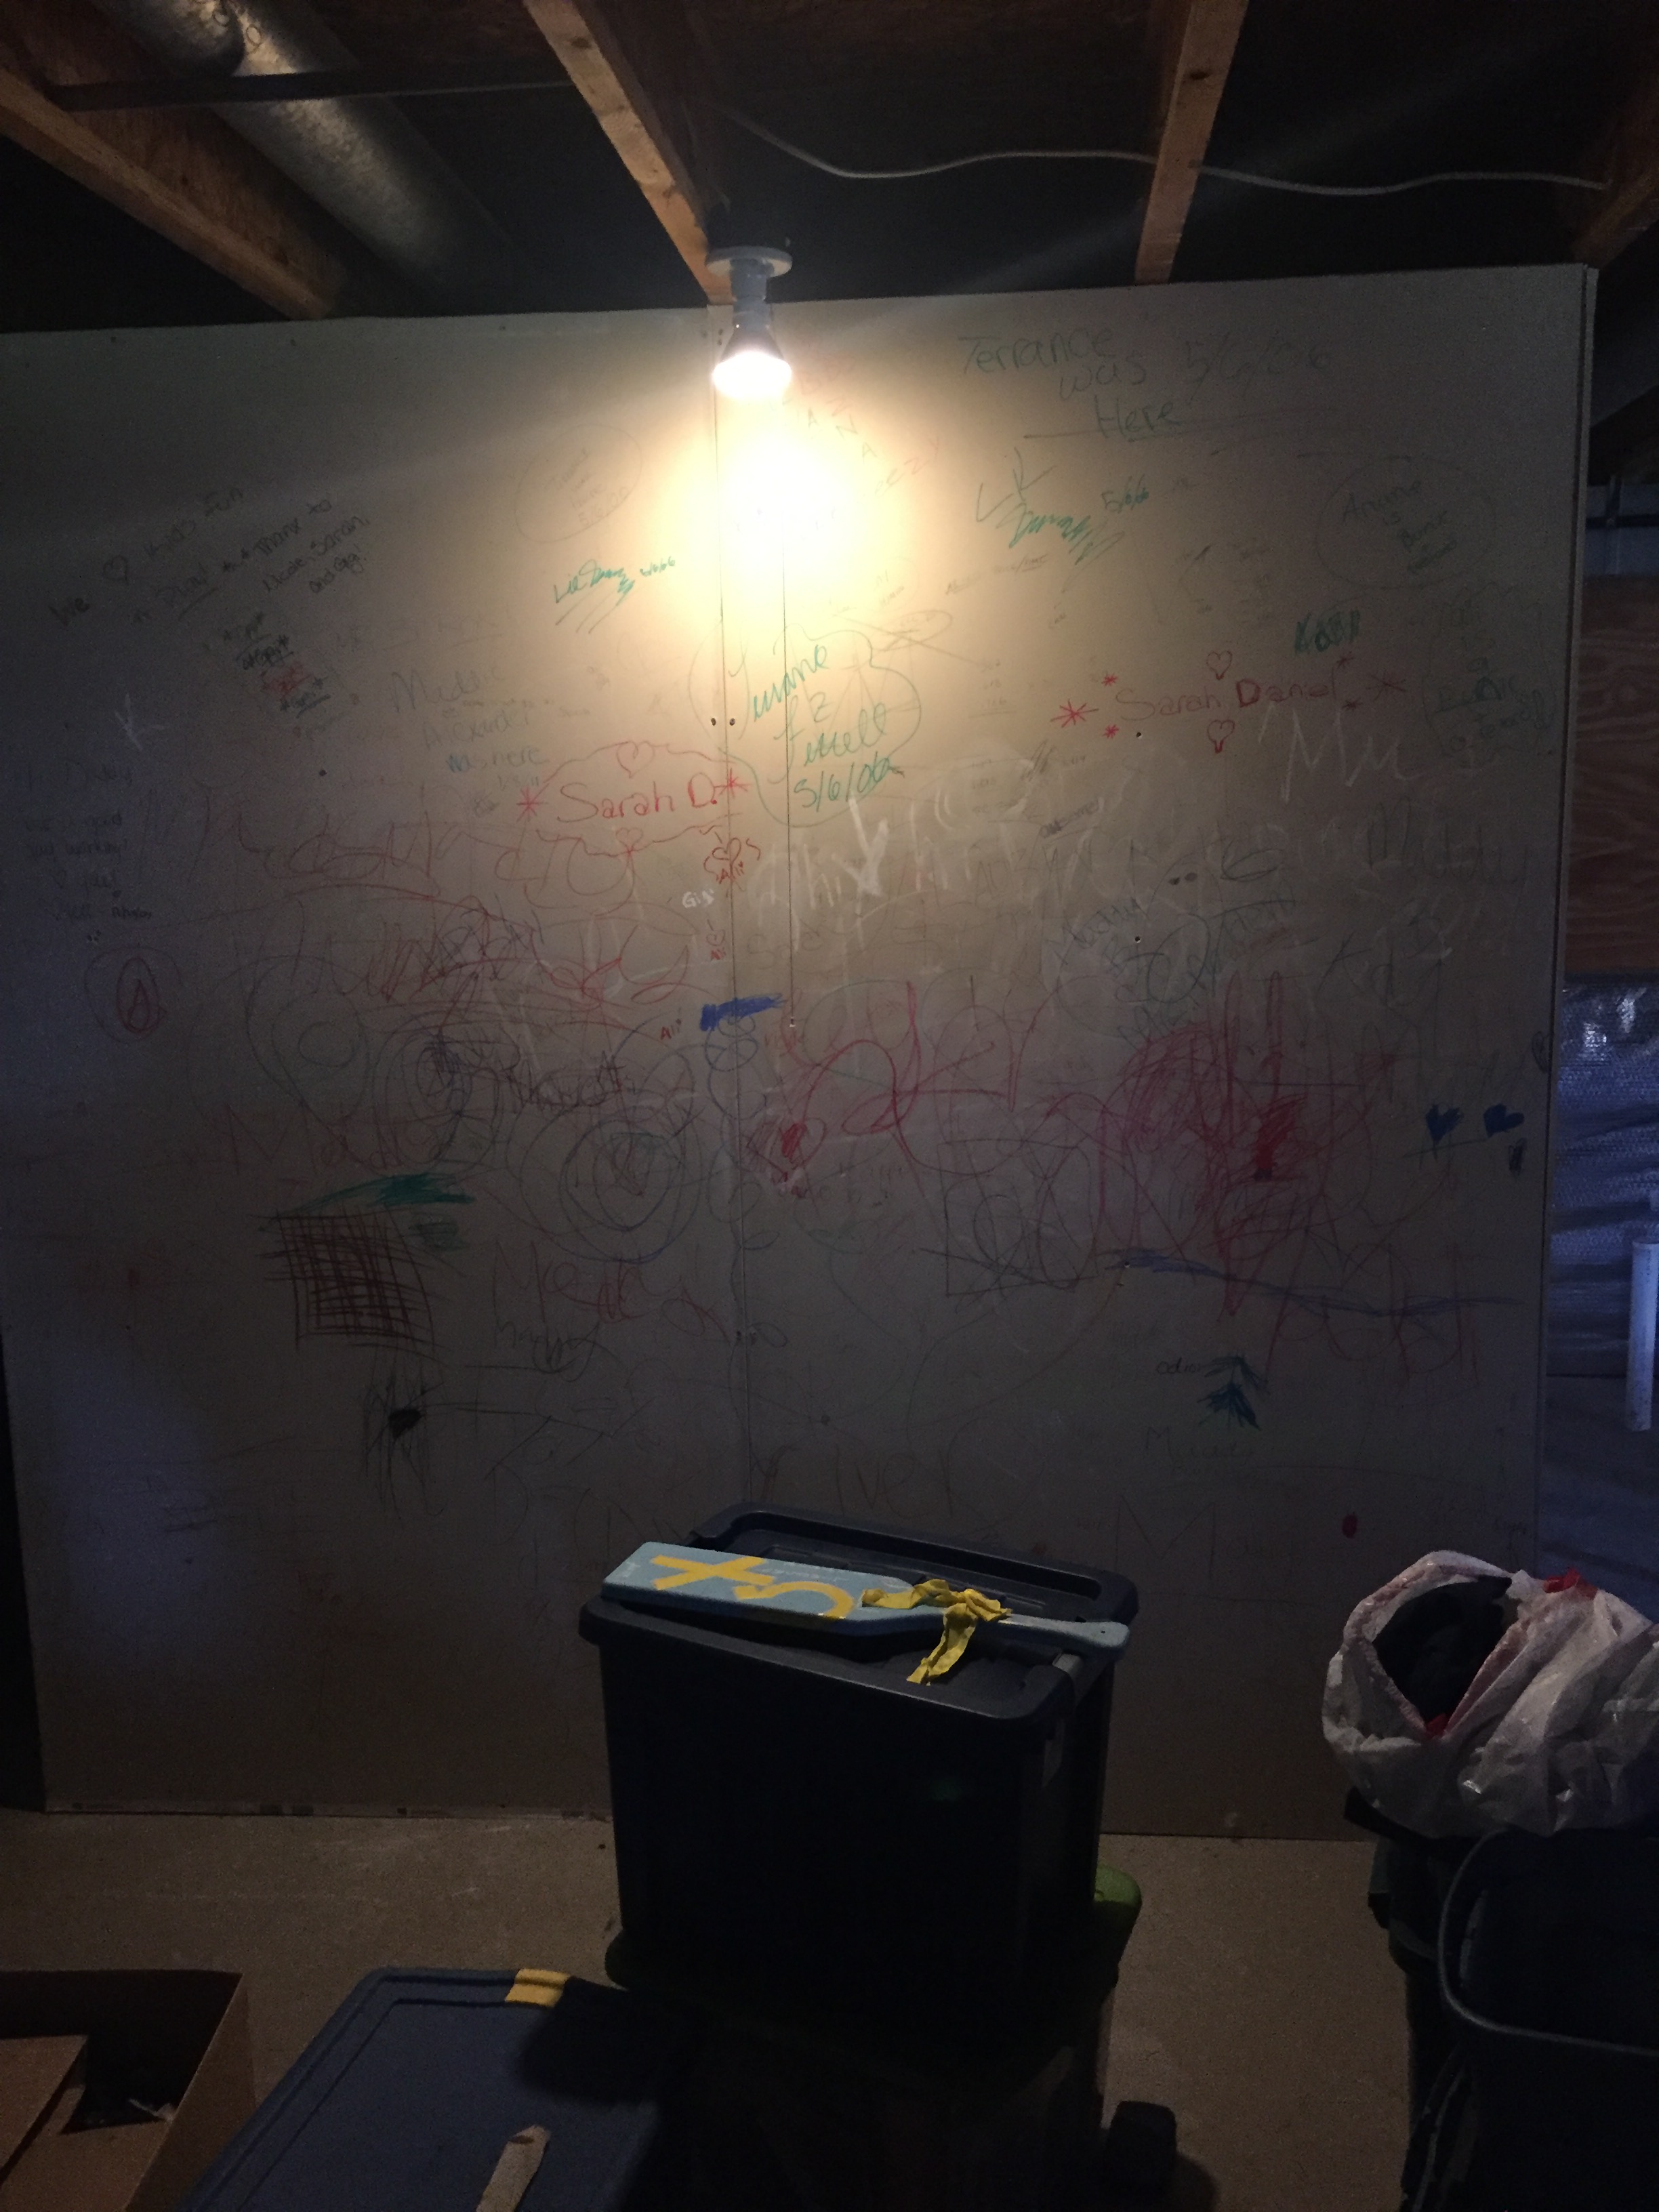
here’s where it all began for me … yes, an unfinished basement in Northern VA where I had my buddy Hose help me hang some drywall and some frames. it was a very dark corner of the house and I would go in there, put Pink Floyd on and just “figure it out.” My kids would write on the walls and have all kinds of fun w/ it .. didn’t even know they were behind me as I was so immersed in what? Immersed in understanding the meaning of life …there, I said it.
I learned, thru trading, two principles to being a successful “fill in the blank here” (hint: there is where you put trader)
- THERE IS ONLY LOVE
- THERE IS ONLY GOD.
NOBODY KNOWS when the journey around the sun will end physically…but in learning about vibrations, music and sacred geometry I’ve come to EXPERIENCE the other side and realize YOU will never end.
WITH YOU DUDE .. you know who you are and keep rolling and laughing and loving. OK?
I AM
Bart