$PCLN update 10/9/2016
10/9/2016
PCLN found support on the “polarity” from the IPO and, essentially, negated the mirror image foldback pattern discussed below. What now?
If you take a look at the long term chart, again, you’ll see some powerful sell patterns all coming together. as for right now, appears we are in no mans land w/ no pattern (buy or sell) present.
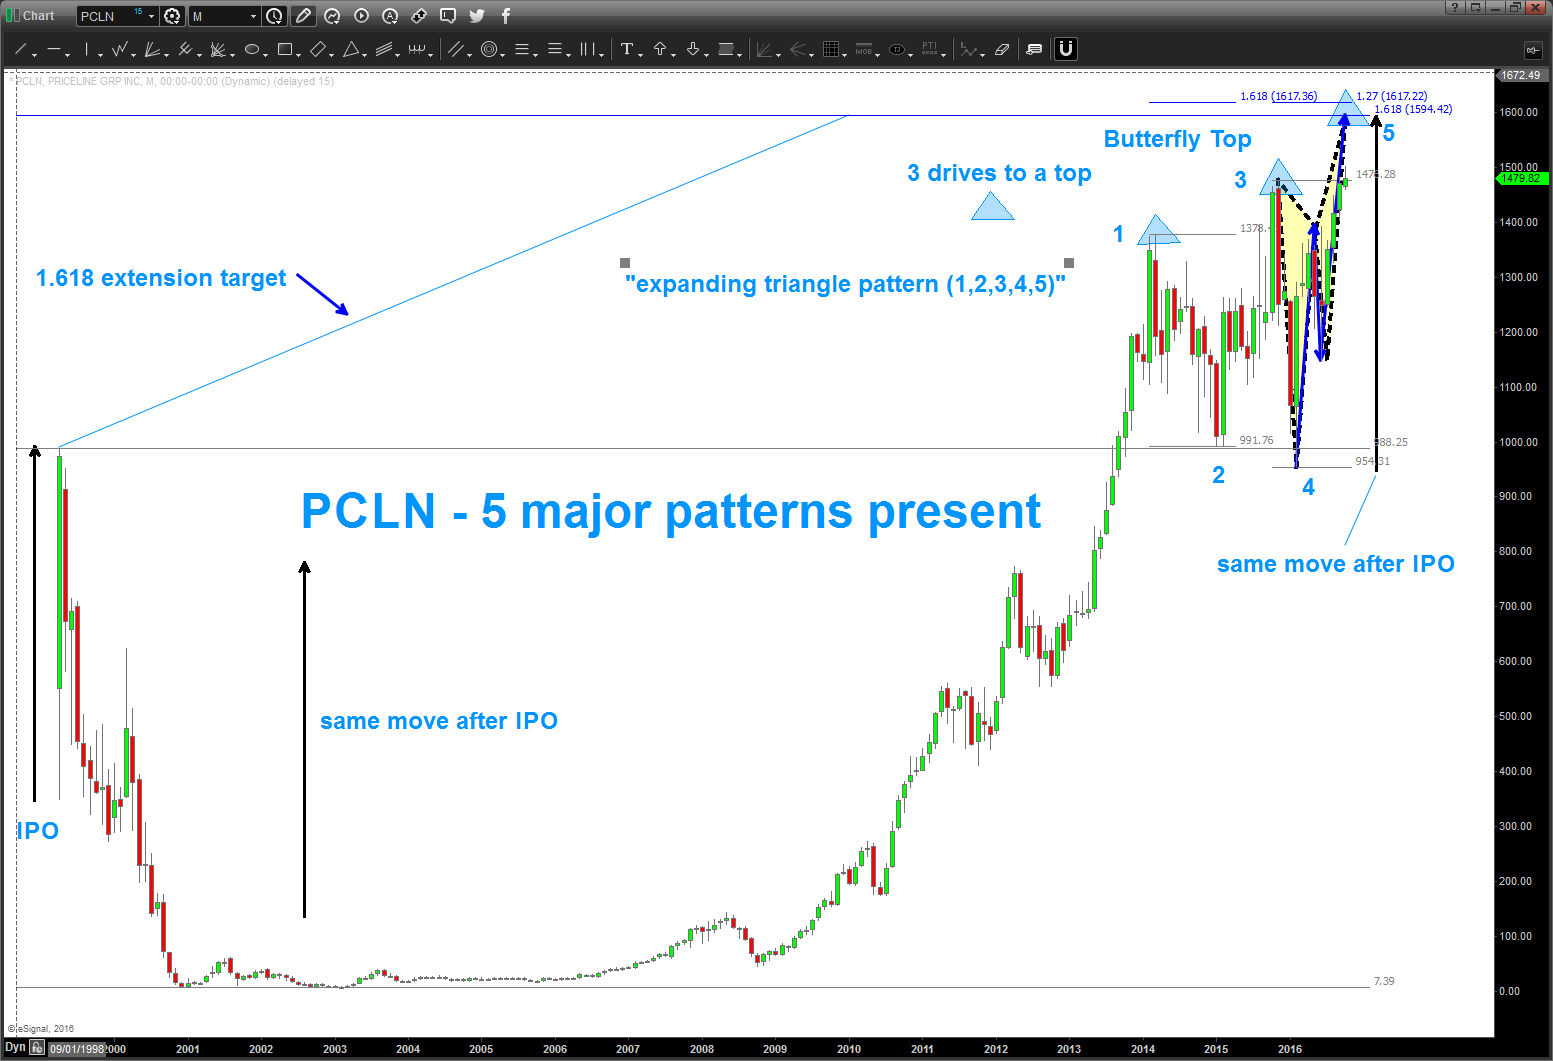
here’s the patterns present:
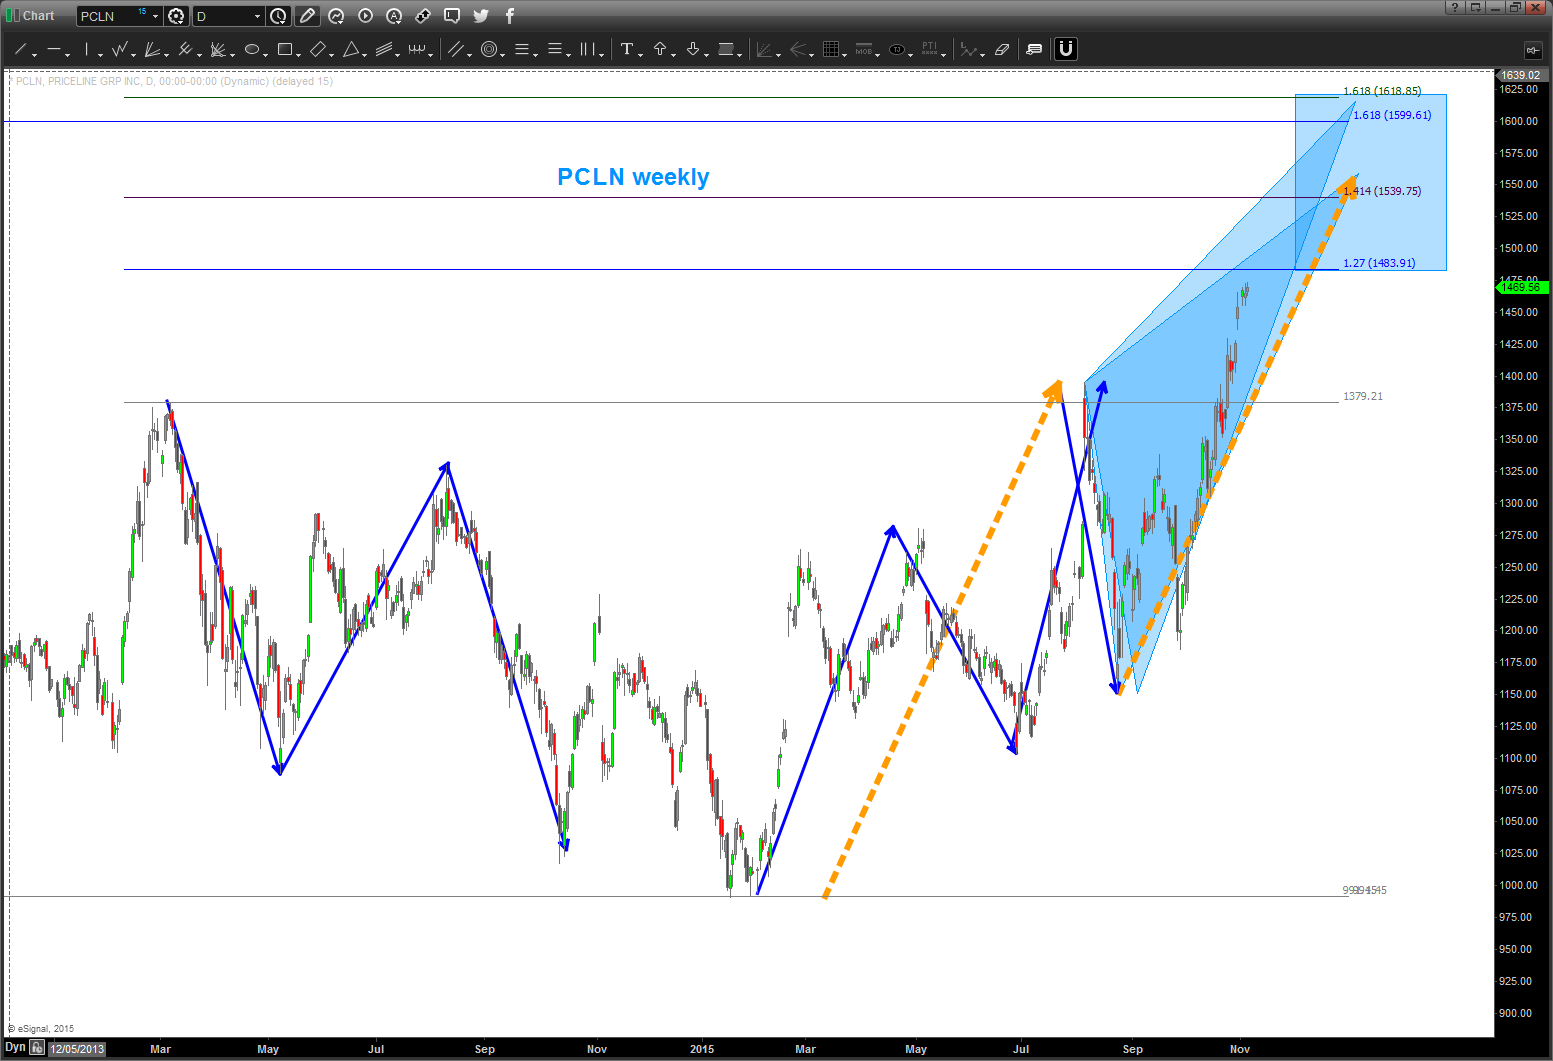
- 1.1618 extension from the IPO high
- note the black arrow going up from the post IPO low to the IPO high. That same “move” is present into the target area. the black arrow is “copy” and “pasted” from the IPO to current market prices.
- 3 drive to a top – the blue triangles
- 1,2,3,4,5 reverse point wave
- a “perfect” Butterfly Sell pattern – (it has an AB=CD present in the last leg of the Butterfly)
who knows if it will get that high right now .. but certainly realize that 1600-1625 has a TON of resistance.
B
02/01/2016
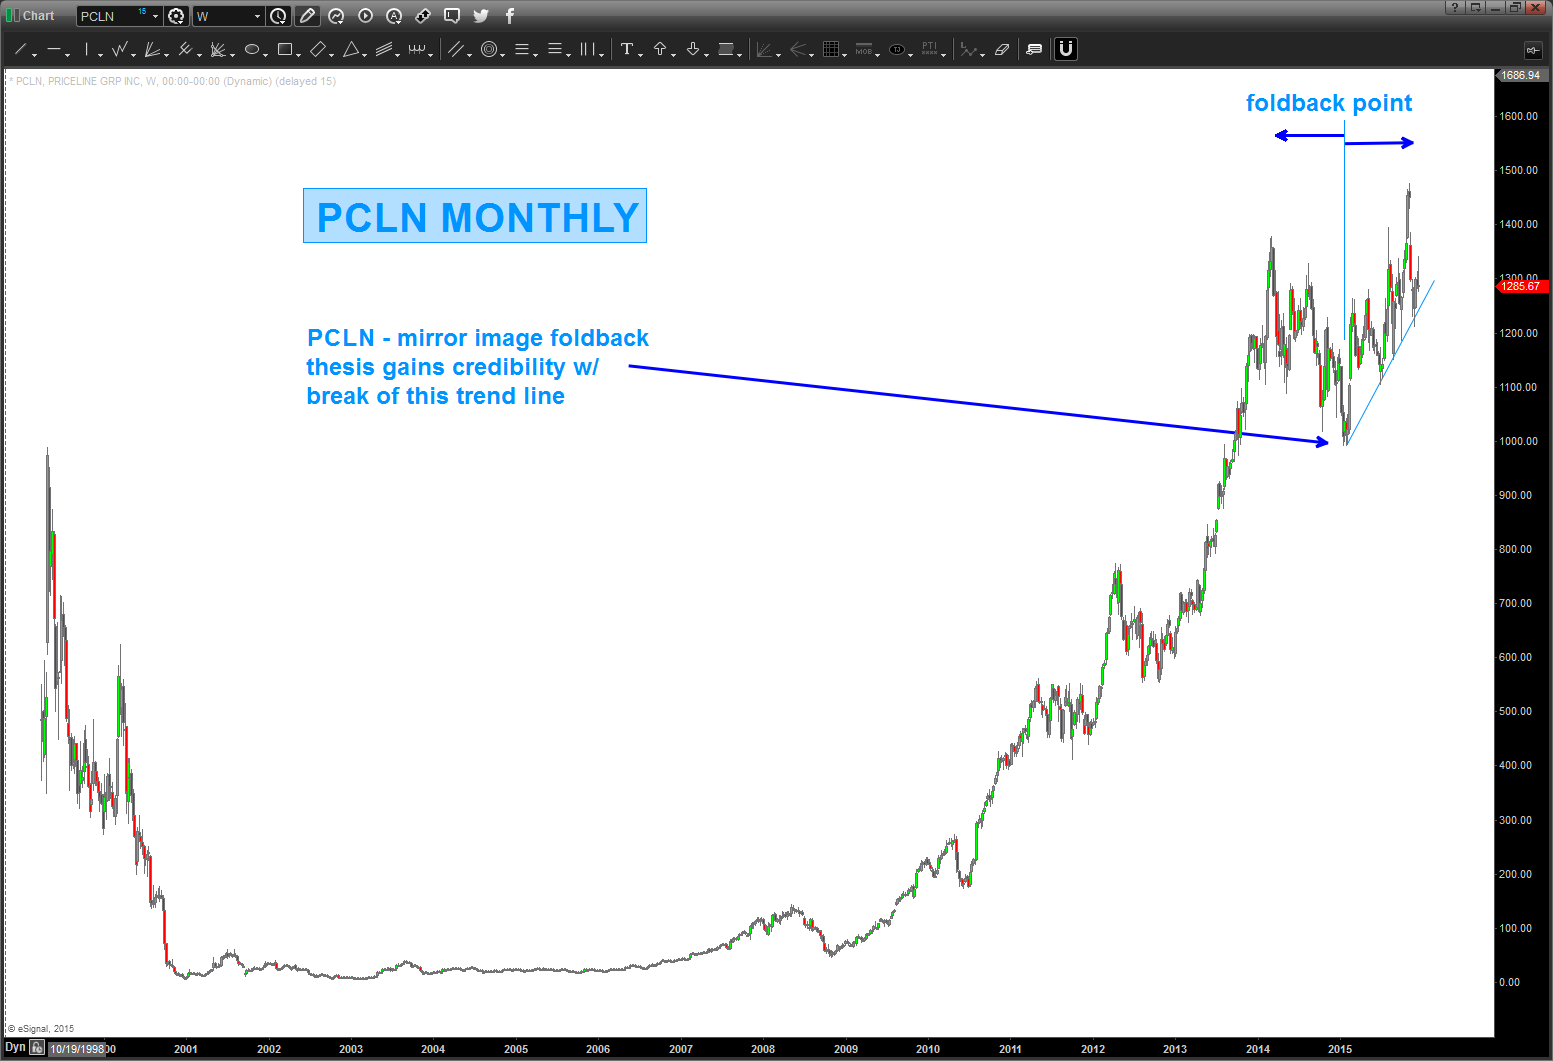
as you can see below, the light blue trend line below was taken out. now we are approaching major support as shown by the polarity principle. some bid thrust/candles going into this level so this will be a key test in the coming days/weeks. if we lose this level, then expect 1.27 level to be attacked in the high 800’s.

12/20/2015: update to PCLN.
one can see that this has been an amazing rocket ship.
one can also see below that I was “seeing” a top coming in and tried the mirror image foldback, which from a price perspective DID NOT work. then, you can see that I was “seeing” a butterfly pattern and that missed the target area by a few bucks.
so, in summary, let’s watch the key low to high trend line shown in the chart below. also note the TIME symmetry around the foldback points. I missed that below, but that actually lends some credence to a potential big top.
this one has been tough .. but, then again, when you go from 3 dollars to 1450+ it’s going to take some time to digest.
anyway, for those who asked me, hope this helps w/ the gameplan for $PCLN.
Folks, this mirror image got smoked. Much like the mirror image for Natural Gas … the mirror images fail at the inflection points and $PCLN has rolled thru the pattern. ERASE … ERASE…ERASE.
Where are we now?
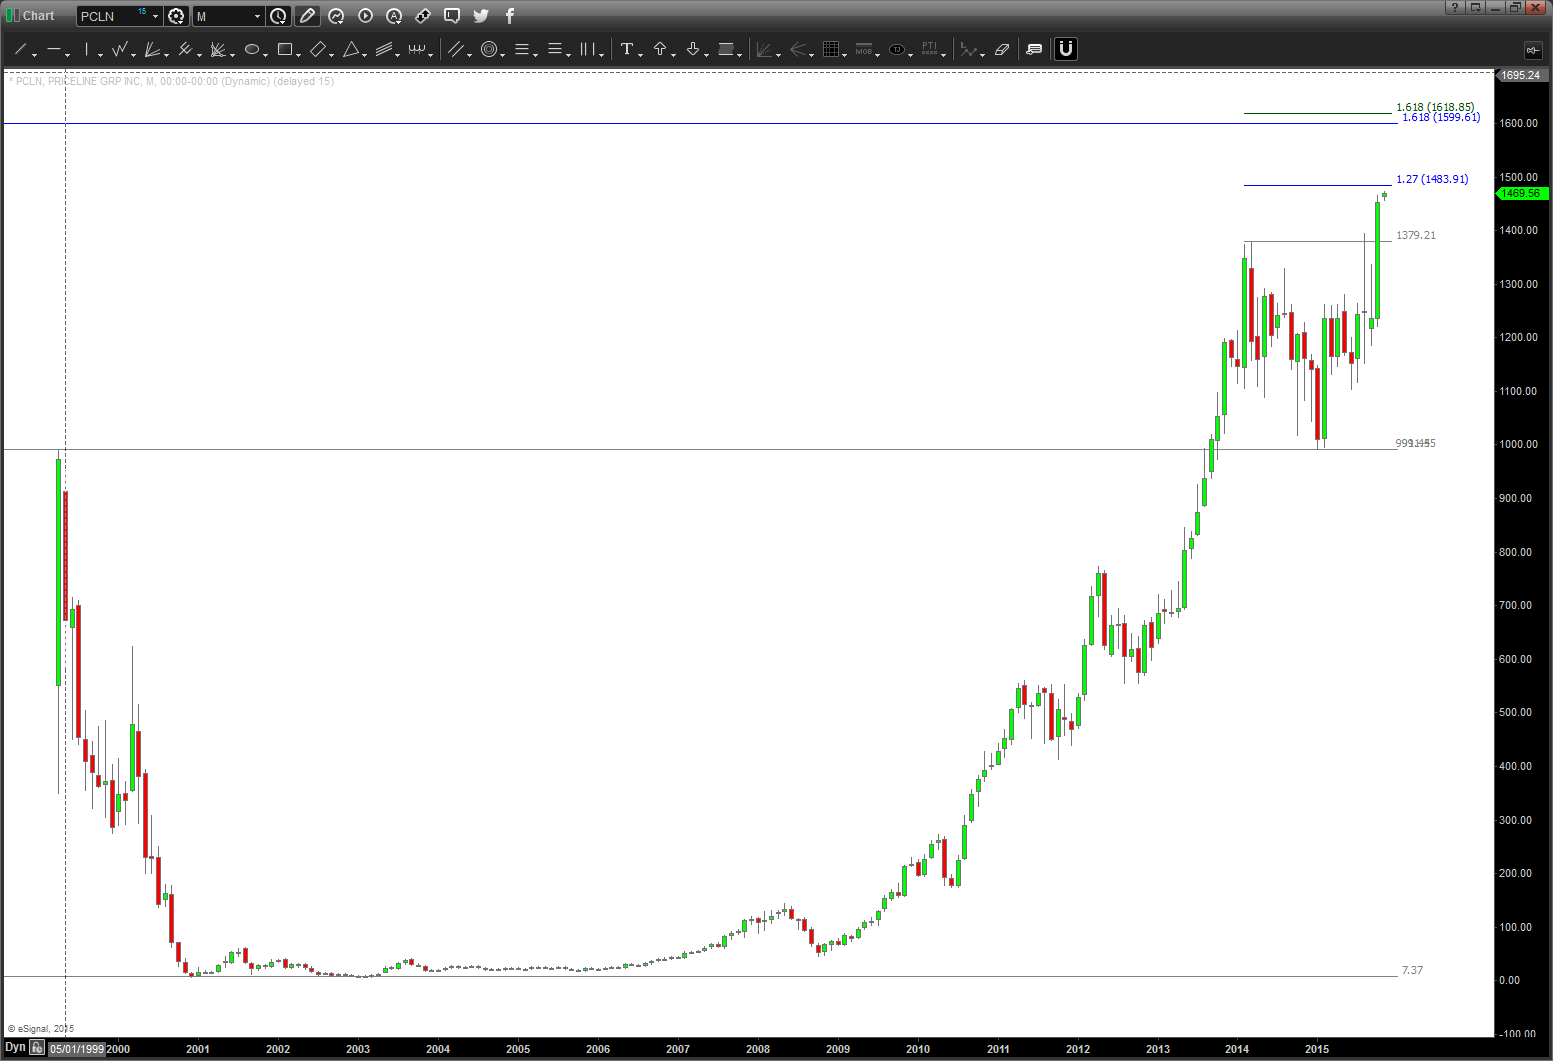
Well, if we look at the candles you’ll see the 2nd largest monthly candle since the IPO occurred last month (OCT) So, we have 1484 coming in but it sure looks like momentum and thrust will carry it to the 1600 level. I’m going to spend some time on this one over the next couple days …
here’s the MONTHLY picture …
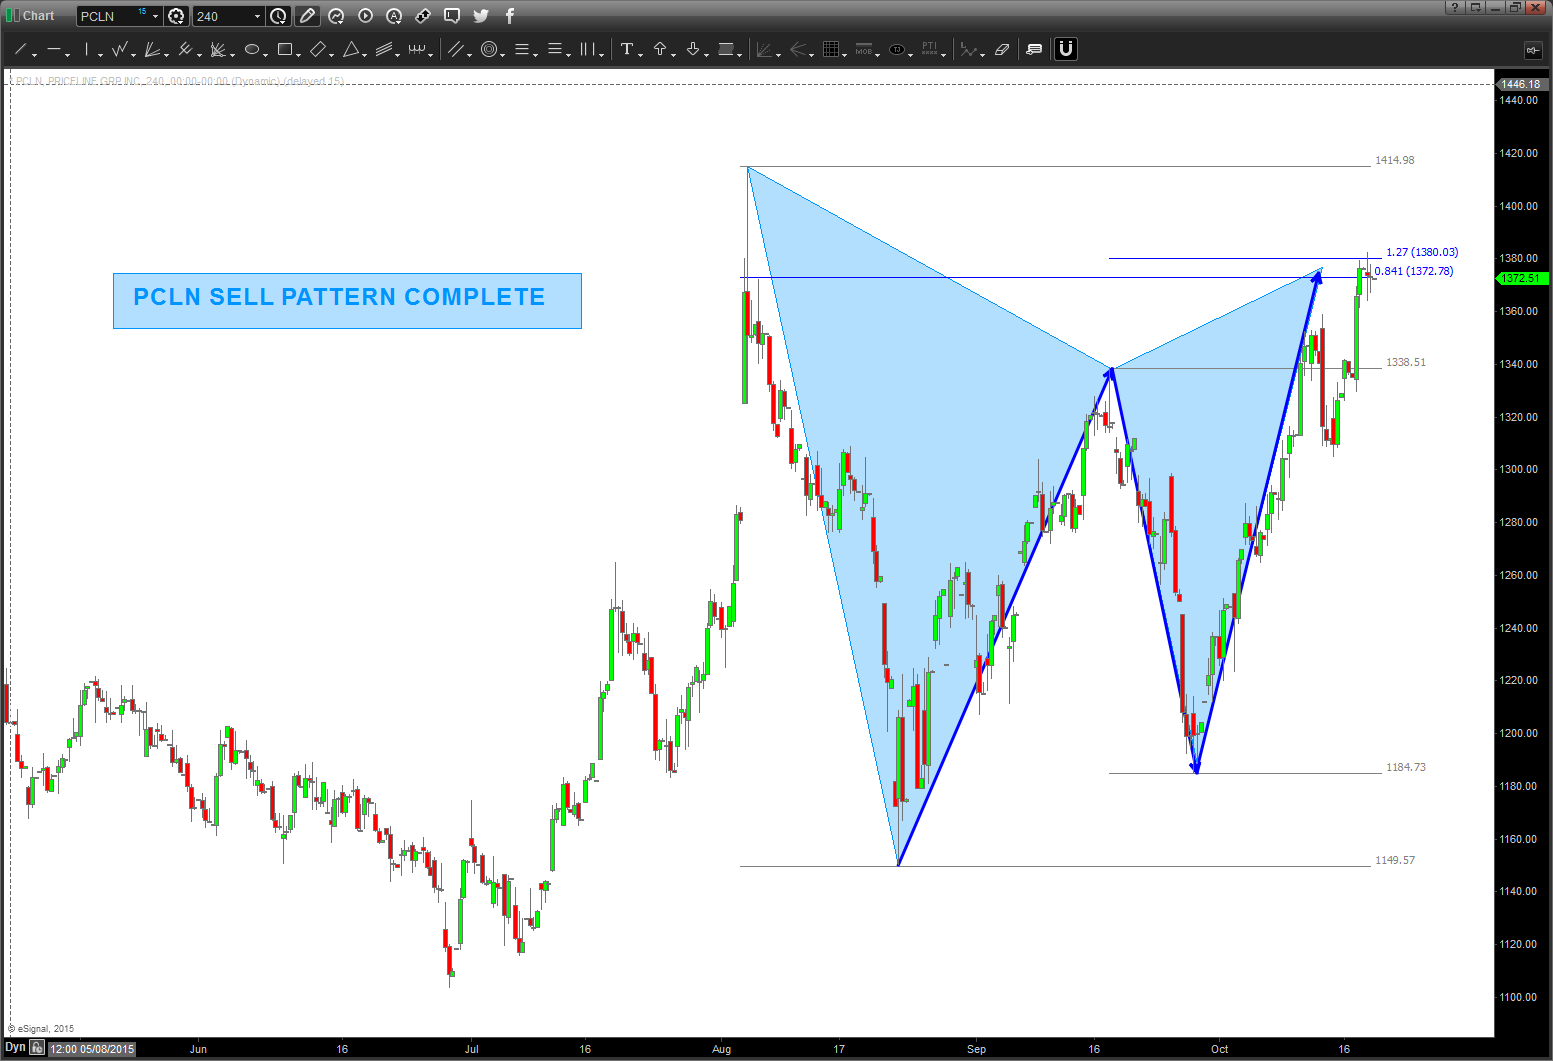
IF the mirror image foldback is in play THEN this pattern needs to hold and start down. a move below 1360 would bolster conviction that the mirror image mentioned earlier is in play.