DPZ .. updated
Posted on December 9, 2016 Leave a Comment
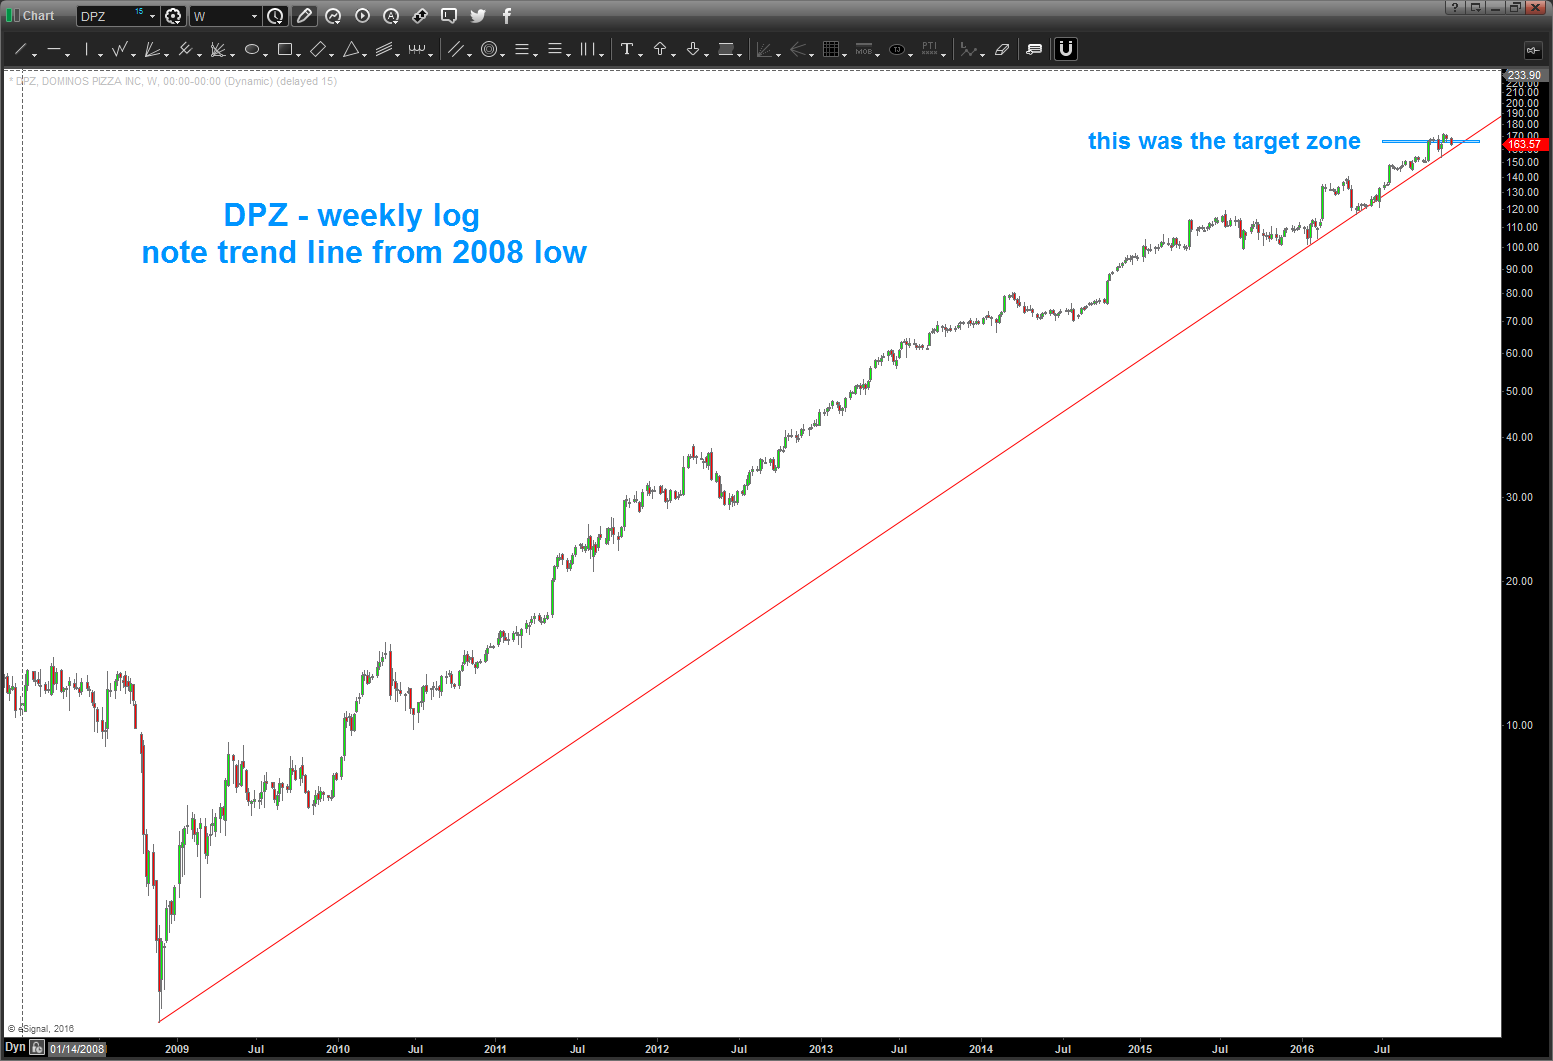
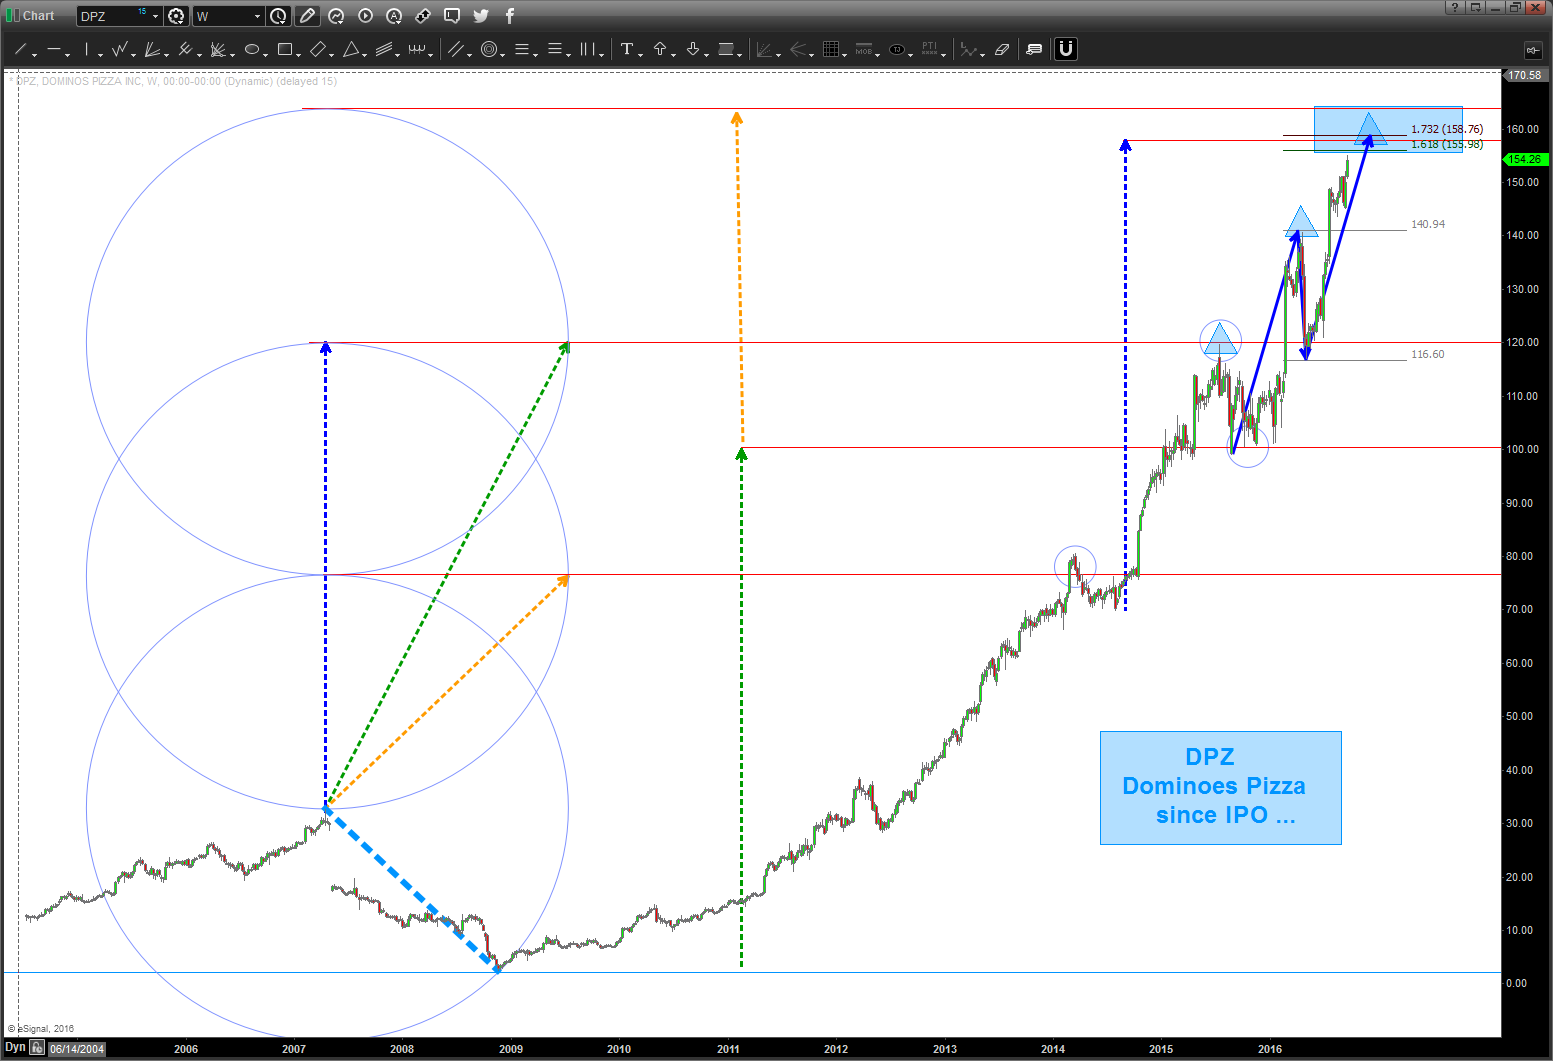
12/9/2016 – area shown in the original post was exceeded by a percentage point or two but we should be a stiff resistance w/ DPZ. Note, the long term trend line from 2009. a weekly close below this would signal the trend is weakening or done.
heads up the party’s going into the late night … might want to call Uber
Posted on December 7, 2016 Leave a Comment
12/17/ 2016 – it’s been since June that I’ve posted about the ratio. for more information see below …bottom line is when the party is raging the “big dudes” bail out of conservative plays (consumer staples) and roll into tech and other more ‘risky’ assets. If you look at the below – purely from technical terms, we are doing nothing more than returning to the break out resistance (now support – polarity) that held for 13 years. additionally, the rsi is at the ‘usual’ level where it has held as support – every single time since the inception of the XLF ETF. So, yes the party is raging, but it might be time to move to water or soda or download the uber ride home … this hangover is going to hurt.
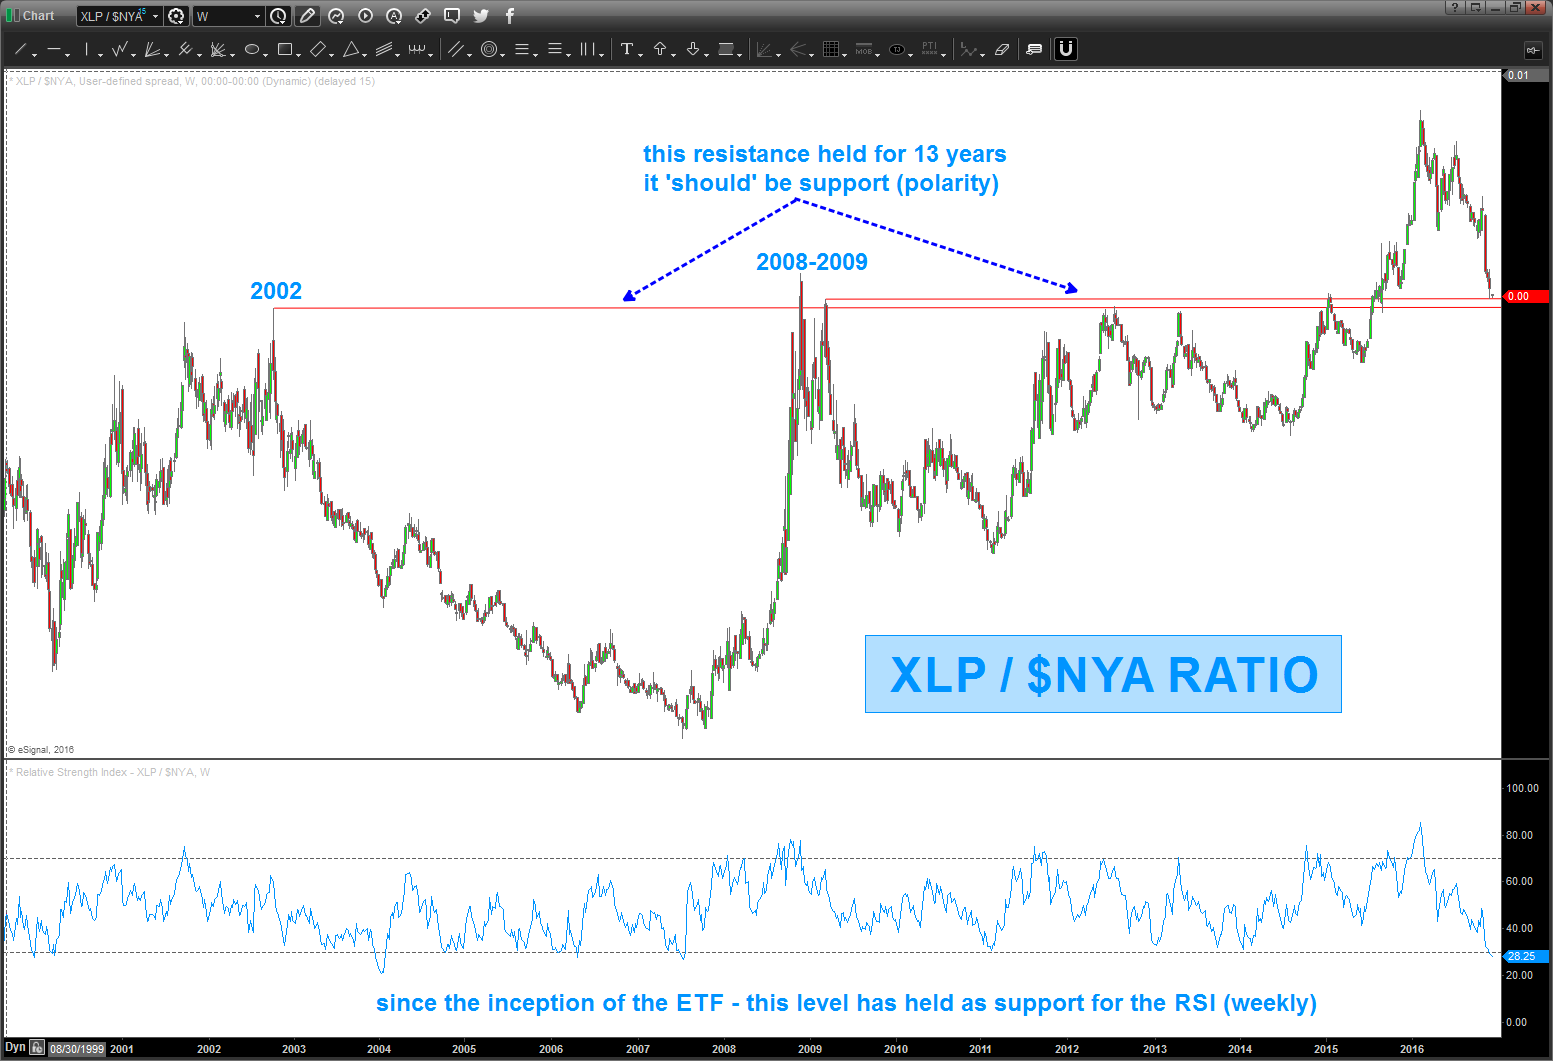
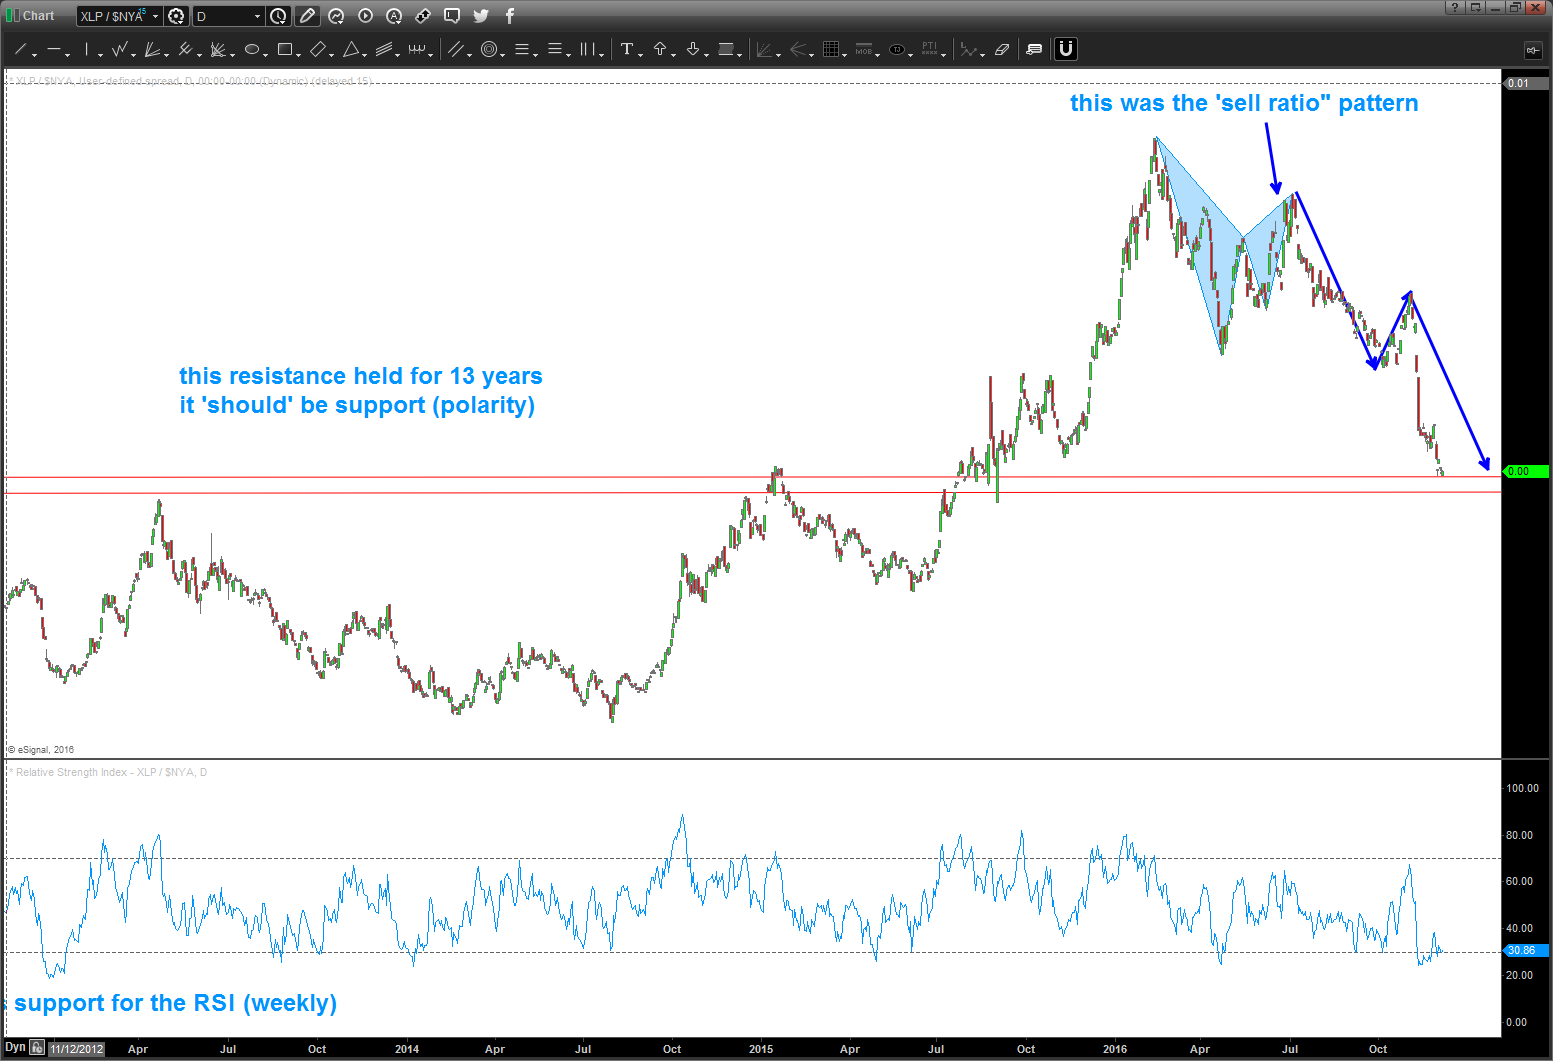
here’s the power of this ratio:
- https://bartscharts.com/2016/05/08/xlp-nya-update/
- ratio BOTTOMS, at the BUY pattern of the ratio – SELL equities
- https://bartscharts.com/2016/03/30/xlp-nya-update-pay-attention/
- when the ratio TOPS then BUY equities
- we have a wonderful SELL the ratio pattern which means Equities should be bottoming for a BUY swing trade of the US equity structure.
DANGER WILL ROBINSON … if/when the patterns fail (and they do) the market breathes in the direction of the failure. Note, we have some VERY strong thrust into the pattern level and this “usually” means the pattern will fail BUT you never know do you? So now for the best part of the pattern recognition world the “if-then”.
IF the pattern works, equities should bottom for a nice BUY (swing trade – not long term for now … )
IF the pattern fails, equities will continuing selling off and we should look for the NEXT pattern to play … make sense?
Here’s the “perfect” sell pattern:

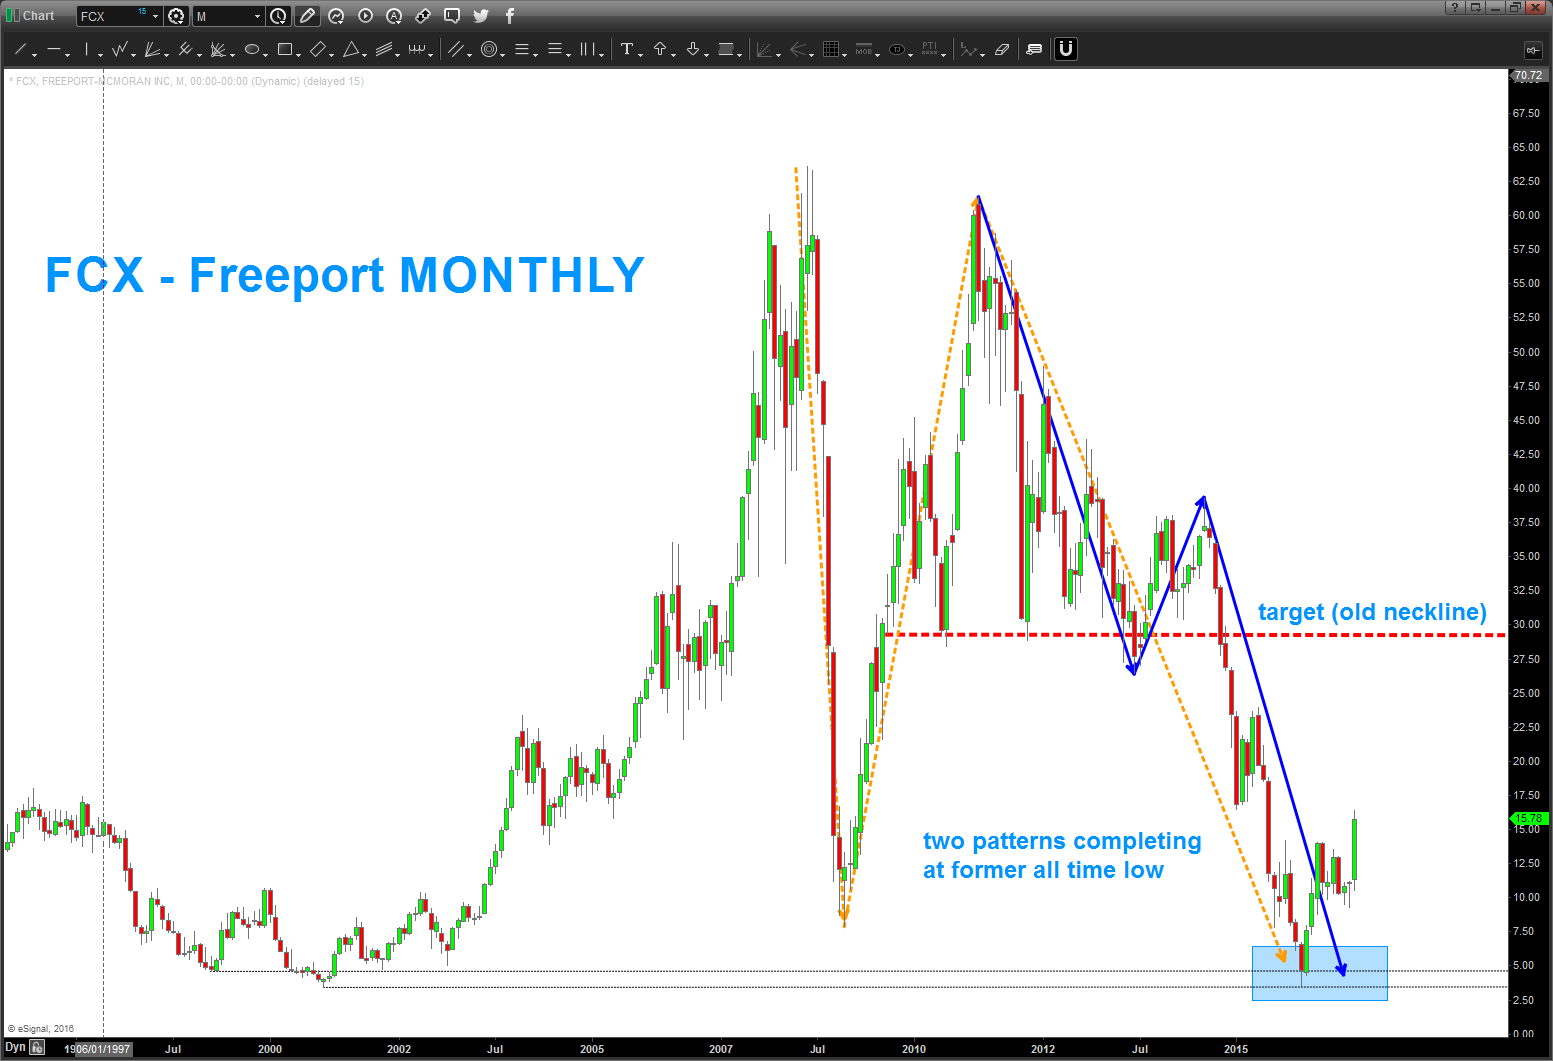
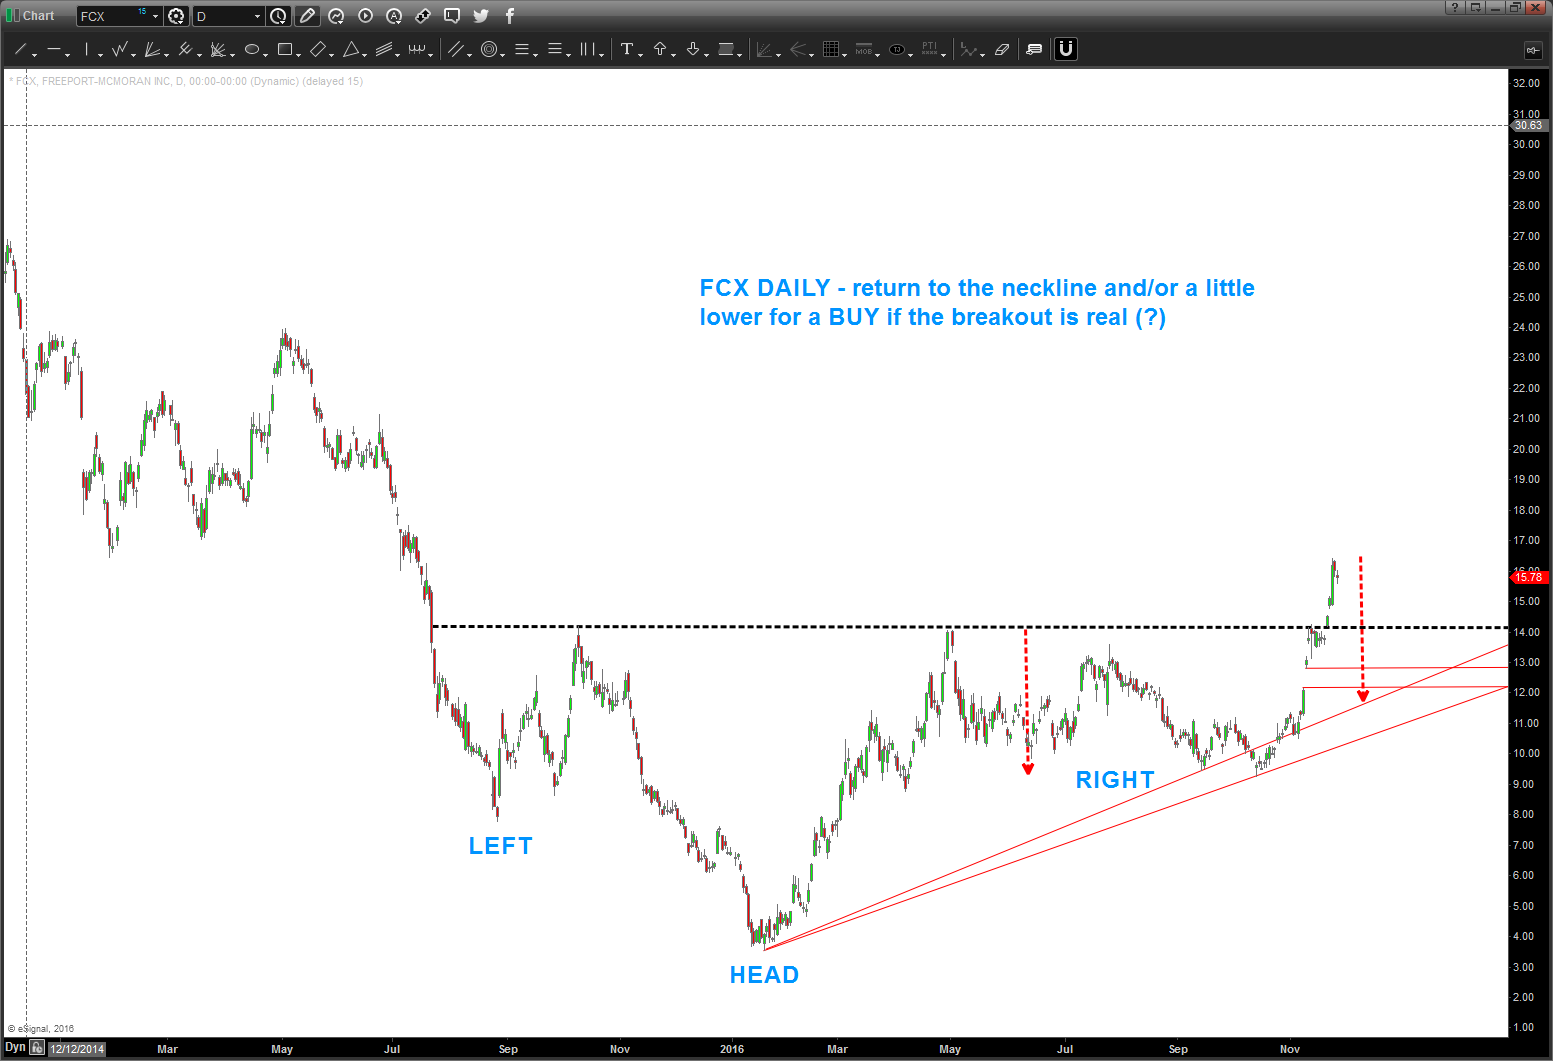
FCX
Posted on November 28, 2016 Leave a Comment
w/ the big move in copper, companies like FCX have taken off.
it’s a nice picture of a two buy patterns coming into play, a breaking of the inverse head and shoulders and now, POTENTIALLY a move back to the neckline or a little lower for a BUY.
here’s the rub … while this move in copper is IMPRESSIVE I’m not sure if it’s just a counter trend bounce. So … when copper gets up to the 3.0 level I would monitor FCX closely. let me know if you have any questions.
also, note, watch REAL rotation into this stock via AMZN/FCX ratio analysis. Believe it or not, from a relative strength basis, FCX (on a relative strength basis) has outperformed AMZN. So, if it’s really being rotated into … the pattern shown below will fail and go higher, filling the gap and taking off …
B

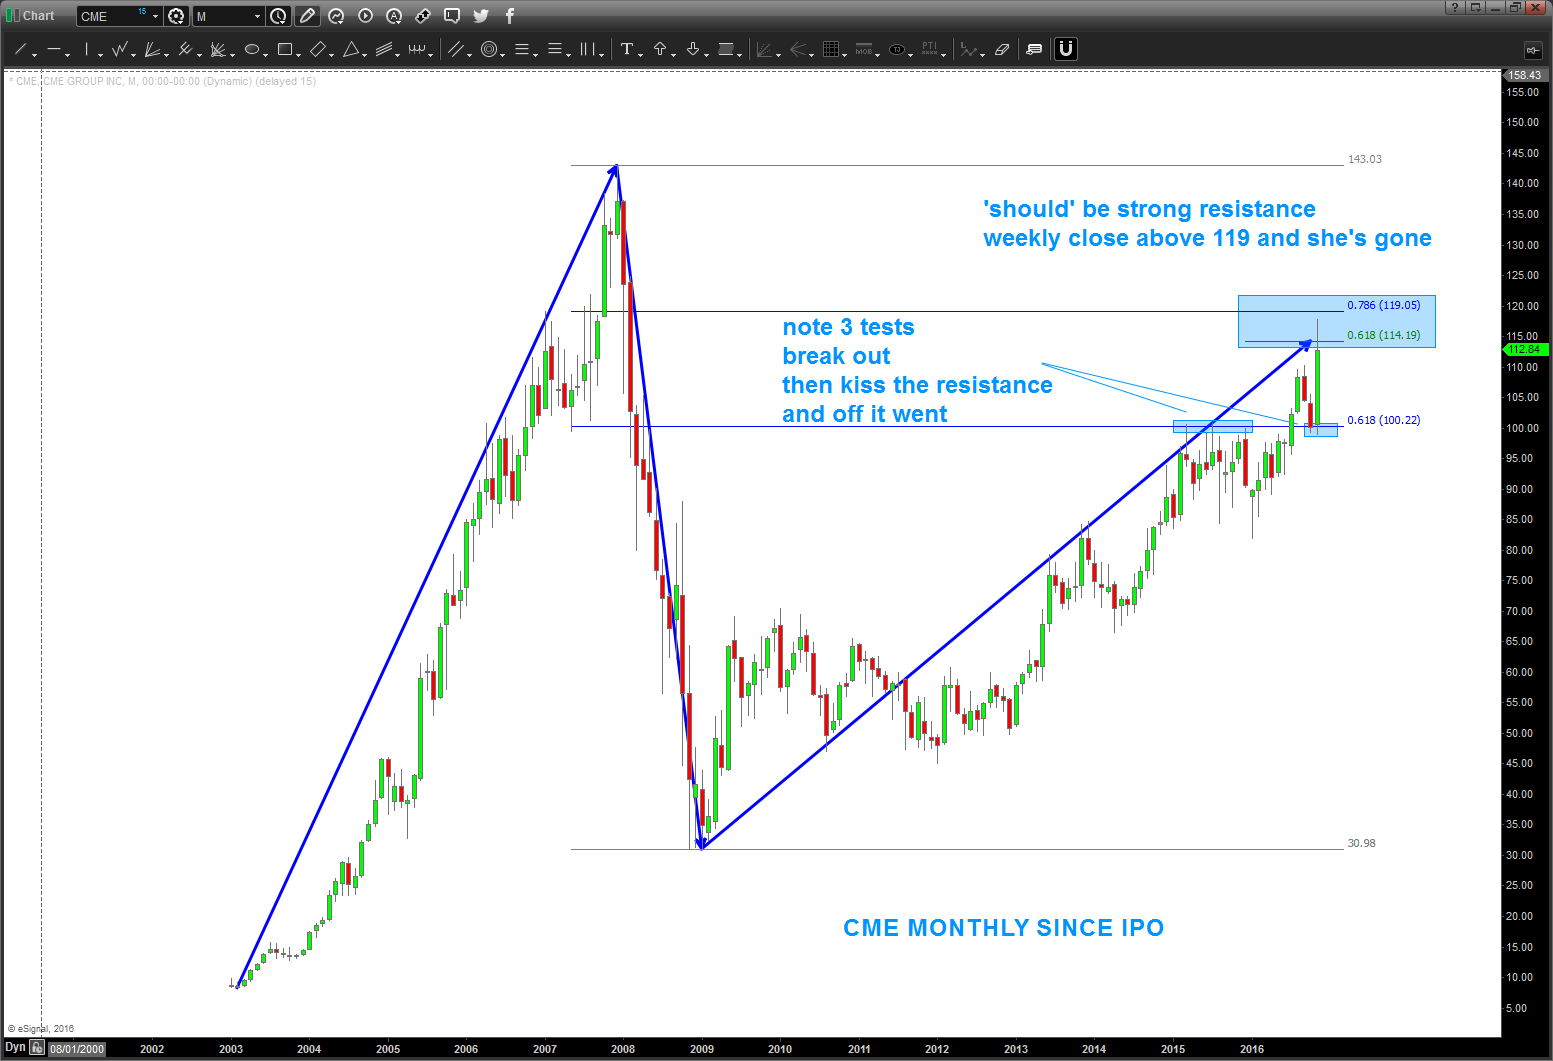
CME
Posted on November 27, 2016 Leave a Comment
looks like strong resistance is being hit … but that’s mighty strong candle coming into levels shown. wait for a SRC. If it breaks above 119 then new highs should probably be seen.
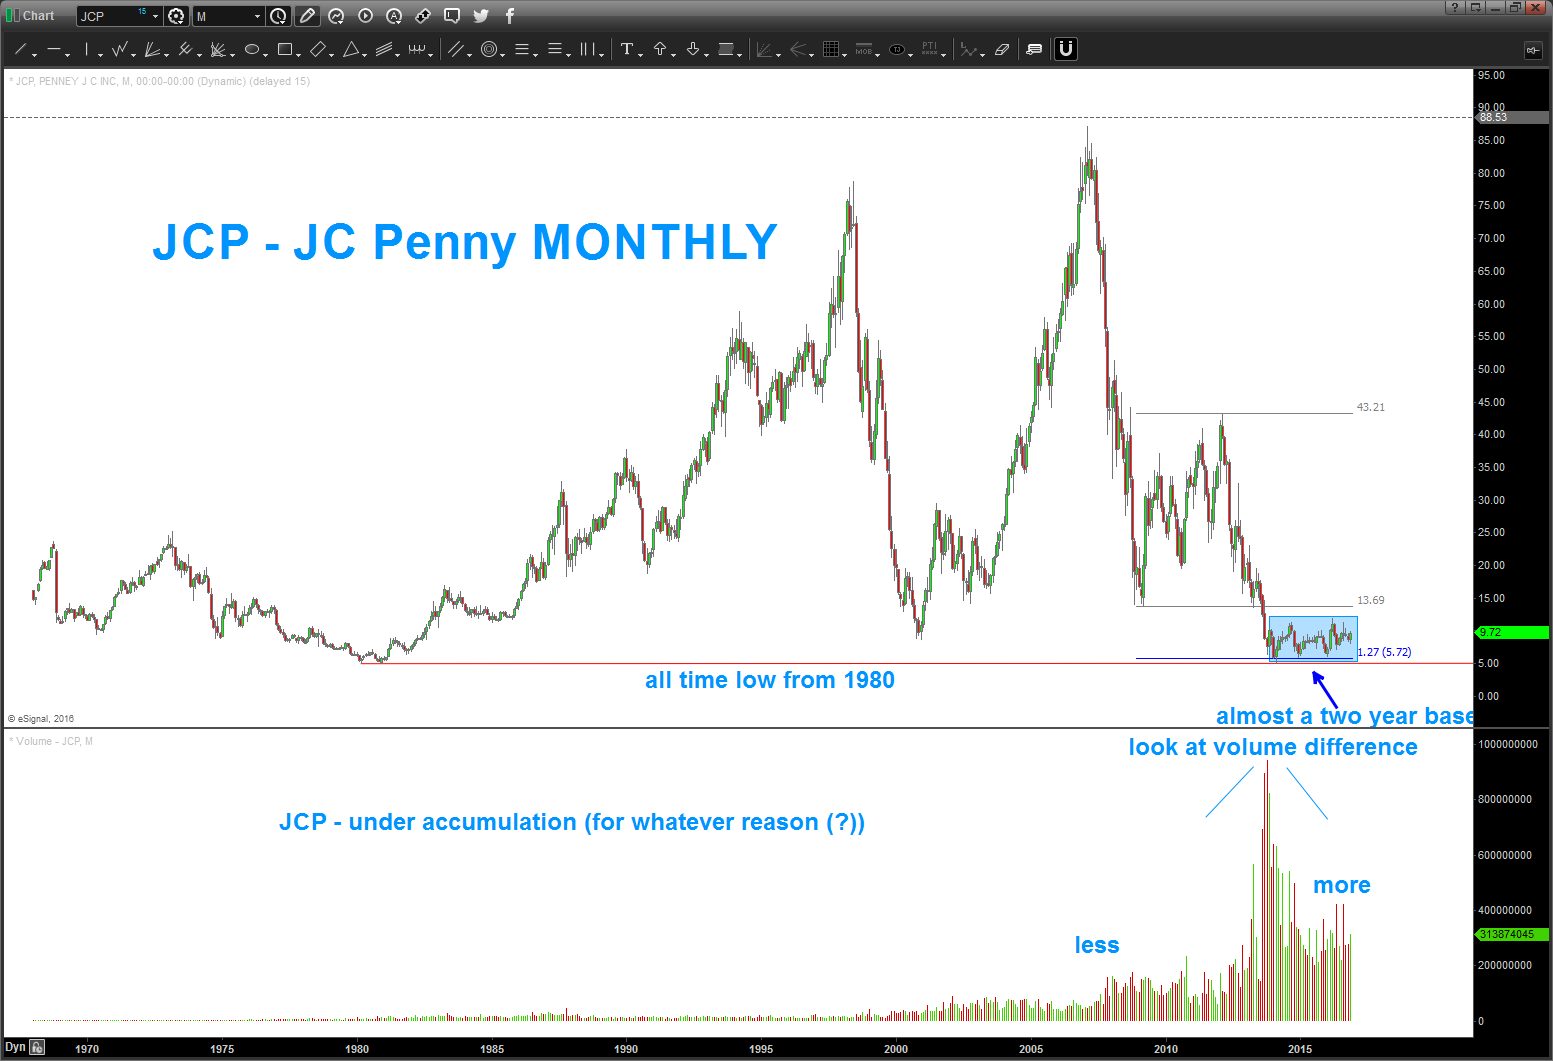
JCP a study of the Beauty and the Beast (?)
Posted on November 23, 2016 1 Comment

well that was “beastly” in the thumping that happened from 86 down to 5 … but it also happened in 2000 and look at the rally. What did JCP do? I have no idea and I don’t care …
but the “beauty” is the POTENTIAL accumulation taking place …
- note the 1.27 extension that caught the all time low again from 1980
- note the almost two year base forming … IF it blows to the upside, this puppy could really run
- now look at the VOLUME. when the low as made .. the volume spike is what we like to call a ‘capitulation low’ and now look to the left and to the right of that high point in volume
- to the left, even as it was being sold sold sold volume was relatively light
- to the right, well the volume is much more pronounced … is it being accumulated for another run?
something to note … that’s all. a 1.27 PATTERN is present so I like that.
Now, the strategy is do you BUY a breakout – I never do as it has a 13.69 stiff polarity staring at it. but the return to the neckline or the breakout point is always a good strategy.
So, put this one on your radar .. again, I have NO IDEA how they are staying alive as a company. perhaps they have some crazy Amazon deal or digital store improvements or perhaps they are going to go bankrupt? If you remember I showed the pattern for ABX https://bartscharts.com/2015/07/19/barrick-gold-abx/ and that puppy ran into the mid 20’s. Additionally, showed the sell for the Banking Index and that got smoked.
I HAVE NO IDEA WHICH ONES WILL WORK just looking for patterns and things that NOBODY else is looking at.
What I can tell you is i LOVE LONG BASES that resolve to the upside … one to watch folks.
Bart
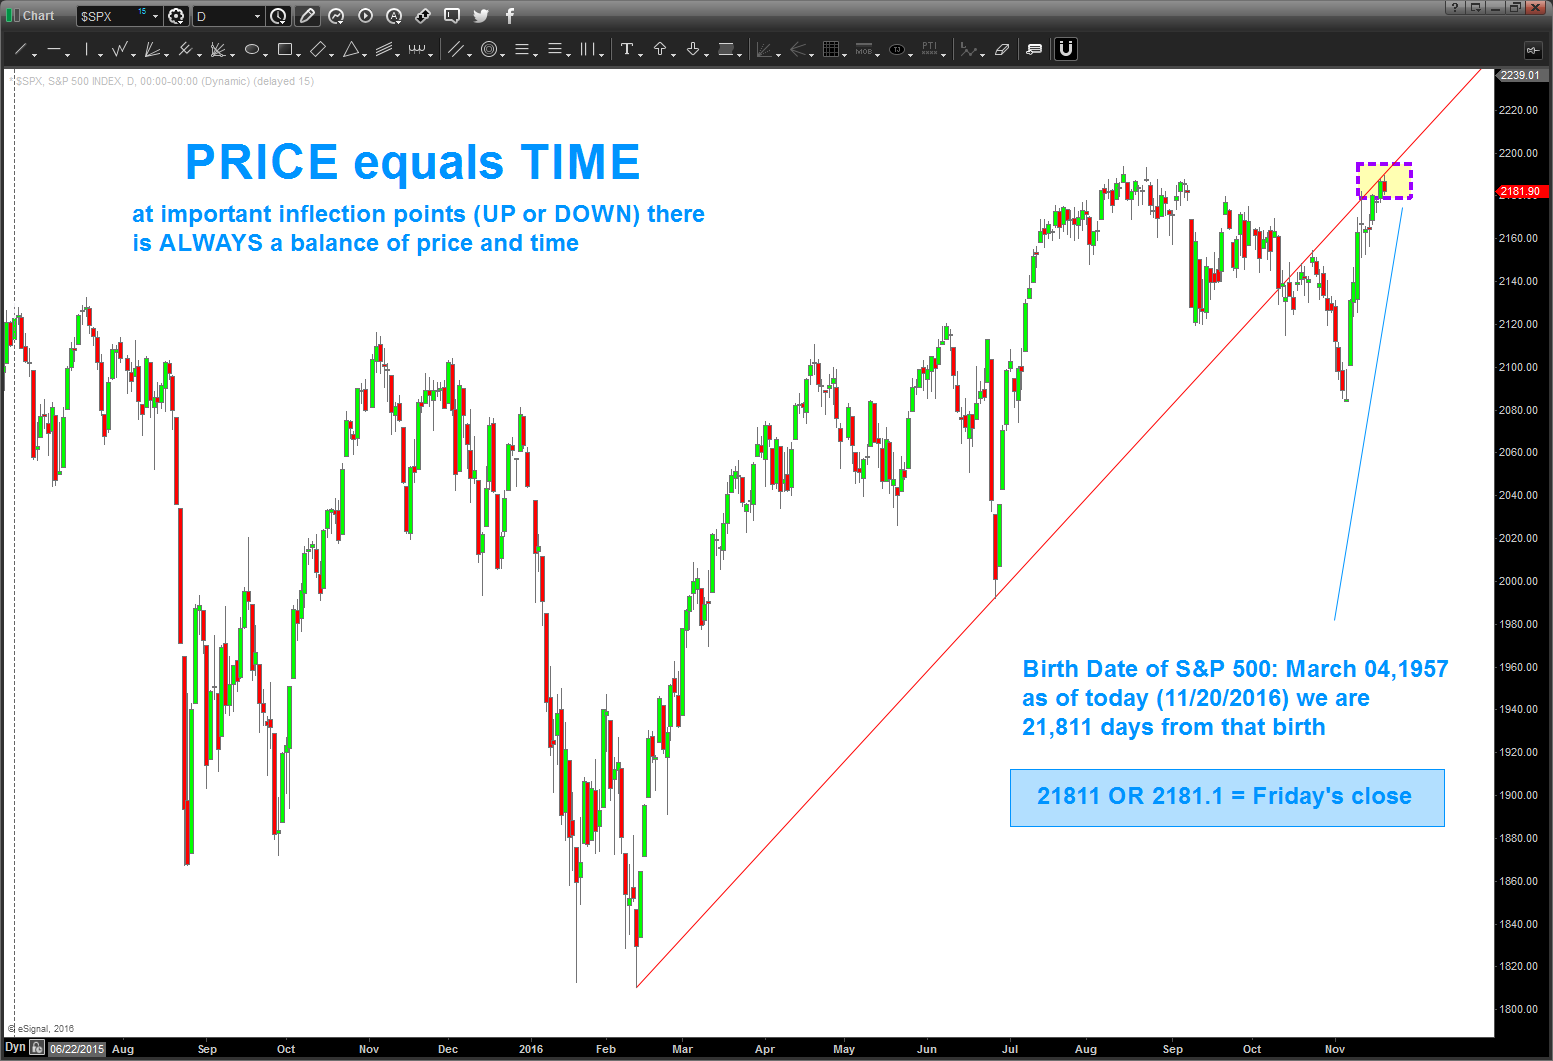
Update on the ‘birth’ of the S&P500 and Friday’s close
Posted on November 20, 2016 2 Comments
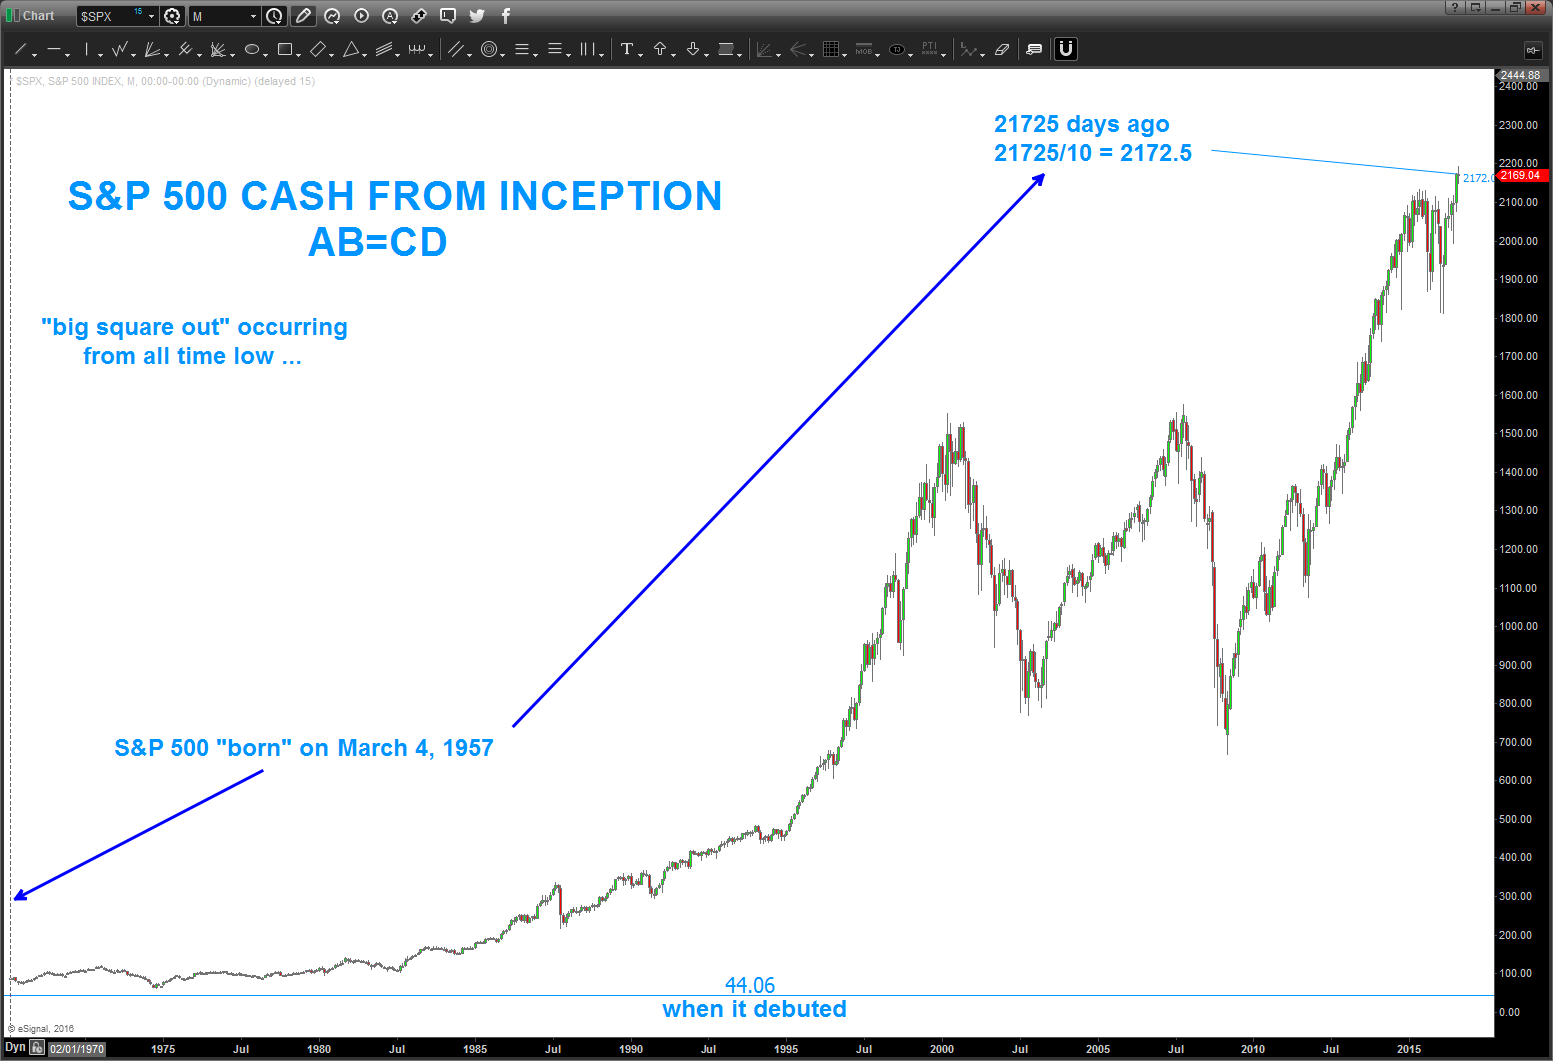
11/20/2016 – again, “she’s getting ready to blow” but who knows what direction, right? Just pointing out that we did ‘another’ square out on Friday. This one, as they usually are, was perfect. Math is below on the chart.
I plan on just going w/ a Signal Reversal Candle – if going short the LOW of the candle that made the high is taken out ON CLOSE by the daily or weekly and if going long a close above 2200 (daily or weekly depending on your timeline) should suffice.
Also, the ‘price’ could grind/gravitate up a wall of worry so to speak. but, it’s been my experience that the ‘break down’ or ‘break up’ usually occurs at one of these square out numbers.
Do well, be good and rock on – ok?
Bart
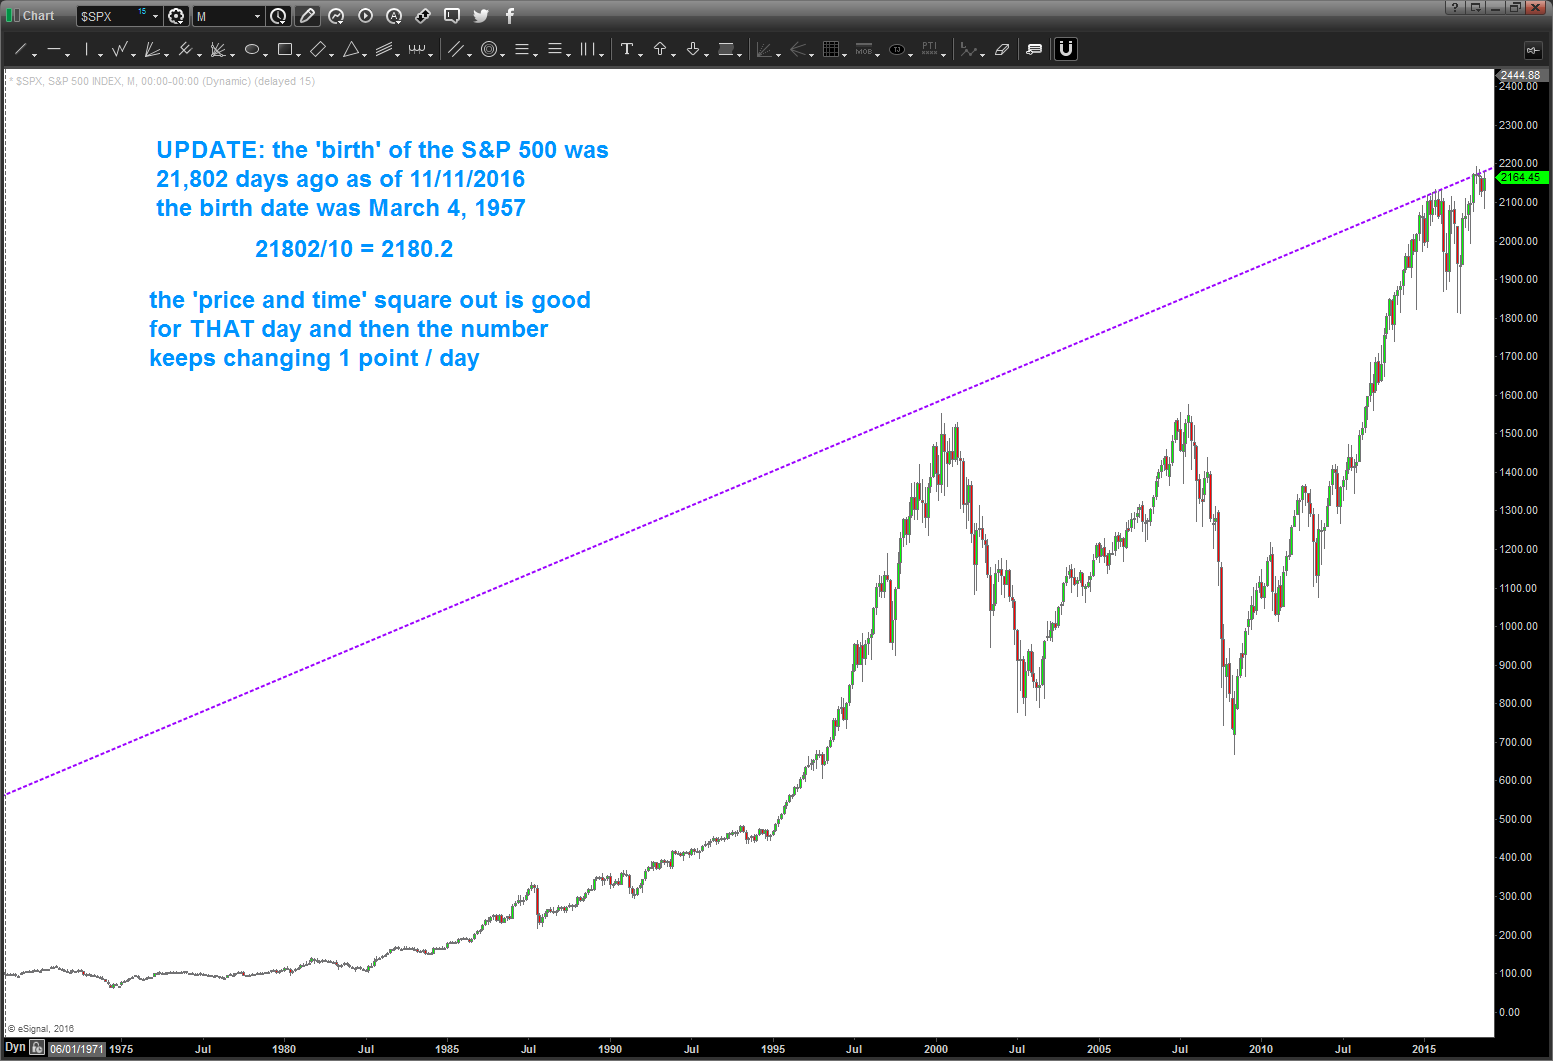
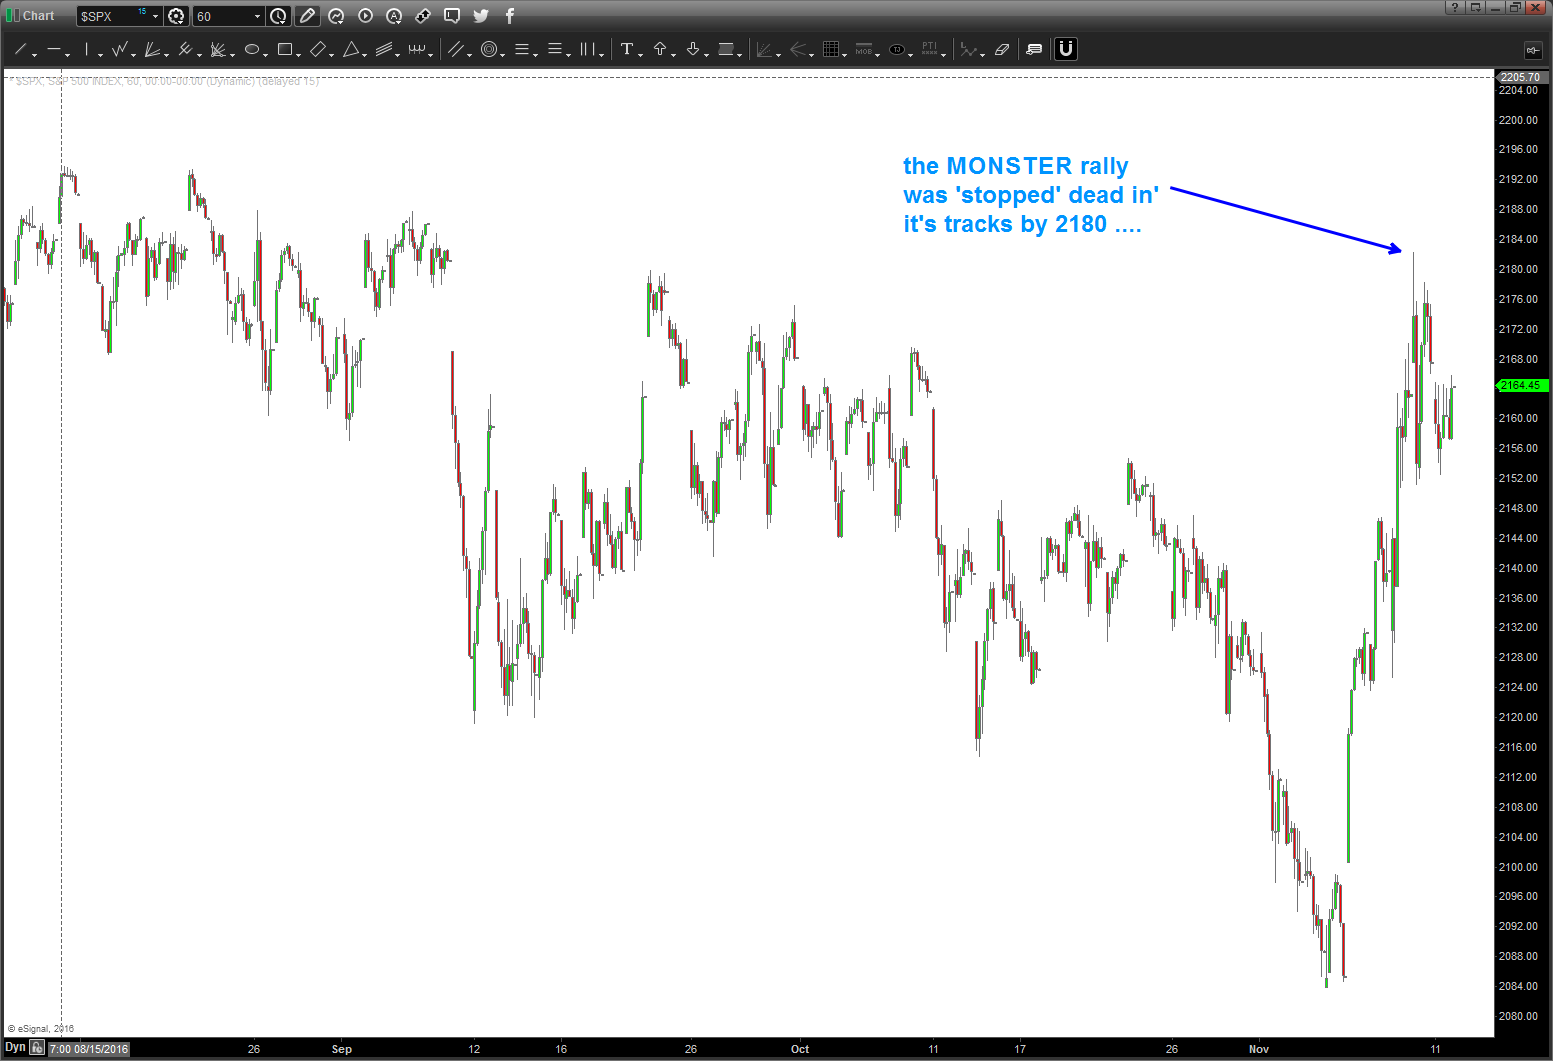
11/12/2016 – wanted to provide an update. the ‘square out number’ isn’t static. in fact, it changes every day. in this case, as we continue vortexing thru space we see that we are now, essentially, 2180 days since the ‘birth’ of the S&P 500. Of note, the post election crazy rally was stopped dead in it’s tracks by 2180. that’s the ‘key’ number right now … the market ‘wants’ to balance itself (remember: form, proportion, balance) so it’s no real surprise that the market went right up to that NUMBER.
so, what happens next? I honestly have no idea … but i do know that the market will move from these levels, usually, w/ a vengeance so just hang on to go up or down … a “weekly” close above one of the numbers tied to the square out would be bullish. a big break down below some former support would be bearish.
for now, as we bounce around these harmonic numbers of price/time – just chill and let it make up its mind.
hope this helps.
Bart
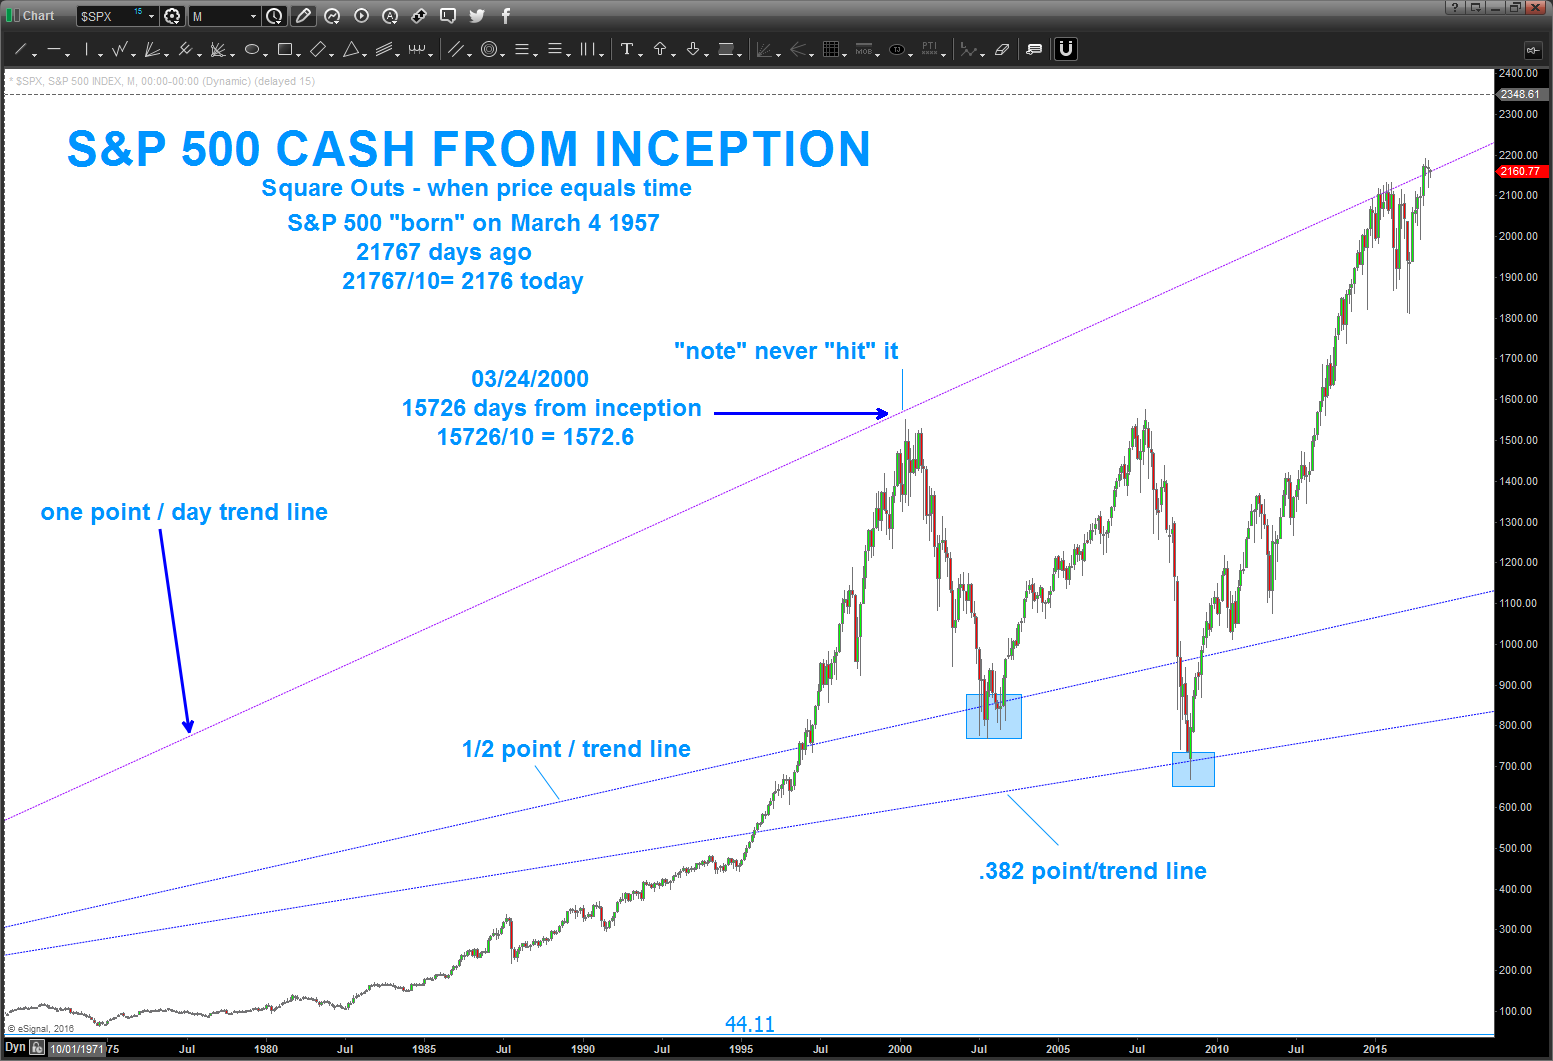
10/7/16 – just wanted to check in before the weekend. below is a chart that “visually” depicts the SQUARE OUT where PRICE EQUALS TIME and the TREND LINE you can create. In this case you can see the 1×1 is currently the REASON for the resistance on the S&P and then we simply did a 1/2 point/day and, why were were at it, a .382 point/day. HINT – why not try “musical notes” *days since inception or all time low. I bet, if we use, say .9438*days we’ll get close to the 2000 high and, while were are it, 1.05946*days we’ll be resistance on the cash S&P. It’s early on the West Coast … I don’t feel like doing it. Try it yourself.
also, we are using a CONSTANT 1 point/day “velocity” (in this case we use PRICE and TIME to create the vector math) and what else moves in a CONSTANT ? (hint – look up in the sky) YES, you got it … so, while your at it, use a planet and move them a certain amount of degrees in a certain amount of time. How about 100 degrees/100 days – 1 to 1 and see what happens.
Have a GREAT weekend.
B
08/27/2016 – looks like we are still “squaring out” the date of the inception of the S&P500 w/ this past weeks weekly close.
again, this is not “bearish” or “bullish” but a heads up that at “square outs” stuff happens … go w/ the flow.
rock on, ok?
PATTERNS … work and they fail.
PATTERNS tell us of possible inflection points.
PATTERNS also tell us very important areas of interest to trade around ..
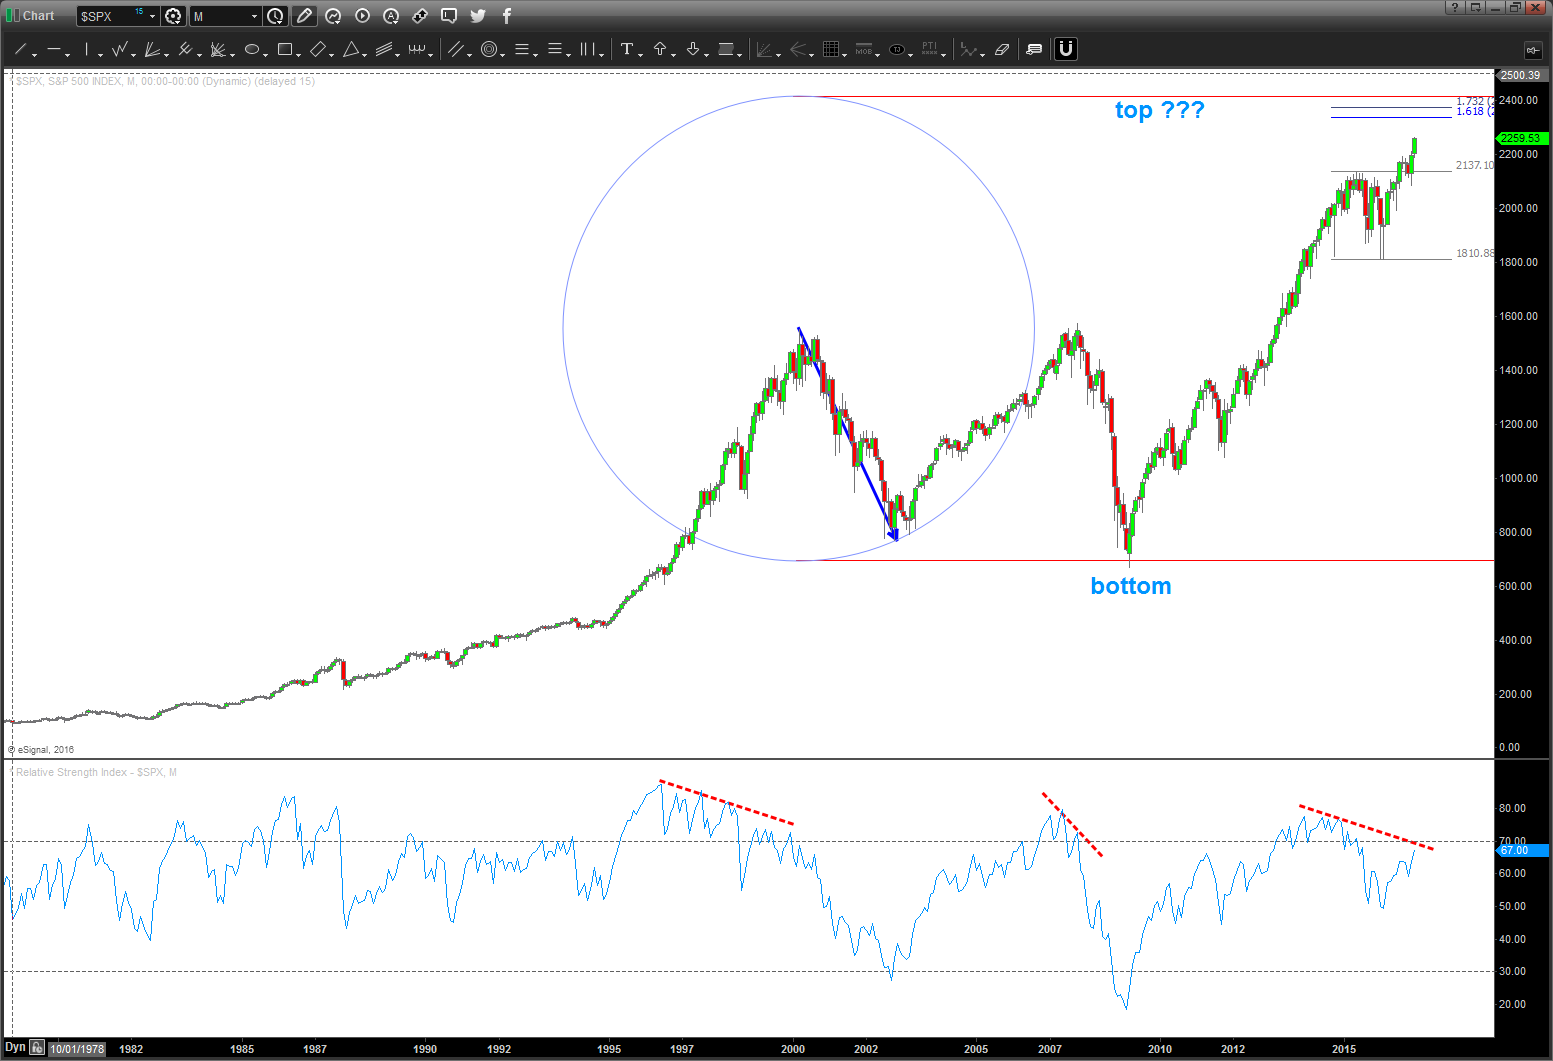
What if .. what if the PATTERN on the cash S&P has finished or is very close to finishing a sell signal?
That would mean we are at major resistance and the market “should” respect a PATTERN that has its genesis from it’s all time low 50 years ago….
IF the market DOES NOT respect this area and goes higher then we are really really really strong and I wold look to go LONG after a monthly or weekly close above these levels.
so, don’t shoot me- I got tons of crap this weekend for posting about the Utilities Pattern hitting (seems to be working so far) and I’m just mentioning that a “classic” AB=CD PATTERN is pretty much done on the S&P.
Pay Attention ….
Bart
PS – tons of cycles are hitting this week so just go w/ the flow and catch the wave that should begin soon. No idea which way it goes, it’s just a pattern. TRADE IT or NOT.
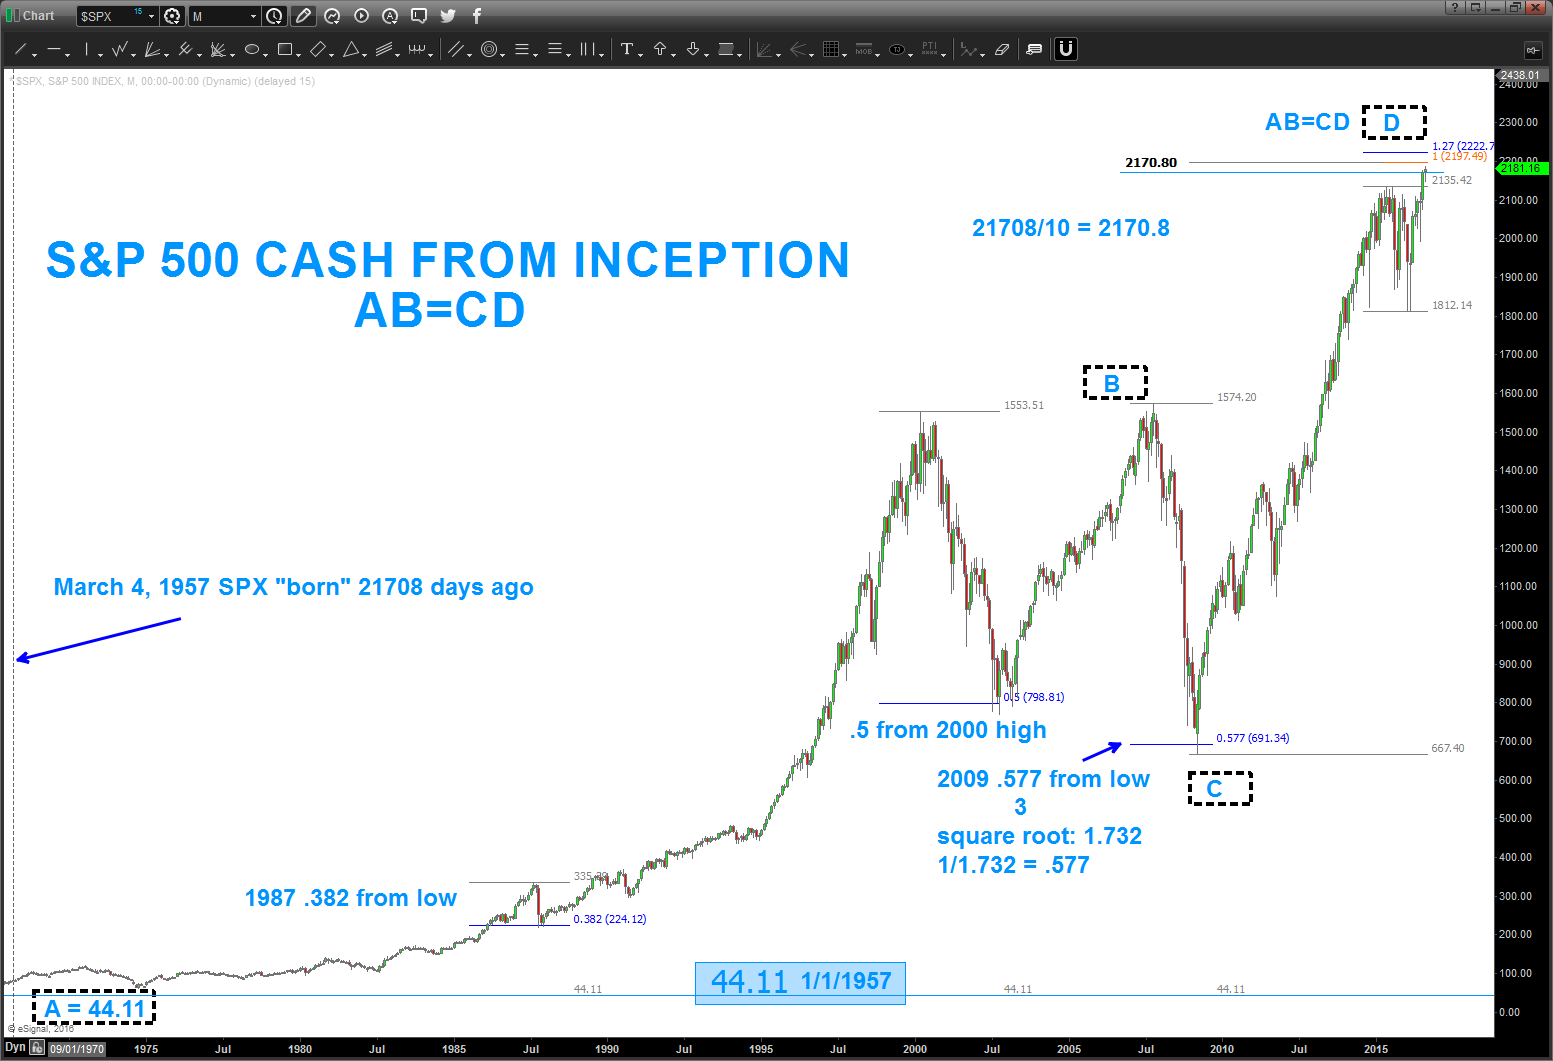
PS — also, the you’ll note the SK&P was BORN on March 4, 1957 or 21708 days ago. 21708/10 = 2170.8. Were only 10 points away from that price … if we close below 2171,2172,2173 etc. in the coming days the market has SQUARED OUT PRICE and TIME. “Stuff” usually happens around those occurrences. An FYI …
