LONG BOND since 1981 UPDATED
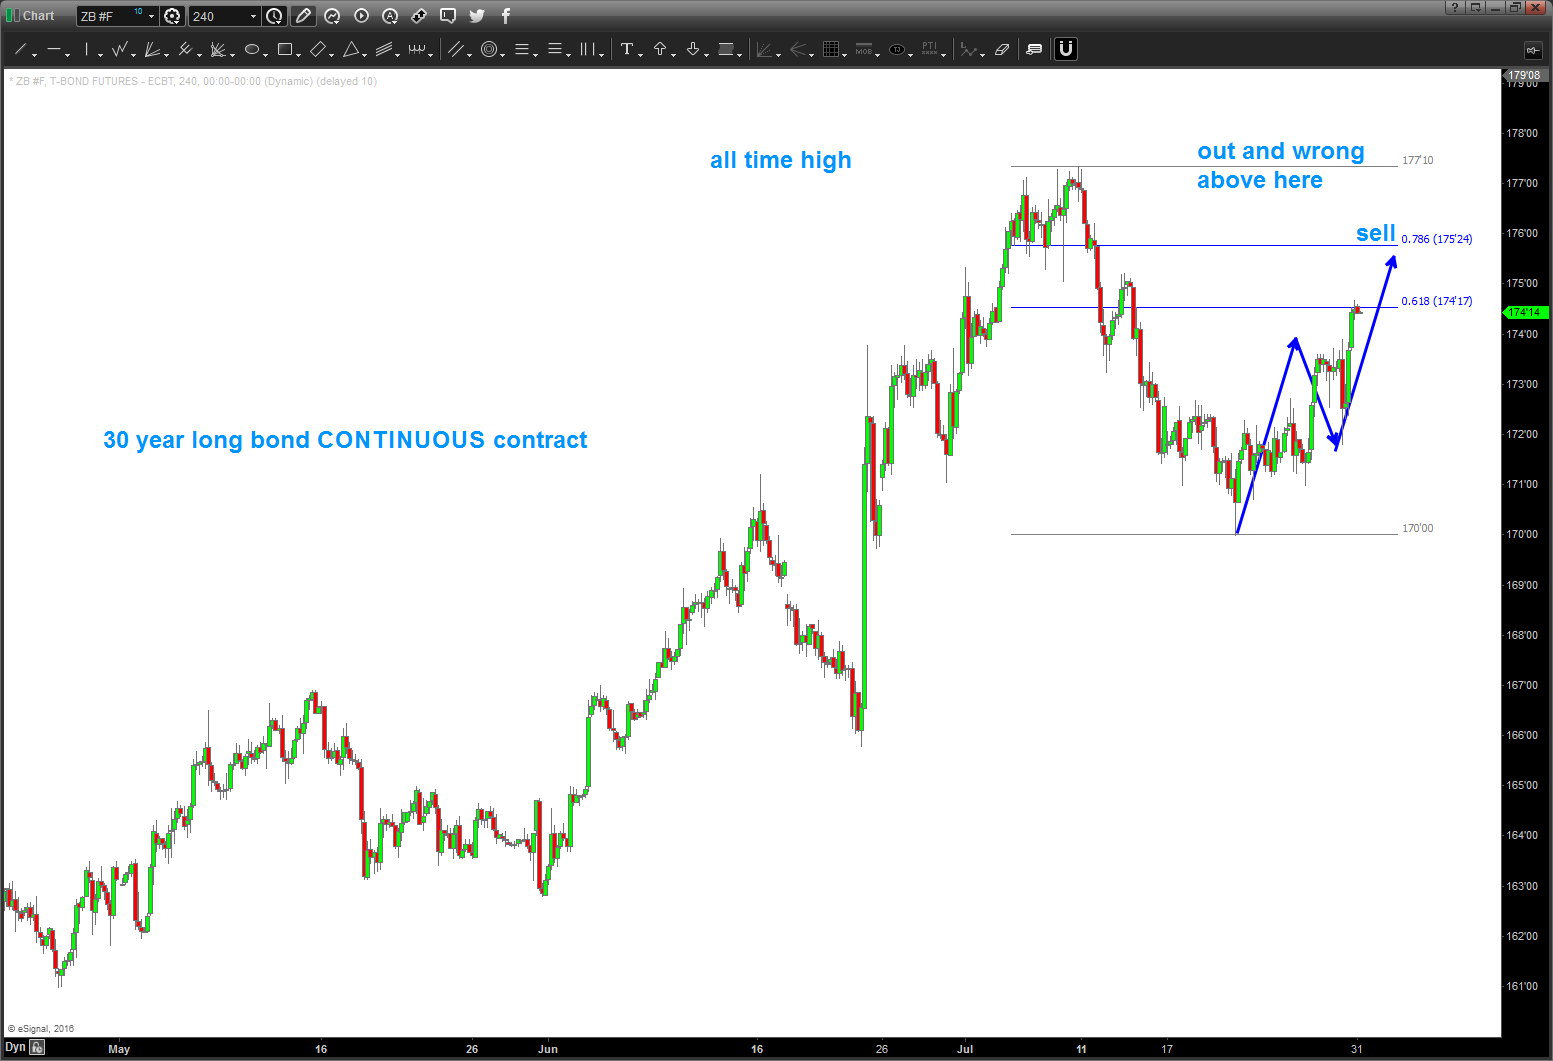
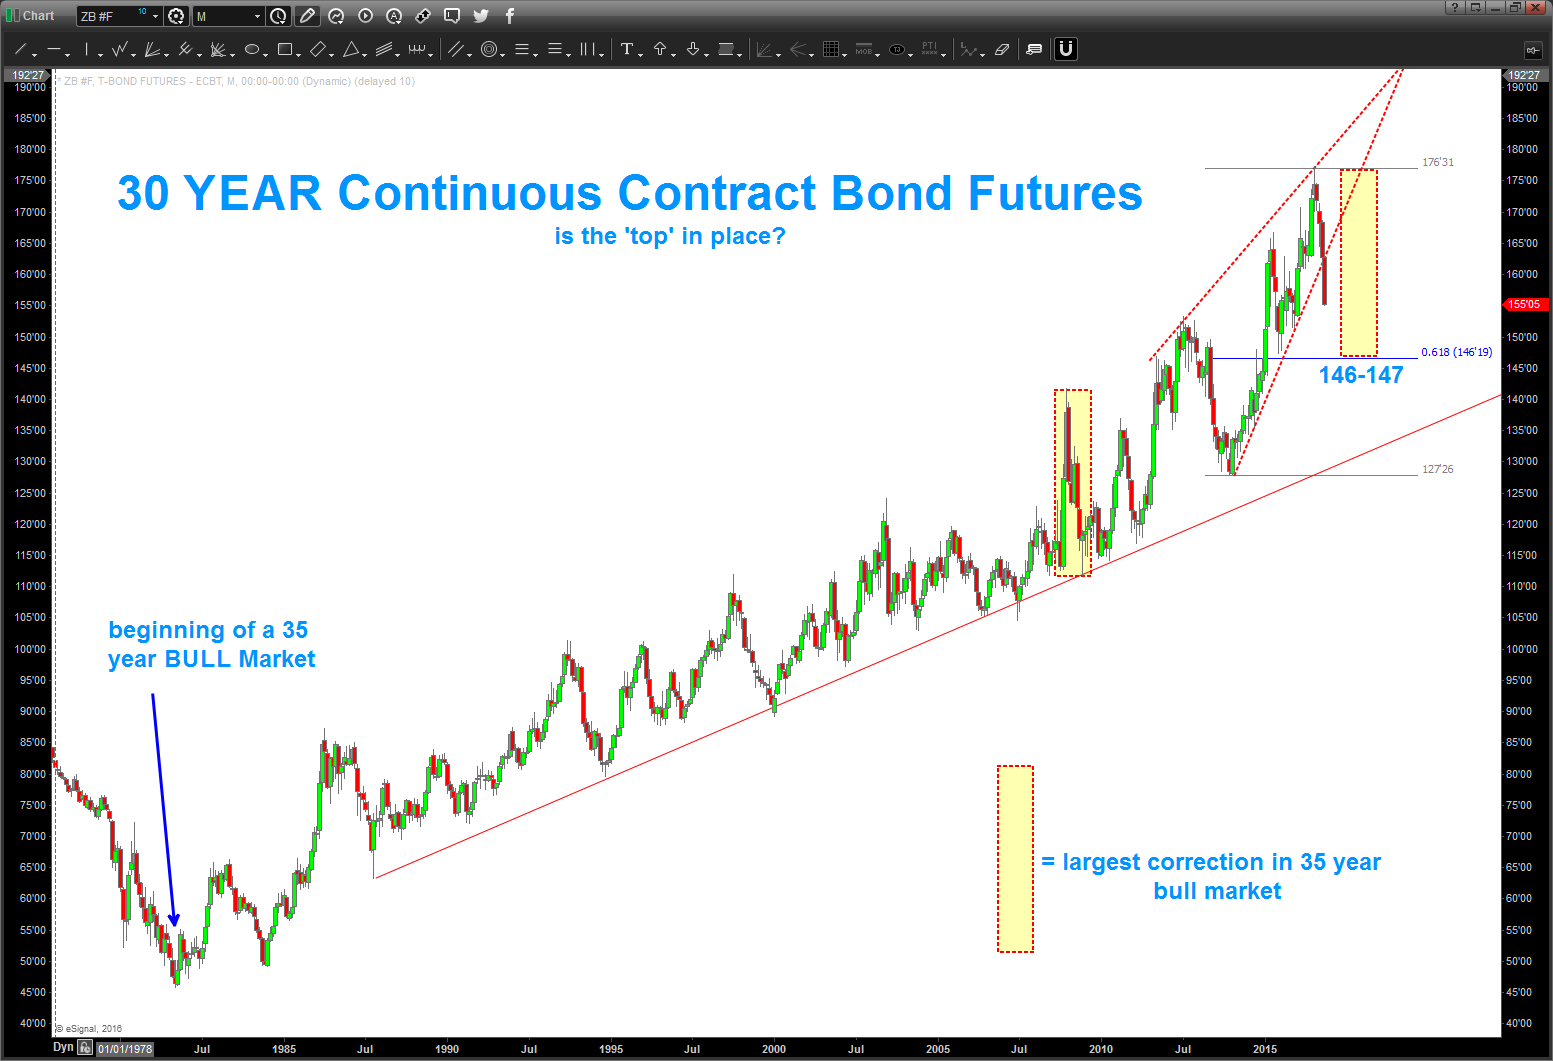
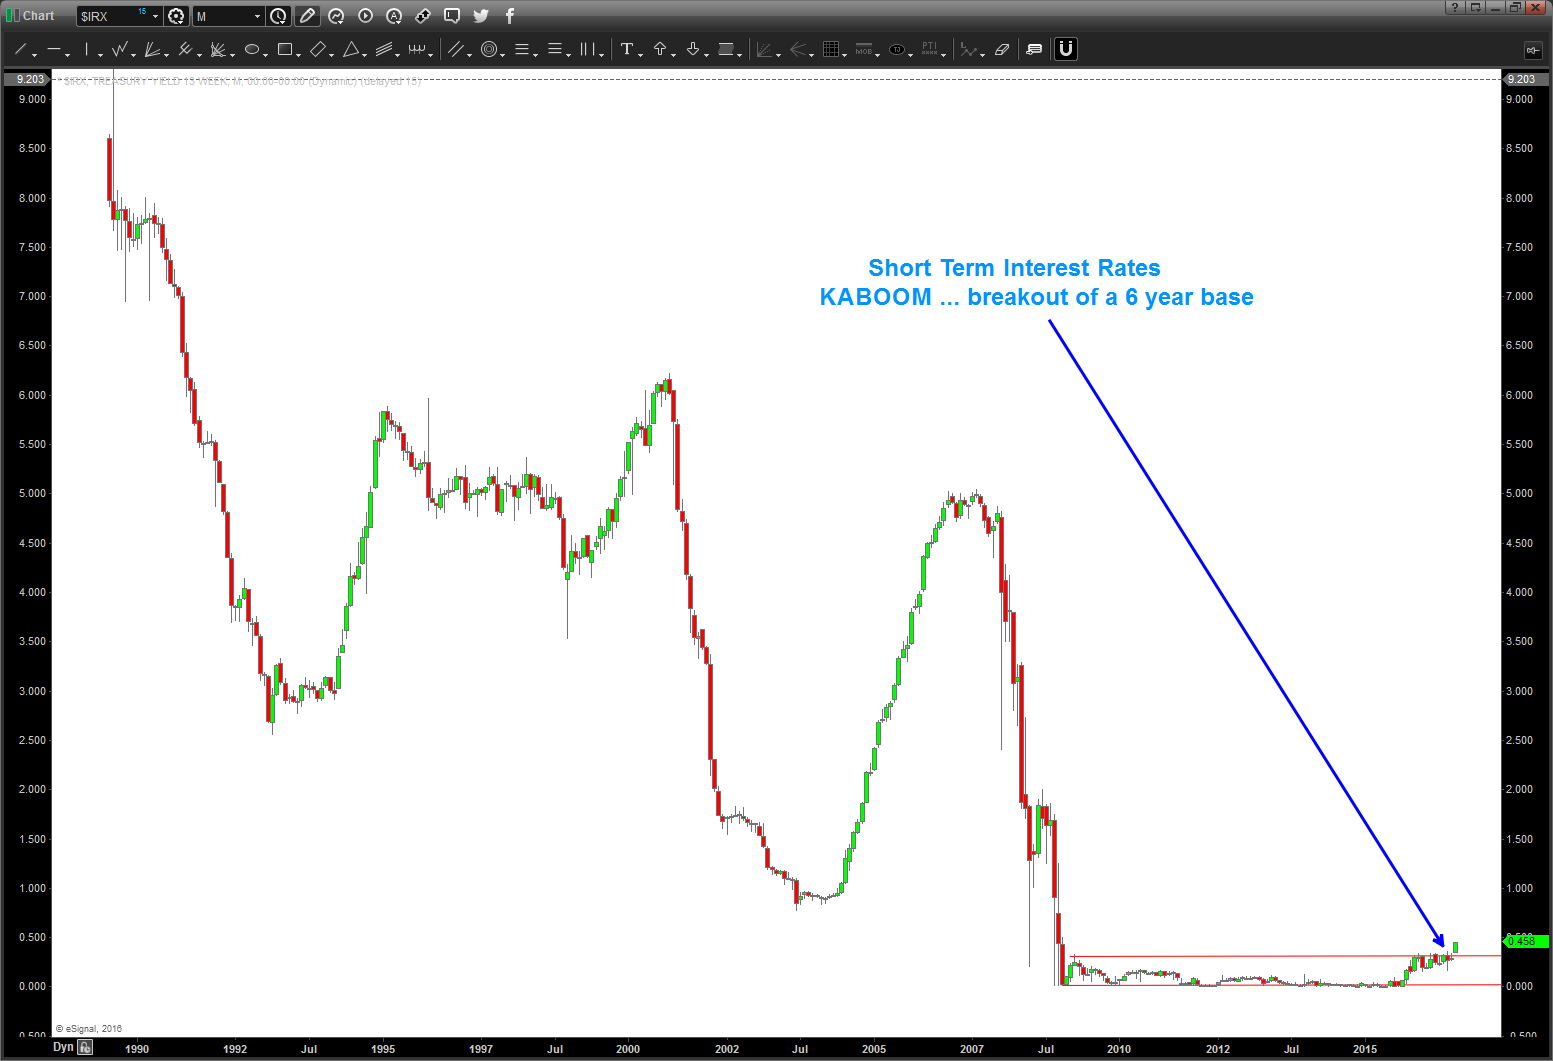
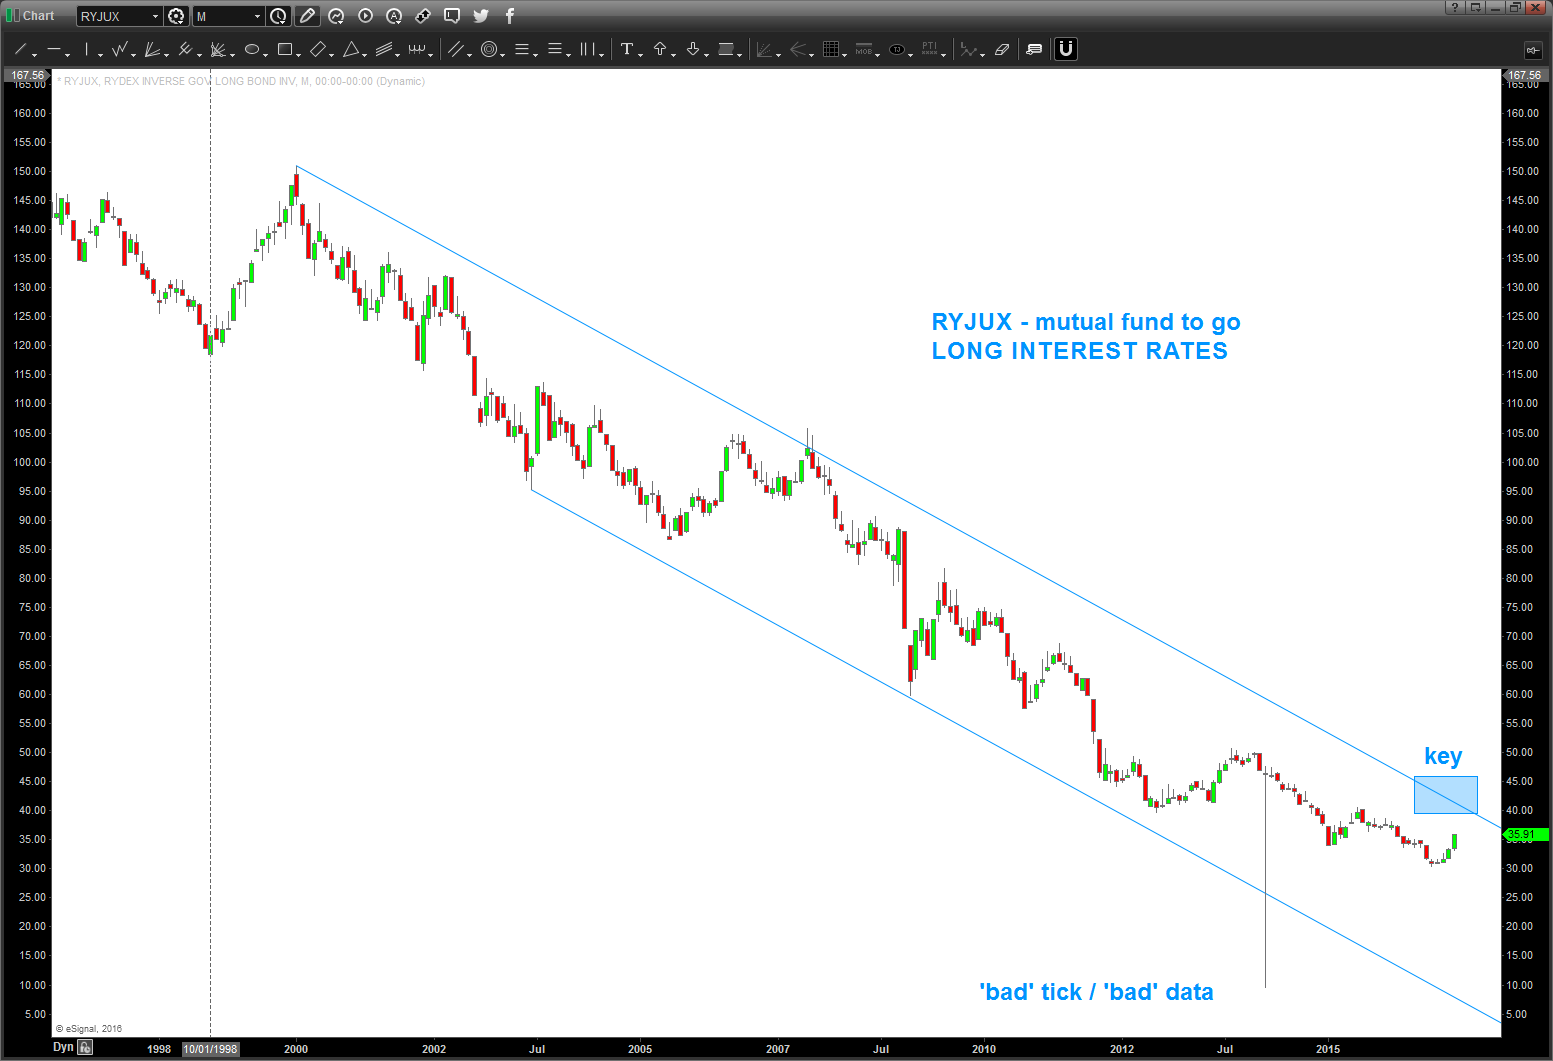
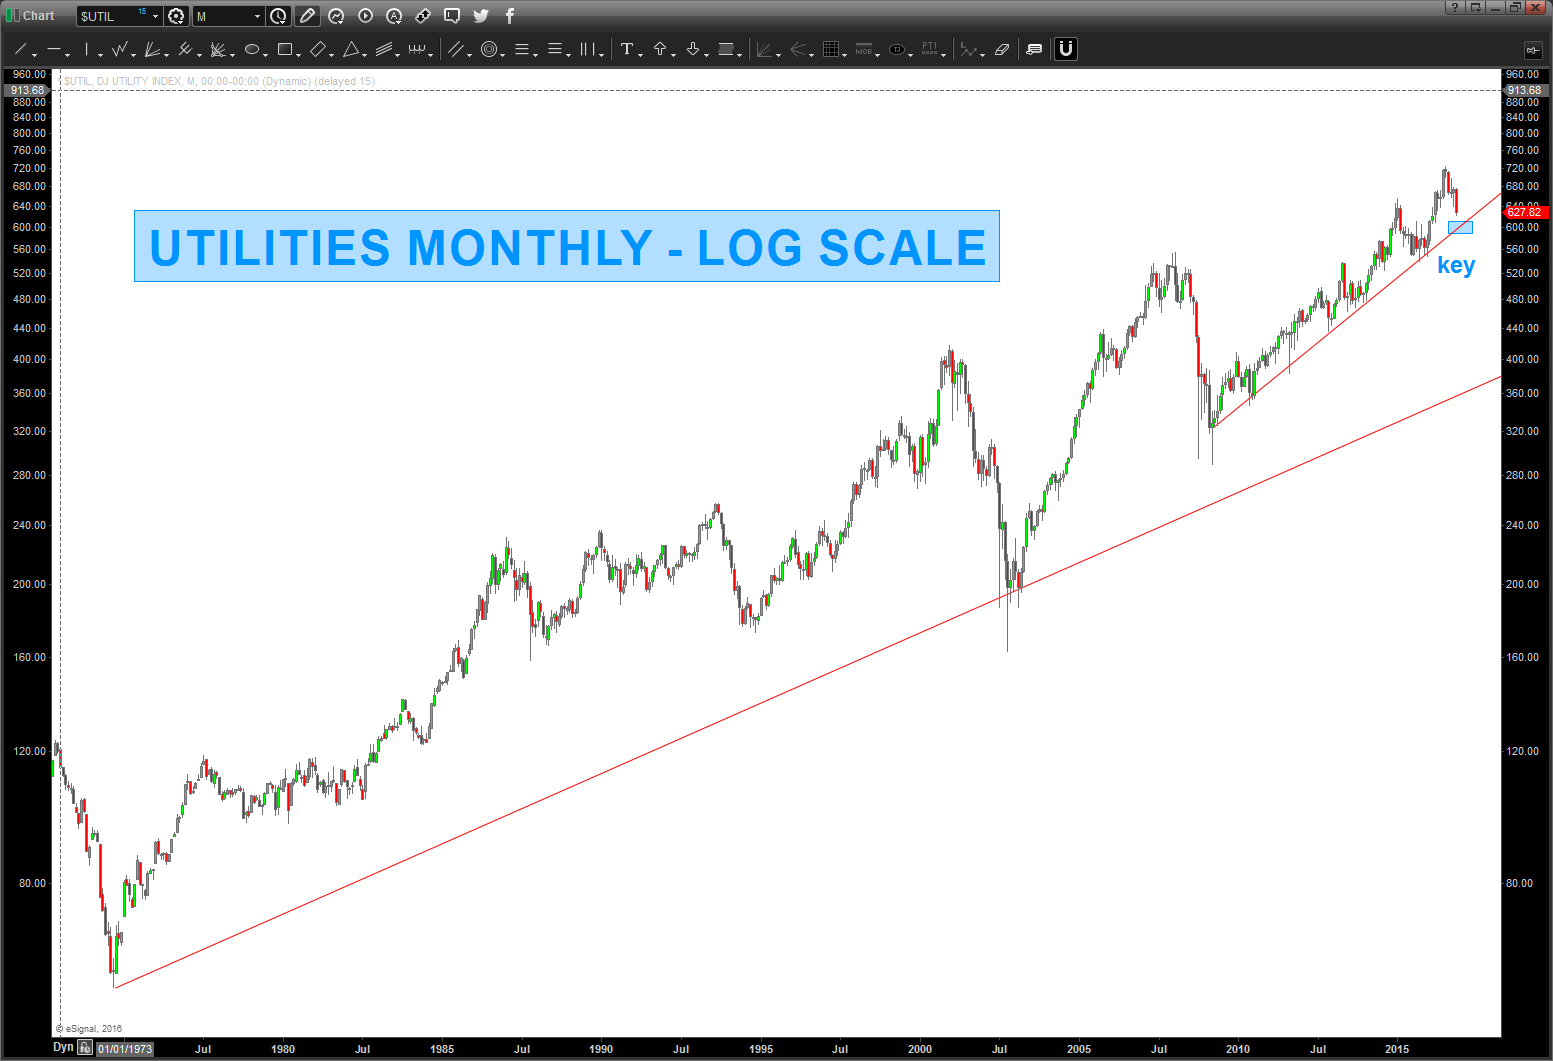
11/13/2016 – as you can see below, back in July I did the post for @seeitmarket and also here on the blog about a ‘potential’ top / resistance on the bond complex. the targets were hit and, since then, the bonds have been sold and, just this past week, have accelerated to the downside. am updating the charts of the Long Bond, TLT, $IRX, RYJUX (mutual fund to go long rates), Utilities, 10 year. it took some time to unfold and a pattern failed earlier in the year but this one certainly is putting probability in our corner that we MIGHT have a ‘generational’ high in bond prices. as always, stay tuned …
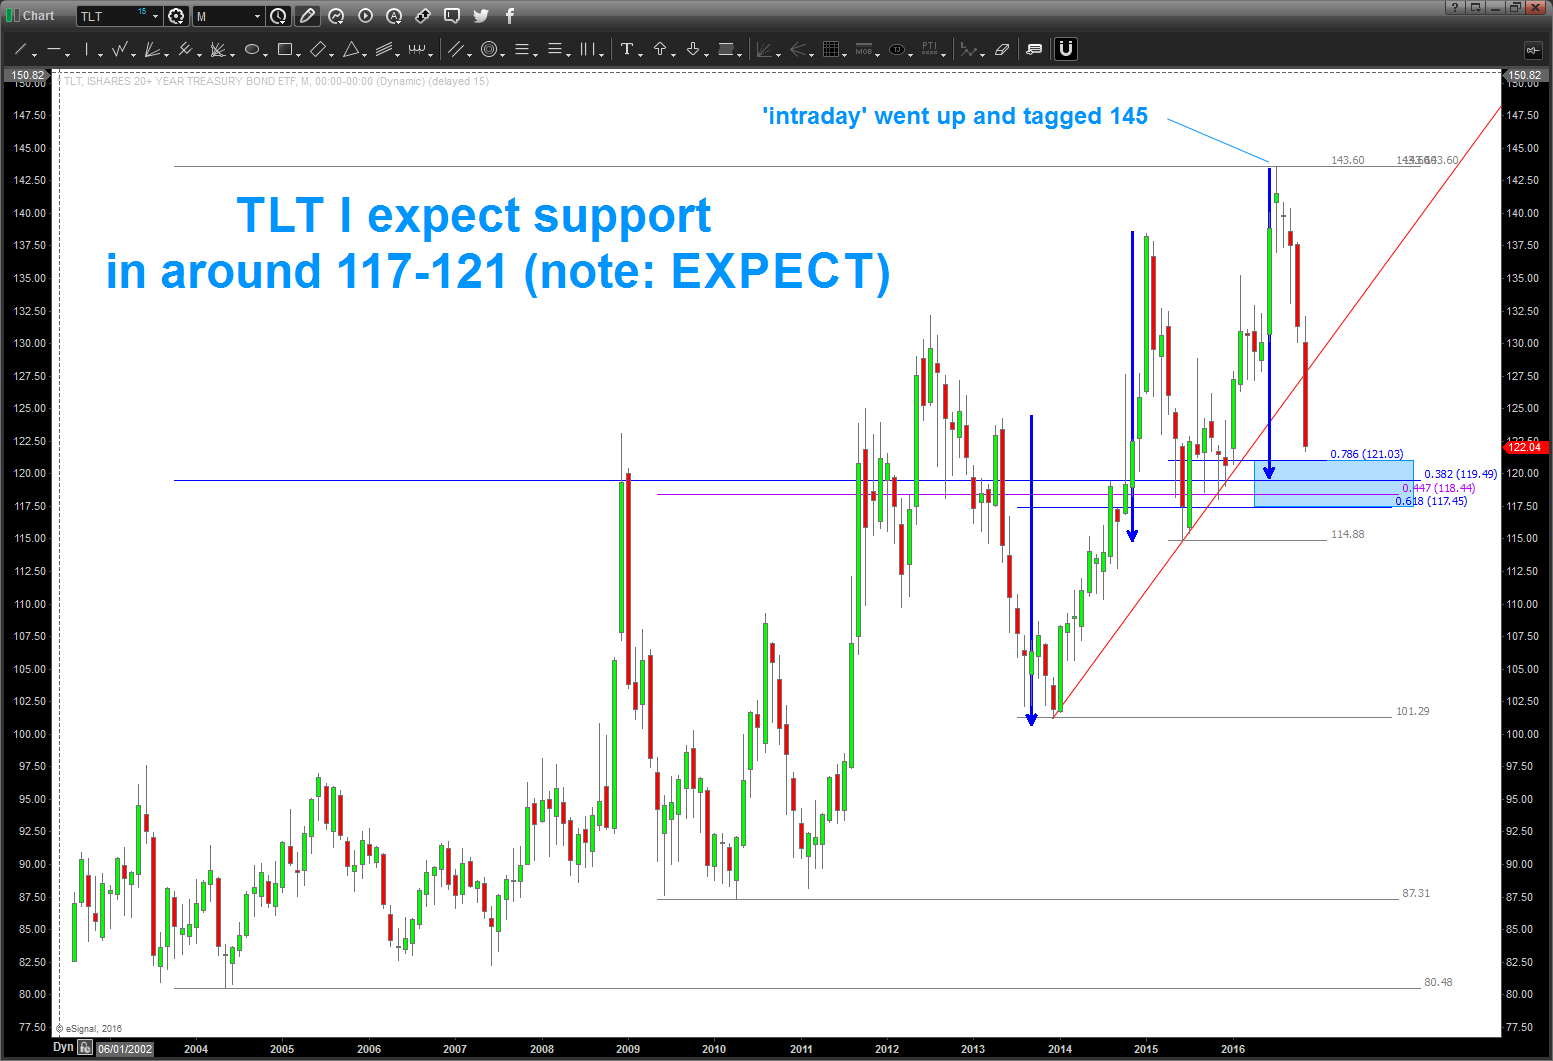
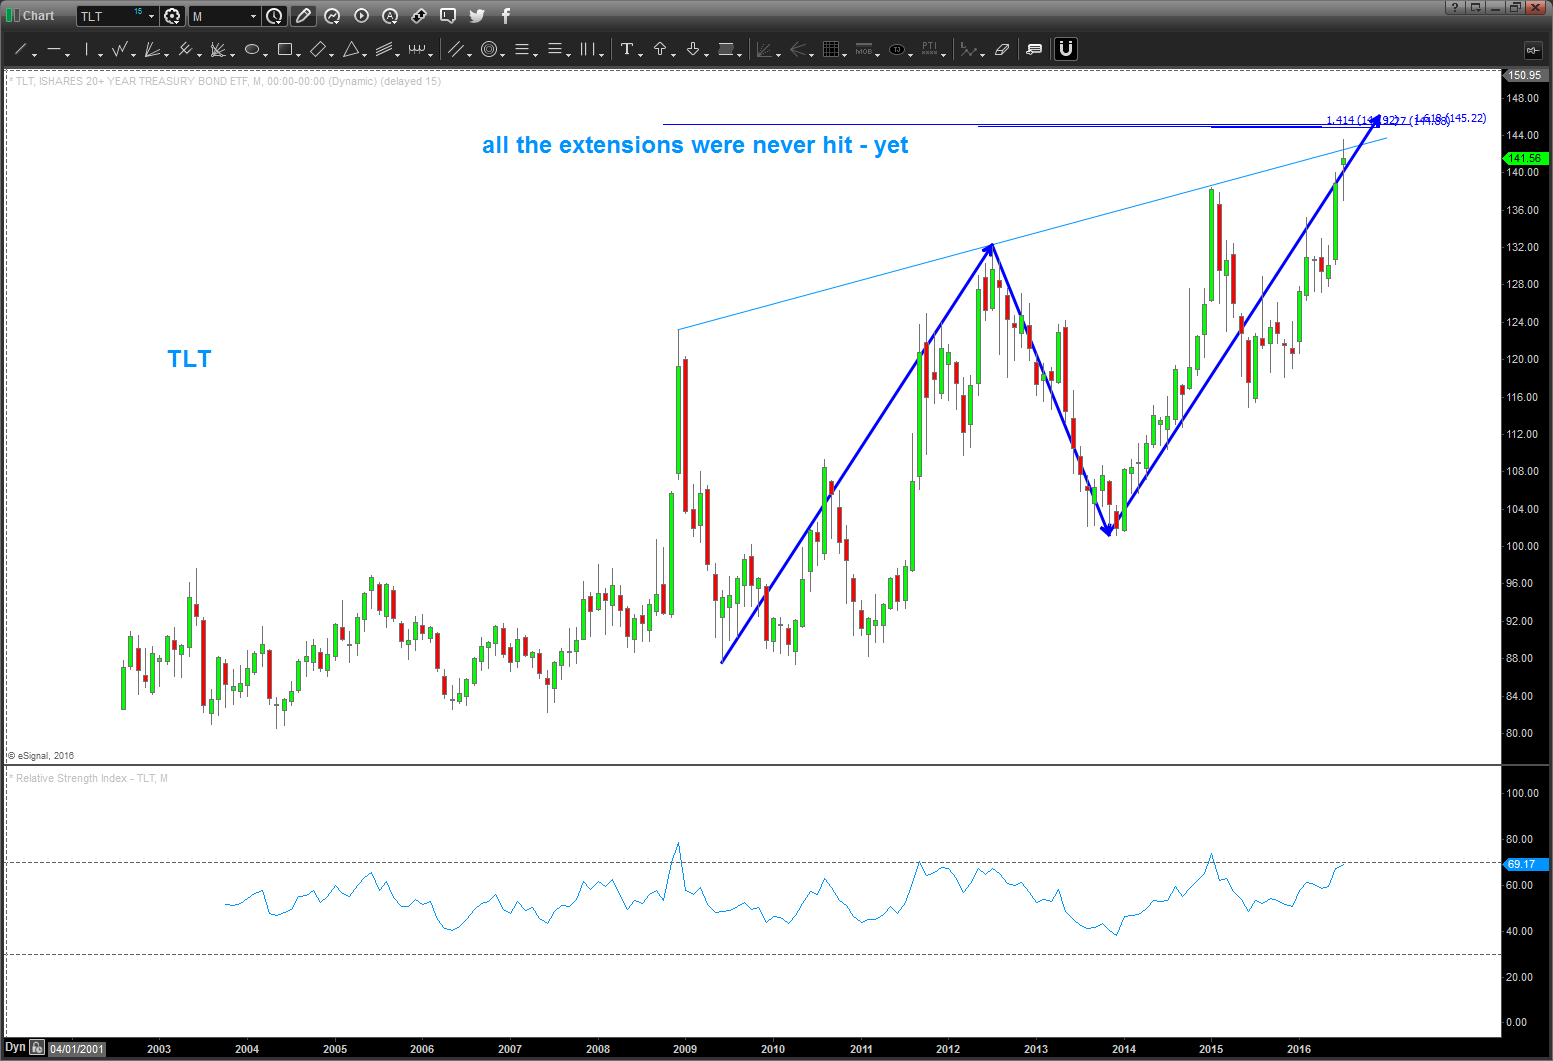
i did this post for @seeitmarket around the TLT (long bond (20 year +) ETF: http://www.seeitmarket.com/tlt-price-target-view-treasury-bonds-stretched-15862/ and the targets around 145 still loom ….
so, here’s the long bond and the TLT charts ….not trying to “call a top” just find patterns. could they keep going higher? well of course ..but man, this is really getting quite crazy now, isn’t it?
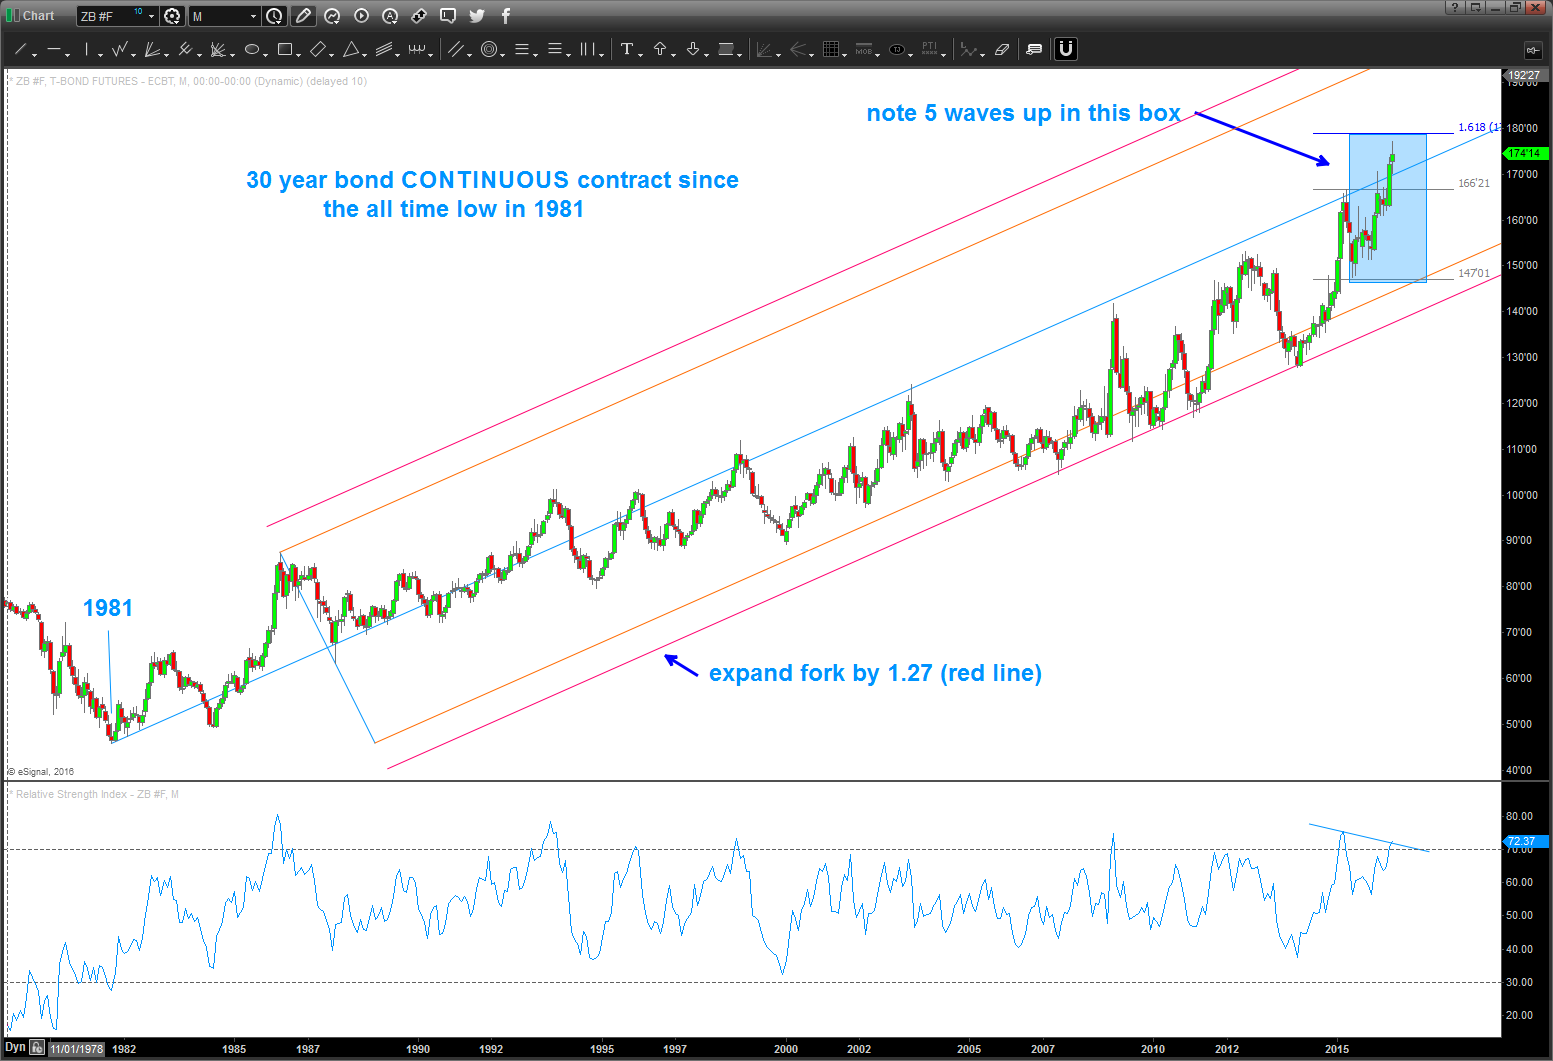
note, on a monthly you can see 5 waves completing (30 year continuous) and that should mean a pullback but is it the 5th of the 5th? who knows …