Housing … just keep your head in the sand OR are the clouds forming? UPDATE
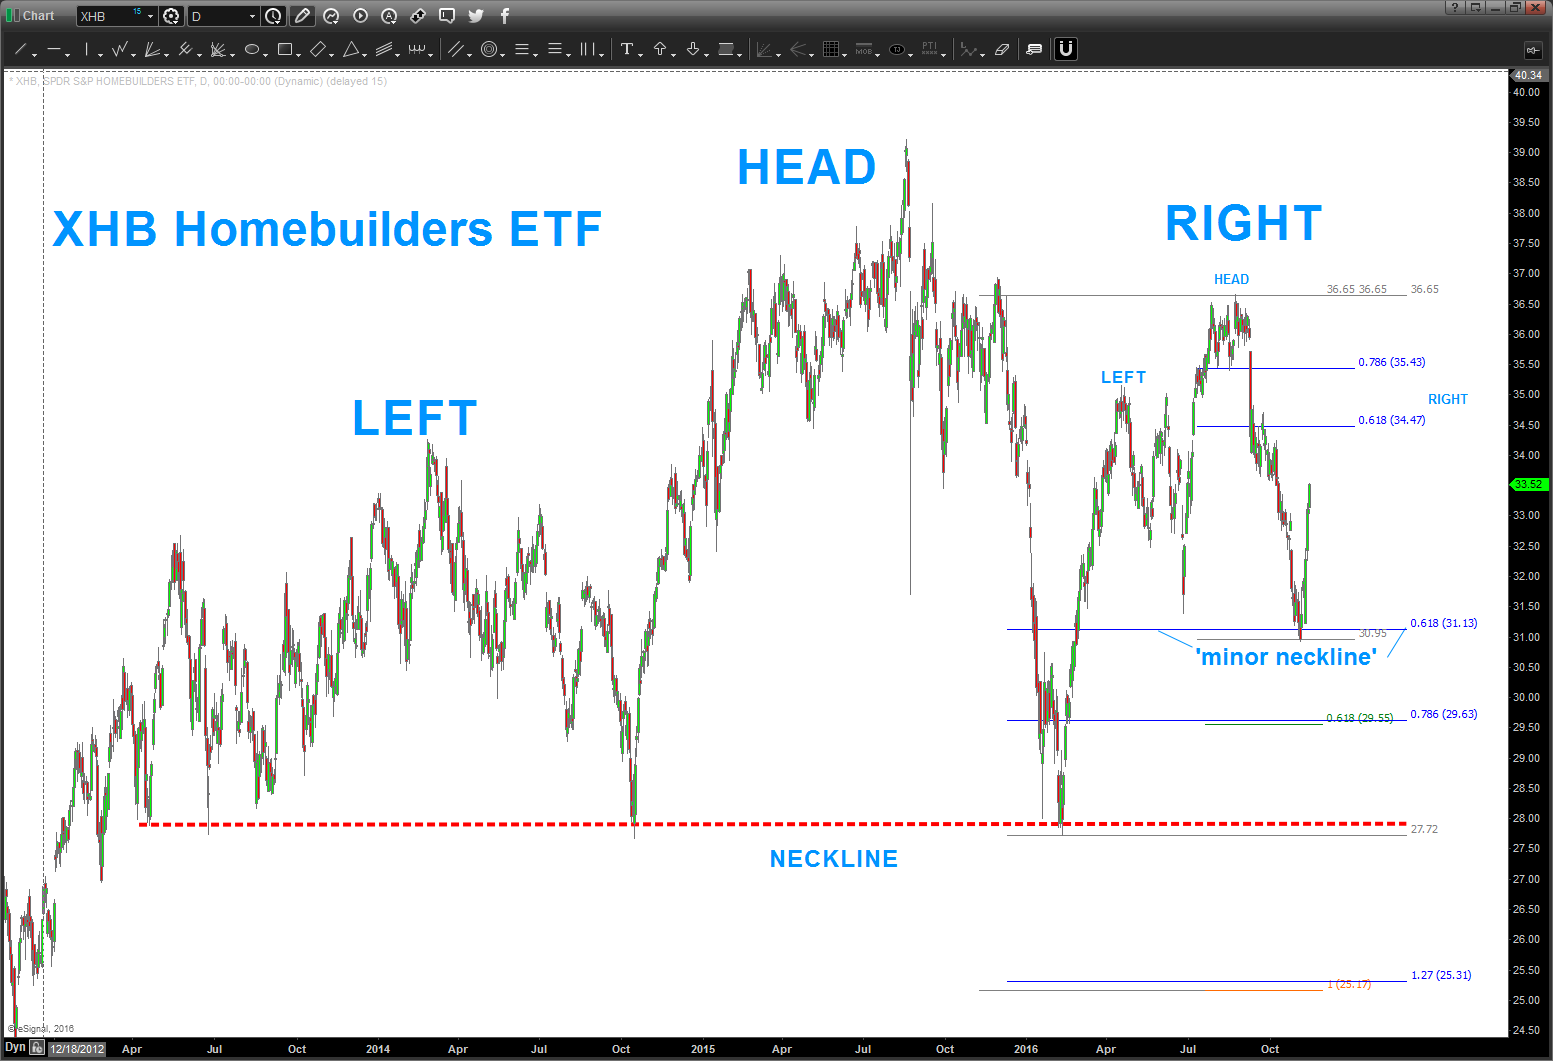
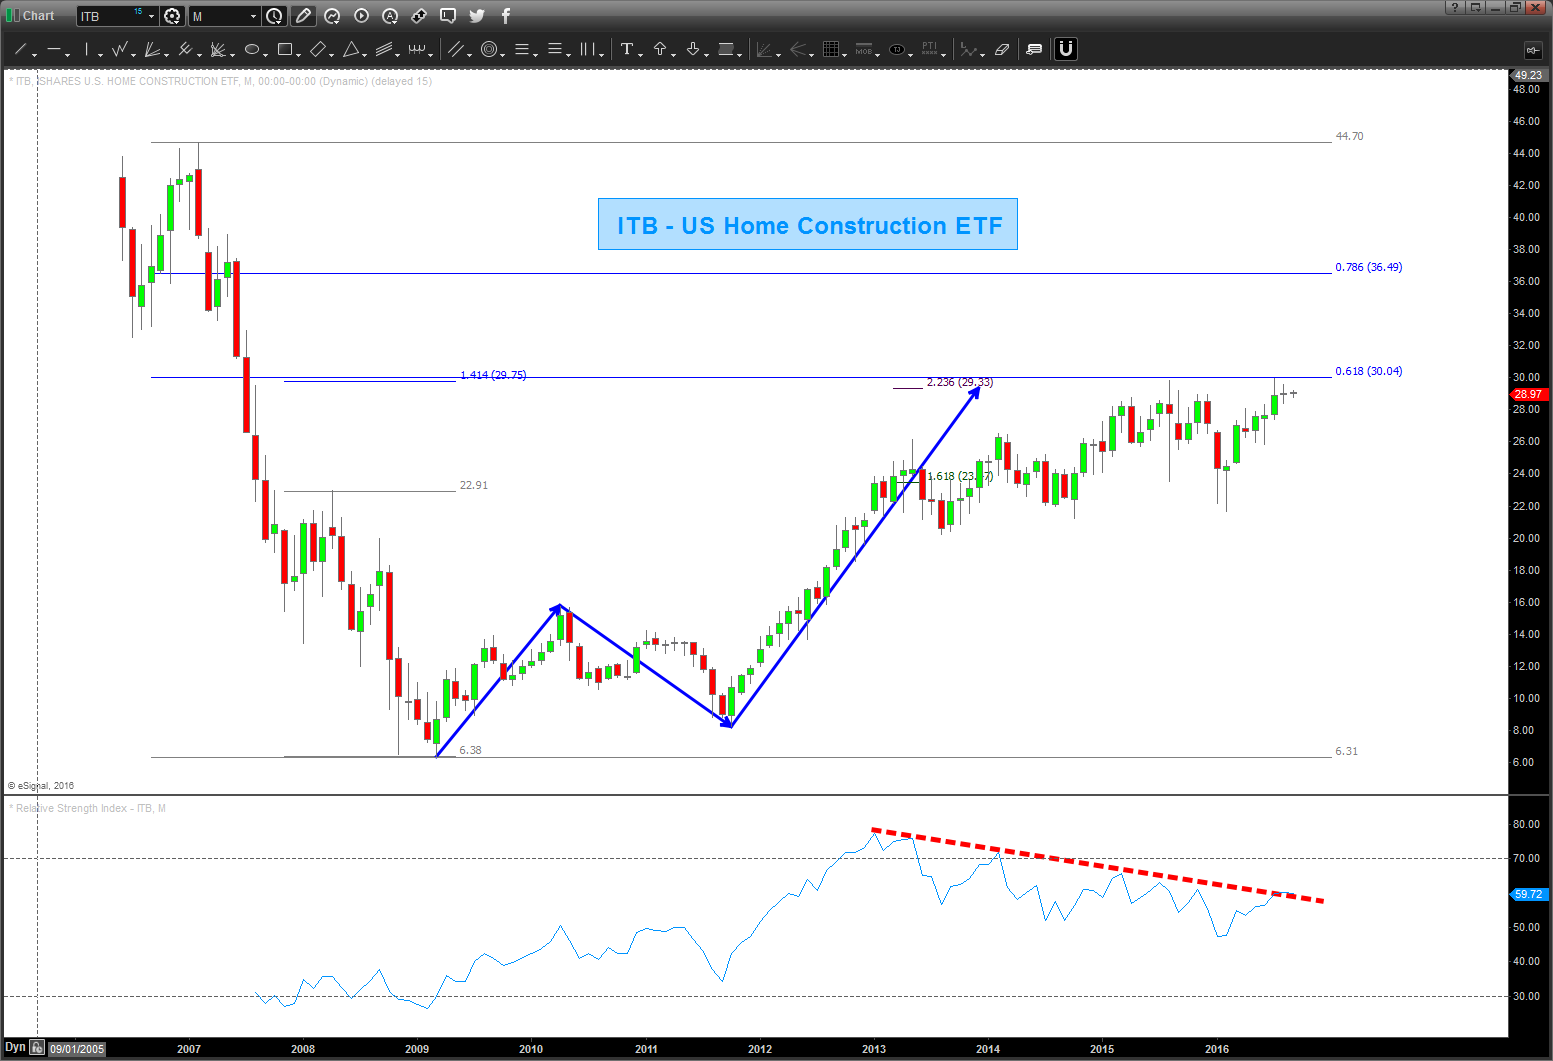
11/14/2016 – since the Election, the XHB ETF has taken off like a rocket ship. You can see below that it hit the .618 retracement from the Spring low of 16′. Upper targets are being shown in around 34-35.
were still working w/ the thesis that the 39 level was the completion of a major sell signal for the homebuilders. This straight up action of late is something to watch closely for this thesis to hold.
of note, a friend of mine sent me this headline:
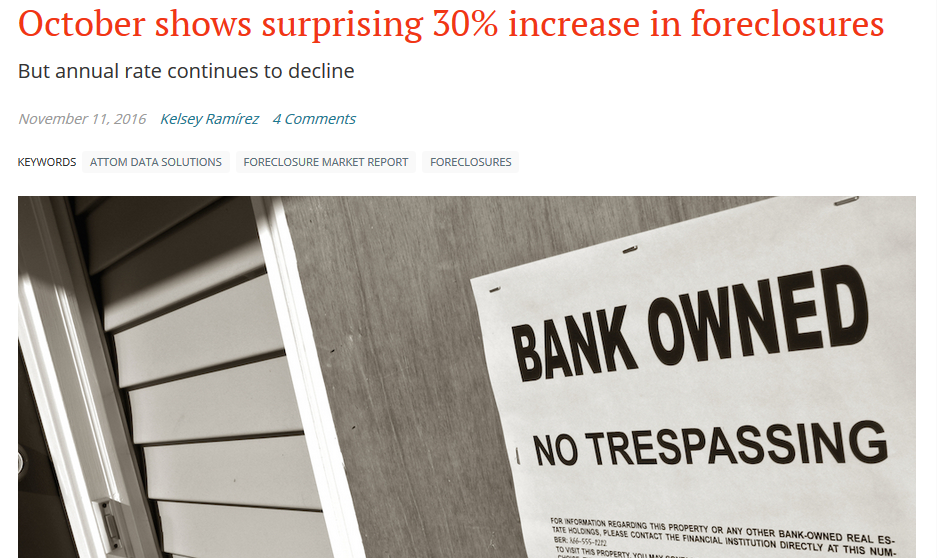
the rise in foreclosures last month was the highest since the big crash. Something to note .. however, the annual rate is still declining. Is this a divergence forming and a potential inflection point? I don’t know … but price/time will tell us.
Bonds are getting smoked of late causing rates to rise …
For those who have followed me you know that I’m usually ‘first to the party’ and ‘see’ things months if not a year in advance. that’s what patterns tell you … i’m not trying to put any spin on this folks. We are at ZIRP, I have houses all over the place going into standing inventory status, rates are rising and we just had a ‘big’ increase in foreclosures last month. Remember – almost a year before anyone paid attention to the Chinese Yuan I saw the BIG JUMP and said … this is something to notice. (https://bartscharts.com/2014/12/06/most-important-chart-to-end-2014/)
So, that’s all I’m doing again ….
Also, take notice of the big time SELL PATTERN FAILURE on the Banking Index. Multi-level chess game going on right now … trust the patterns and they will all line up. That I know …
Do well, be good and rock on, always.
Bart

I sold my house in VA and moved out to SoCal to rent .. did it for a number of reasons. The NUMBER 1 reason was to learn how to Stand Up Paddle-board Surf and enjoy the weather. YES, I understand it’s financial suicide out here .. the taxes are crazy, the cost of living is crazy but the surf is good man …
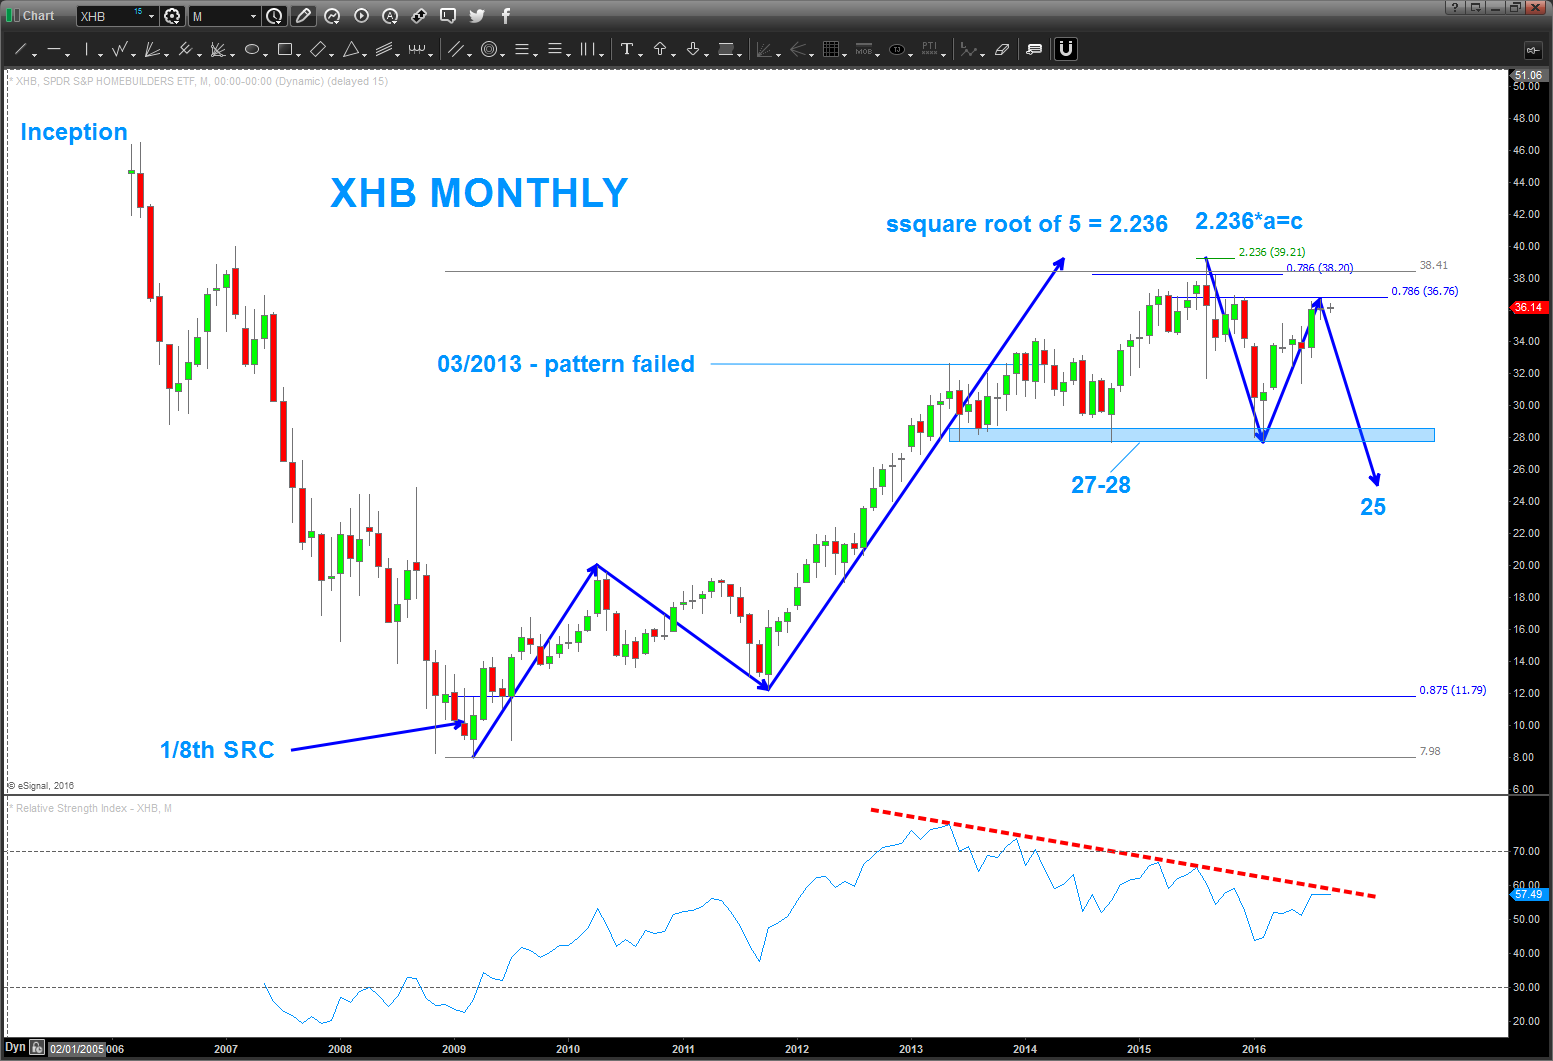
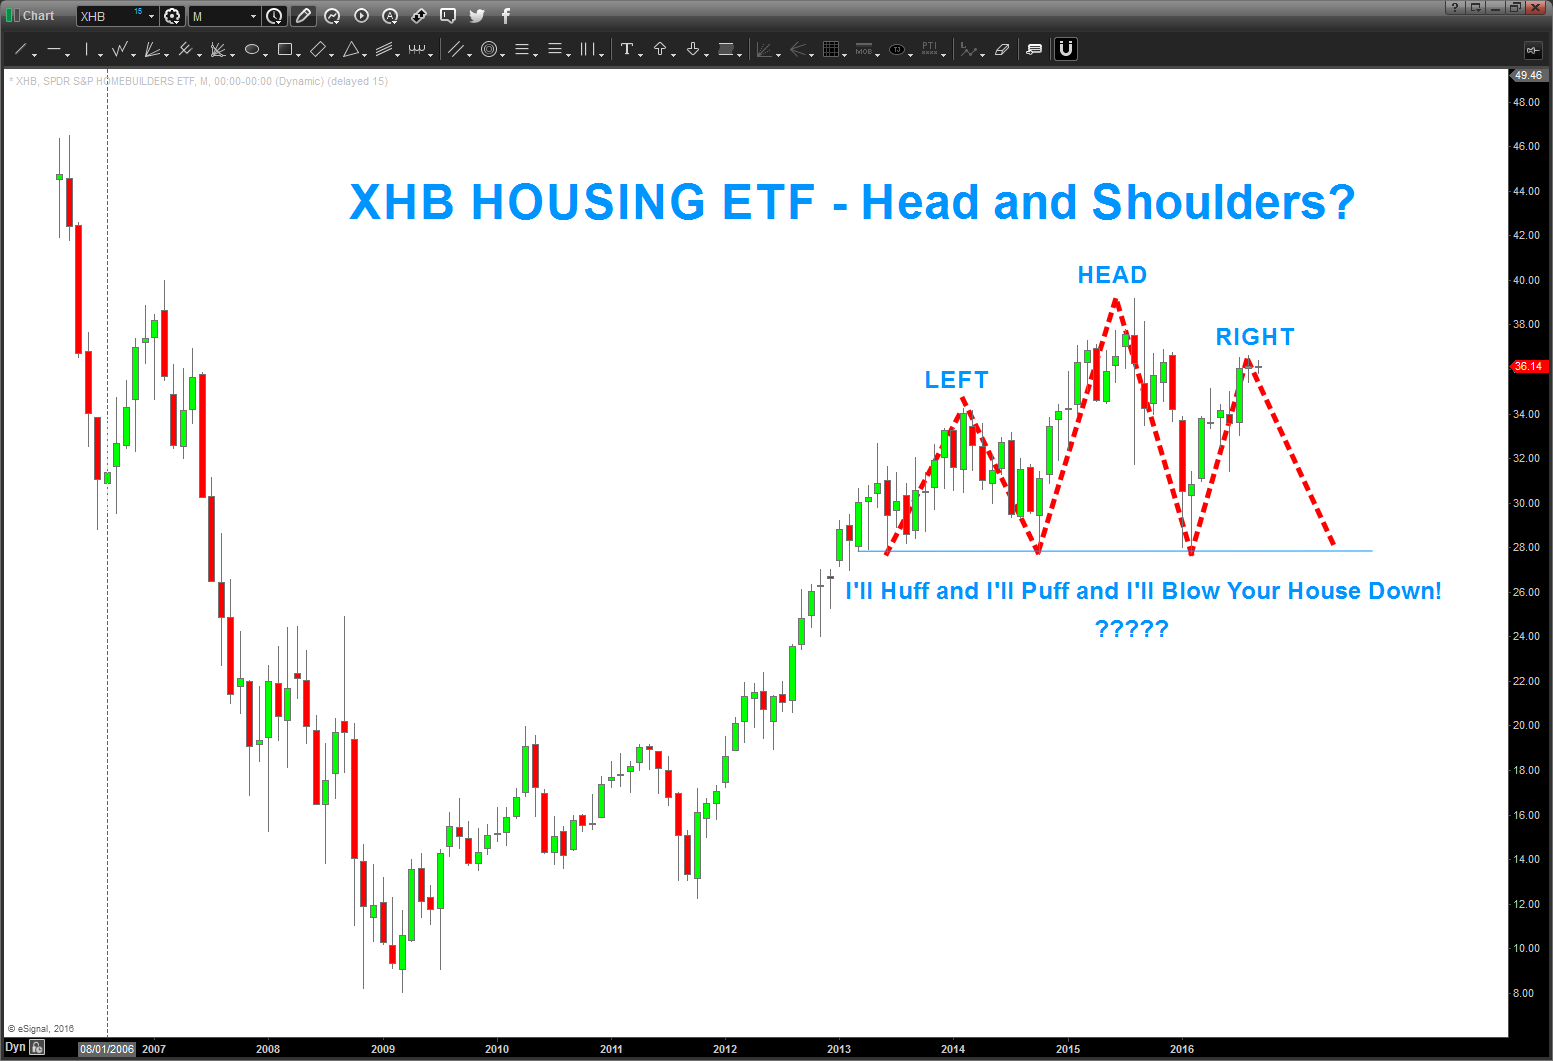
I was SO HAPPY to unload the house … why? Well, I think we are on the verge of another big old smack down in housing. Of note, my post from March 2013 (yes, 3+ years ago that the home builders had topped in/around 32 did not come to fruition. In essence the pattern failed .. so, it went up to the .786 and also completed the 1/8th signal reversal candle. Now, we’ve rallied right back up to the .786 level and are at the demarcation point.
Study:
- this ETF doesn’t want to go below 27. Big support …
- also, note the AB-CD projection down to 25.40 – if we crack from here expect support there and if BULLISH this will hold and bring it to new highs. If it fails … watch out below.
- THOSE are the levels to watch …
- sure looks like a MONTHLY H&S pattern for this ETF … doesn’t it?
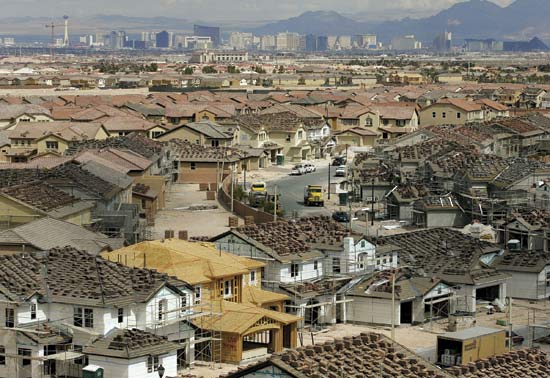
To finish the story about San Diego … I was driving around the other day and noticed TONS of standing inventory …plus the houses were selling for 850K to 1.0 + MM. Folks, that dog don’t hunt man …
Also, the PATTERNS suggest a MAJOR top in bonds which means higher rates … so, it’s been 3+ years since my last post on home builders. It’s moved, a little, perhaps it will move more, but man this sure looks like a BIG top is coming in housing ….
Here’s the Home Construction and Home Builders ETF (ITB and EHF)
Again, folks, it’s just PATTERNS. Sometimes they work, sometimes they don’t … but at least we have some guides to support what could (could being the operative word) a BIG OLD THUMP in housing …
Bart
