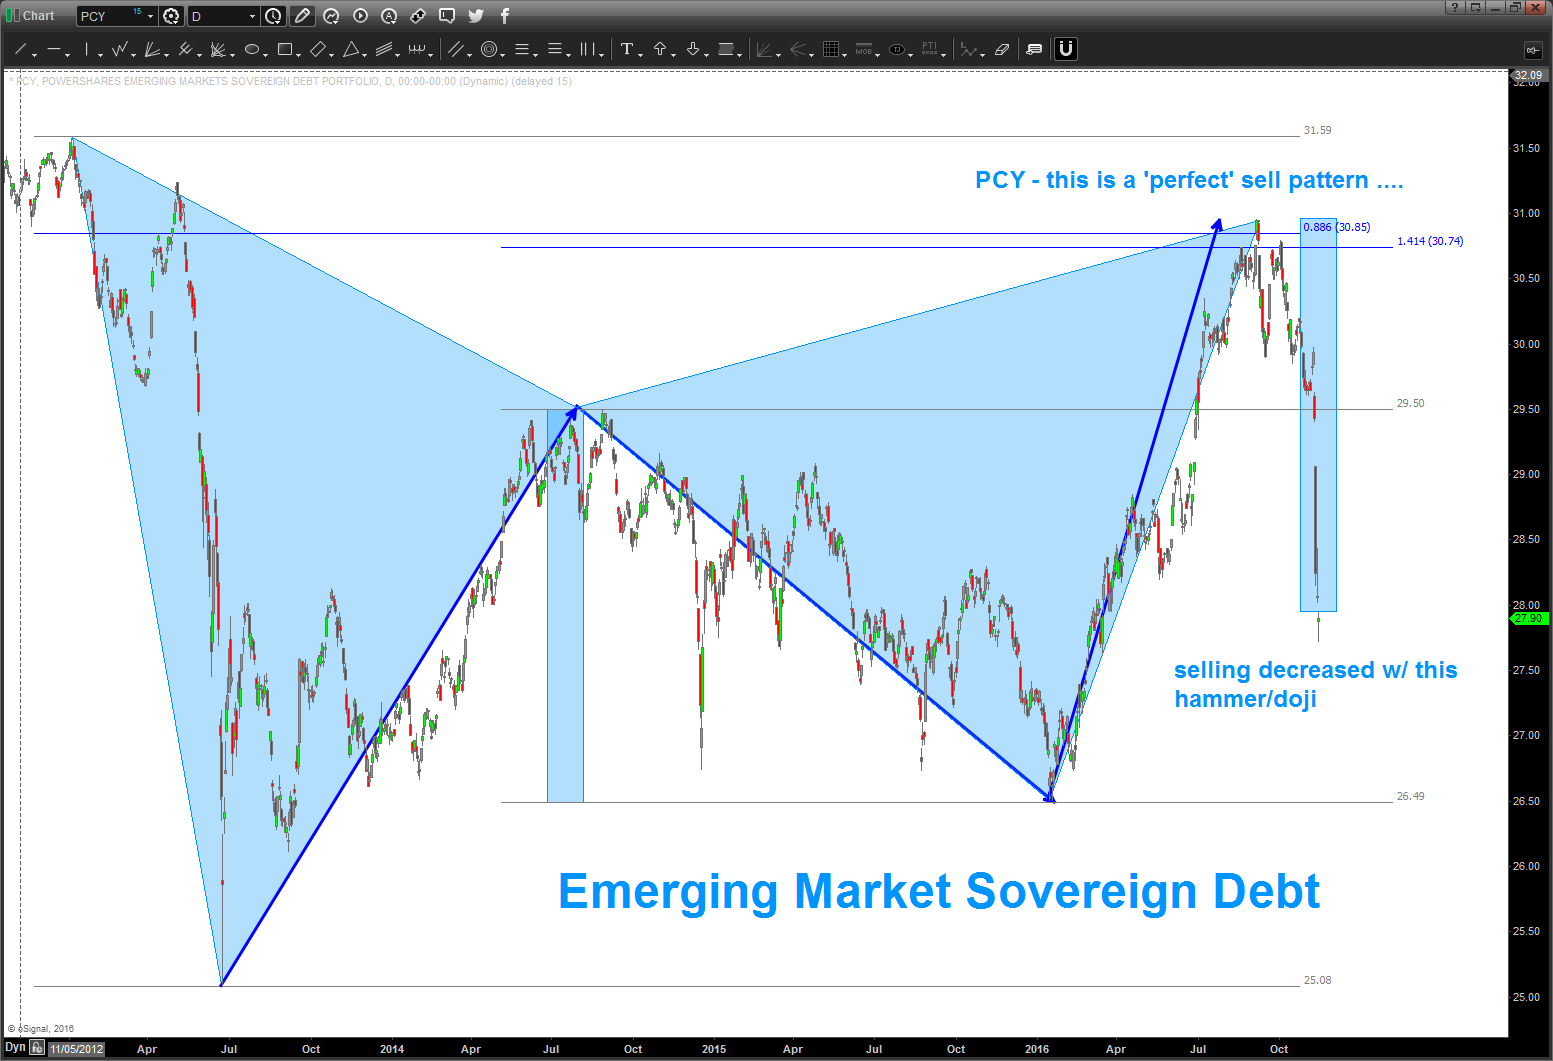
Emerging Markets Sovereign Debt ETF PCY
folks, so I was asked to take a look at this ETF. I had never looked at it before … but man, what a gorgeous sell pattern. This one worked….looks like the banking index sell signal. some work some don’t – use a stop.
anyway, here’s the PCY Sovereign Debt ETF .. the weekly shows a cliff of support much like crude a while ago before it thumped. the selling pressure appears to have stalled for now (note doji) but it ‘should’ go to 24-25 and that’s where the real fun begins.
one could say the neckline for this entire thing is at 27 or 25 … either way, see the big old thump forming?
let me know if you have any questions.
B