Dollar Index since the Plaza Accord …room to run, BUT (?) …UPDATED
Posted on December 30, 2016 3 Comments
12/30/2016 – updating the US Dollar Index post
- bearish divergence – check
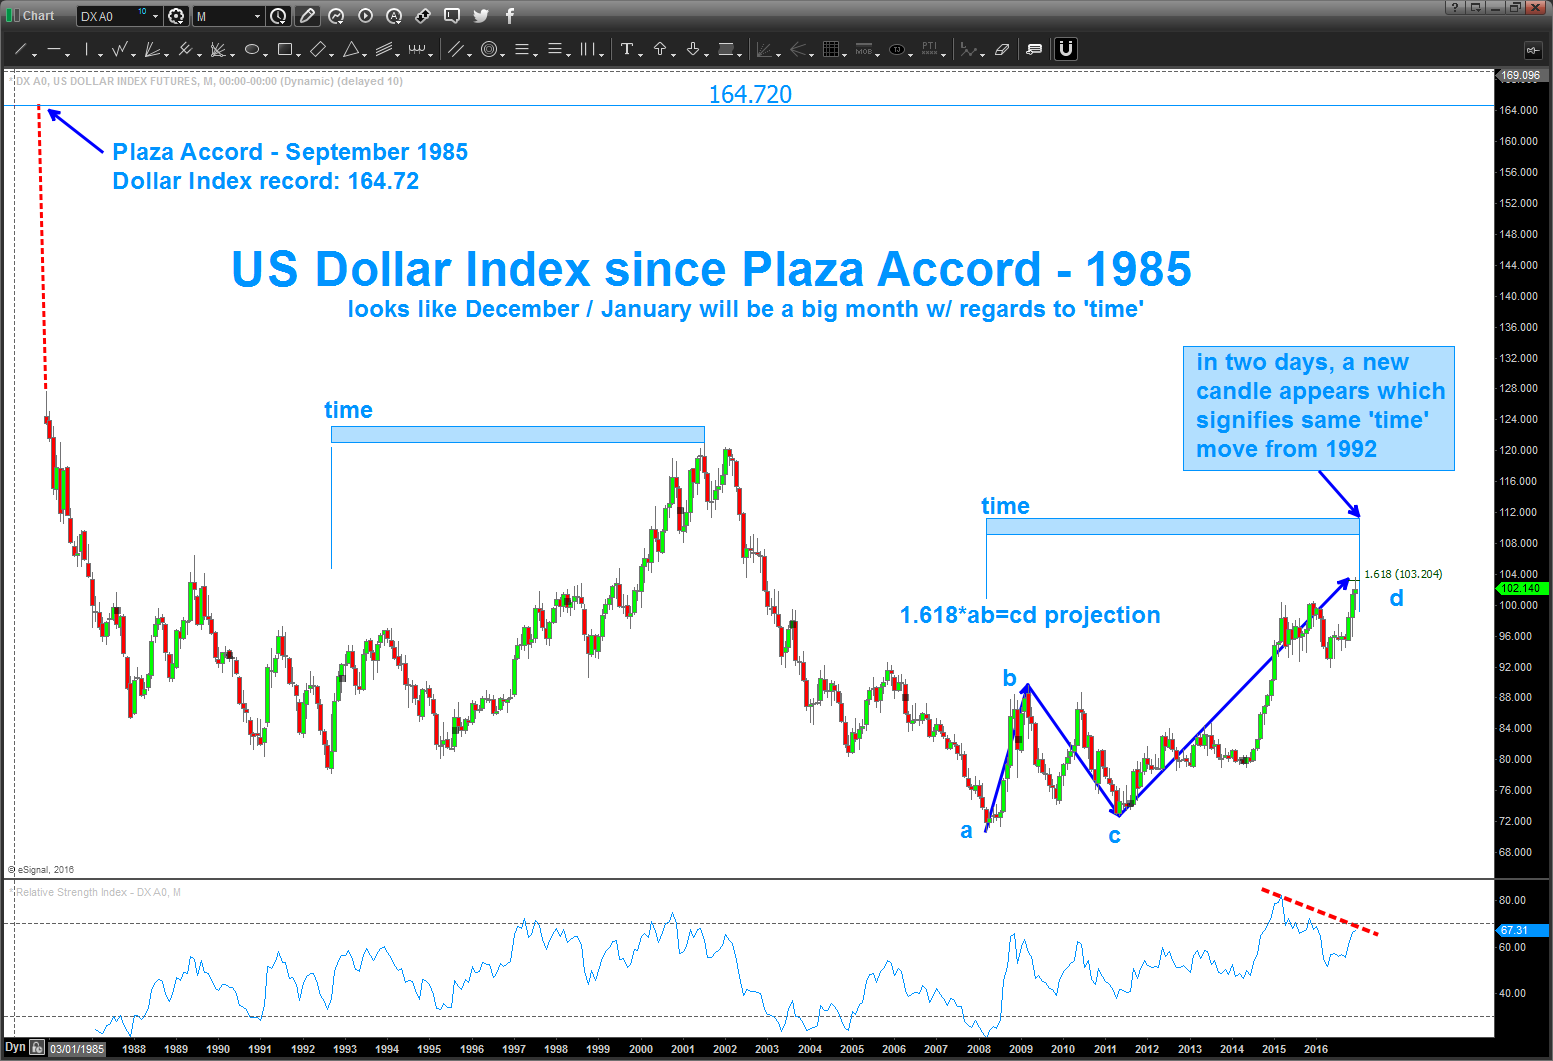
- 1.618 price projection hit – is this an a-b-c correction and the dollar has peaked? Potentially … or is wave 3 of 5 concluding w/ a pull back imminent?
- SENTIMENT is extreme bearish for the EURO and GOLD
- note – we are hitting the same TIME correction in a couple days as the move up from 1992-2001
- Economist .. the best contrarian indicator out there.
CLIFF NOTES: if you read below you’ll see there are other targets higher. We are approaching the same TIME as the last move up in the dollar against the smash from the Plaza accord so the ‘no brainer’ long dollar trade is one that begs of caution. Is this THE top in the USD and now we go back below 70? Don’t know, but a preponderance of evidence suggests STIFF resistance from now into January for the USD.

11/19/2016 – if you want to follow the Dollar posts, just search dollar on the top right area of the blog. the overall thesis, which has proven to be correct so far, was the dollar was going to strengthen all the way from the low 70’s. it’s been a nice run …
is there higher to go … yes.
but then …
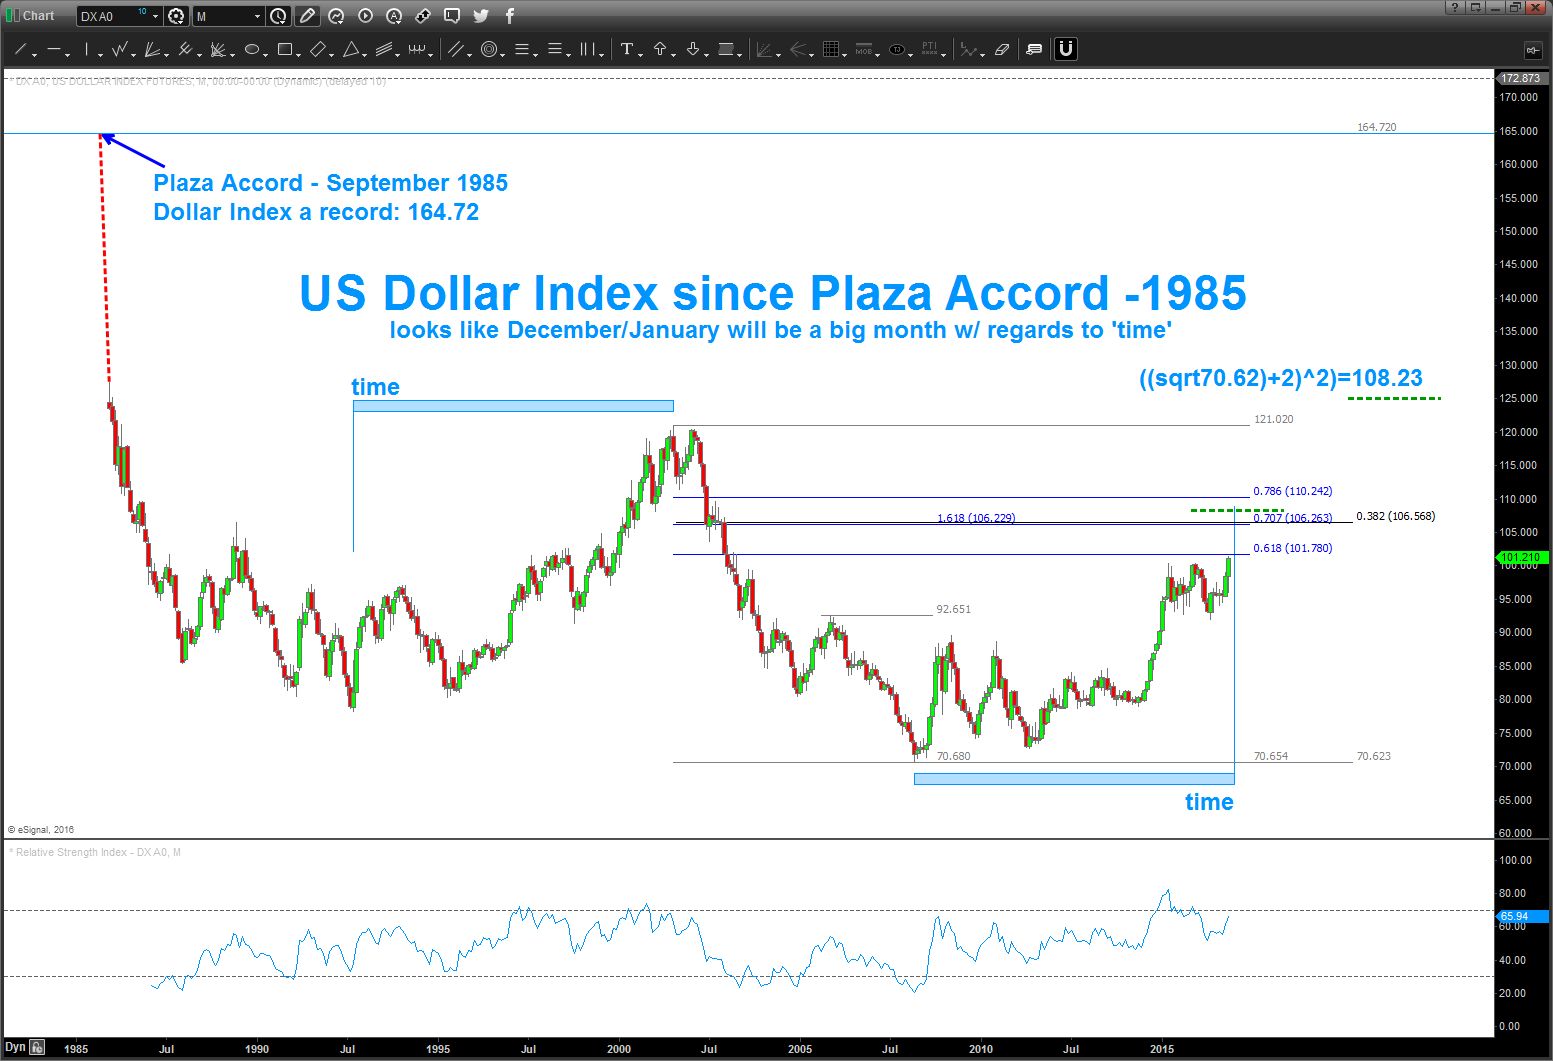
here’s the picture – note, I’ve used the high from the Plaza Accord in 1985 to put the .382 retracement on the chart. That also overlaps w/ some nice other extension and retracement ratios. Believe the highlighted area in/around 107-108 is going to be key.
also, note the TIME component between the last major rally from 1992-2001. Next month, or, depending on how you draw the time component, perhaps January the Dollar Index should run into some pretty stiff resistance in TIME.
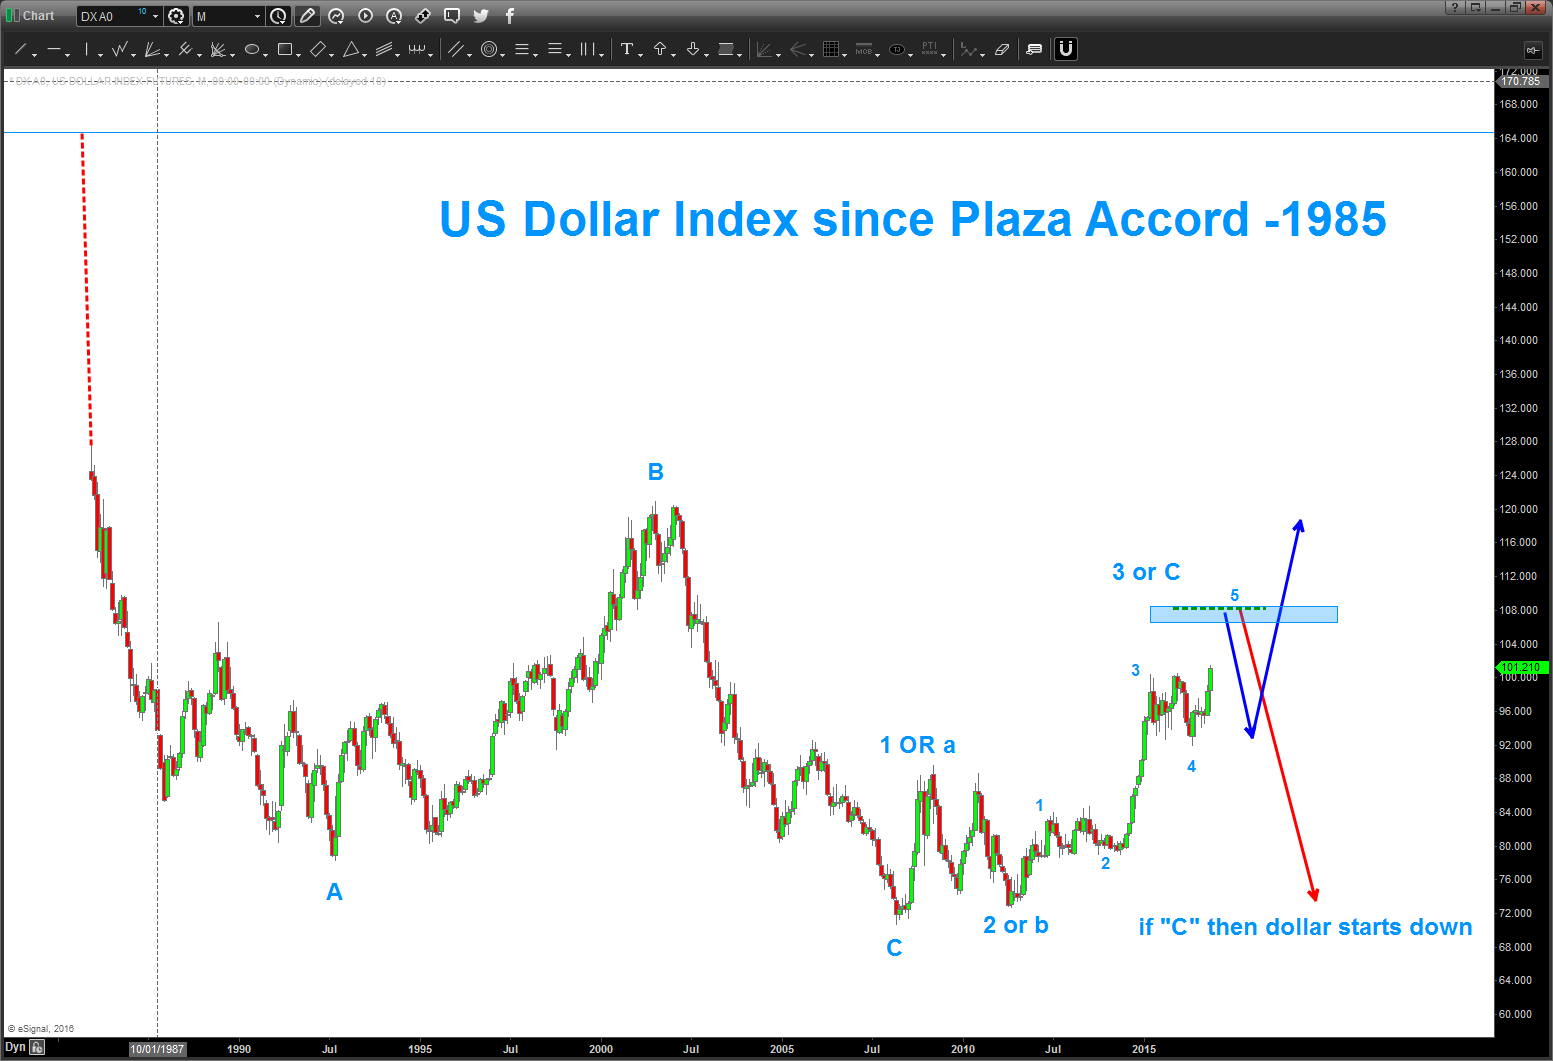
last thing is the Elliott Wave count … I always tell people – I LOVE Elliott wave – when it works. here, the count has been pretty much a “Ray Charles count” on a long term basis. I’ll try to walk you thru the importance:
- market corrects in 3 waves labeled a-b-c
- the market moves impulsively in 5 waves
- wave 2 can’t overlap the beginning of wave 1
- wave 3 can’t be the shortest
- wave 4 can’t overlap the beginning of wave 1
- if you take the low in 2008 and start working your way up we see that we are ‘clearly’ creating 3 waves into yesterdays price action.
- here’s where it gets tricky .. simply, I don’t know if this an a-b-c big corrective move OR we are impulsively going higher in a 1-2-3-4-5 sequence.
- the key here – wave c (of a-b-c) always has to be 5 waves (unless in a triangle)
- so if you look you can see the ‘small’ 1,2,3,4,5 being carved out (Turkey reference) so the blue highlighted area 107-108 COULD be the end of a C wave and the entire A-B-C move OR the end of wave 3 and we correct 4 and then off we go again in 5.
I honestly have no idea ….
Here’s what the charts are SHOWING US:
- square root target
- the ‘time’ of the last corrective move
- the ‘count’ showing we are in the 5th wave of C and 3
- EXTREME sentiment for a strong dollar
- the .382 from the all time high
- divergence set up on Monthly RSI
- ‘other’ extension and retracement targets
Expect some major resistance .. again, we are 6 handles away from the target area and that represents HUGE moves in currency .. BUT remember, right now, we are at extreme (not historic) but extreme sentiment and this has never proven to be wrong from a contrarian indicator. This puppy could snap back on you really really quick.
only TIME will tell … let me know if you have any questions.
B
Gasoline Futures, the Aussie and Audioslave …update to the update
Posted on December 29, 2016 Leave a Comment
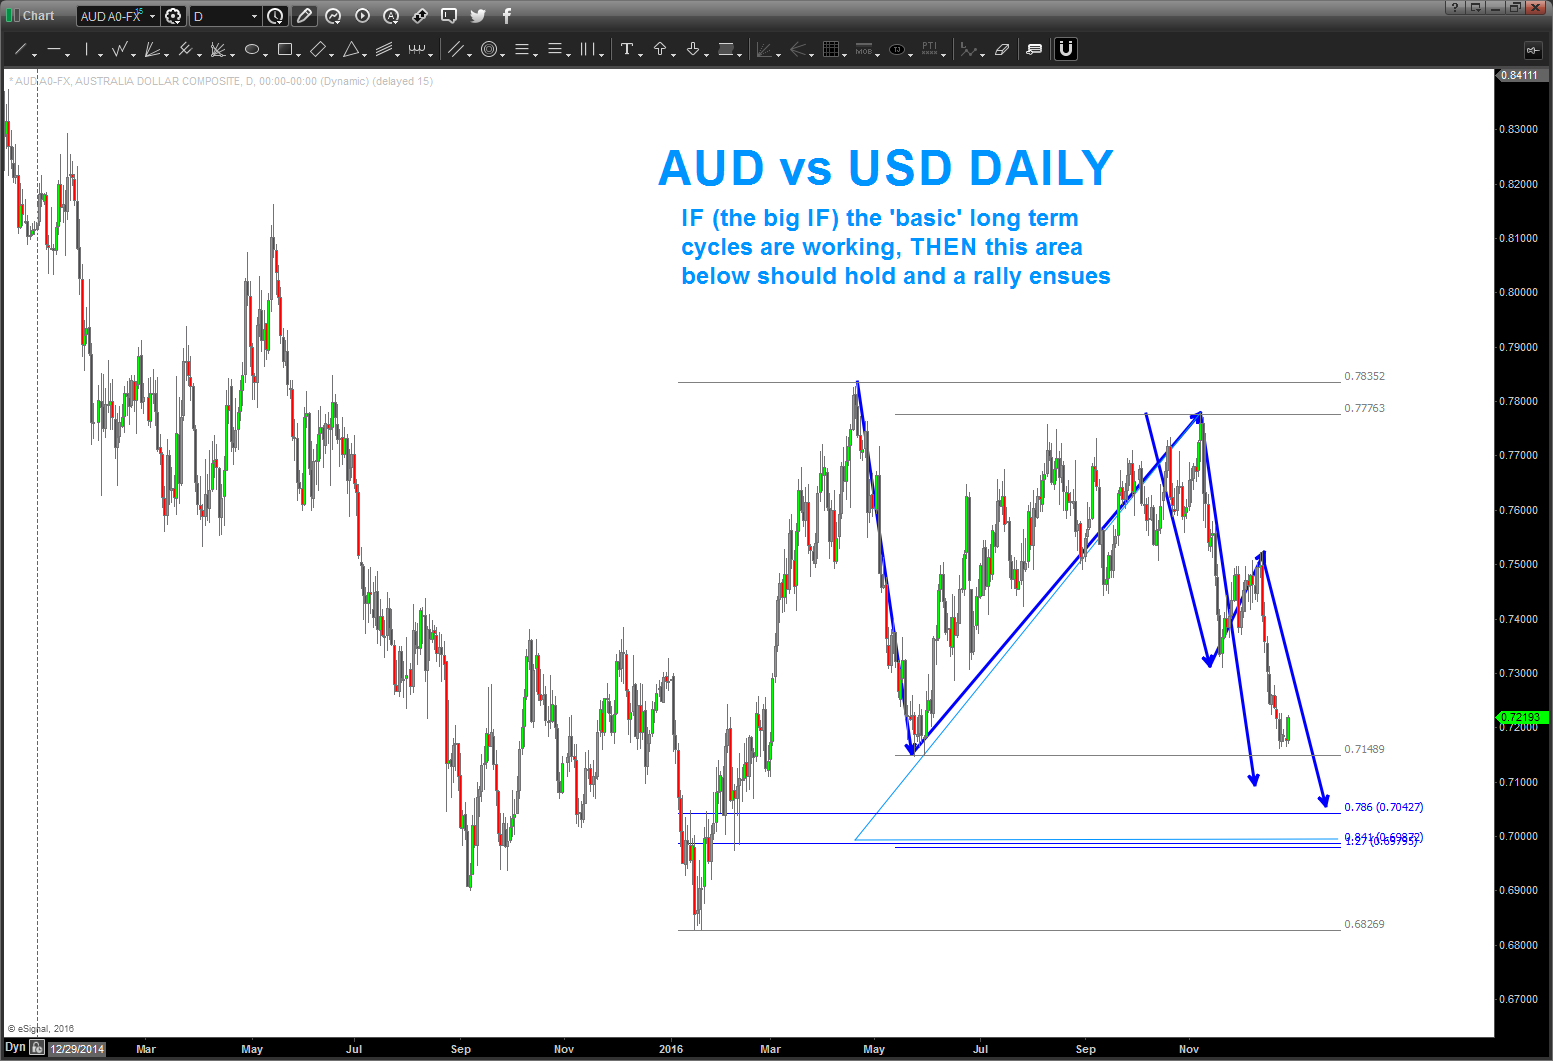
12/29/2016 – updating Aussie and Gasoline.
Recommend paying attention to:
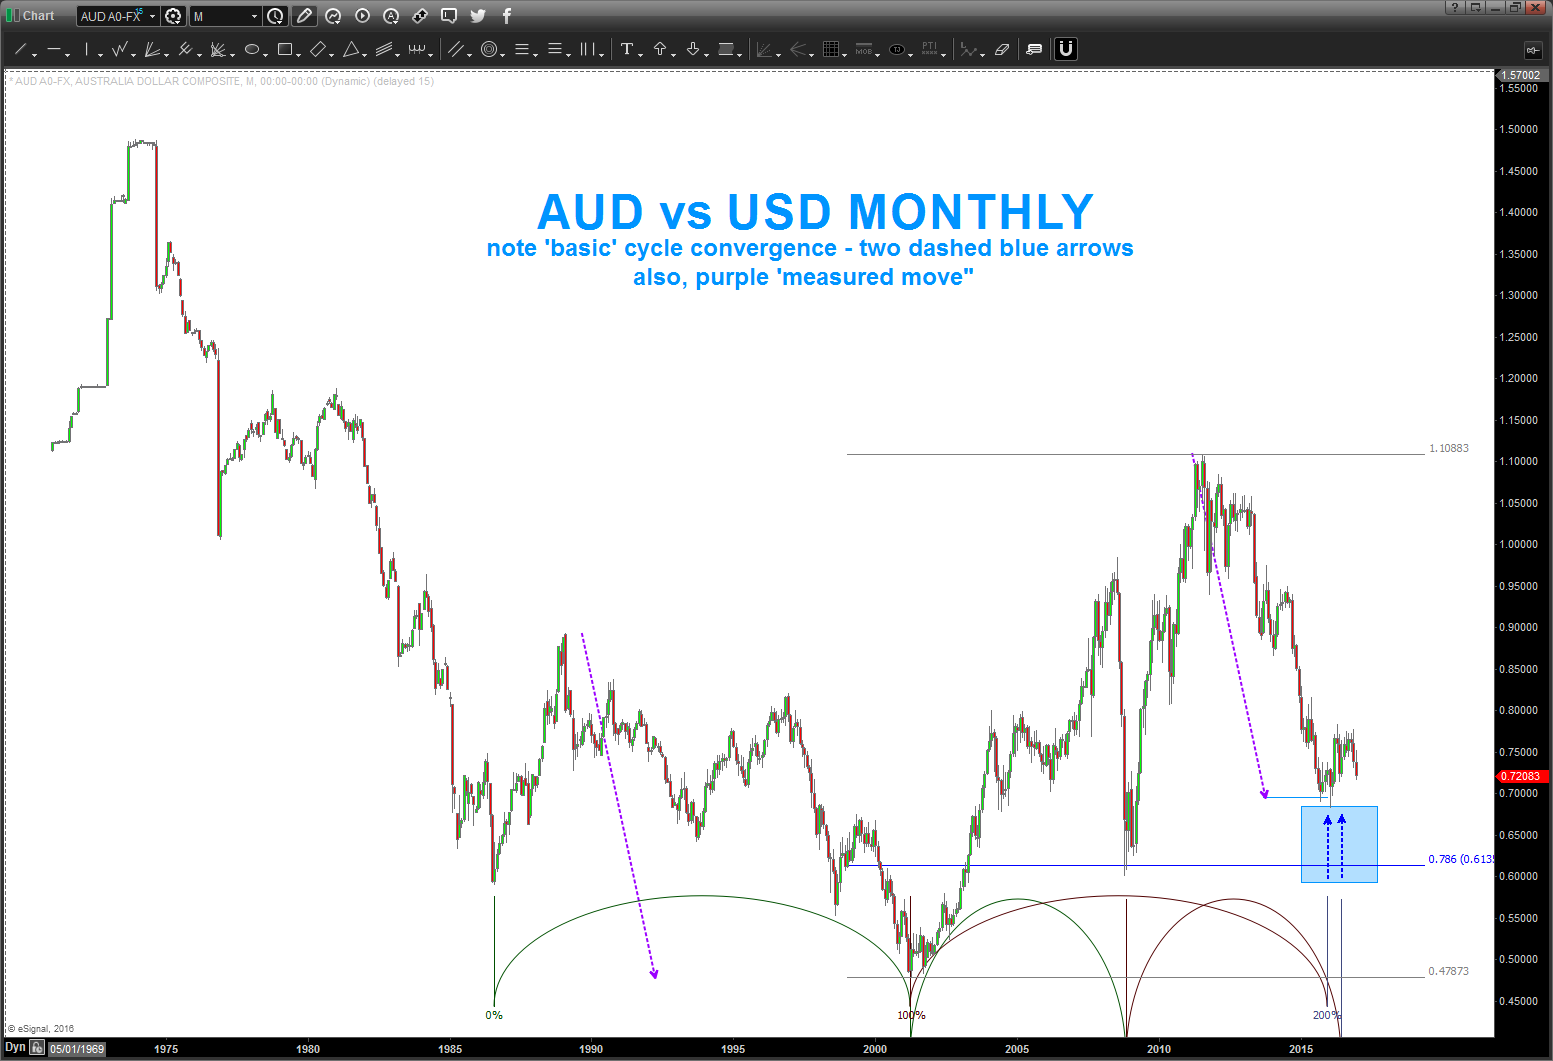
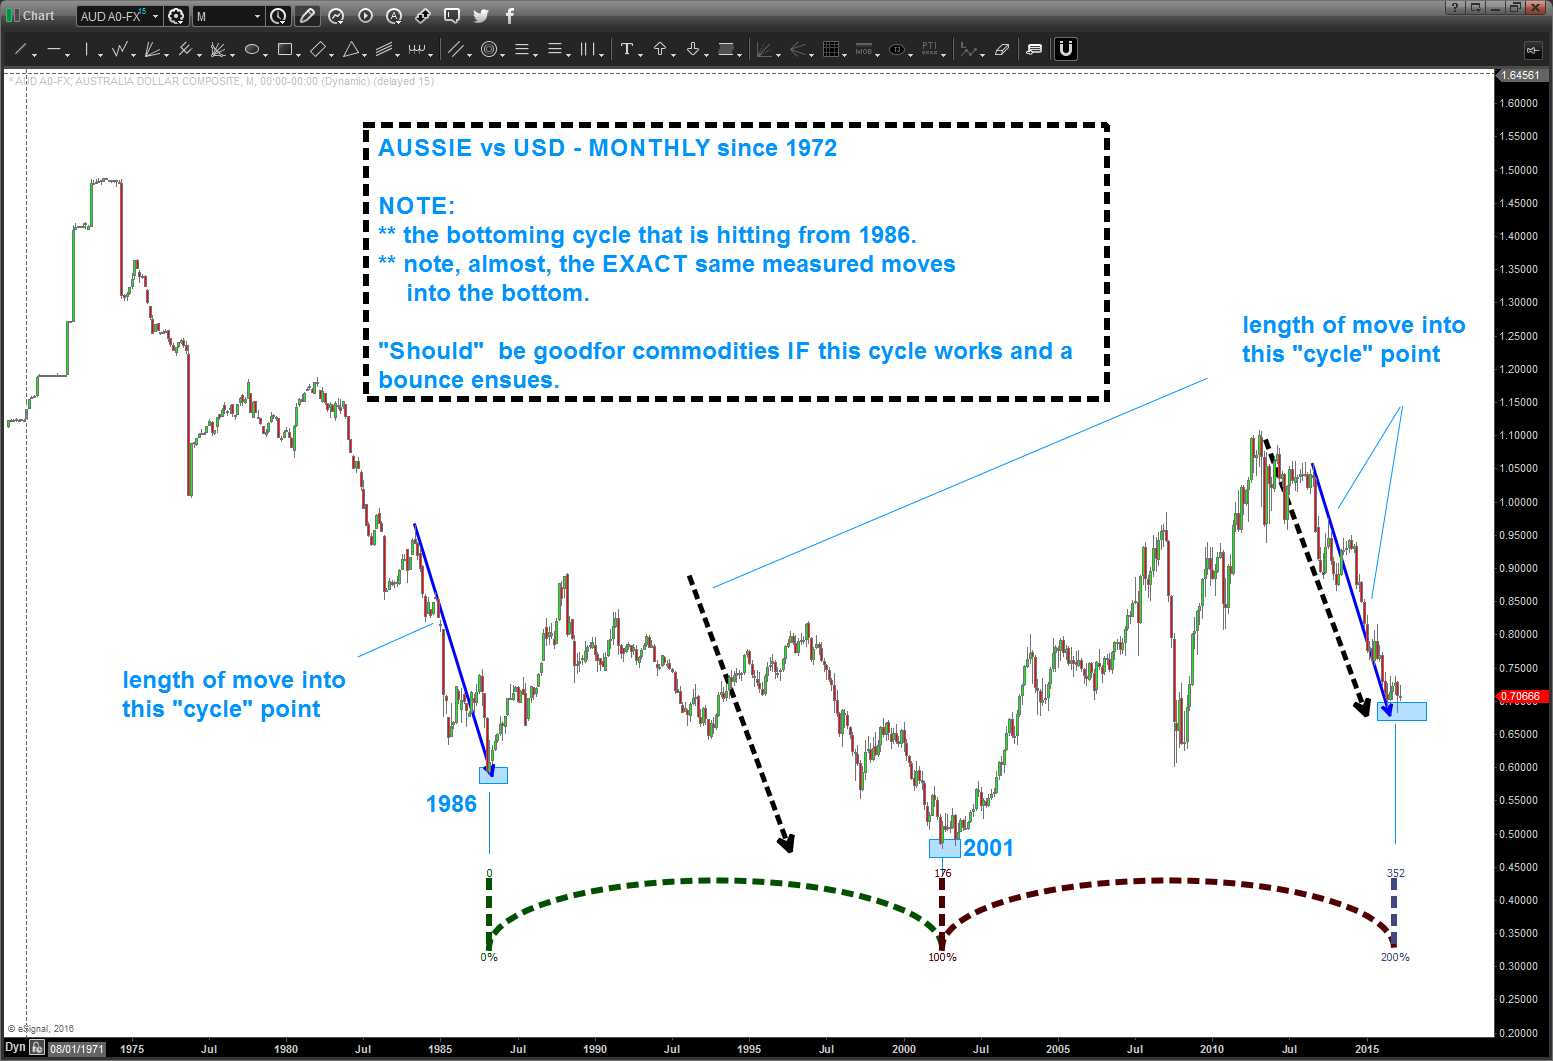
- long term basic cycles that hit on the Aussie Monthly along w/ the dashed purple measured move
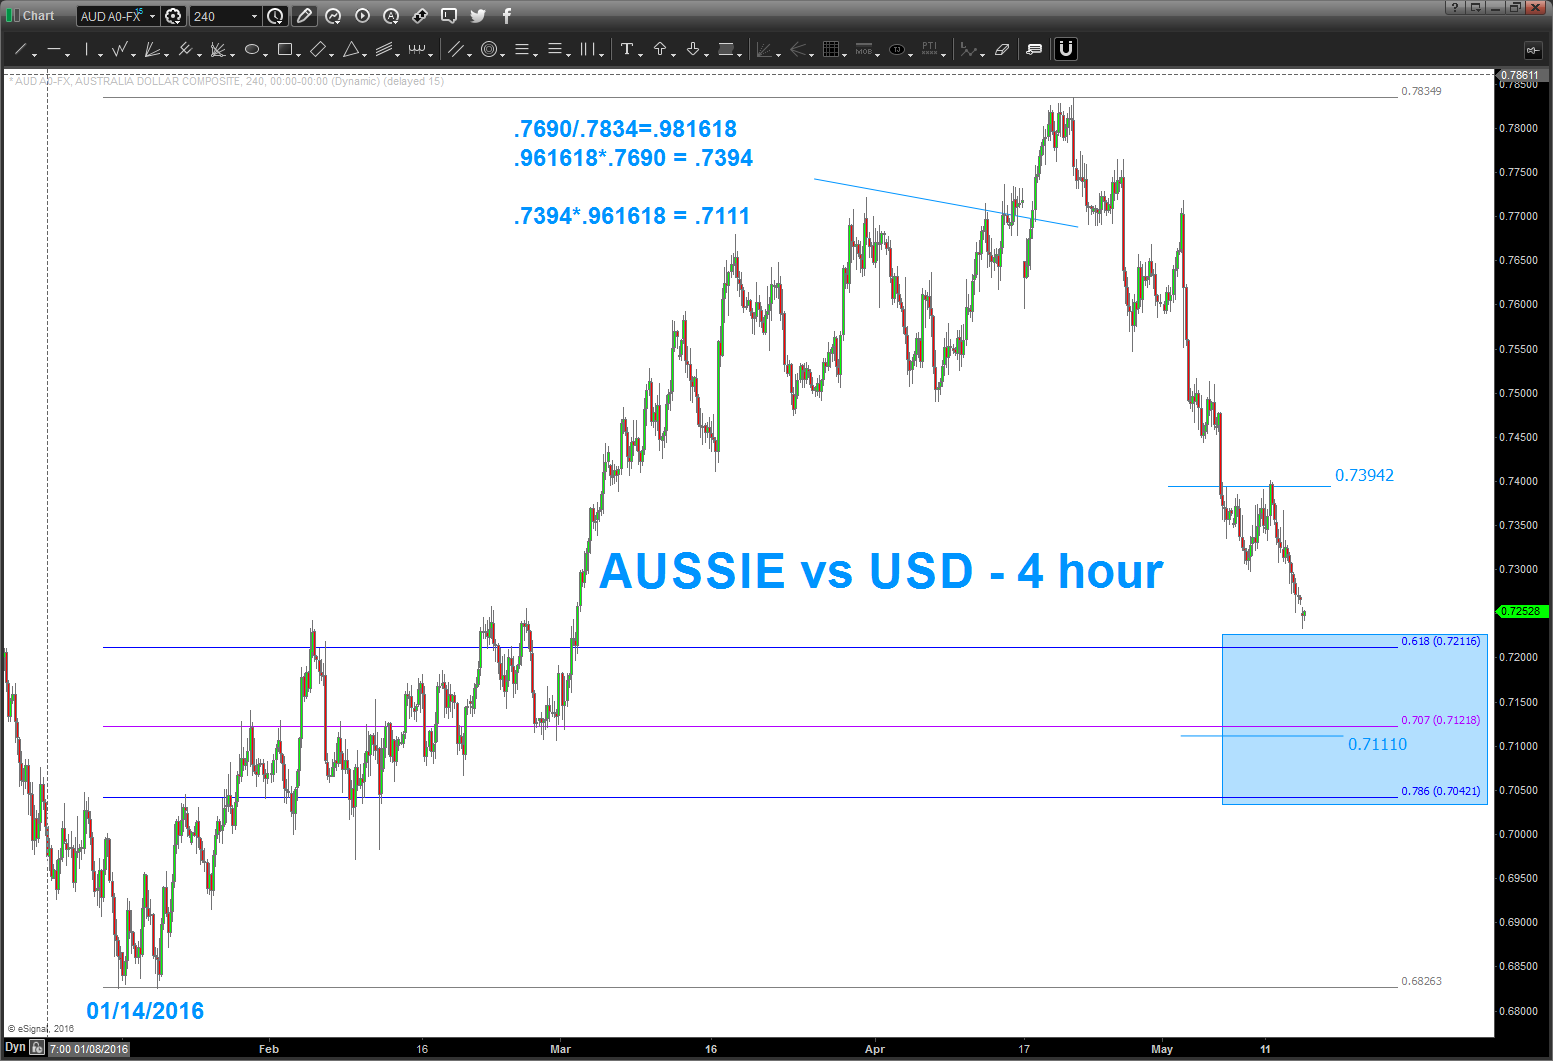
- the daily BUY pattern on the Aussie
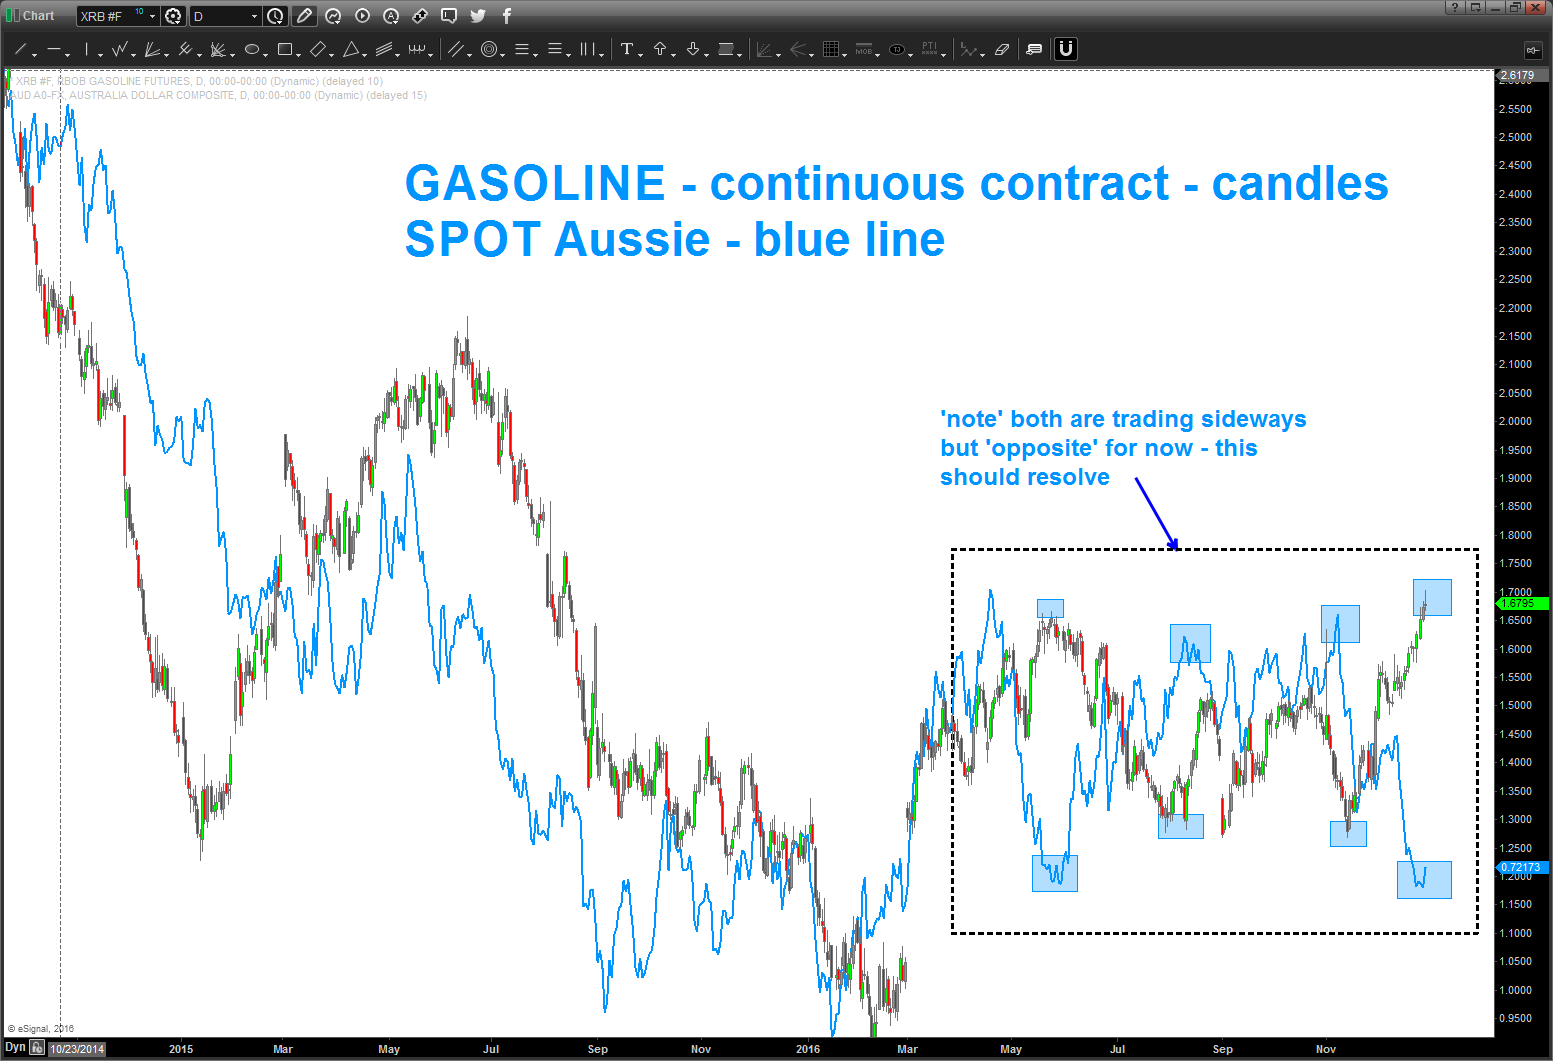
- note, both Gasoline and Aussie have been churning in around here BUT they are opposite. When the high of the gasoline range is hit, the Aussie is bottoming and vice versa.
- THIS SHOULD RESOLVE for true directional move … historically, Gasoline and Aussie trend together. while not a perfect trend fit (sometimes they lag or lead each other) the overall direction has been consistent and helpful.
- just spit balling here BUT sure looks like Gasoline wants higher so, ultimately, will this push Aussie vs USD higher? the BUY pattern on teh AUSSIE will give us a heads up.
Bart
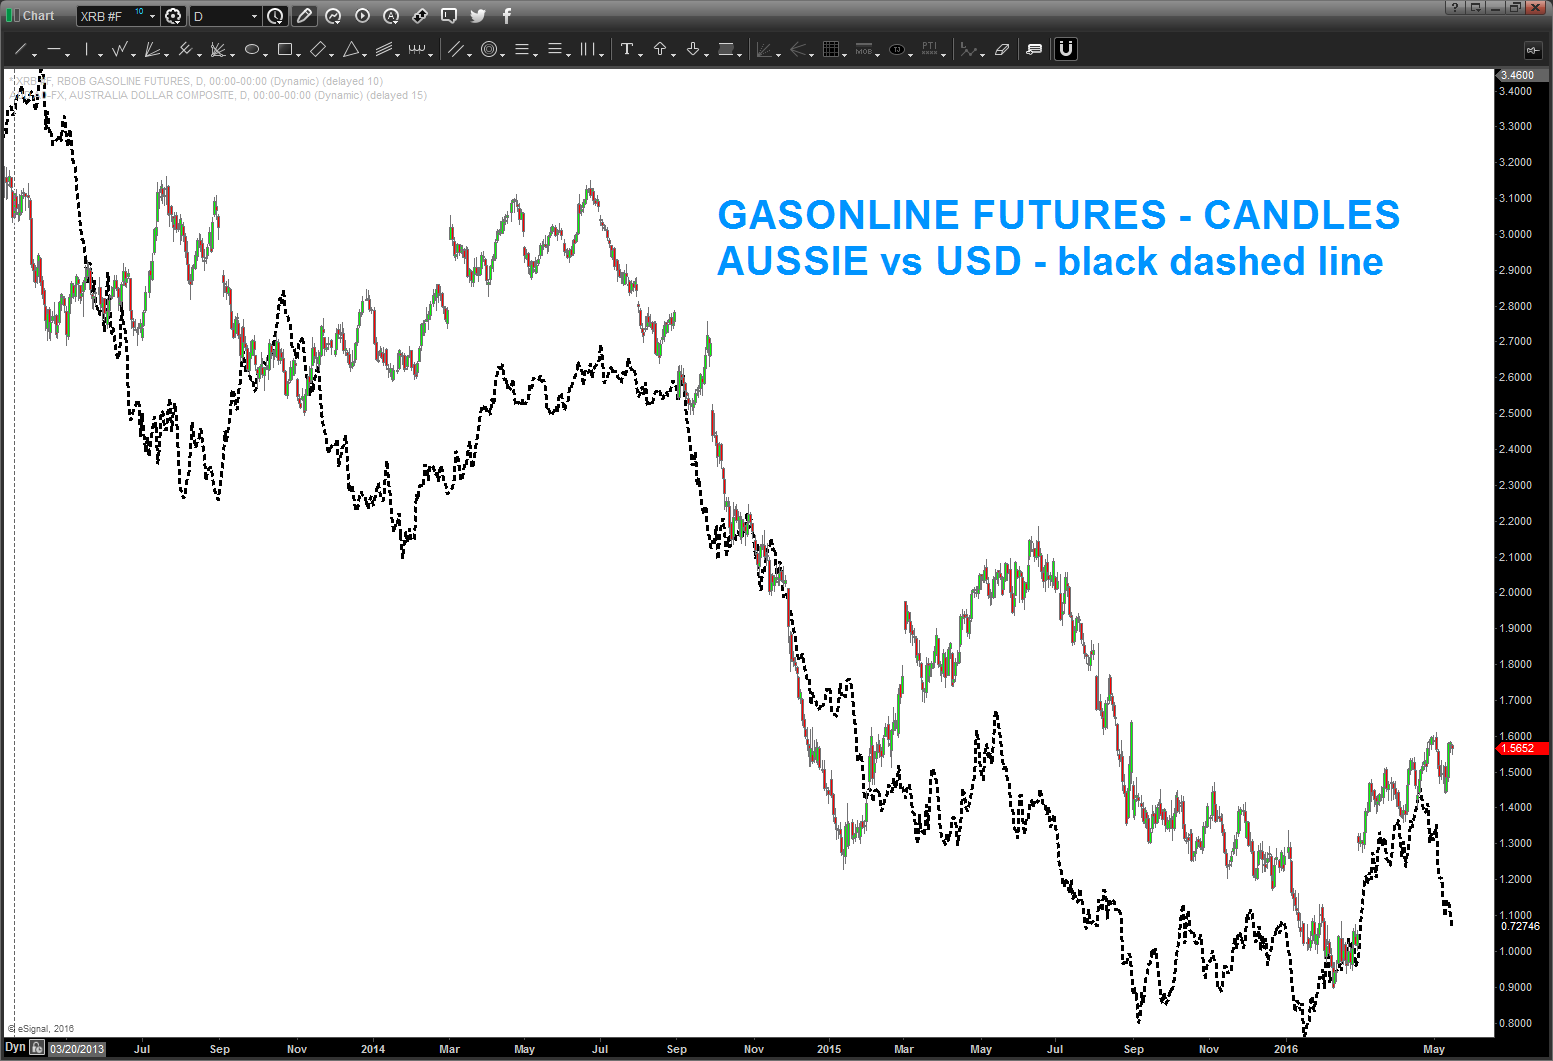
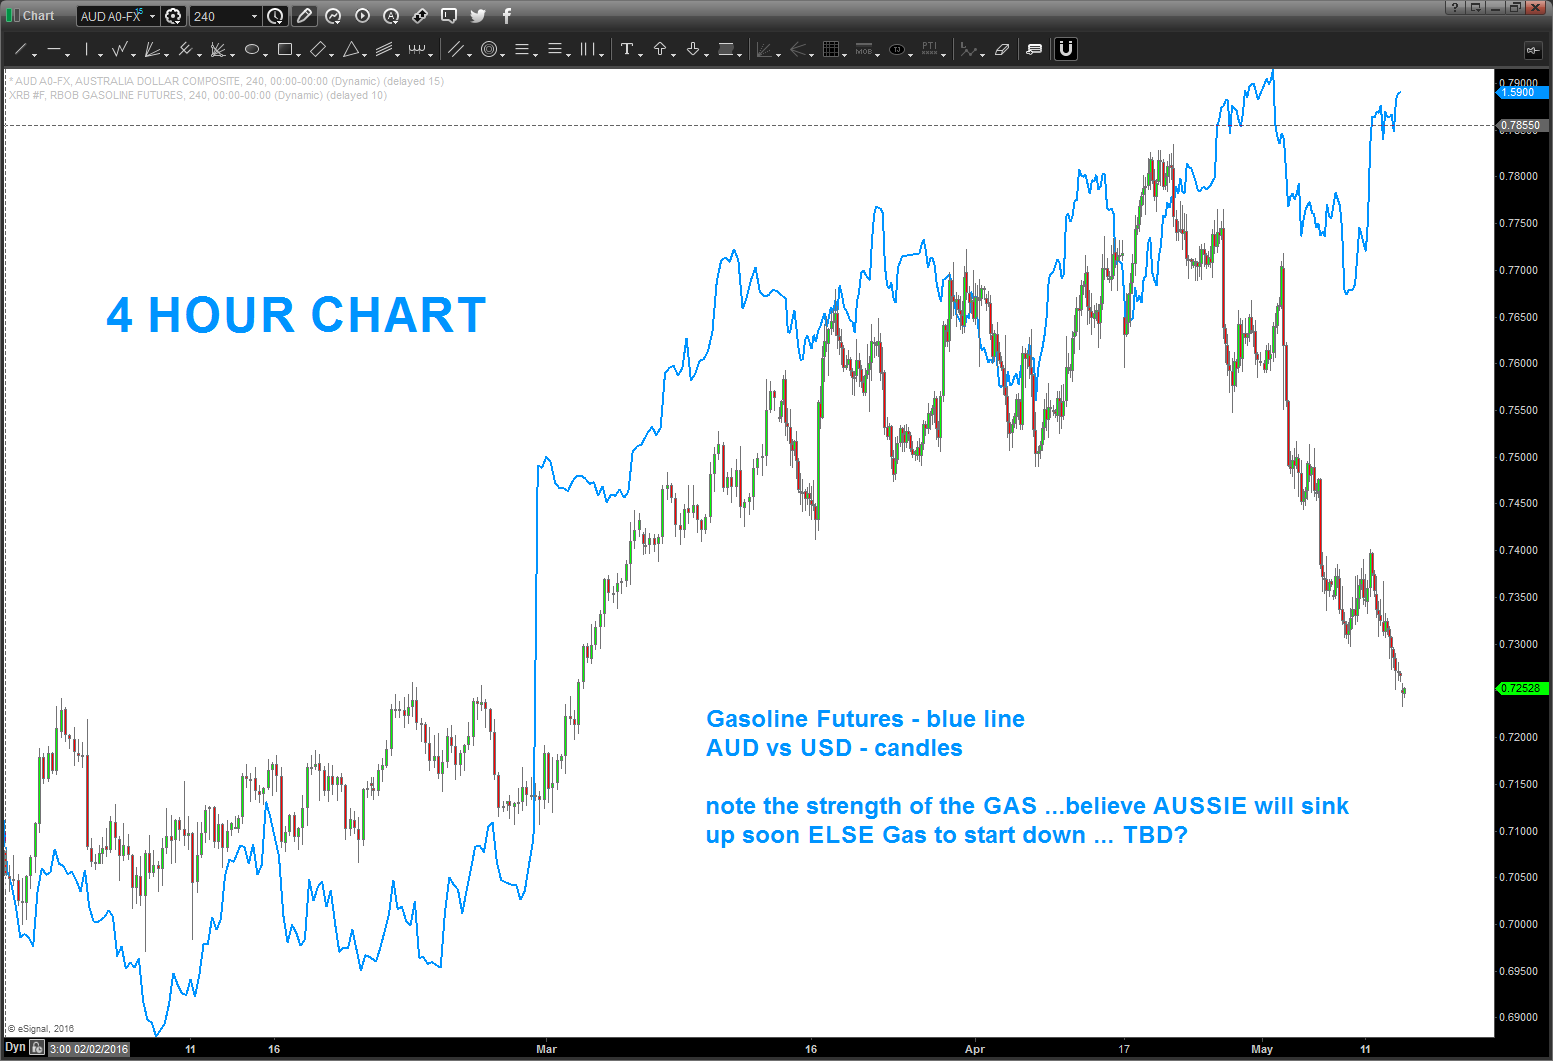
05/15/2016 – note the continued strength of the Gasonline Futures as the Aussie vs USD has been going down. W/ that in mind, believe we need to BUY Aussie in around levels shown.

at a certain point you have to ask yourself – are you going to listen to everyone or do the work yourself.
if you want to “feel the Bern” then let him “show you how to live …”
come on man, do the work:
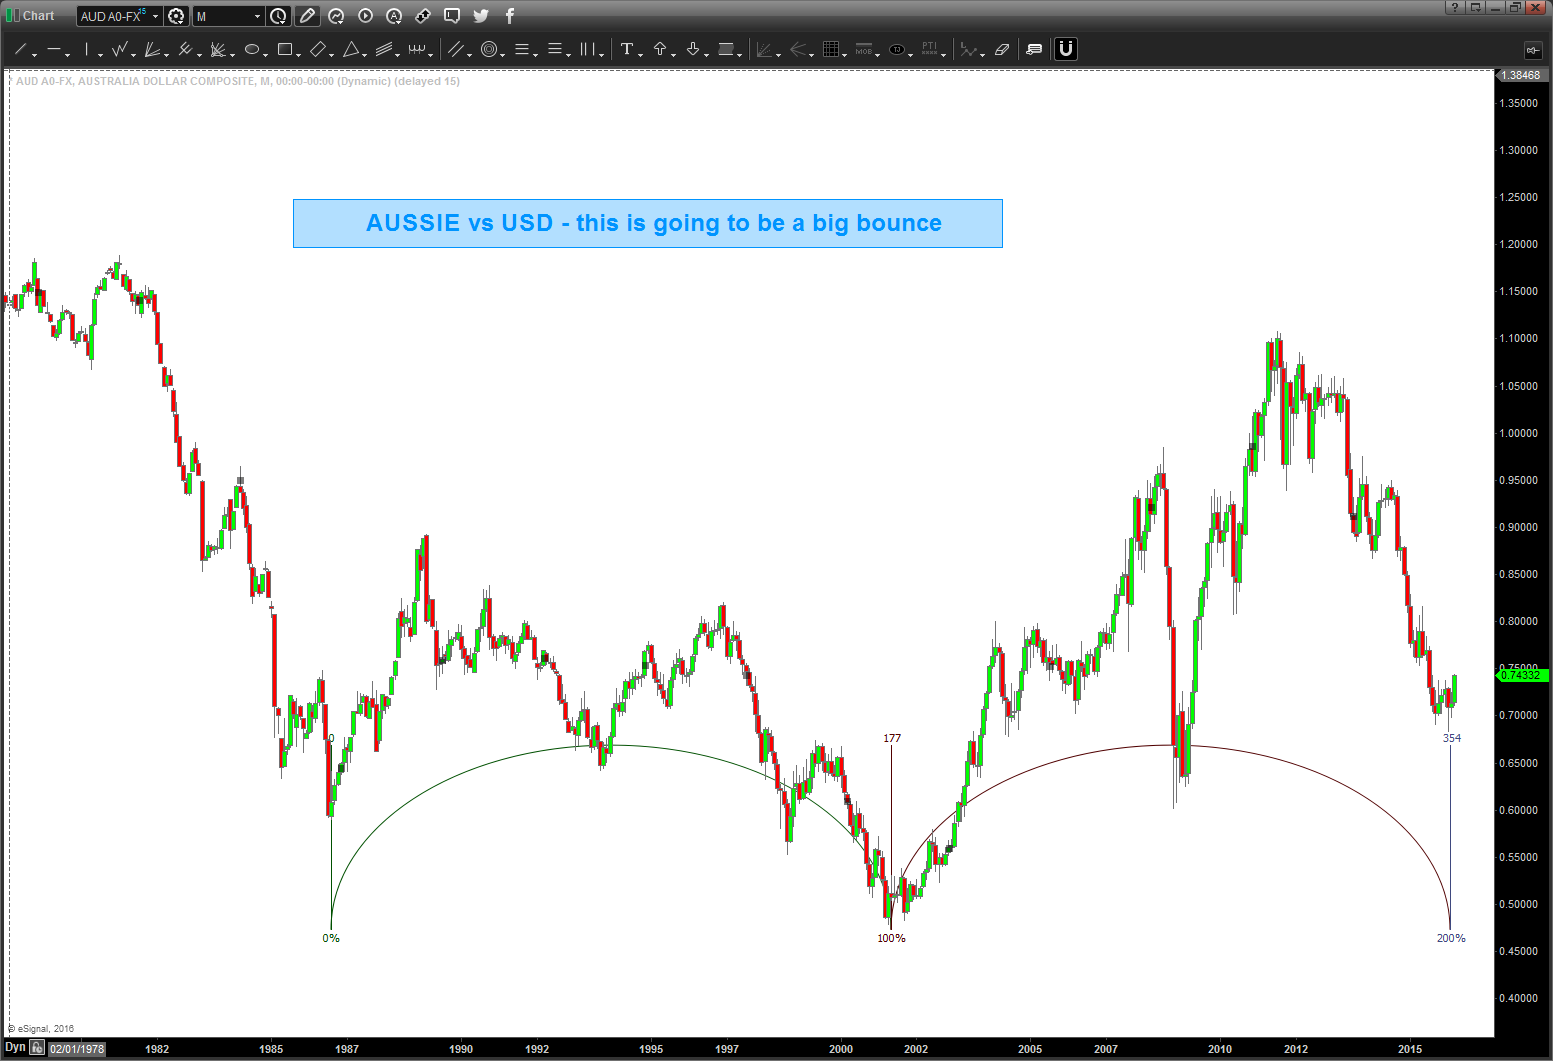
AUSSIE
- monster cycle hitting this month from 1986 on Aussie.
- take note of the “measured moves in price” coming tino the 1986 and 2001 low .. they are the same footprint
- very oversold w/ bullish divergence
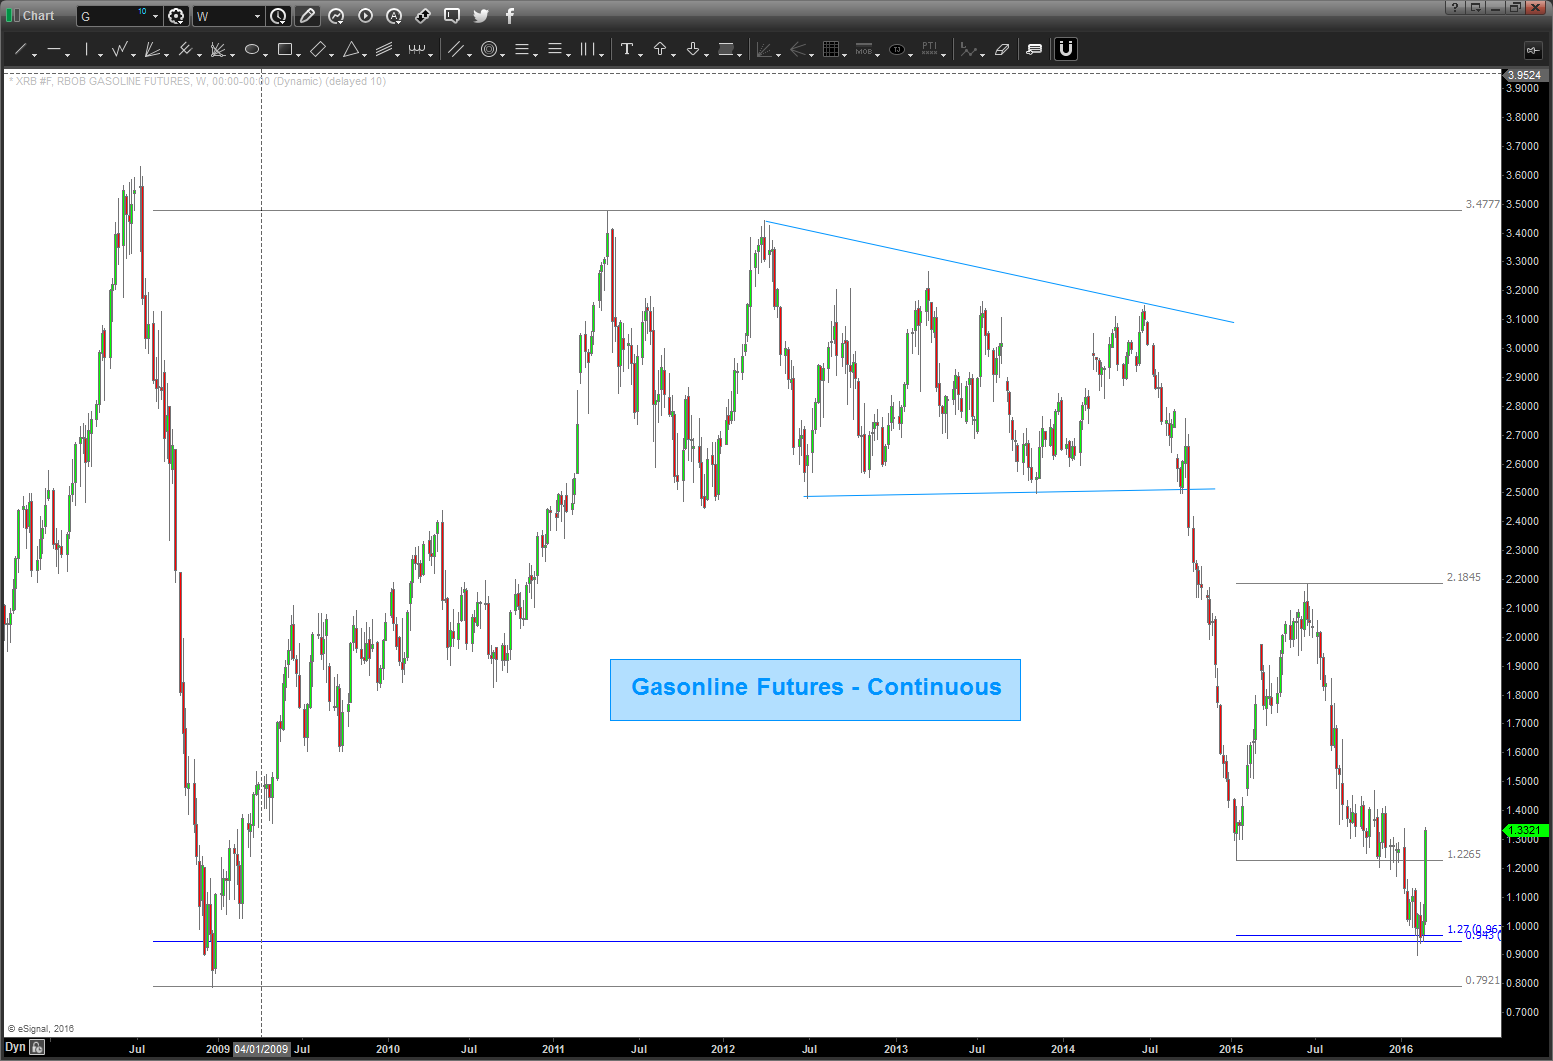
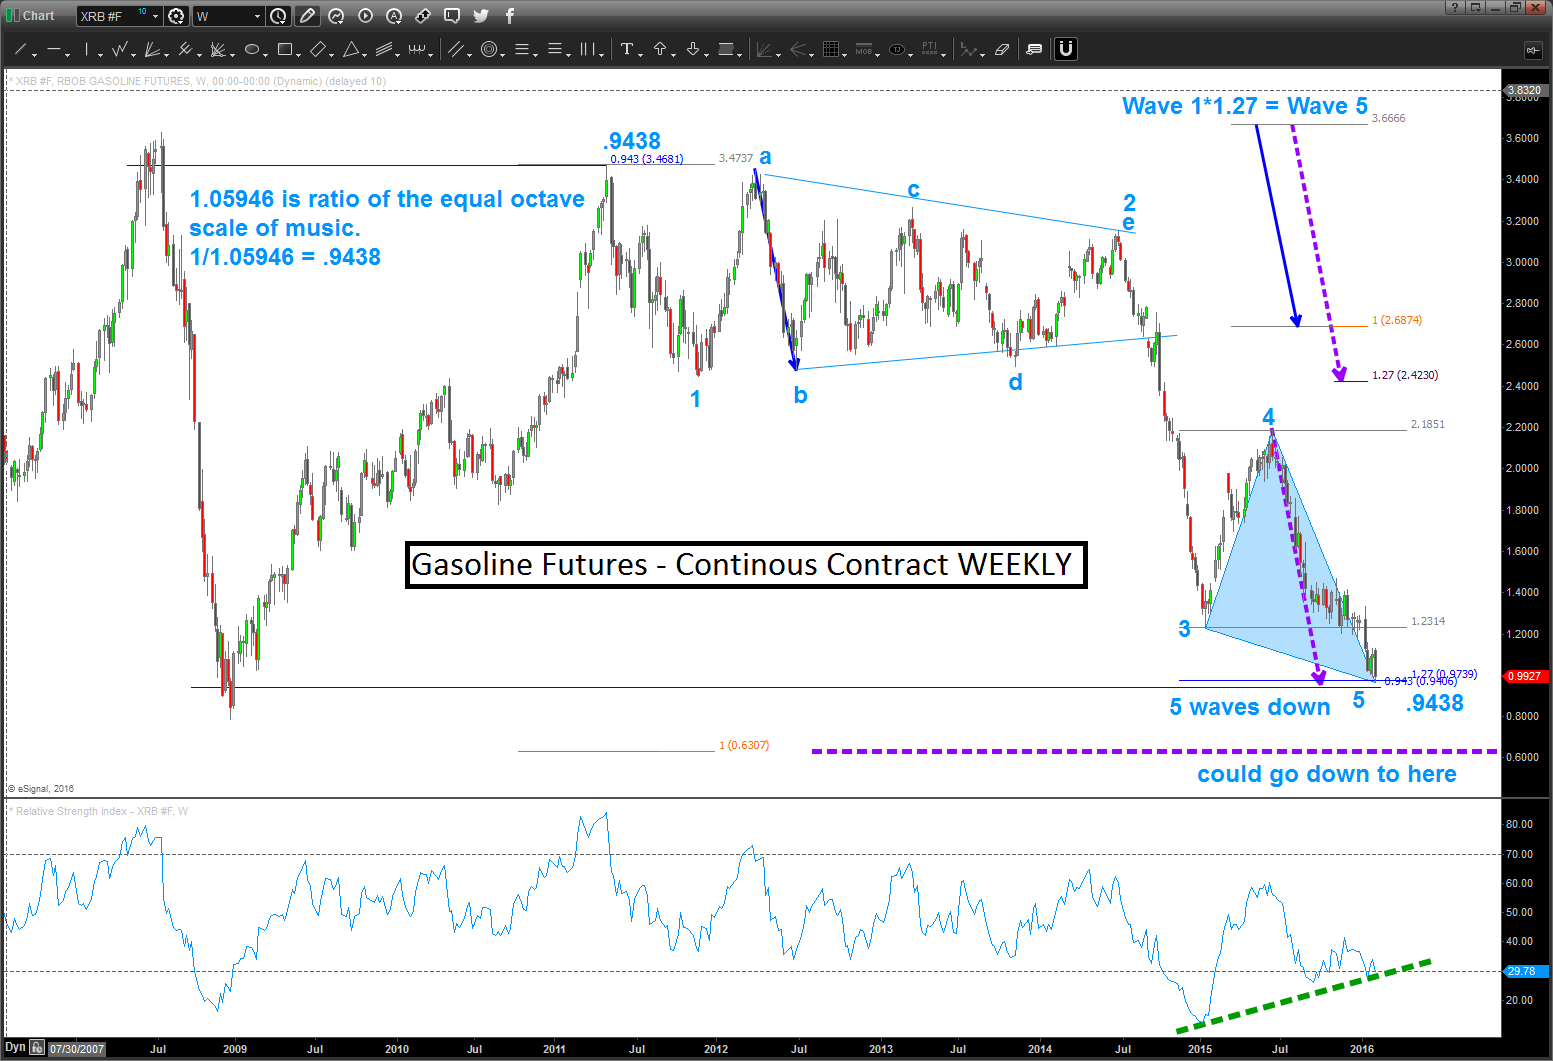
GASOLINE FUTURES
- note, 5 waves down on natural gas
- .9438 symmetry
- 1.27 extension
- 1.27 wave 1 = wave 5
- monster bullish divergence …
Pound … almost time? UPDATED
Posted on December 26, 2016 Leave a Comment
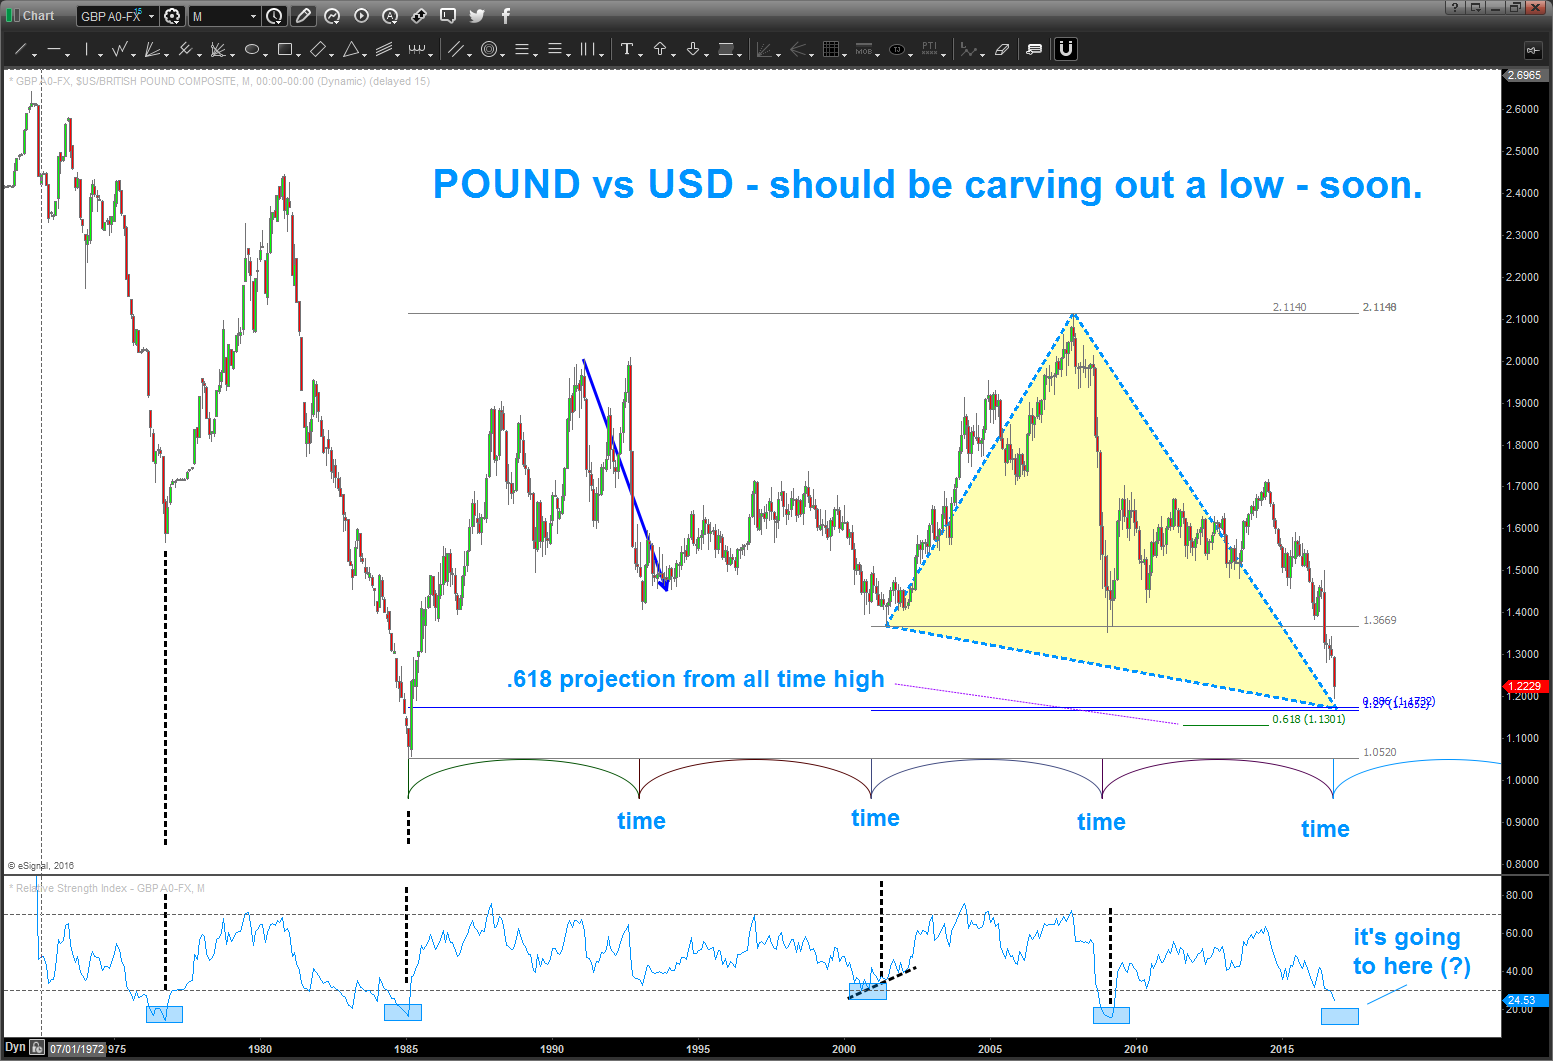
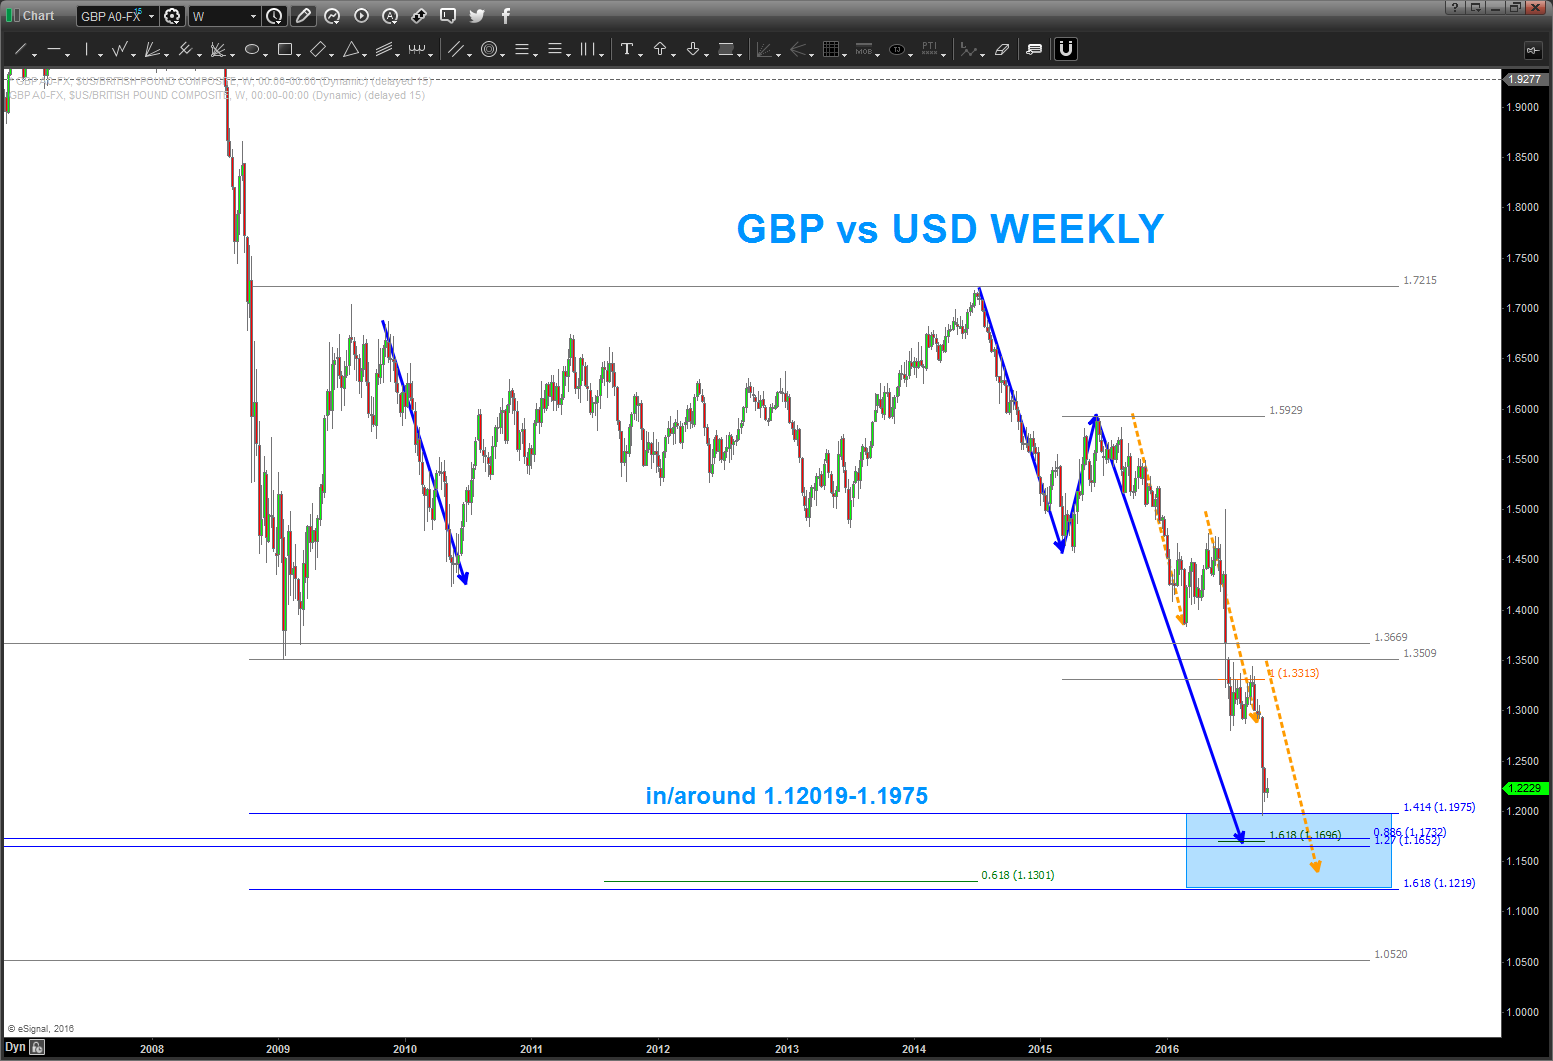
12/26/2016 – still looks like we have a little more time to go into the lows. perhaps a little lower at the targets shown (?)
DBA – be patient, now let’s follow up to the follow up
Posted on December 25, 2016 Leave a Comment
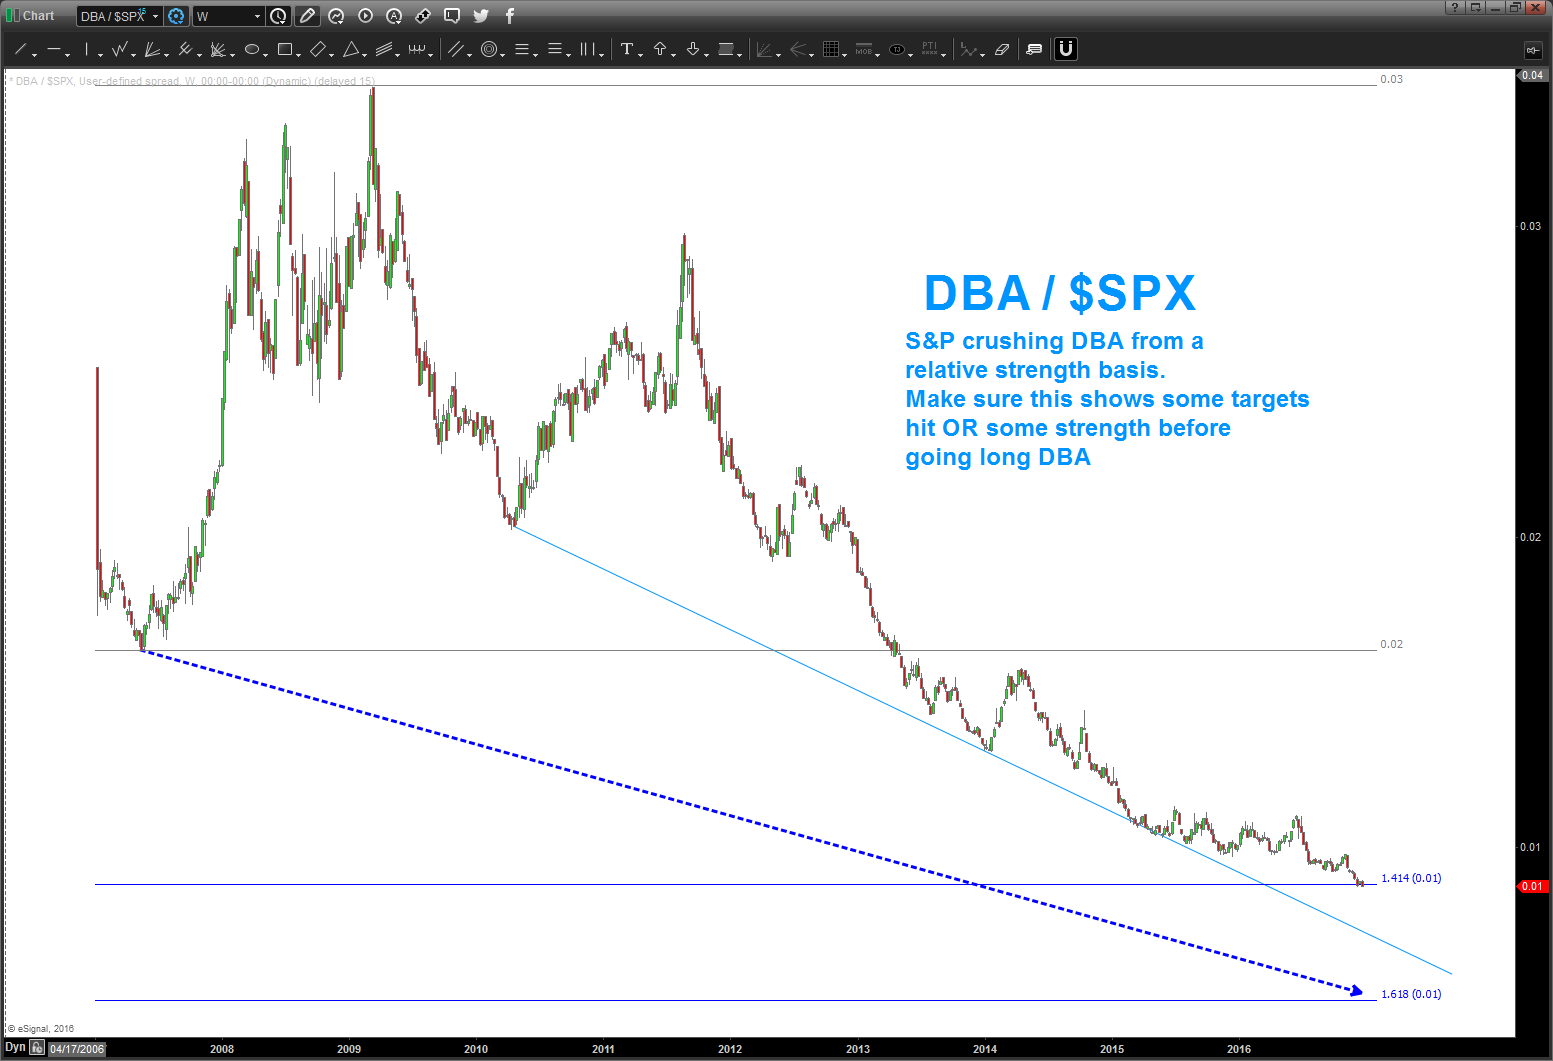
12/25/2016 – if you look closely at the 19/60 level the symmetry shows the potential for a double bottom. However, w/ a daily close below 19.60 it looks like DBA just isn’t ready. All the way down in/around 13 is the next BIG PATTERN. However, you can see the 17-18 level might offer a long shot. for now, consider this pattern from a while ago busted and DBA to continue to walk lower. we’ll give it another shot if /when the levels shown are hit.

Amazing that it’s been a YEAR exactly since we took a look at the agriculture sector. The post below was from 06/26/2014. Based on the price action of DBA the past couple days and the action of the beans, wheat and corn believe it’s time to give DBA a shot. Would stop out w/ a close below 21.50.
Happy hunting … man this took a long time to set up.
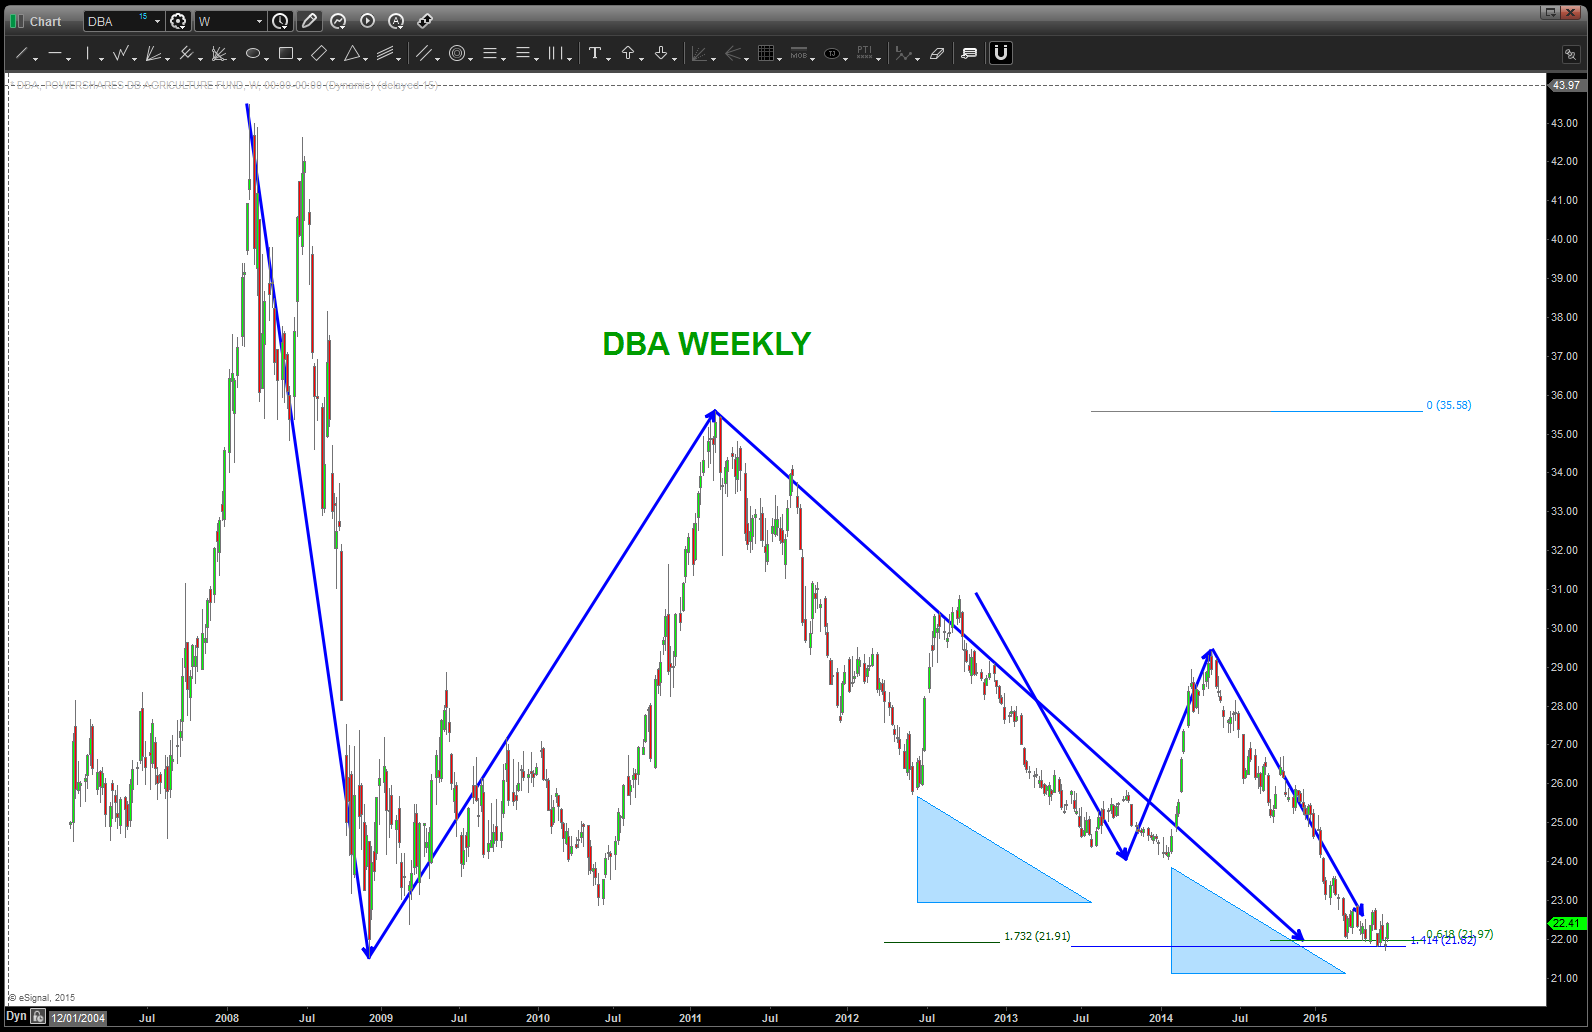
DBA Weekly
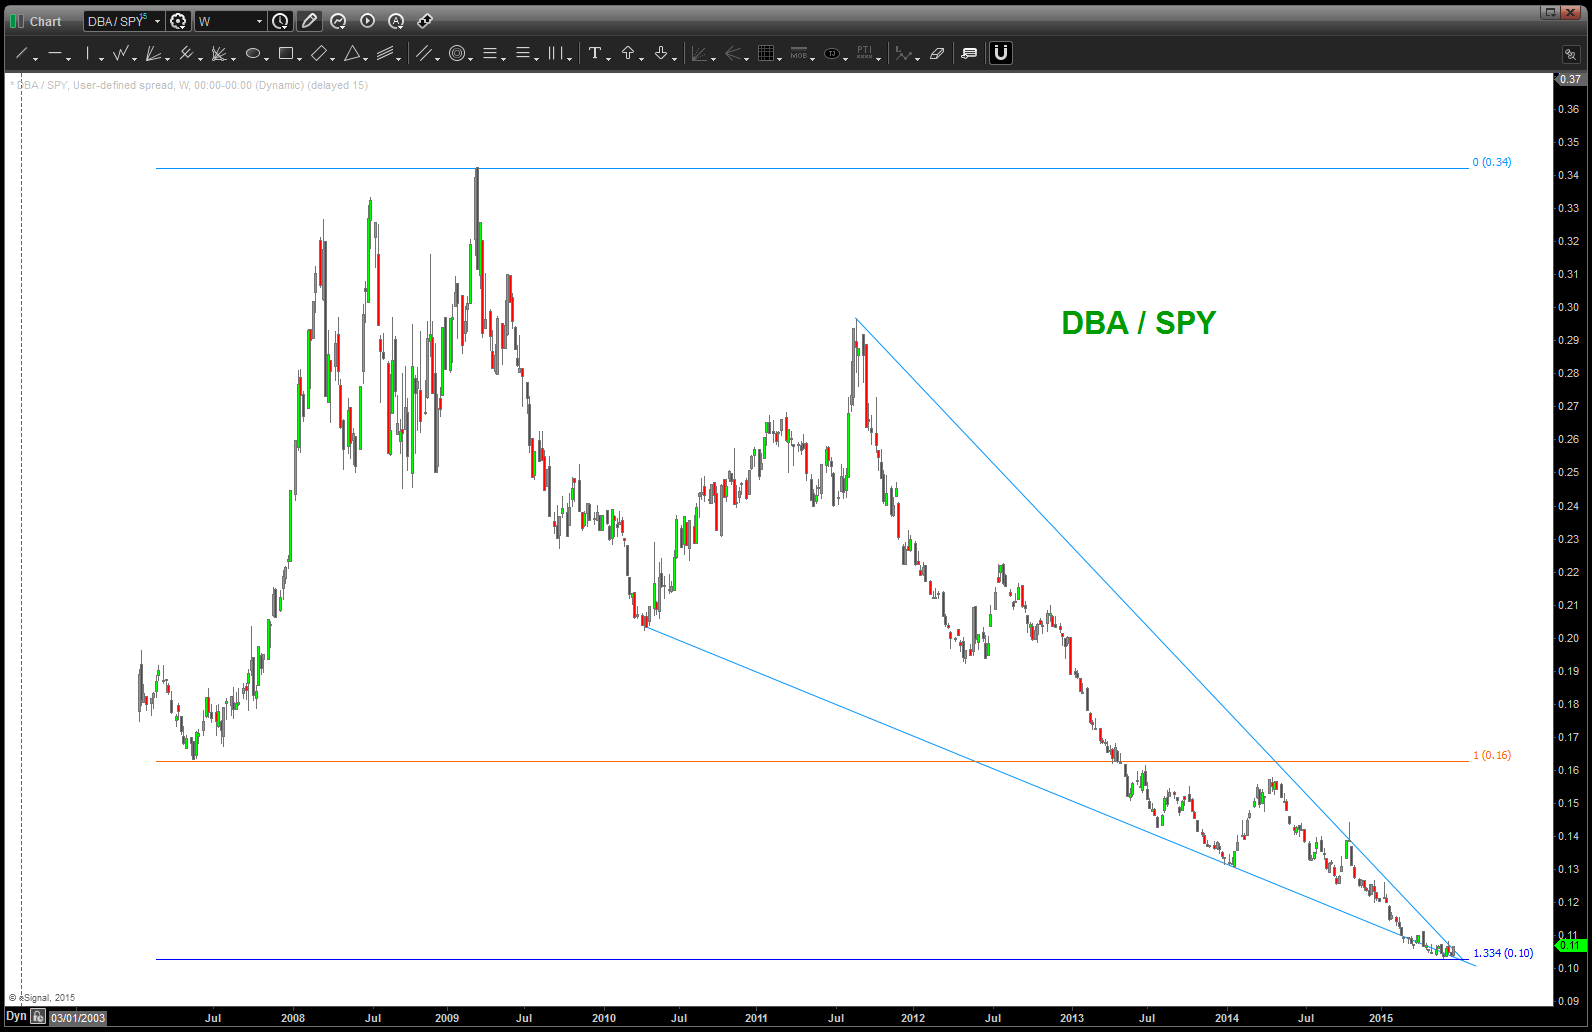
DBA / SPY relative strength
CLIFF NOTES: Corn and Wheat have hit their targets. Would still see risk below the .841 retrace on Wheat but believe these patterns are complete. Need to wait a little while longer on Soybeans …
Charts ..

Soybeans Continuous
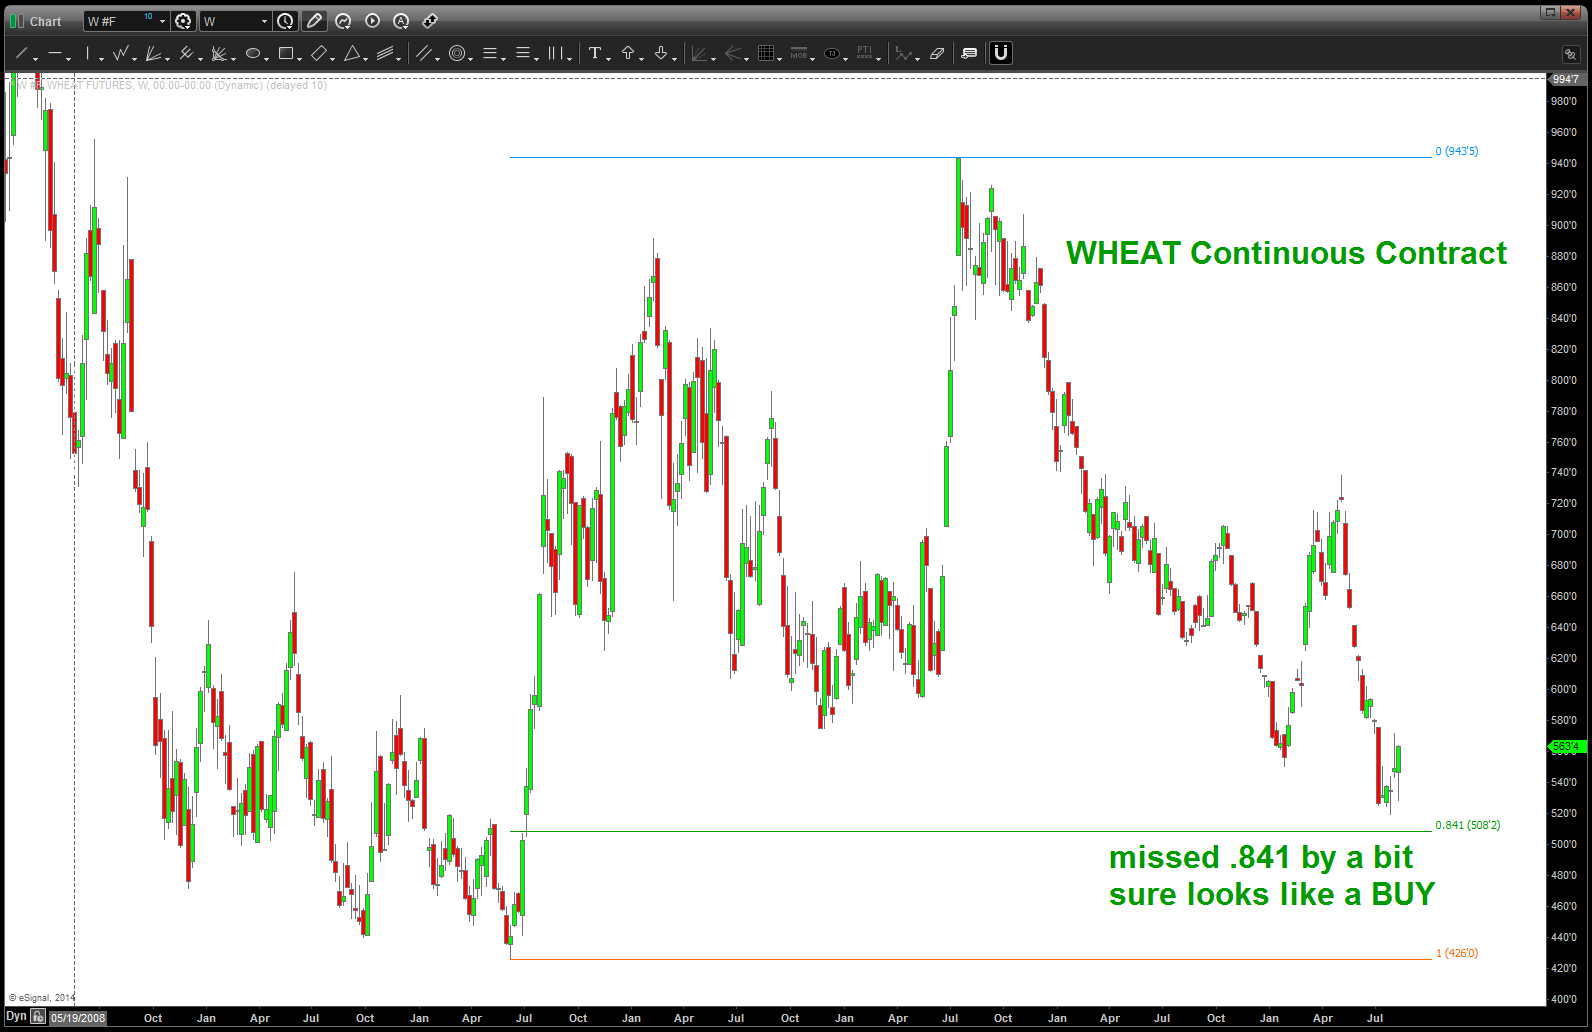
Wheat Continuous
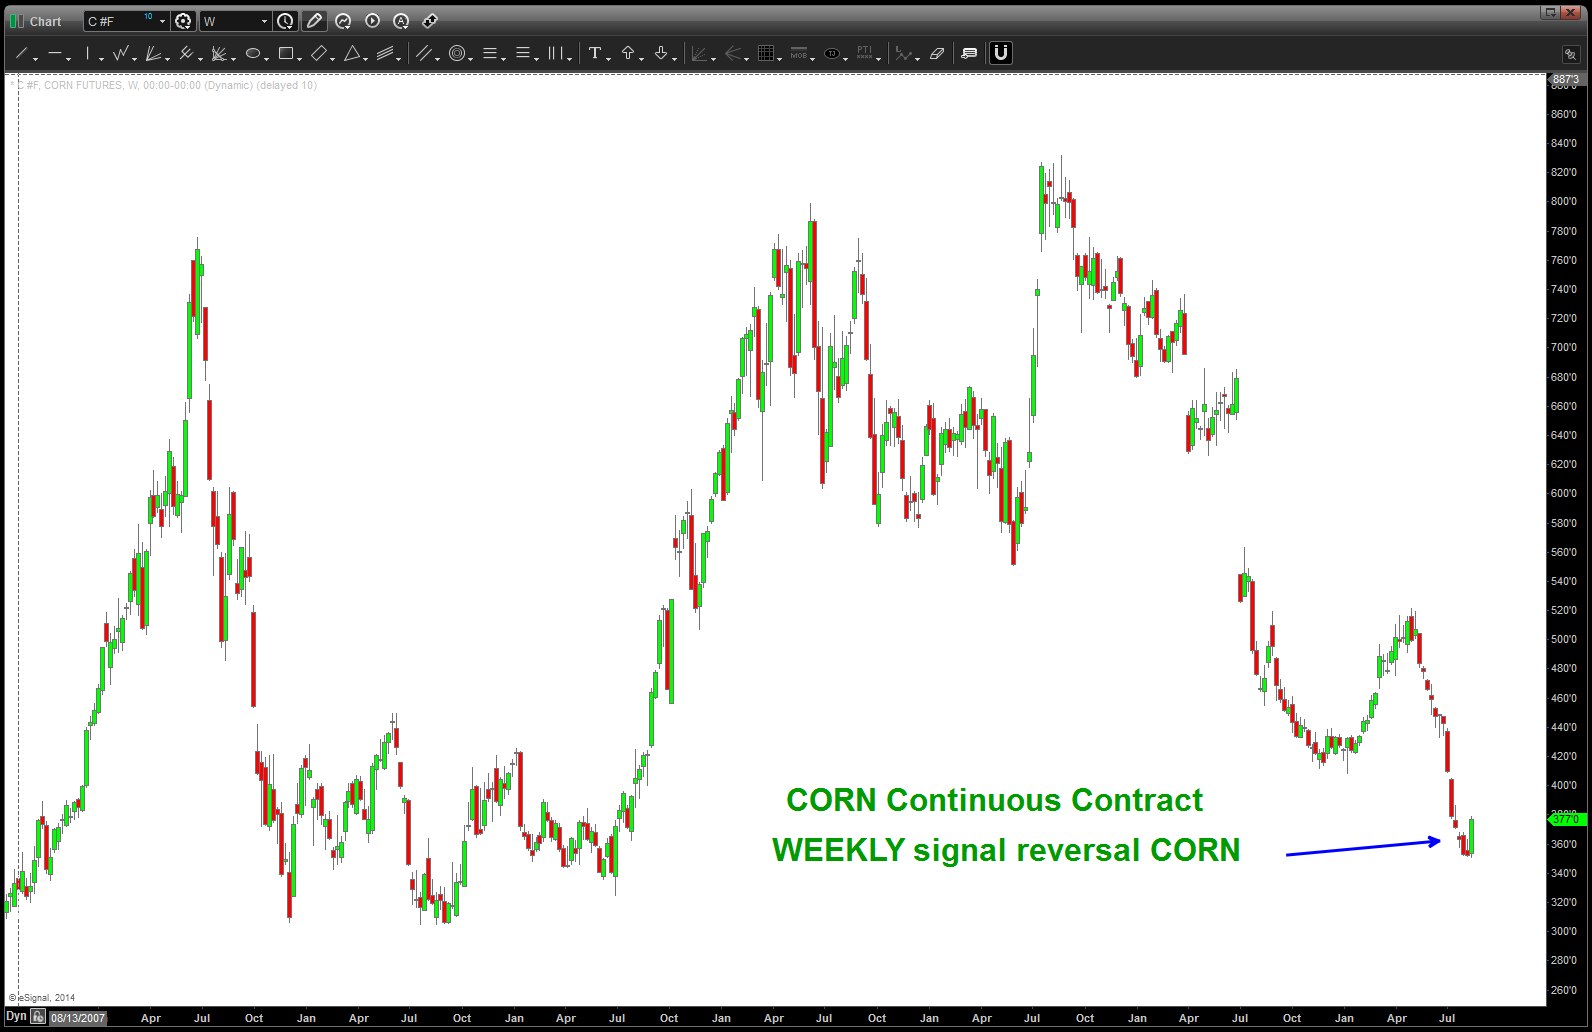
Corn Continuous
the commodity markets are ROCKING AND ROLLING w/ regards to Corn, Soybeans and Wheat ….
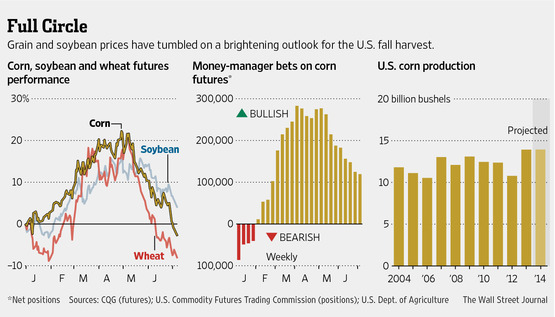
so, I don’t know ANYTHING about the inner workings of the grain market but I do know MEASURED MOVES and look at some of the beauties on Corn, Wheat, Soybeans. If we look a the “money manager” bets in the middle of the chart above it appears that NO ONE is bearish? Also, is the bushels projection that great? anyway, w/ extreme bearishness and this quote:
“There’s just no real stress, hot [weather] coming along, so we’re going to blast prices down,” said Jack Scoville,
Vice president at brokerage Price Futures Group in Chicago. “Most areas are in really good shape.”
sure looks like a BUY opportunity. But, let’s don’t get cray cray here … we have a target area of support but look at what happened the last time we had a measured move like this … the darn thing bounced around for 3 months. so, let’s let the market prove to us if this is support. then, just wait for that magical weekly or daily pullback (it WILL happen) and then pounce. Folks, this could take months for the correct entry …we’ll revisit these in a couple weeks.
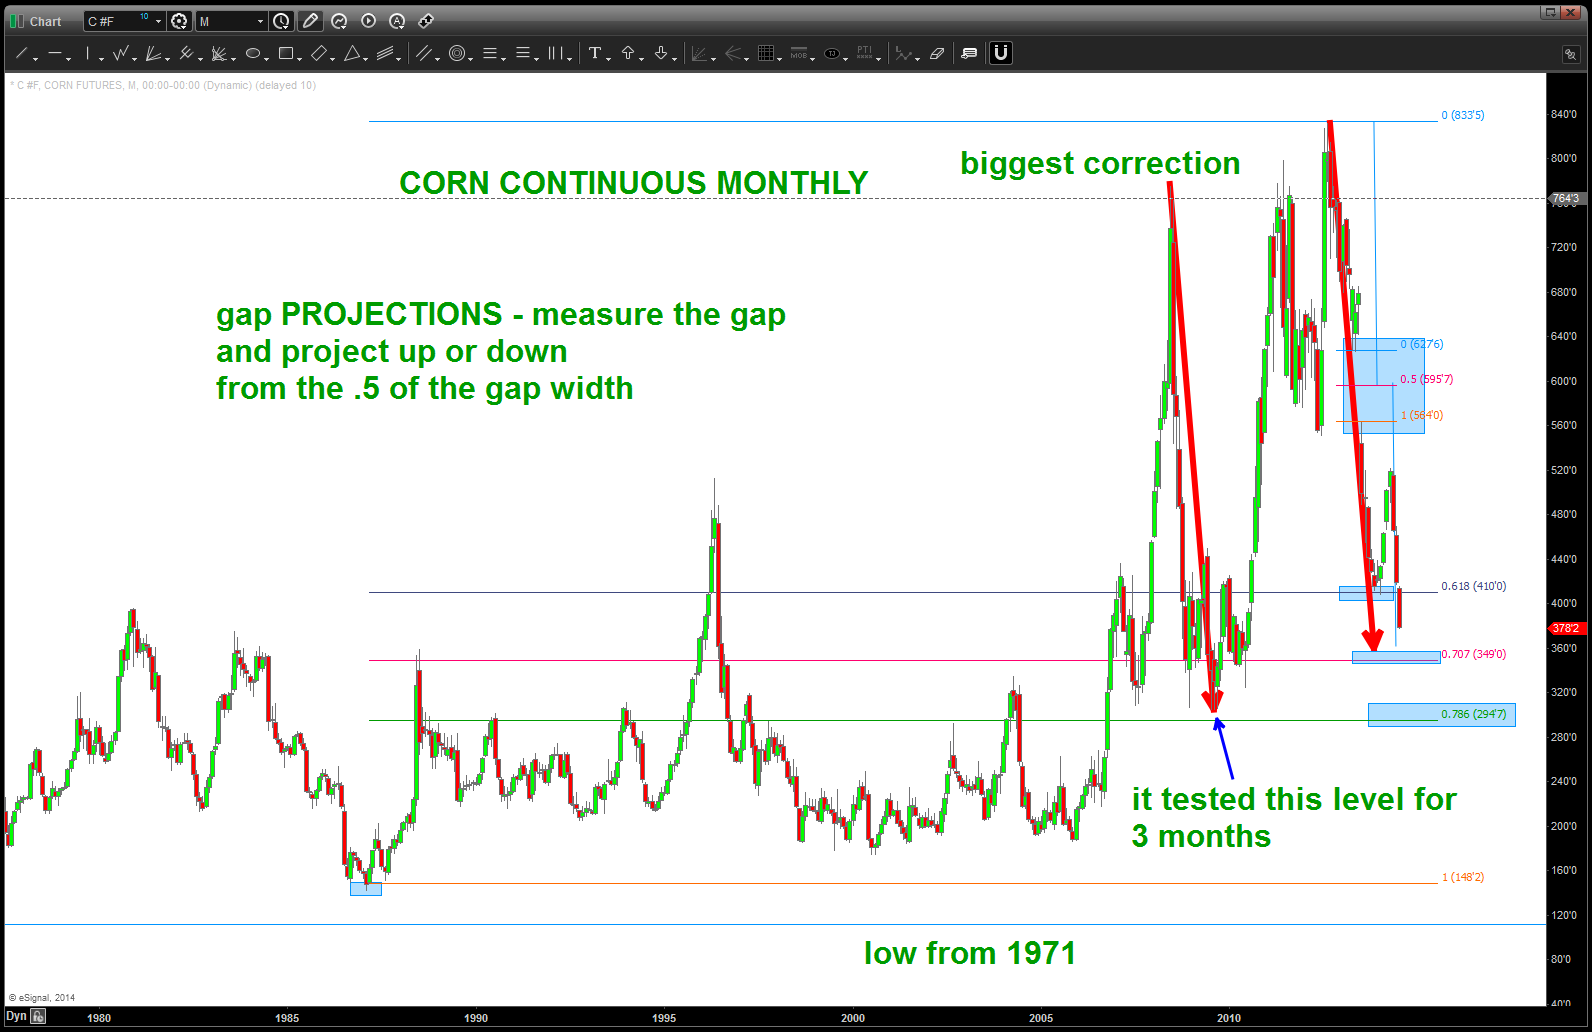
CORN continuous contract MONTHLY
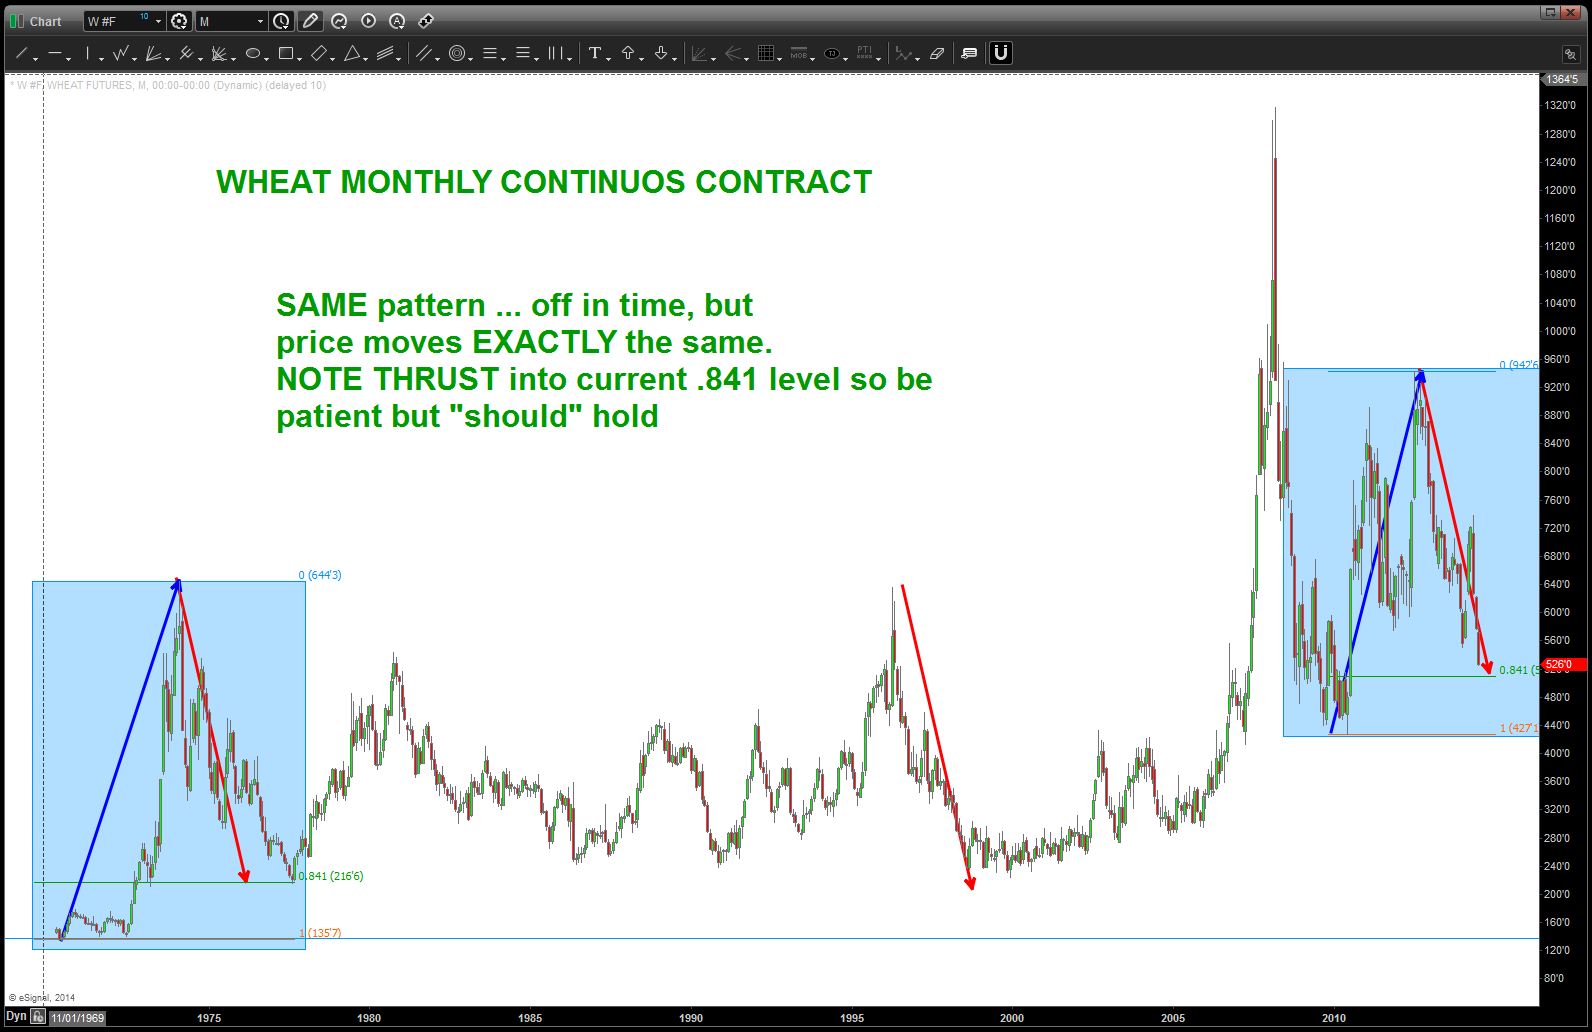
WHEAT continuous contract MONTHLY
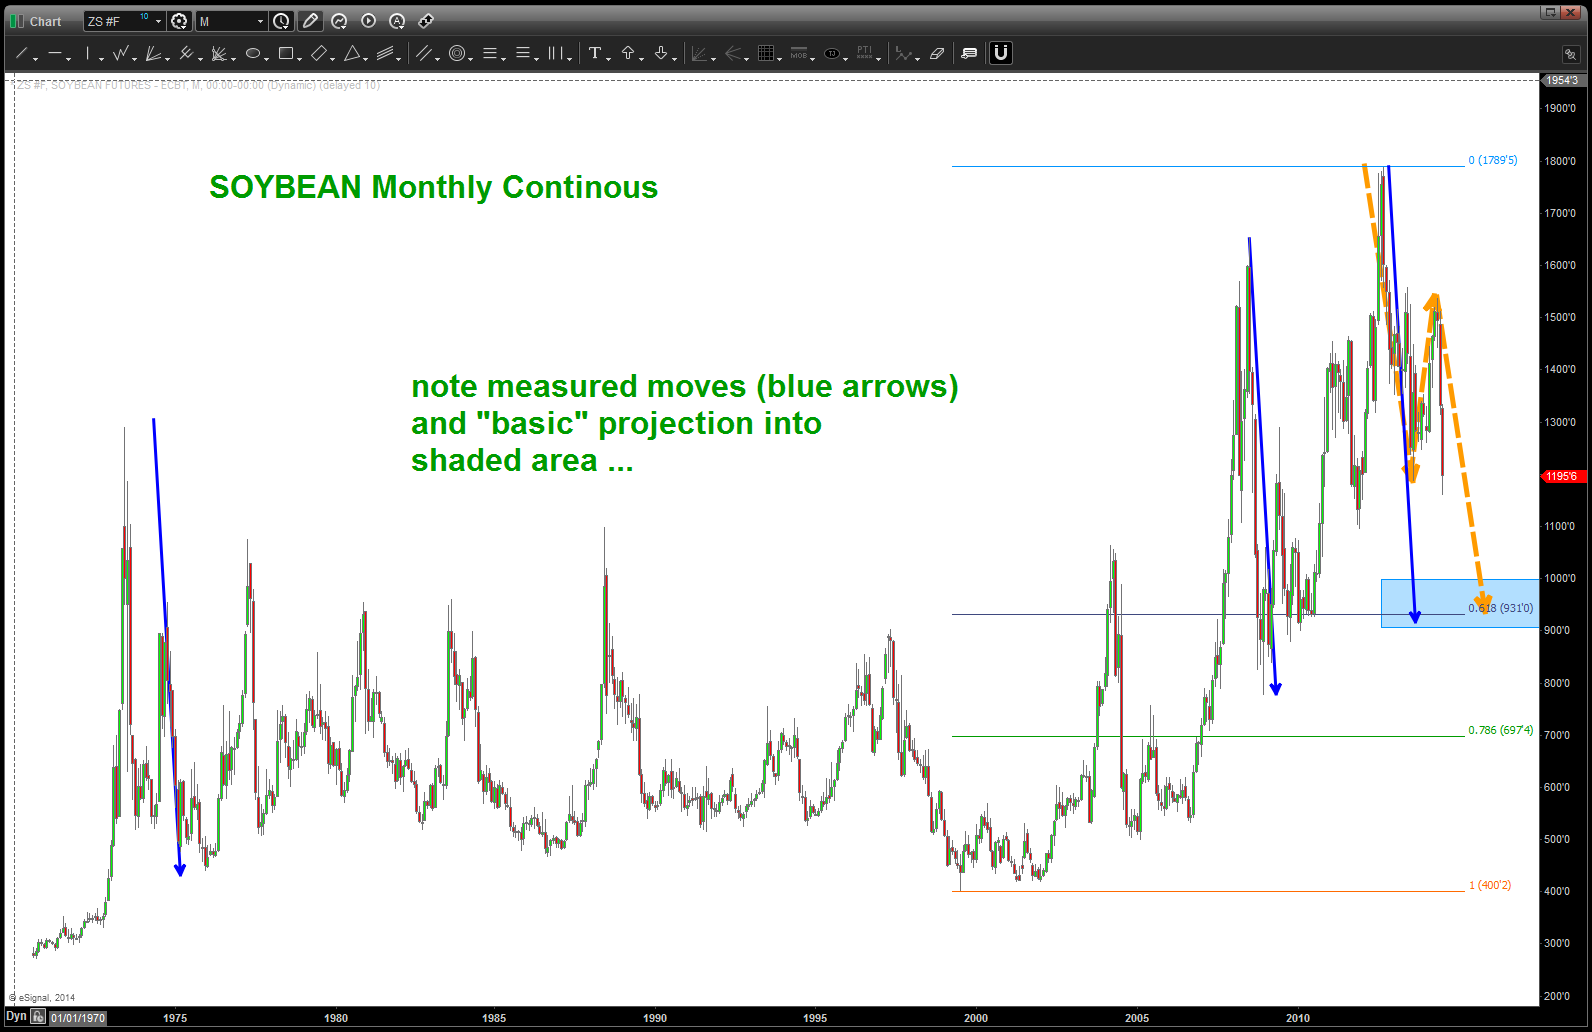
SOYBEAN continuous contract MONTHLY
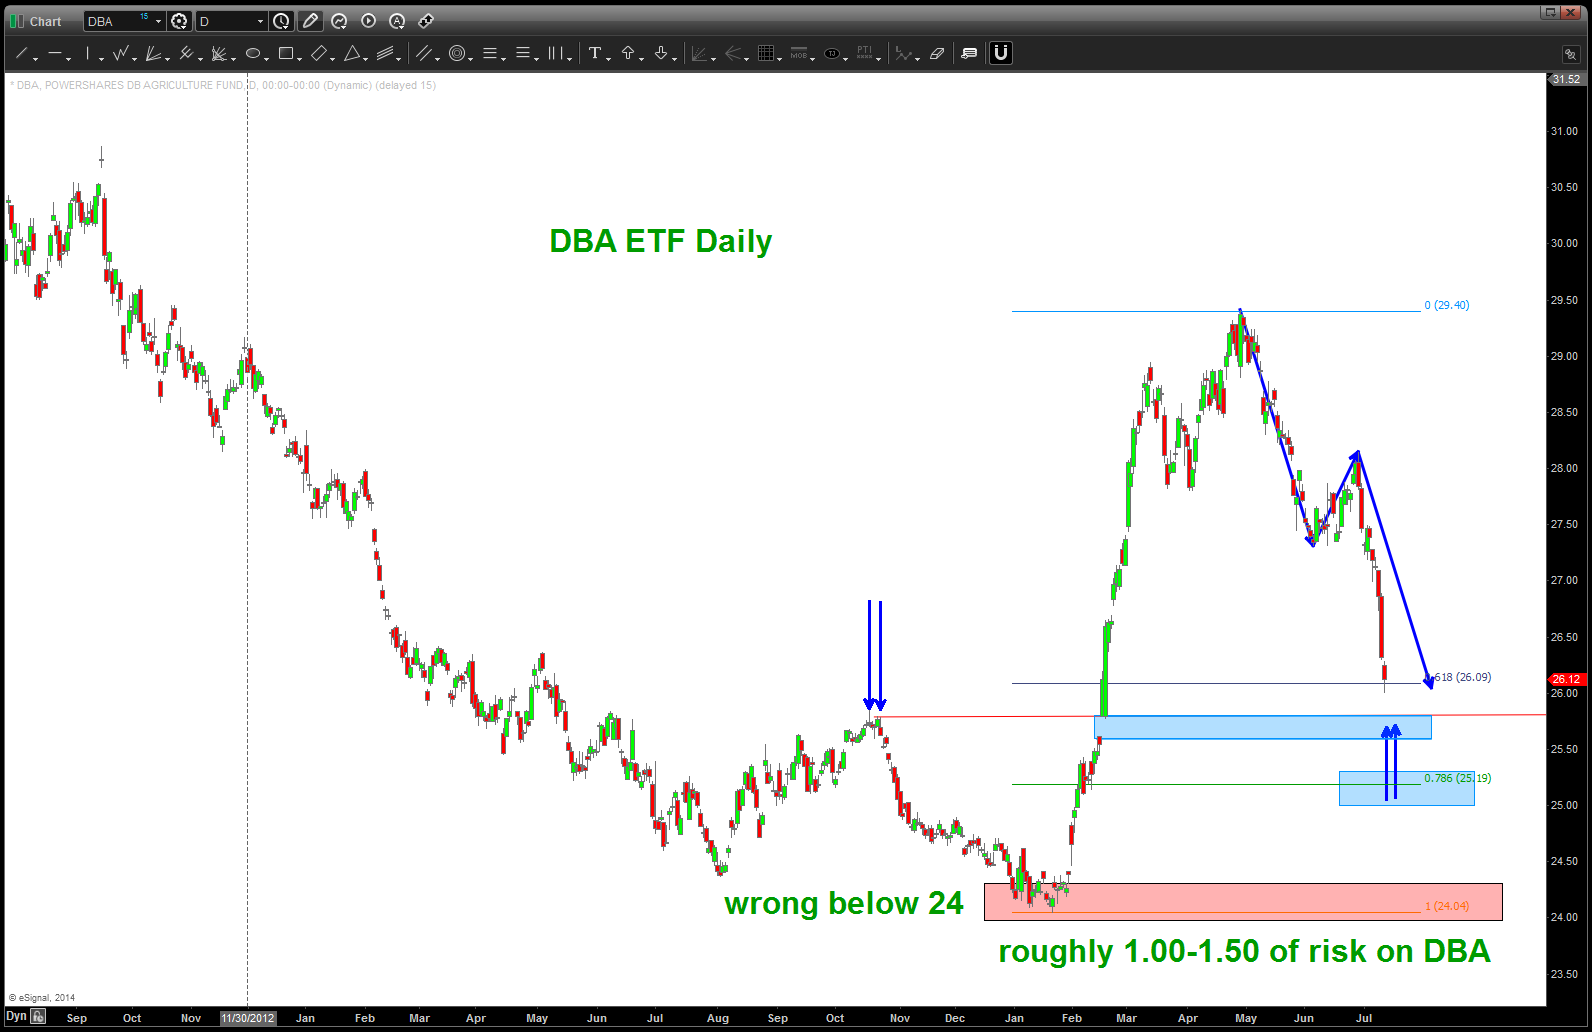
DBA
here is a quick look at the relative strength ratio between DBA/SPY. obviously, quite the thumping here BUT if you look you can see 5 waves down. if we break the swing low (sure looks like it’s going to happen) then we’ll go to that lower target I believe.
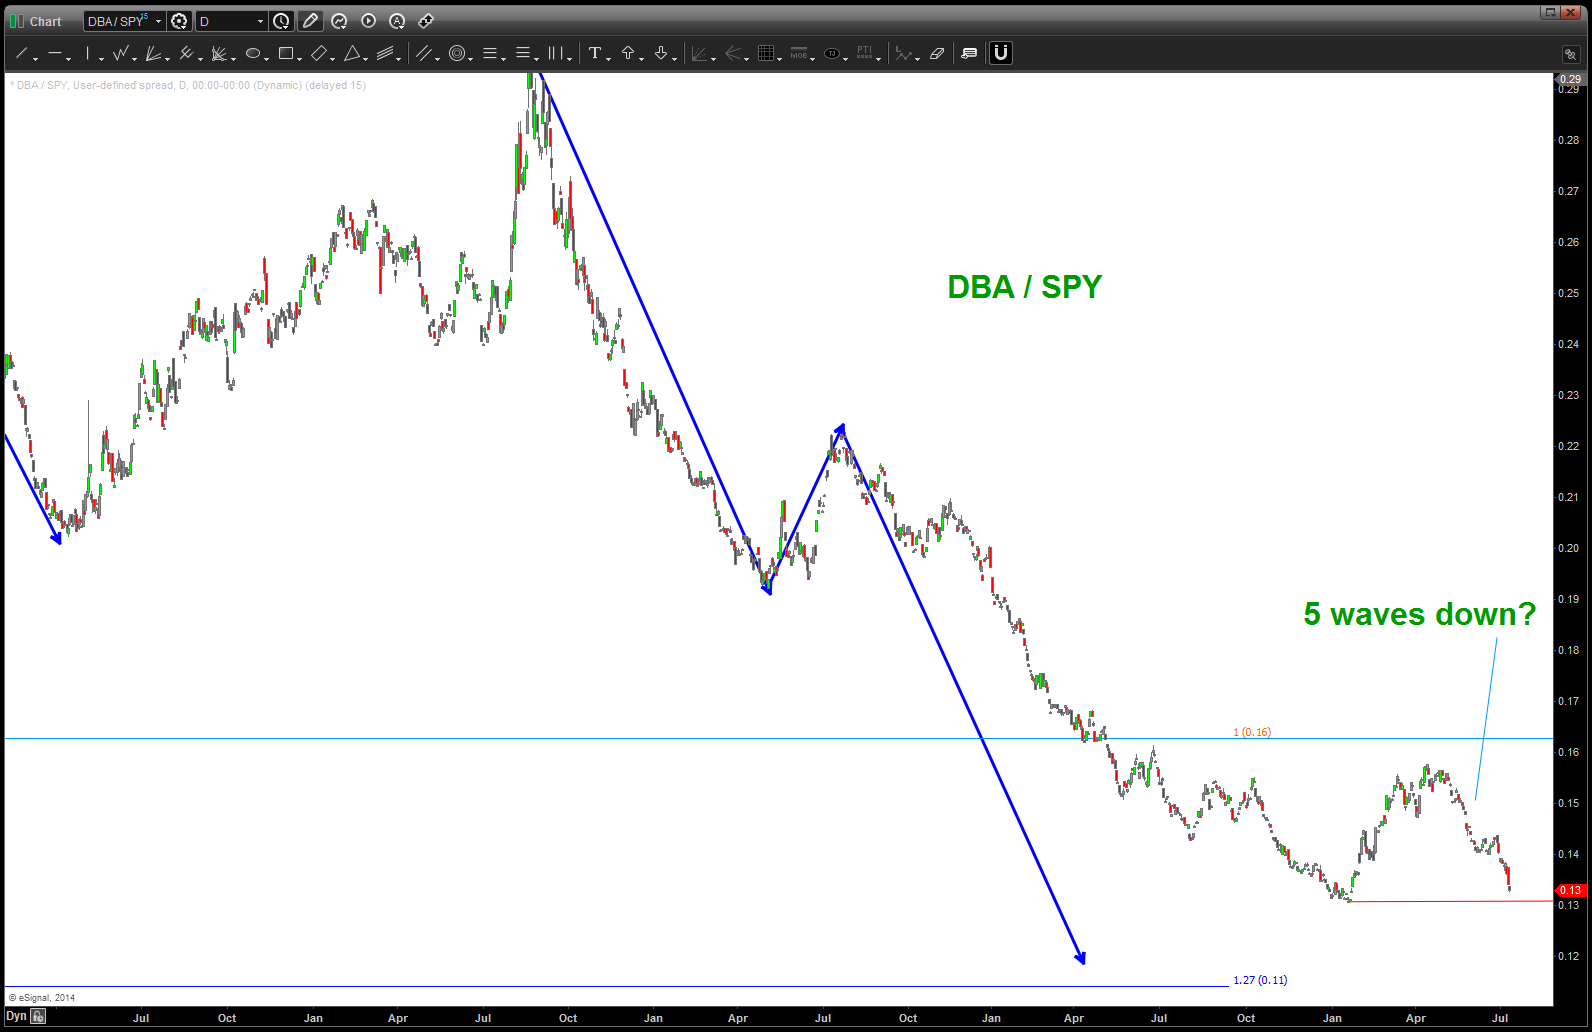
DBA/ SPY relative strength ratio
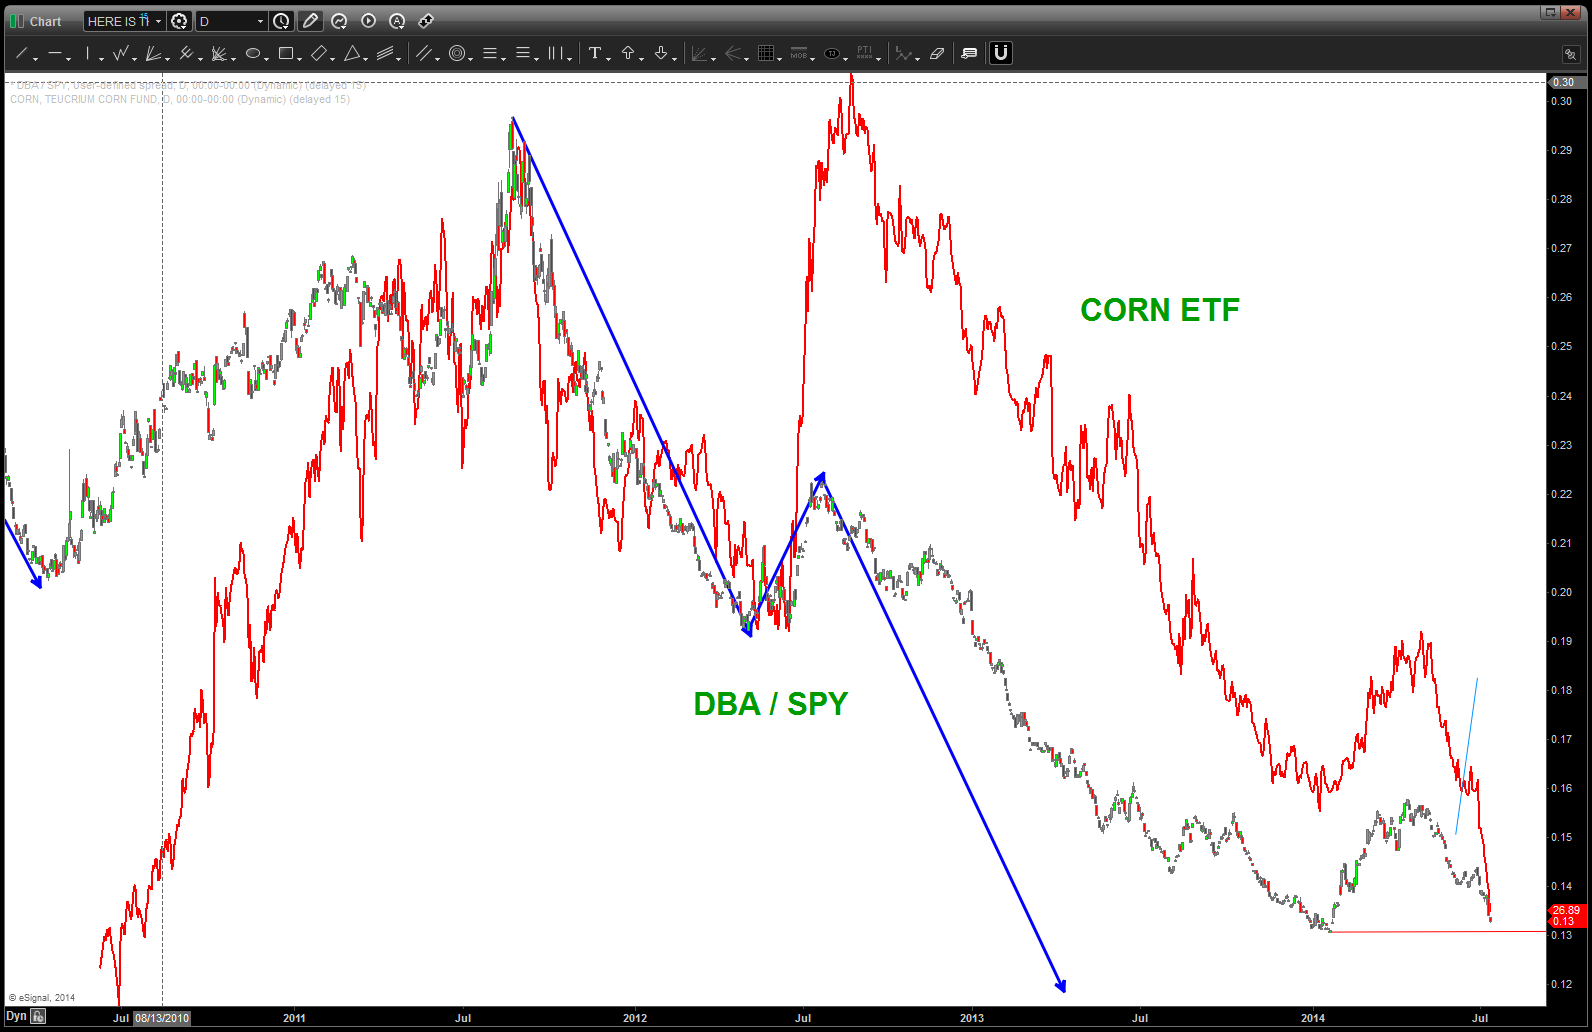
so, why is this important …? well, let’s take the CORN ETF and overlay it on the ratio. As you can see … when this ratio bounces so does corn (make sense) so we will look for some rotation into the agriculture market if/when the equities lose there luster.
why 11254 is SO important to the $NYA (New York Stock Exchange Index). (the ONLY reason)
Posted on December 24, 2016 2 Comments
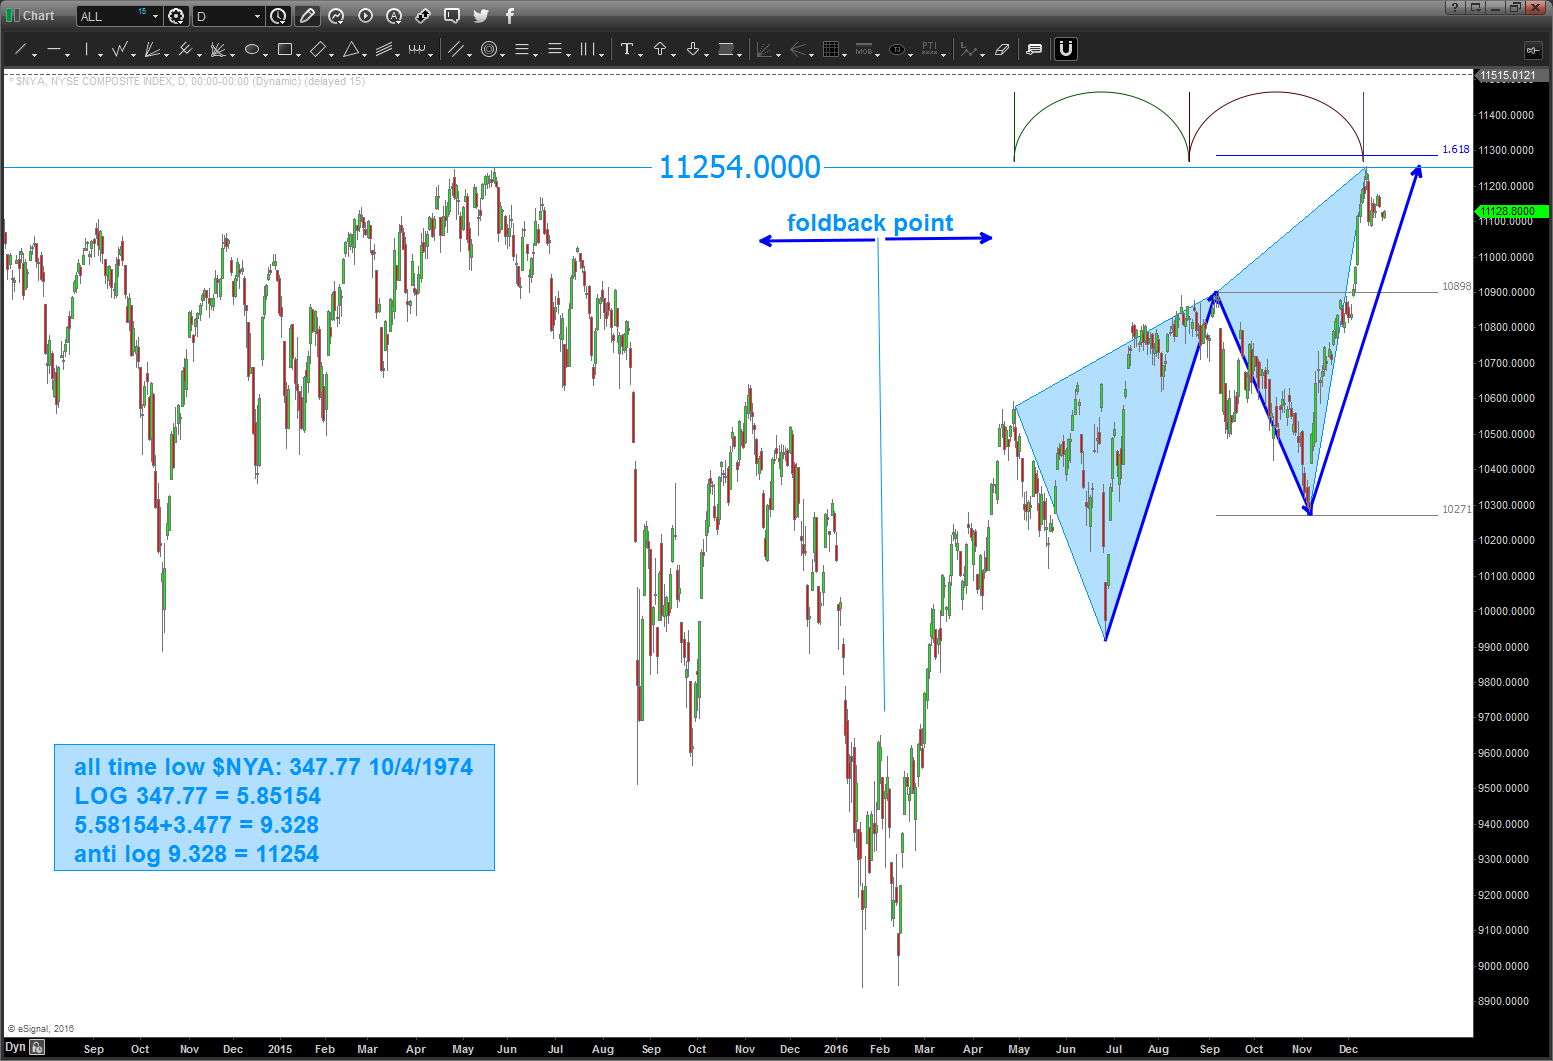
12/24/2016 – as you can see below, using some ‘basic’ math and having a ‘basic’ understanding of the importance of NUMBERS to this entire ‘vibrational thing’ leads to some amazingly accurate inflection points. 11,254 has been respected as resistance below and the MATH behind it is explained in the chart uploaded below.
also, you can see that the resistance shown around July ‘held’ for a couple of months and then was defeated. this leads to a very nice 3 drives to a top right up to that 11,254 level. if you choose to do the math, you’ll see that it was 15,411 days since the all time low from 1974. do some further math and you’ll find some very interesting correlations … I’ll leave it at that.
what does all this mean? simply, it’s a PIVOT area and a BIG ONE. 347.77 FREQUENCY is causing a lot of stuff to happen … above here, well were off to the races. below here, perhaps a nice pullback.
honestly, have no idea what’s going to happen BUT do know that 11,254 is a big FREQUENCY target and we’ll just leave it at that …
stay tuned …
Bart
07/23/2016 – posting this again because the MATH and the NUMBERS and the VIBRATIONS are so important. I don’t want to go into a “war and peace” diatribe regarding “WHY” this high in the NYSE was/is so important. But, I do want you take notice ….
- note the all time low …10/4/1974. That NUMBER which is actually a VIBRATION … sorry, going to go down a rabbit hole for a moment
- the ancients used words to equal numbers which equaled music. essentially, when we SPEAK our dialect we are actually emitting a sound which plays a tune that is harmonious or not to you. so, in order for the words we SEE as we read and THINK they assigned numerical equivalents .. 26+26 = 52. 52 weeks in a year .. yes/no?
- so, that LOW at 347.77 was the SEED for the rest of the move into the high on May 21, 2015.
- below you will find how – using LOGS (which are cool) we are able to calculate the EXACT HIGH on the NYSE …yes, go read it, it’s the EXACT high.
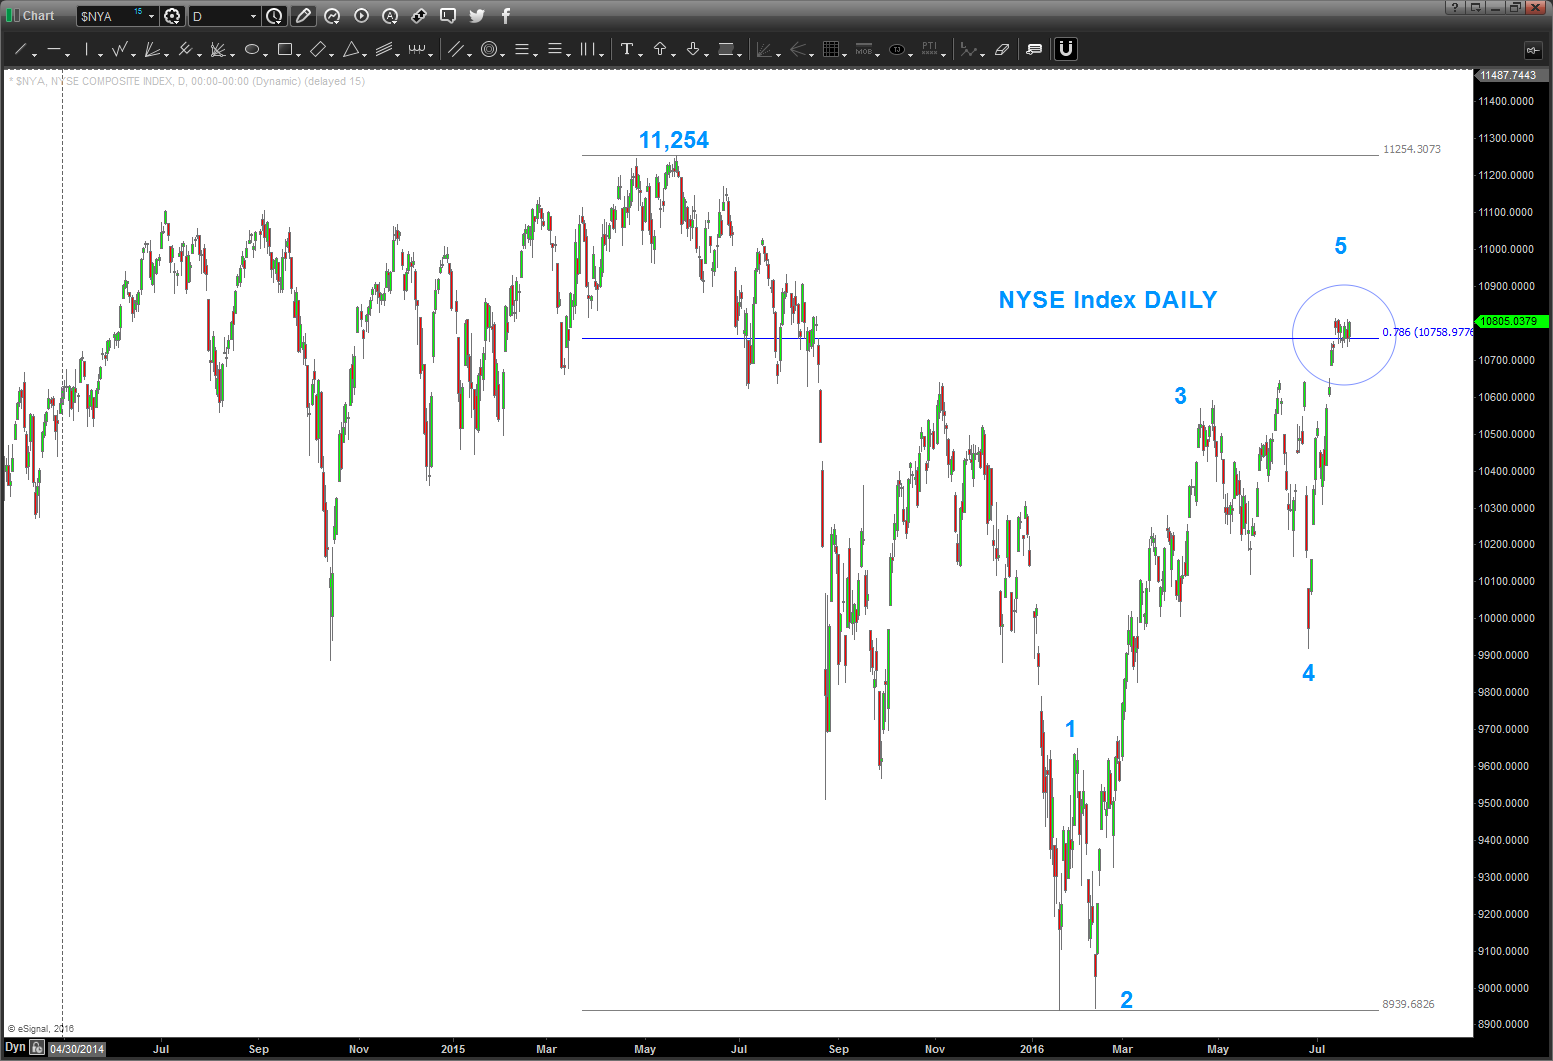
- Why is this important? Well, the NYSE index is a huge deal … it’s not manipulated and it’s encompasses most everything in that is traded (5000+ securities). so, take note of the chart below … we’ve hung out for 7 days at the .786 but HAVE NOT REALLY CLOSED BELOW IT. THAT IS BULLISH …
- I also see 1,2,3,4,5 waves completing – which is also BULLISH. It warns of a corrective pullback but the TREND is still UP and 1,2,34,5 waves UP means it wants to go higher after a pullback.
so, in summary, there are many bullish aspects of what’s going on right now … but as long as the NYSE stays below 11254 I have to remain cautious. If we blow thru there .. game on! then, perhaps the DOW tries to go seek the END OF THE OCTAVE at 22,346 as explained here:
I’ve seen the planetary aspects that my friends/mentors have been sending me and I also know the Bradley model turned DOWN HARD on Friday into late fall. Just use stops and let the math work …
Bart
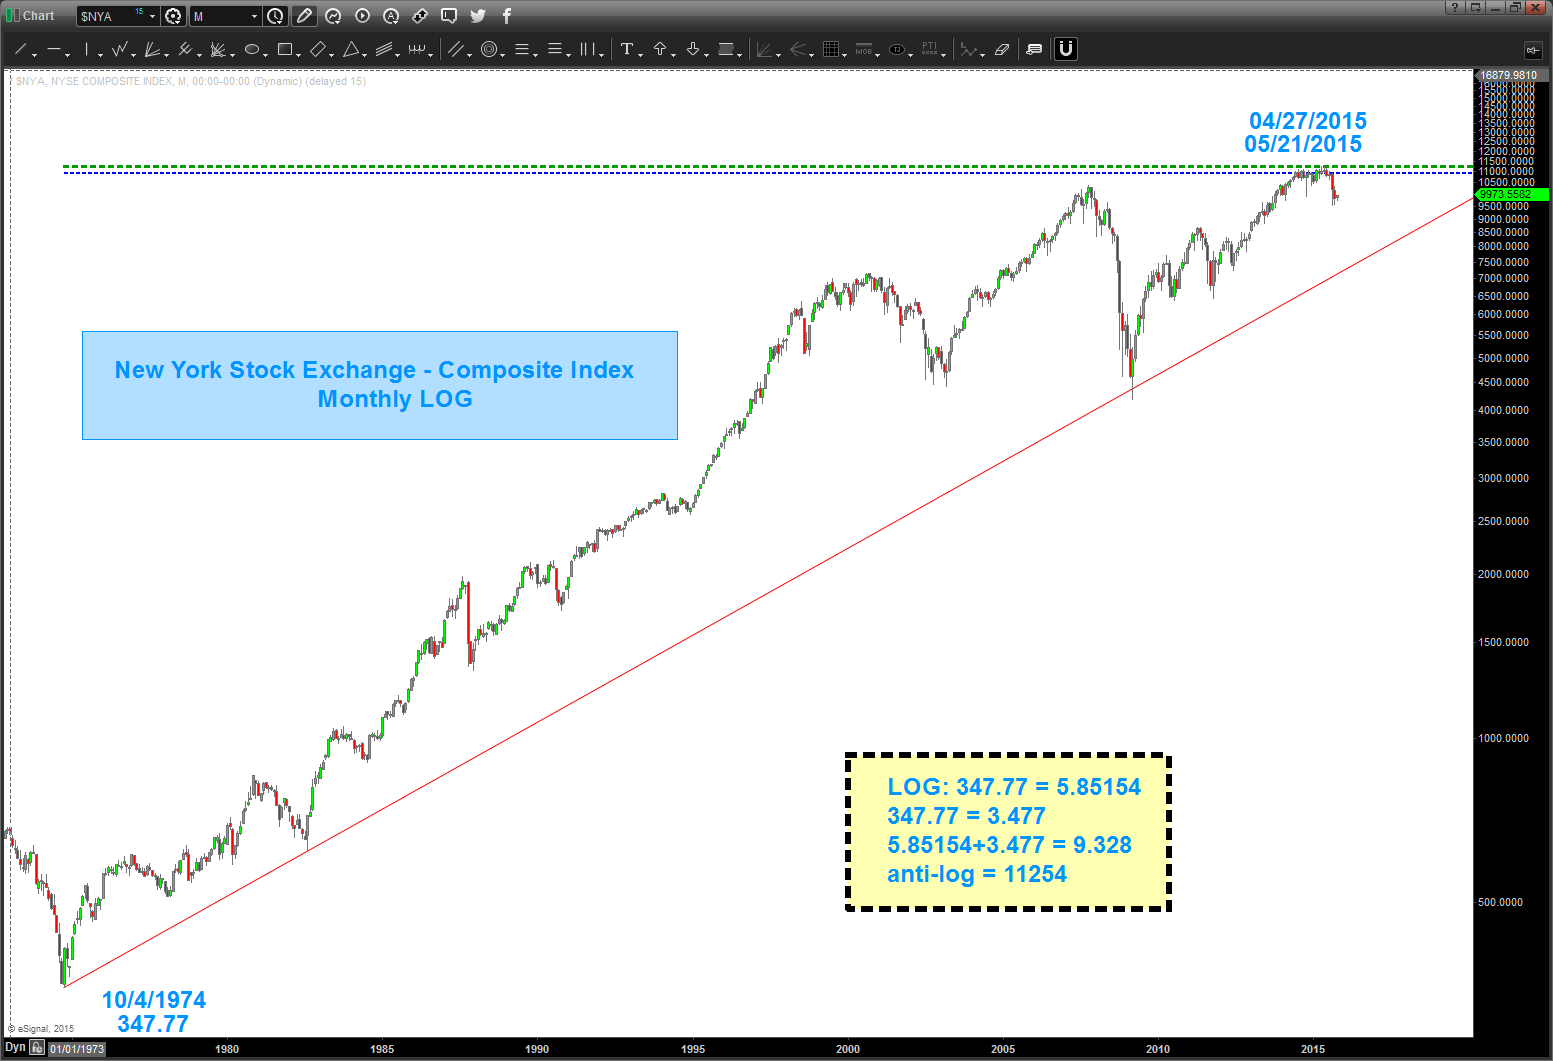
I’ve been asked, why do you use long term log charts so much …? Frankly, I think they are the MOST important tool in a chartists tool box.
When a mathematical property (LOGS, ANTI-LOGS, EXPONENTS) are responsible for the British Foot System, Stonehenge and the Great Pyramids I take notice …
In a prior post we discussed that “decimal points” are just “things” and when using vibrations (i.e. the market) we can move/adjust the decimal point. Take for instance the all time low on the NYSE Index at 347.77.
- PI = 3.142
- 3.142 = 31.42
- 31.42*347.77 = 10926.93 (see light blue dashed line)
Of note, the amazing Martin Armstrong called for his ECM model to turn October 01, 2015. I suspect if might have something to do w/ PI and the decimal shift. You see the fateful top in 1929 was September 03rd. 10/01/2015 was 31,439 days ago OR 3.1429.
If we go back to your long term LOG charts you’ll see the power of connecting lows via trend lines (those are key cycles) but what we can also do is PROJECT price targets and time targets.
Today, we’ll just focus on PRICE.
- All time low: 347.77
- Log (the LN key on calculator) 347.77 = 5.85154
- 347.77 = 3.477
- 5.585154+3.477 = 9.32854
- anti-log 9.32854 = 11254
Is that the EXACT high? Um, yeah, pretty much but – IS IT THE HIGH? I don’t know but what I do know is everything is tied together and it’s all math …
have a good weekend …
Under Armour ($UA) – updated
Posted on December 22, 2016 Leave a Comment
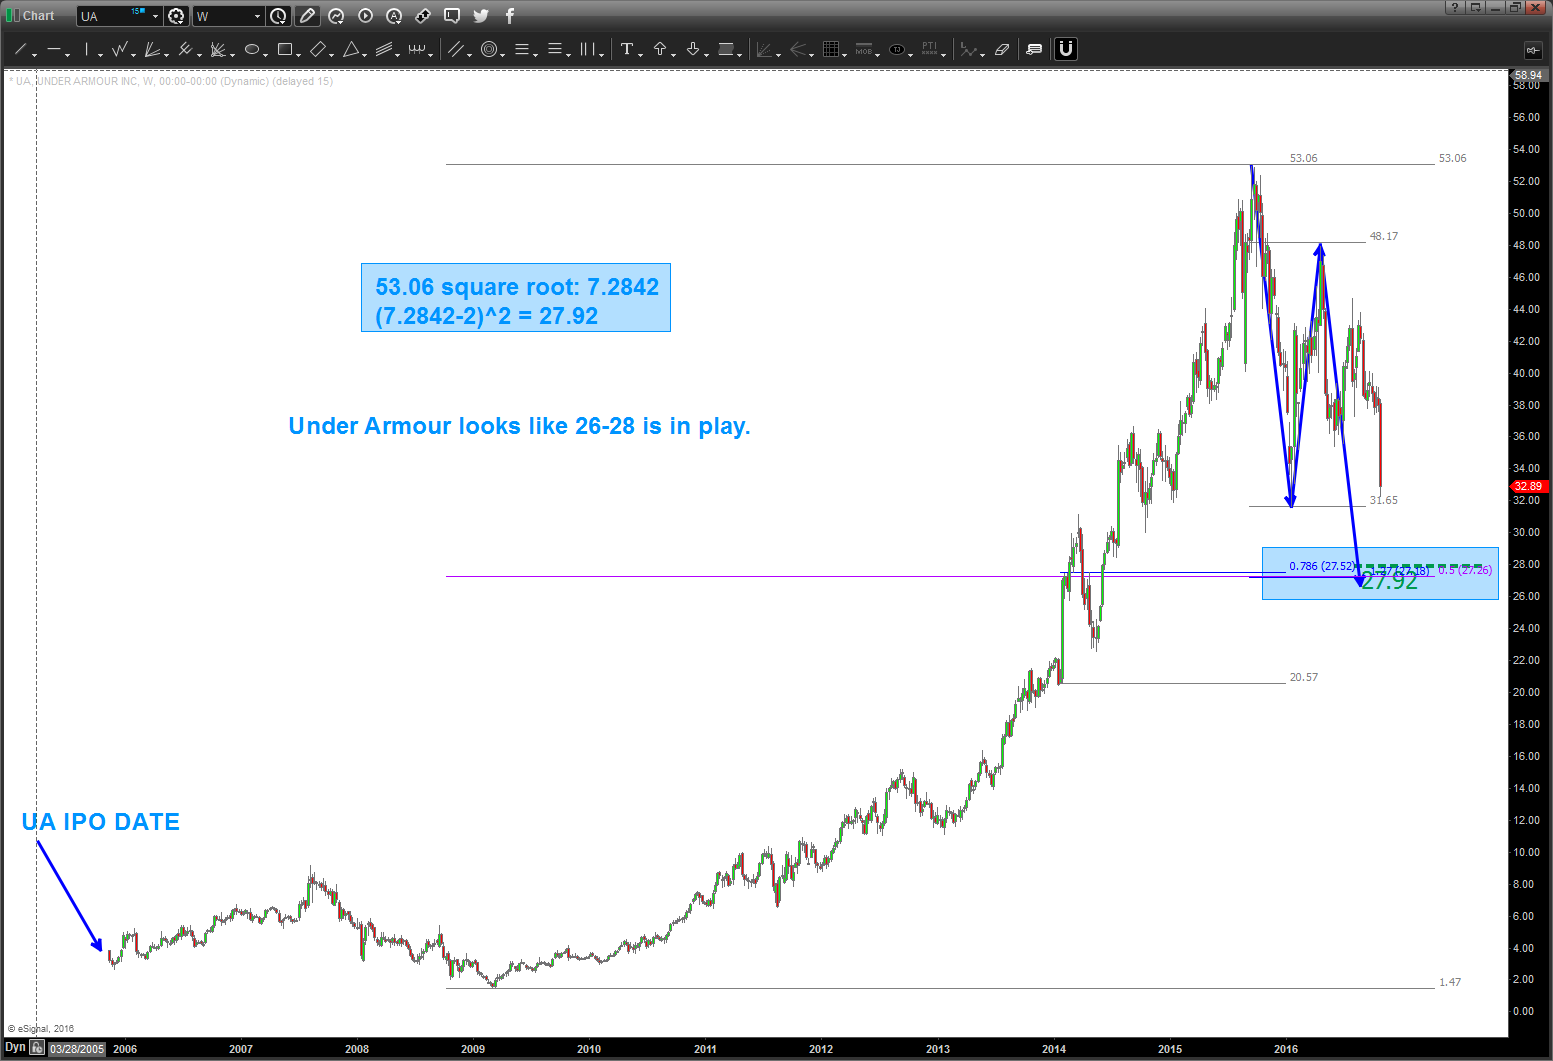
12/22/2016 – important support broke, so looks like the 26-28 zone/area is in play. again, all probability. personally, like UA stuff but have no idea what the fundamentals of their marketspace and strategy are. just patterns peeps. here we go …
also, showed some ‘art’ at how/where to draw retracement grids that are sometimes overlooked … folks, shit pile of numbers coming together. sorry if offended anyone but that just seemed like the correct word to use.
rock on, ok?
Bart
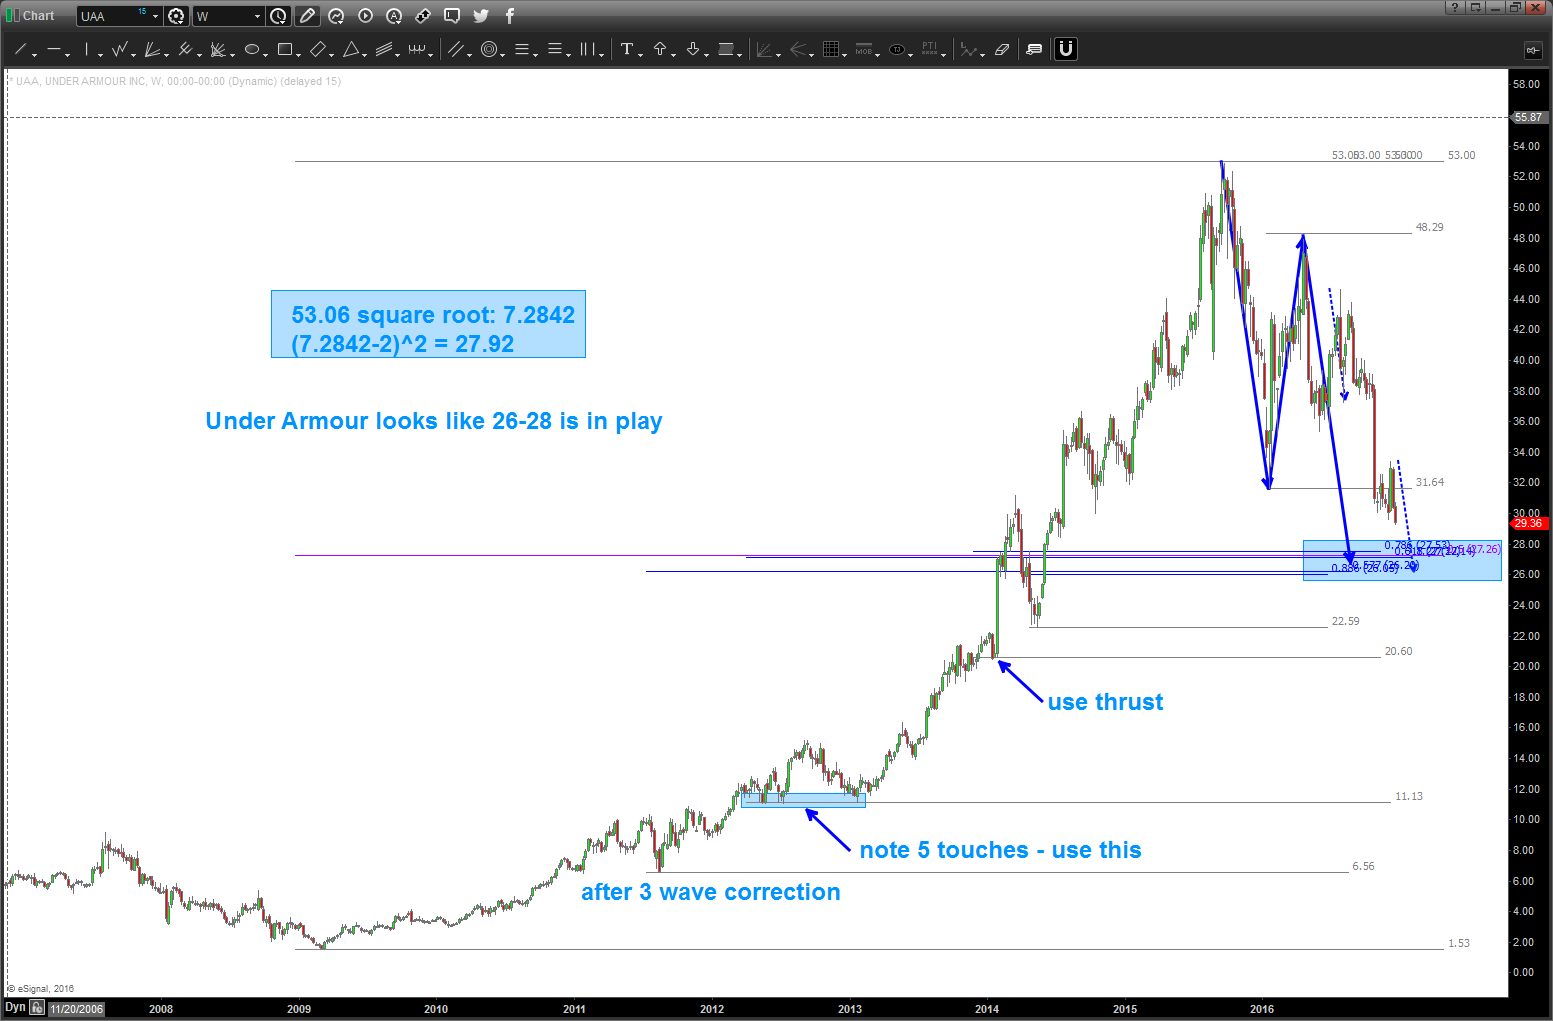
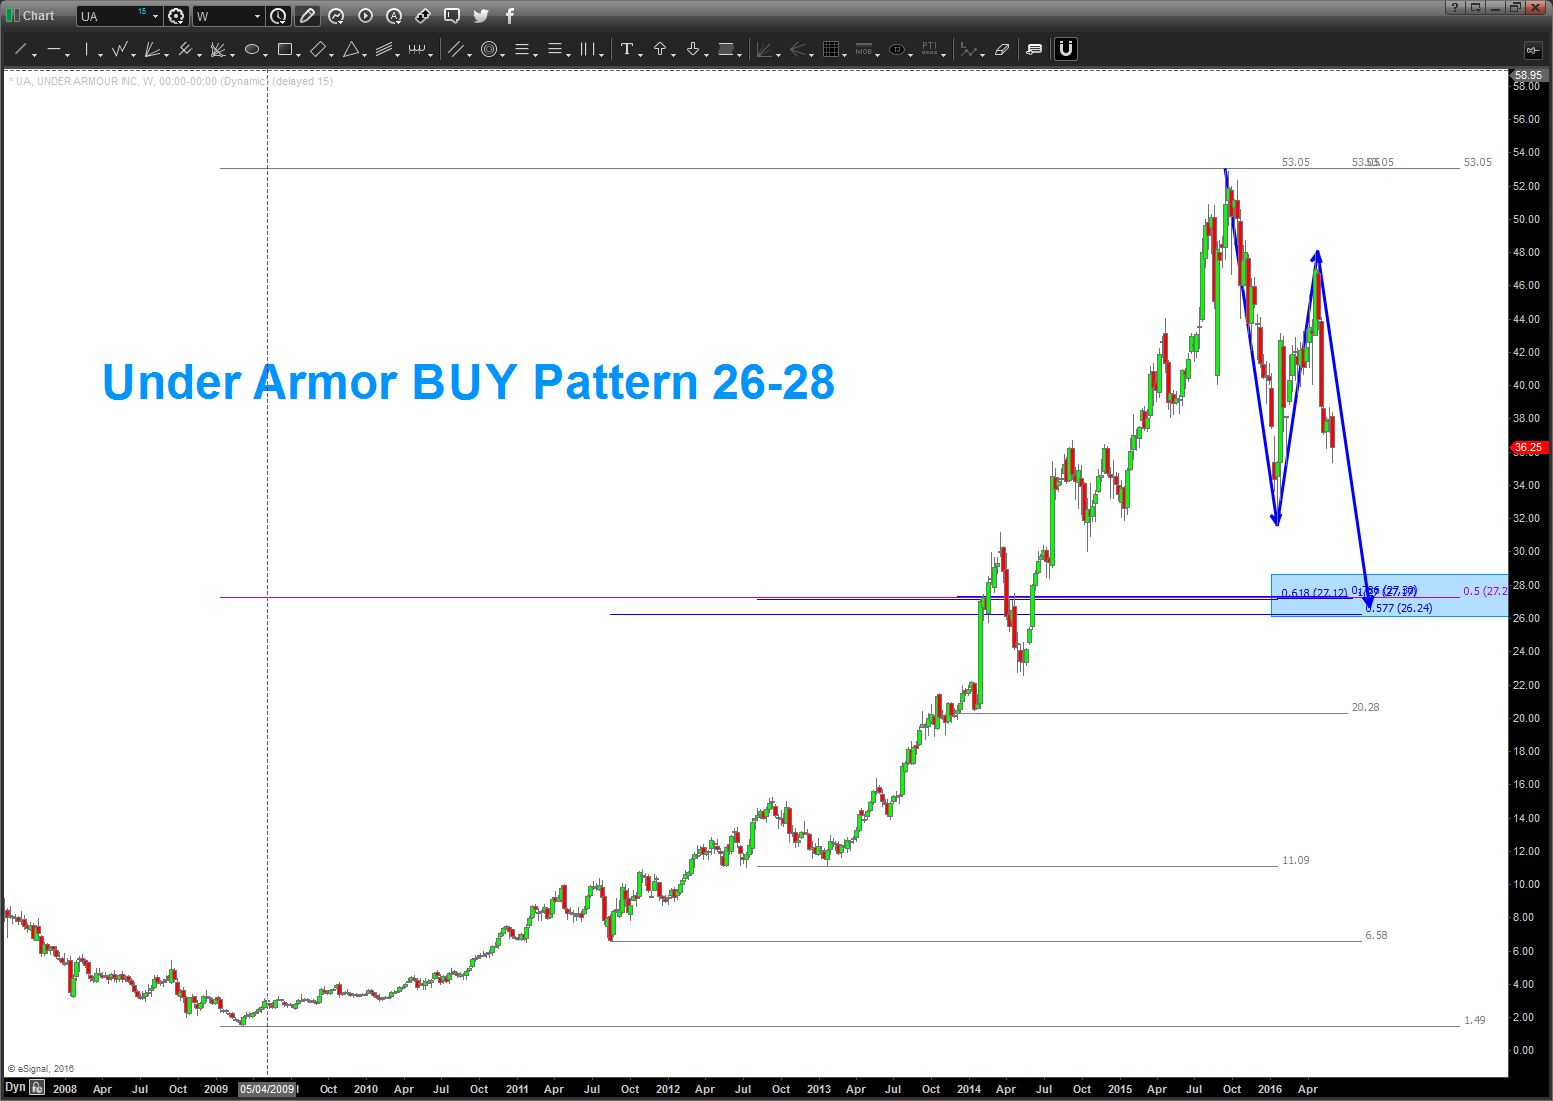
10/25/2016 – I was asked to take a look at Under Armour back in June. I saw this pattern – again – had ZERO idea if it would get down there. As a pattern recognition dude, that’s the pattern .. .as of today, appears it’s going to make that level. Some thoughts …
- this is the first ‘true’ BUY pattern since it’s IPO and after a spectacular and somewhat parabolic run.
- caution w/ the size of the candles coming down – that denotes thrust and patterns fail when huge thrusts hits the levels
- note the square root target hits – basically – right at the BUY pattern. That, my friends, is good.
- remember, the square root target is using the Gann Square of 9. One trip around the wheel is equal to the square root of the base number (in this case the high of 53.06) -2 and then resquared. That’s how it works …
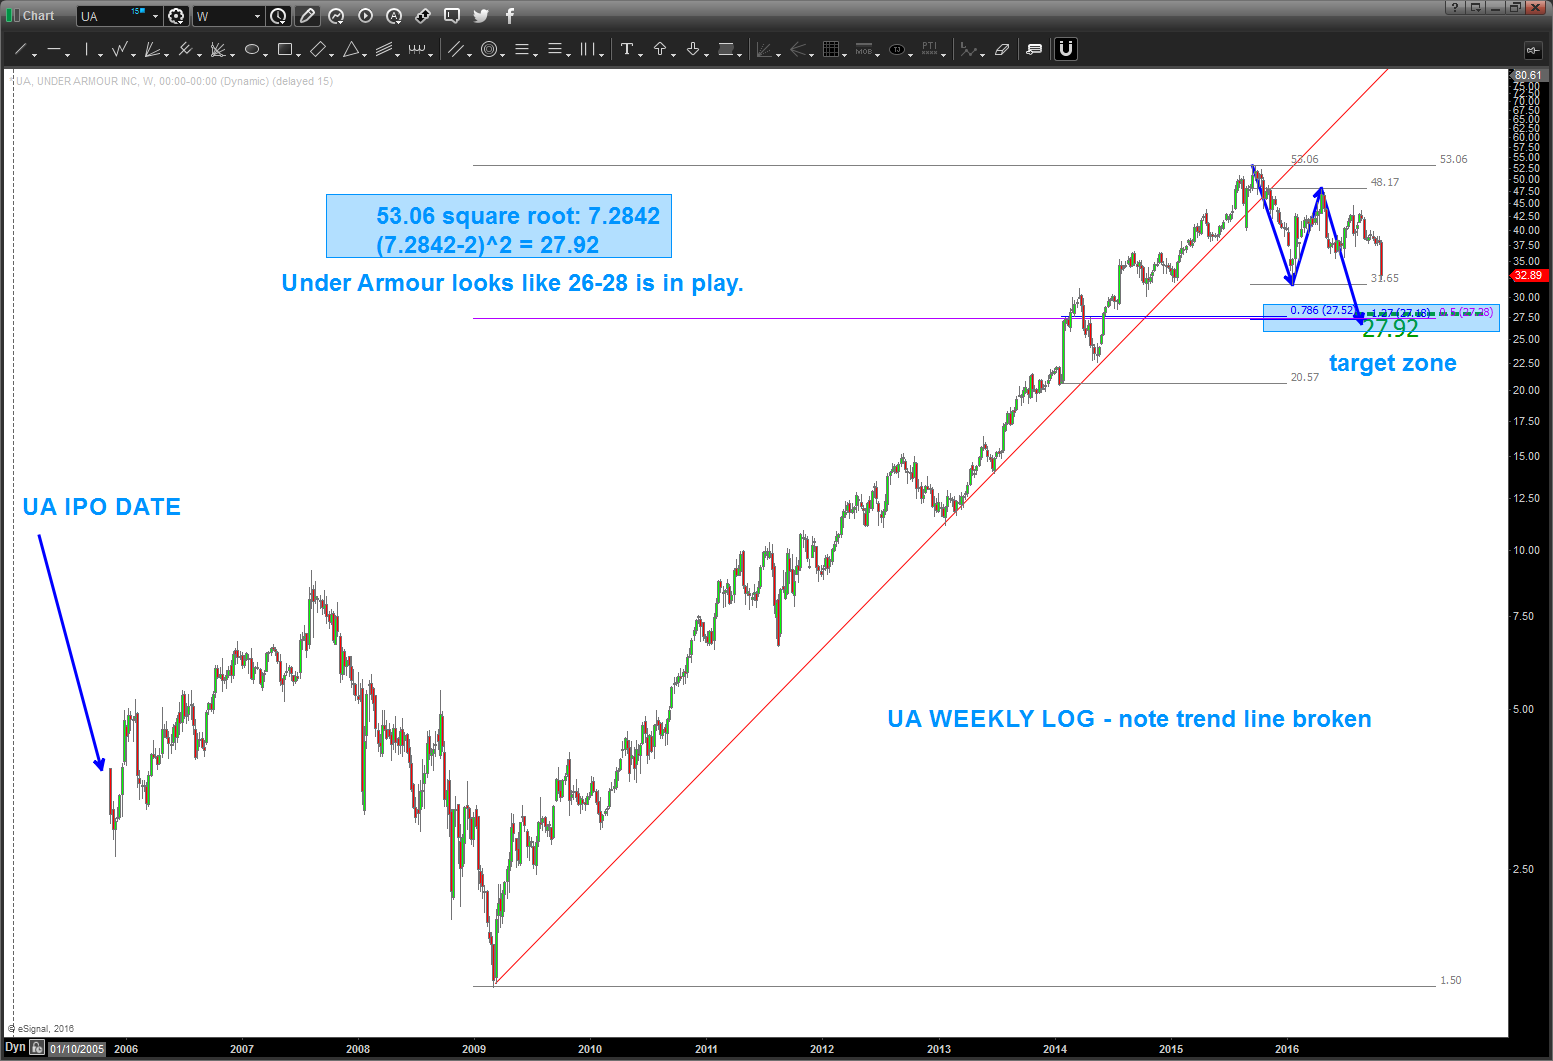
- the second chart is a long term log look at UA. NOTE – it broke it’s fabulous run .. so, this selling pressure is expected. that’s what happens when long term log trend lines are broken.
- this pattern fails – IMHO – with a daily close below 25.
GOLD – time to buy for next leg up?
Posted on December 22, 2016 Leave a Comment
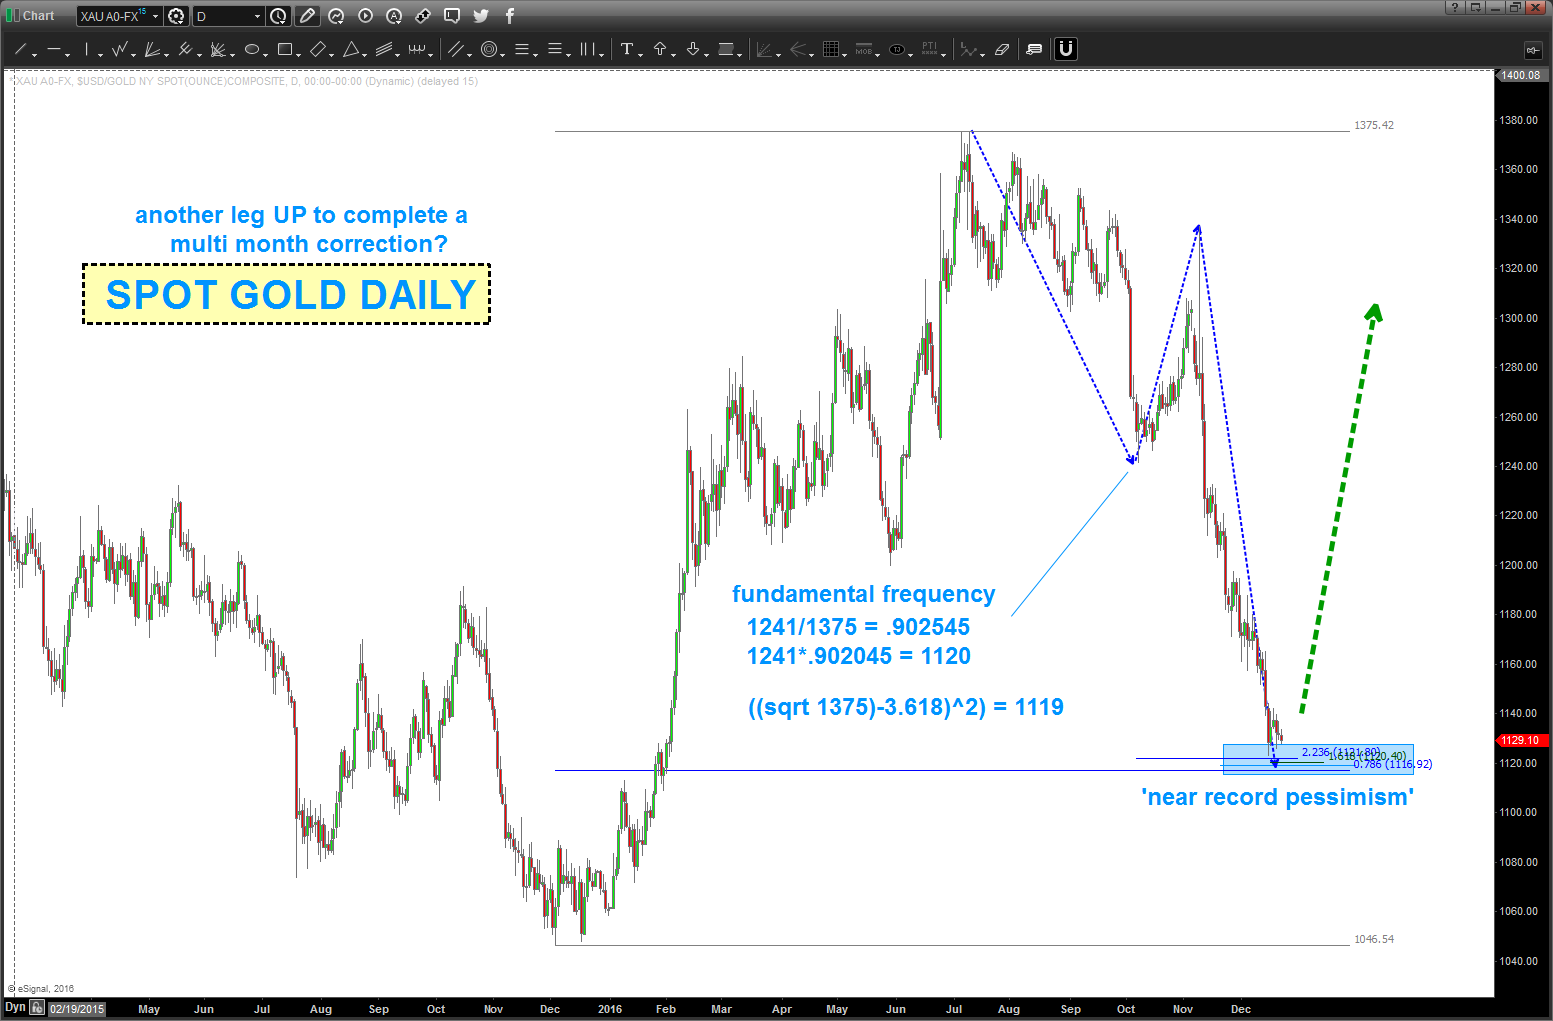
12/22/2016 – w/ near record pessimism for Gold it appears that another leg up (to complete a multi-month long correction from 1046) is about to begin.
levels below have a LOT of math …
- 1.618 price projection (dashed blue line)
- 2.236 (square root of 5) extension
- .786 retracement
- square root target using a 3.618 Fibo square of 9 projection
- fundamental frequency target (think of the rock hitting the water and making waves)
wrong below the last low of 1046.
Bart
the finishing of the Octave .. just a little higher
Posted on December 17, 2016 Leave a Comment
12/16/2016 – just updating this chart to show some potential targets I’ve been watching on the Dow Jones. I don’t know how high it’s going folks but I feel very confident that 2009-now is a BIG 5. Like a big 5 since the 1800’s five …
if you are REALLY into this stuff like I am … take some time to read the blog below. here’s the targets for now and as always let me know if you have any questions.
basically, over the coming months is another 10 percent move that out of the question?
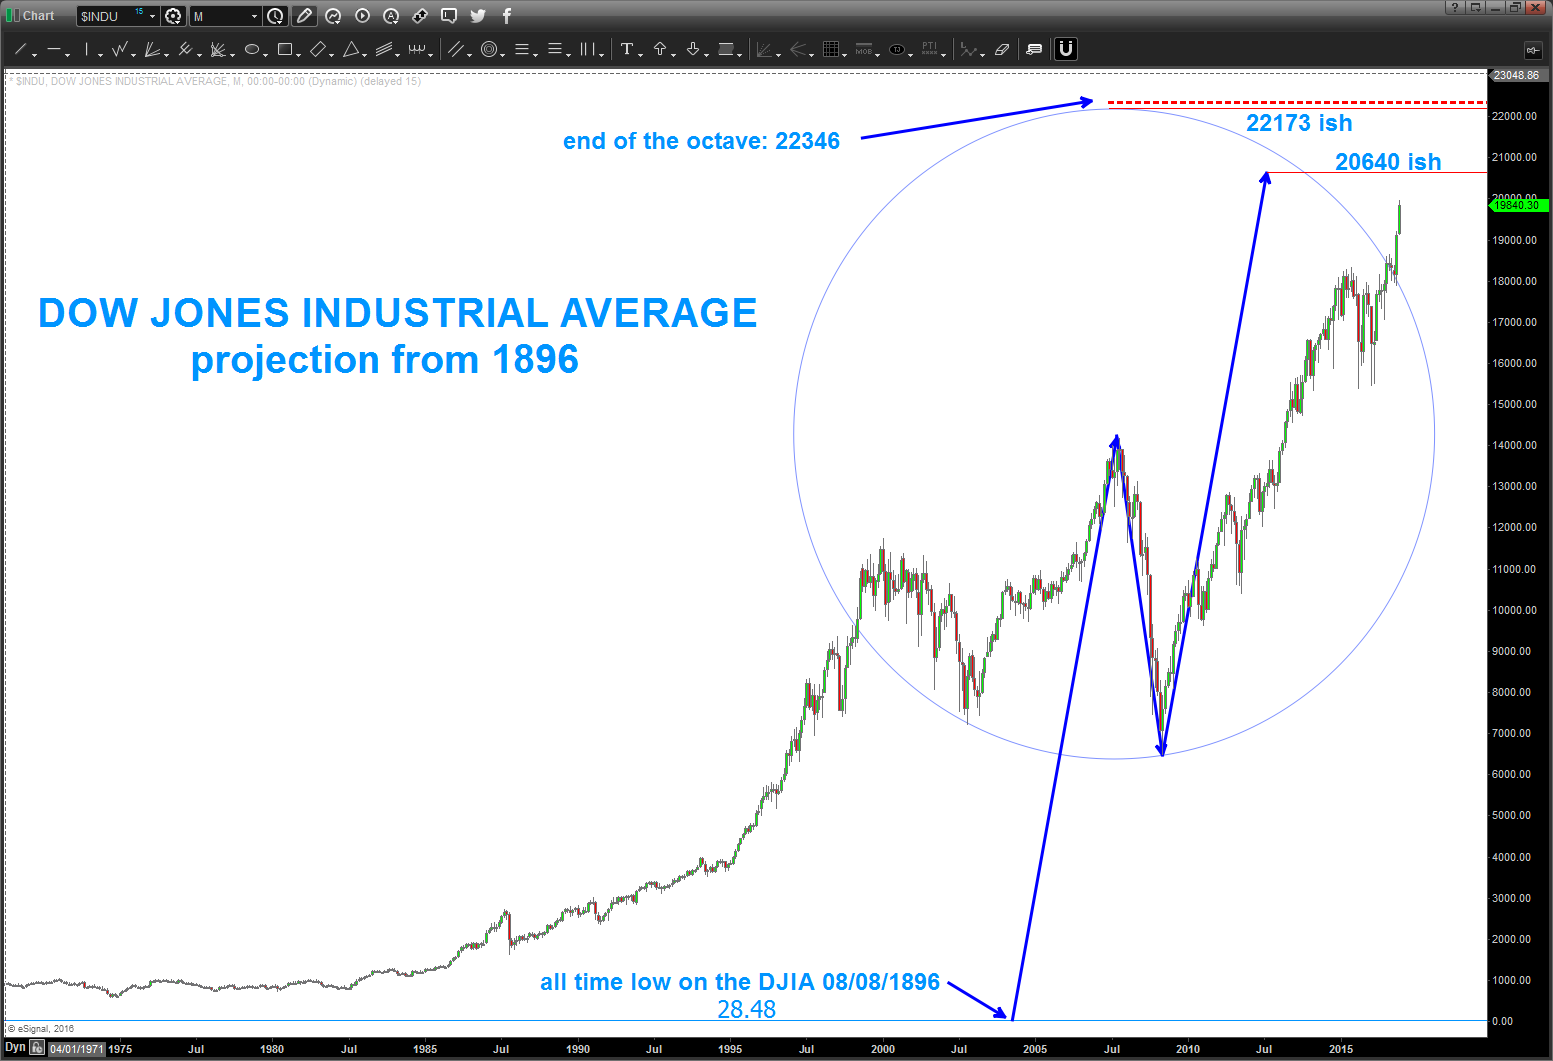
shown is the ‘basic’ AB=CD from the all time low in the late 1800’s up into the 2007-2008 top and then projecting … AB=CD, then some octave stuff and geometry stuff. Hang on … it’s going to be a wild ride.
I want to see if the music is math and what happens when we complete the OCTAVE …
Bart
What a great day yesterday … was working thru what my wife calls the “man flu,” it was pouring rain and nothing but great college football and logs. I know, that was geeky but during half-time of the Navy vs AF game I just sat down in front of my computer and said “self, let’s see if music is really involved in the market.” I think it is …
- I have never done this before, what you see is the result of starting from the all time low of 28.48 on 08/08/1896 some 43,250 calendar days ago as of this posting and simply “did the math.”
- Background:
- the frequency of a string is:
- inversely proportional to the square root of its length and
- directly proportional to square root of it’s tension
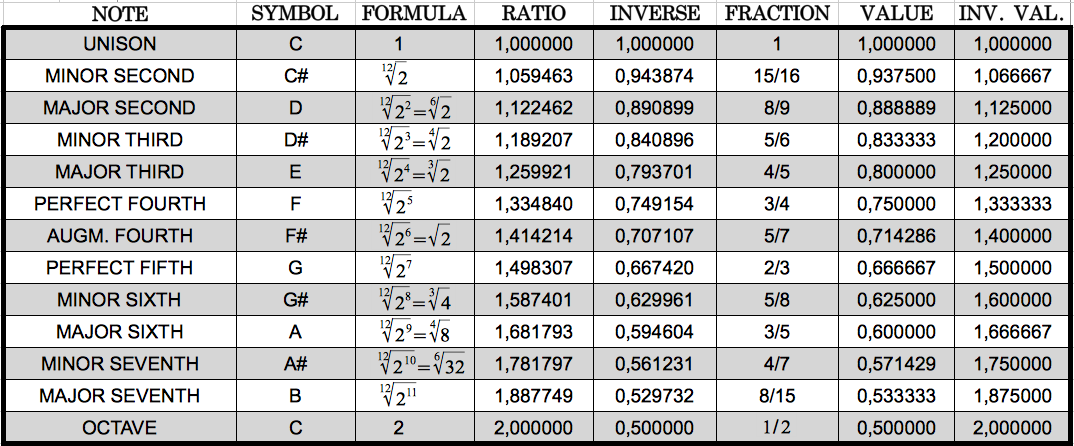
- here is a chart of the notes and the ratio’s and their inverses
- the frequency of a string is:
- Here is the math:
- 28.48 LN = 3.3492
- 3.34492 + ratio of equal octave scale = XXX
- anti-log of XXX = YYY
- plot YYY on long term monthly of DJIA
- For example:
- NOTE E: ratio 1.259921 and the inverse 1/1.259921 = .7937005
- 3.3492+.7937005 = 4.1429005
- 4.1386205 anti-log = 13896
- interesting to note how close that was to the top in 2007
- some 20 years prior the same “E” was wreaking havoc – here’s the math
- 3.3492+.07937005 (note the number stays the same – JUST SHIFT THE DECIMAL POINT) = 3.42857005
- anti-log of 3.42857005 =2683
is it any coincidence that the musical note E was found in 1987 and 2007 from the all time low in 1896?
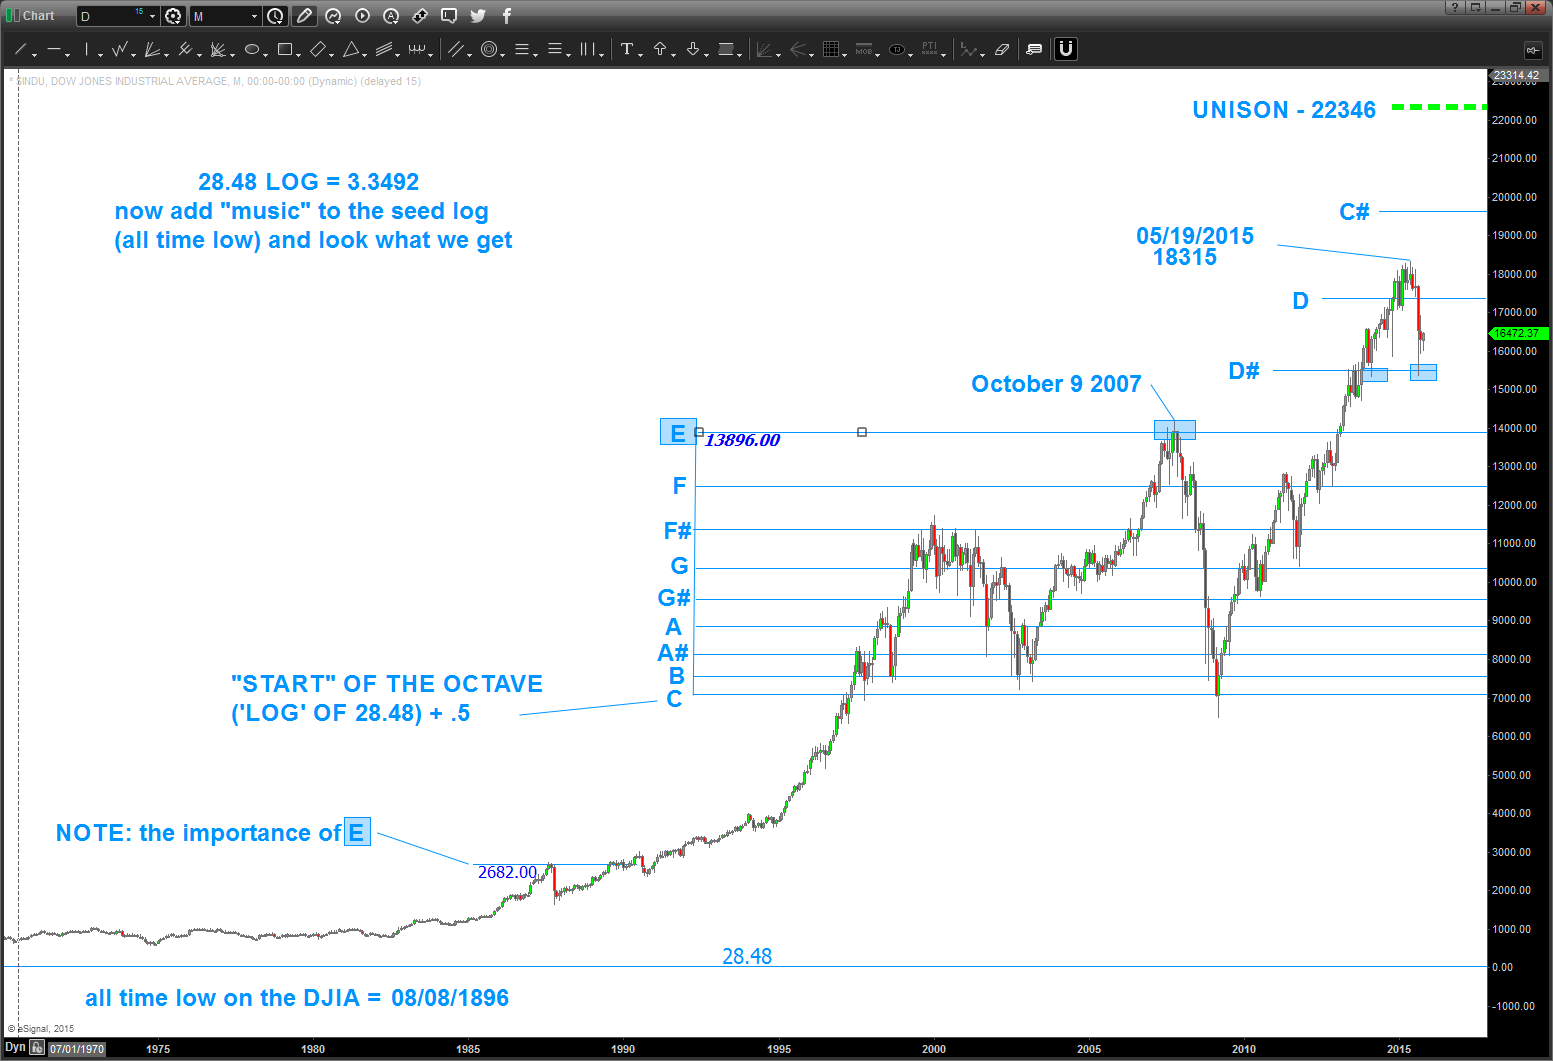
So what does this mean? Well, take a look at the chart … in 1997 the market came up and started another octave and has been banging in/around C-E for the past 20+ years. Note, the market did not CLOSE below the start of the octave “C” in 2009 … if I was in charge (and trust me I’m not) I sure think this market naturally wants to finish it’s symphony, so to speak, so is 22K out of the question? Who knows but I’m certainly going to be aware of these long term targets from 1896 as a guide.
Here’s a look on the way down …
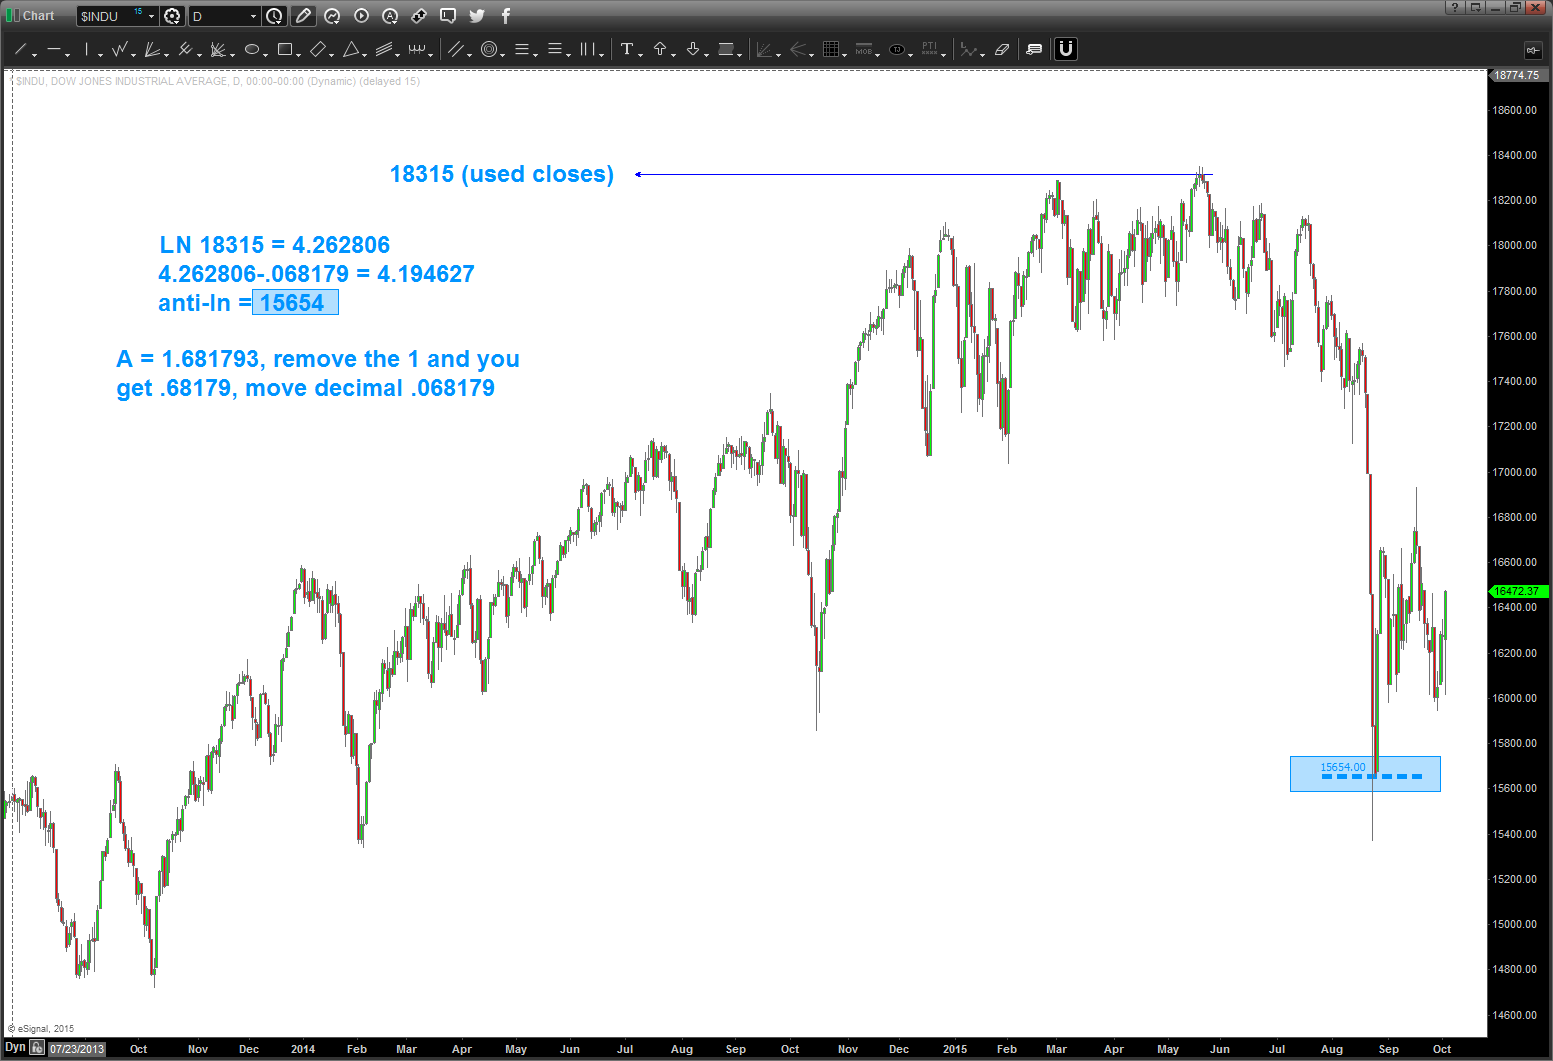
Happy Hunting and study up …
Bart
update on TLT and Bonds over @seeitmarket
Posted on December 12, 2016 2 Comments
sent to this to Andy and the gang over the weekend …let me know if you have any questions.
Bart
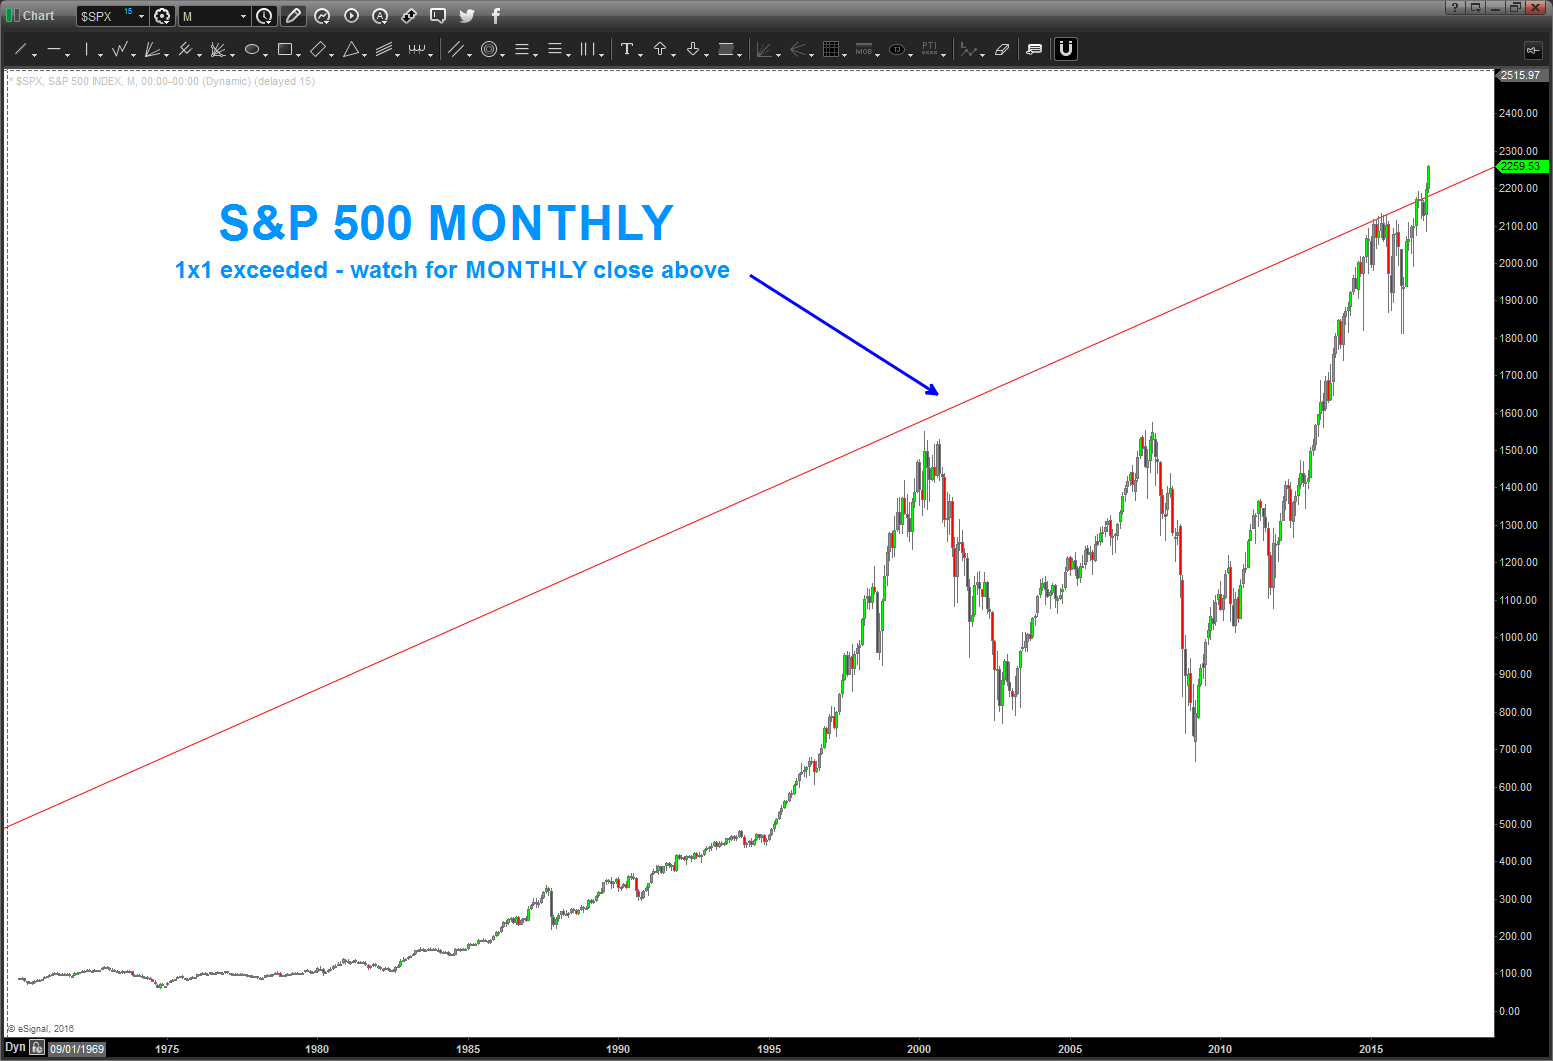
1×1 exceeded since inception … kaboom
Posted on December 10, 2016 Leave a Comment
12/10/2016 – ‘so just hang on to go up or down …’ – looks like it wanted to go up. note the explosive move behind the first time – ever – of going above the 1×1 since inception. a monthly close above this line is very explosive. BUT, I DO BELIEVE WE ARE CARVING OUT THE LARGEST TOP – EVER – in the Equity Market. Ride this pony while you can …
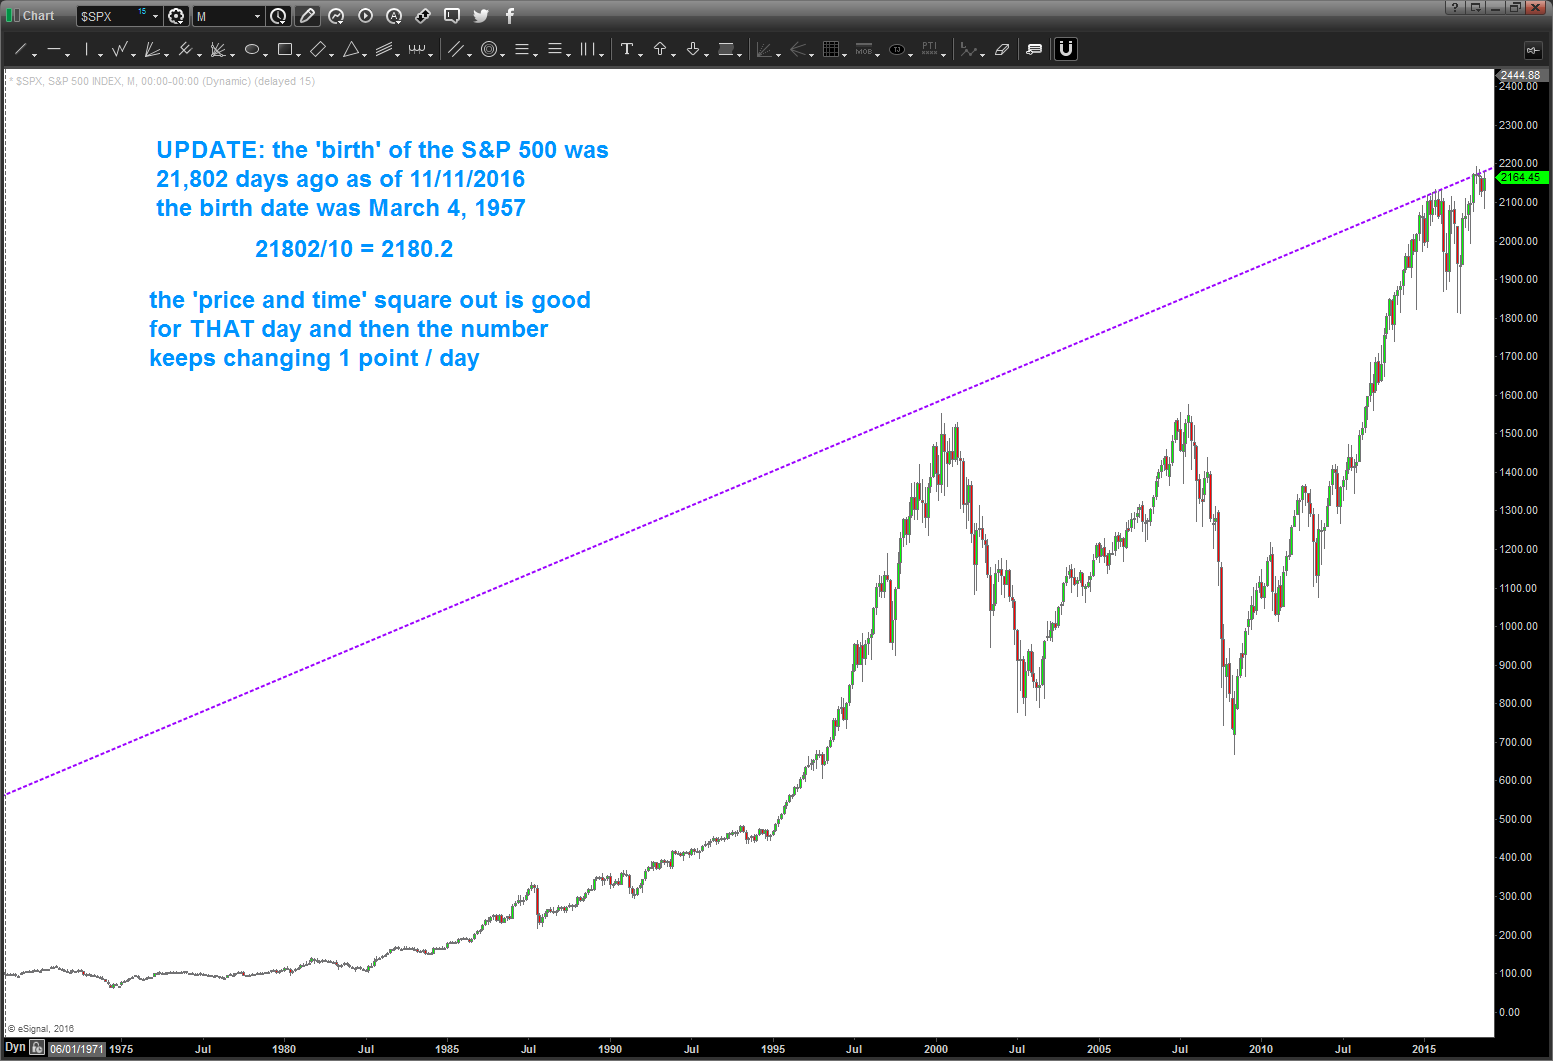
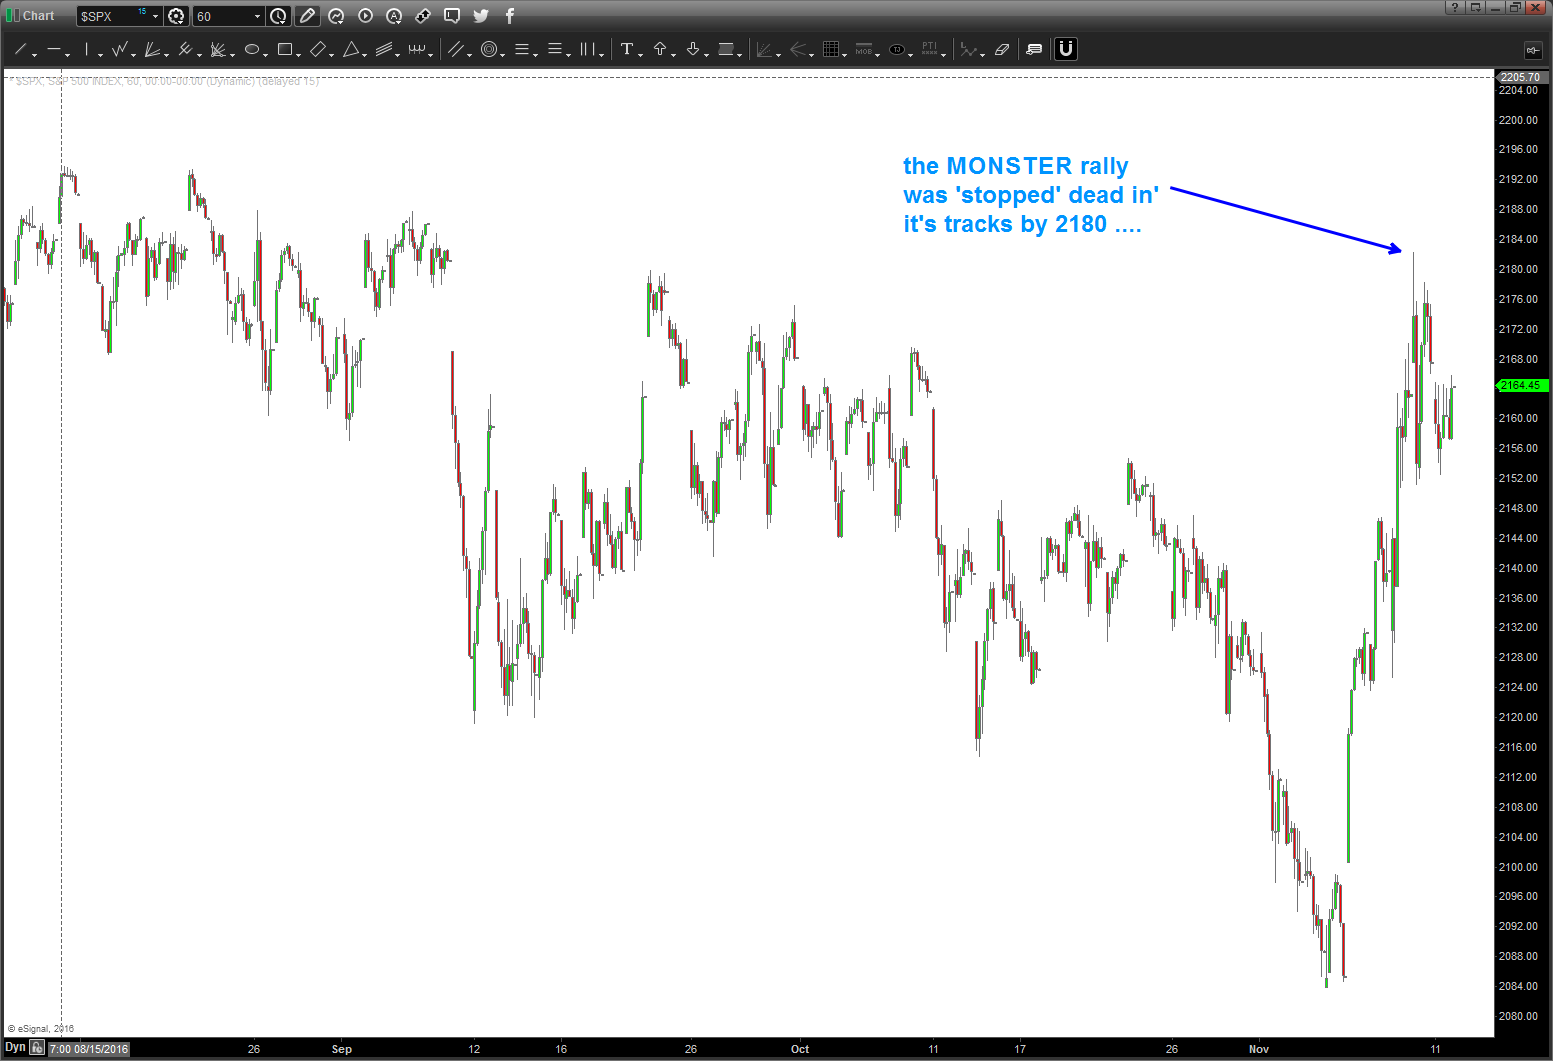
11/12/2016 – wanted to provide an update. the ‘square out number’ isn’t static. in fact, it changes every day. in this case, as we continue vortexing thru space we see that we are now, essentially, 2180 days since the ‘birth’ of the S&P 500. Of note, the post election crazy rally was stopped dead in it’s tracks by 2180. that’s the ‘key’ number right now … the market ‘wants’ to balance itself (remember: form, proportion, balance) so it’s no real surprise that the market went right up to that NUMBER.
so, what happens next? I honestly have no idea … but i do know that the market will move from these levels, usually, w/ a vengeance so just hang on to go up or down … a “weekly” close above one of the numbers tied to the square out would be bullish. a big break down below some former support would be bearish.
for now, as we bounce around these harmonic numbers of price/time – just chill and let it make up its mind.
hope this helps.
Bart
10/7/16 – just wanted to check in before the weekend. below is a chart that “visually” depicts the SQUARE OUT where PRICE EQUALS TIME and the TREND LINE you can create. In this case you can see the 1×1 is currently the REASON for the resistance on the S&P and then we simply did a 1/2 point/day and, why were were at it, a .382 point/day. HINT – why not try “musical notes” *days since inception or all time low. I bet, if we use, say .9438*days we’ll get close to the 2000 high and, while were are it, 1.05946*days we’ll be resistance on the cash S&P. It’s early on the West Coast … I don’t feel like doing it. Try it yourself.
also, we are using a CONSTANT 1 point/day “velocity” (in this case we use PRICE and TIME to create the vector math) and what else moves in a CONSTANT ? (hint – look up in the sky) YES, you got it … so, while your at it, use a planet and move them a certain amount of degrees in a certain amount of time. How about 100 degrees/100 days – 1 to 1 and see what happens.
Have a GREAT weekend.
B
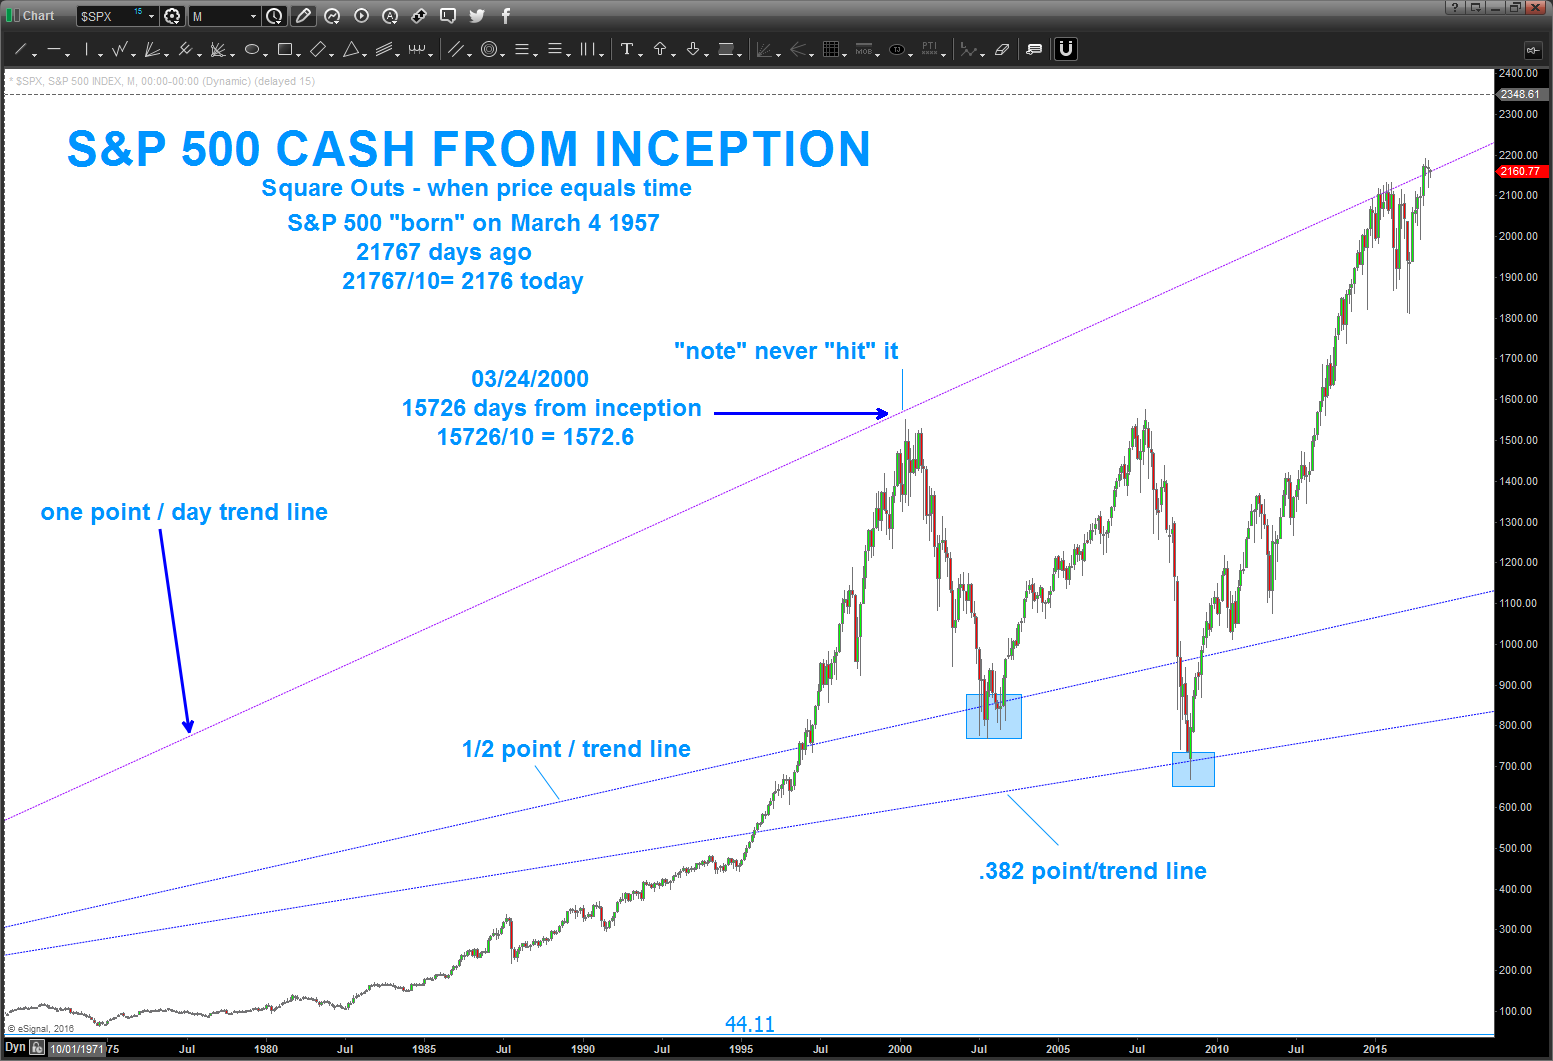
08/27/2016 – looks like we are still “squaring out” the date of the inception of the S&P500 w/ this past weeks weekly close.
again, this is not “bearish” or “bullish” but a heads up that at “square outs” stuff happens … go w/ the flow.
rock on, ok?
PATTERNS … work and they fail.
PATTERNS tell us of possible inflection points.
PATTERNS also tell us very important areas of interest to trade around ..
What if .. what if the PATTERN on the cash S&P has finished or is very close to finishing a sell signal?
That would mean we are at major resistance and the market “should” respect a PATTERN that has its genesis from it’s all time low 50 years ago….
IF the market DOES NOT respect this area and goes higher then we are really really really strong and I wold look to go LONG after a monthly or weekly close above these levels.
so, don’t shoot me- I got tons of crap this weekend for posting about the Utilities Pattern hitting (seems to be working so far) and I’m just mentioning that a “classic” AB=CD PATTERN is pretty much done on the S&P.
Pay Attention ….
Bart
PS – tons of cycles are hitting this week so just go w/ the flow and catch the wave that should begin soon. No idea which way it goes, it’s just a pattern. TRADE IT or NOT.
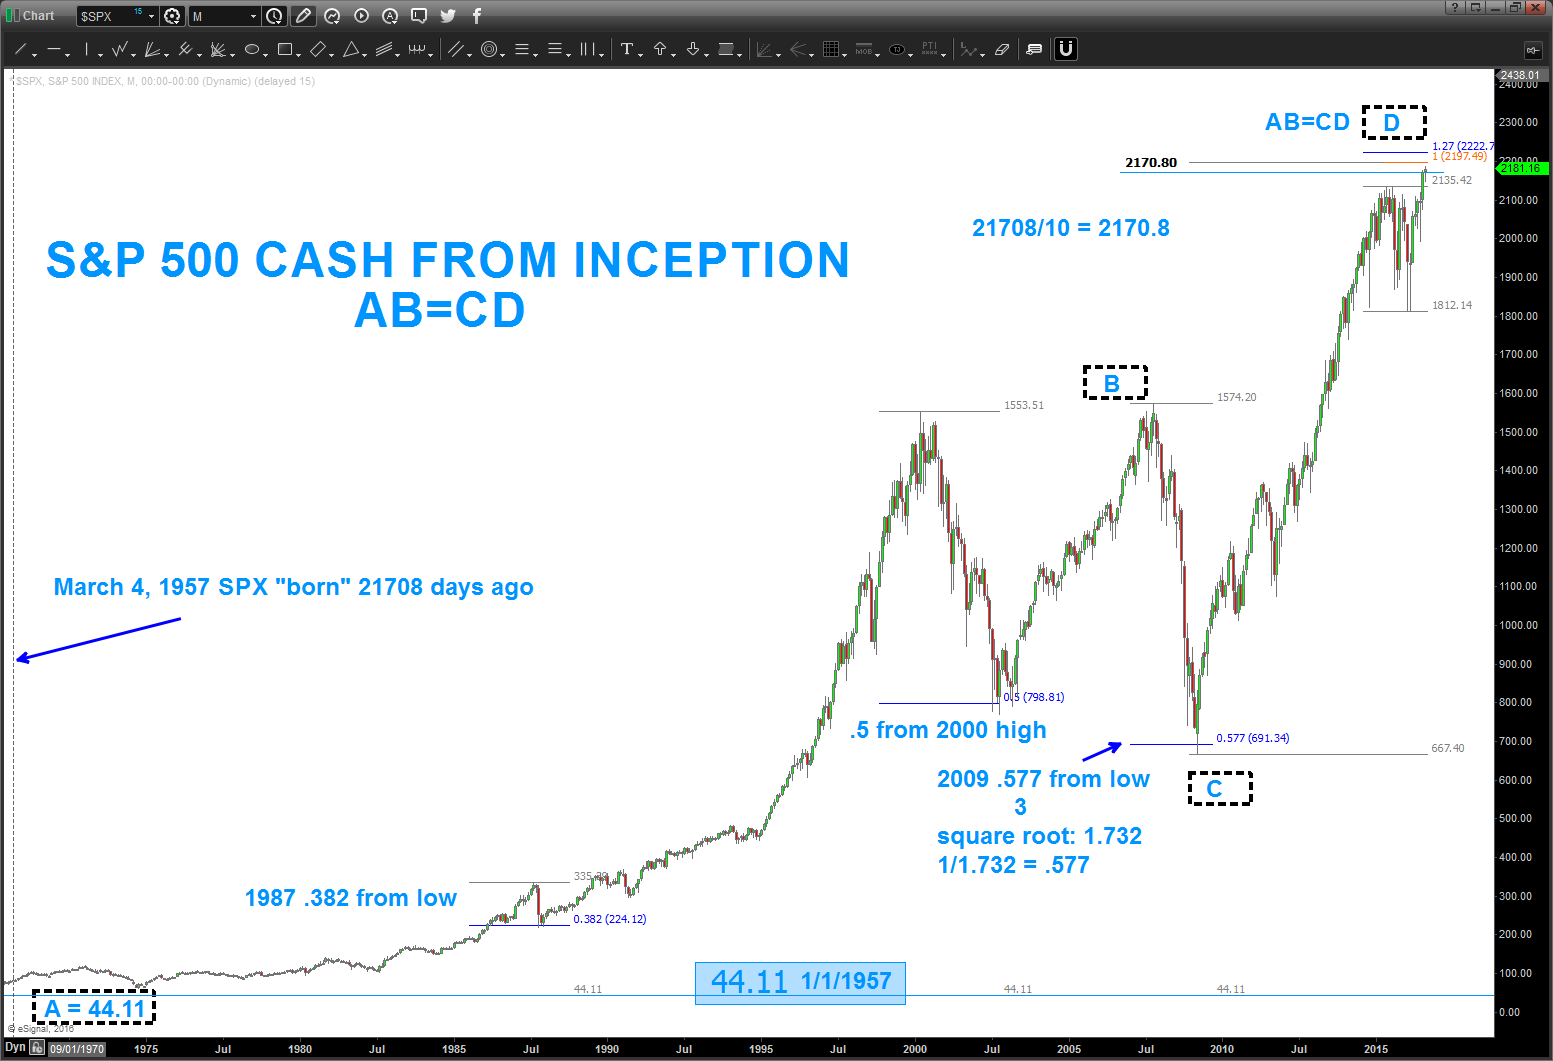
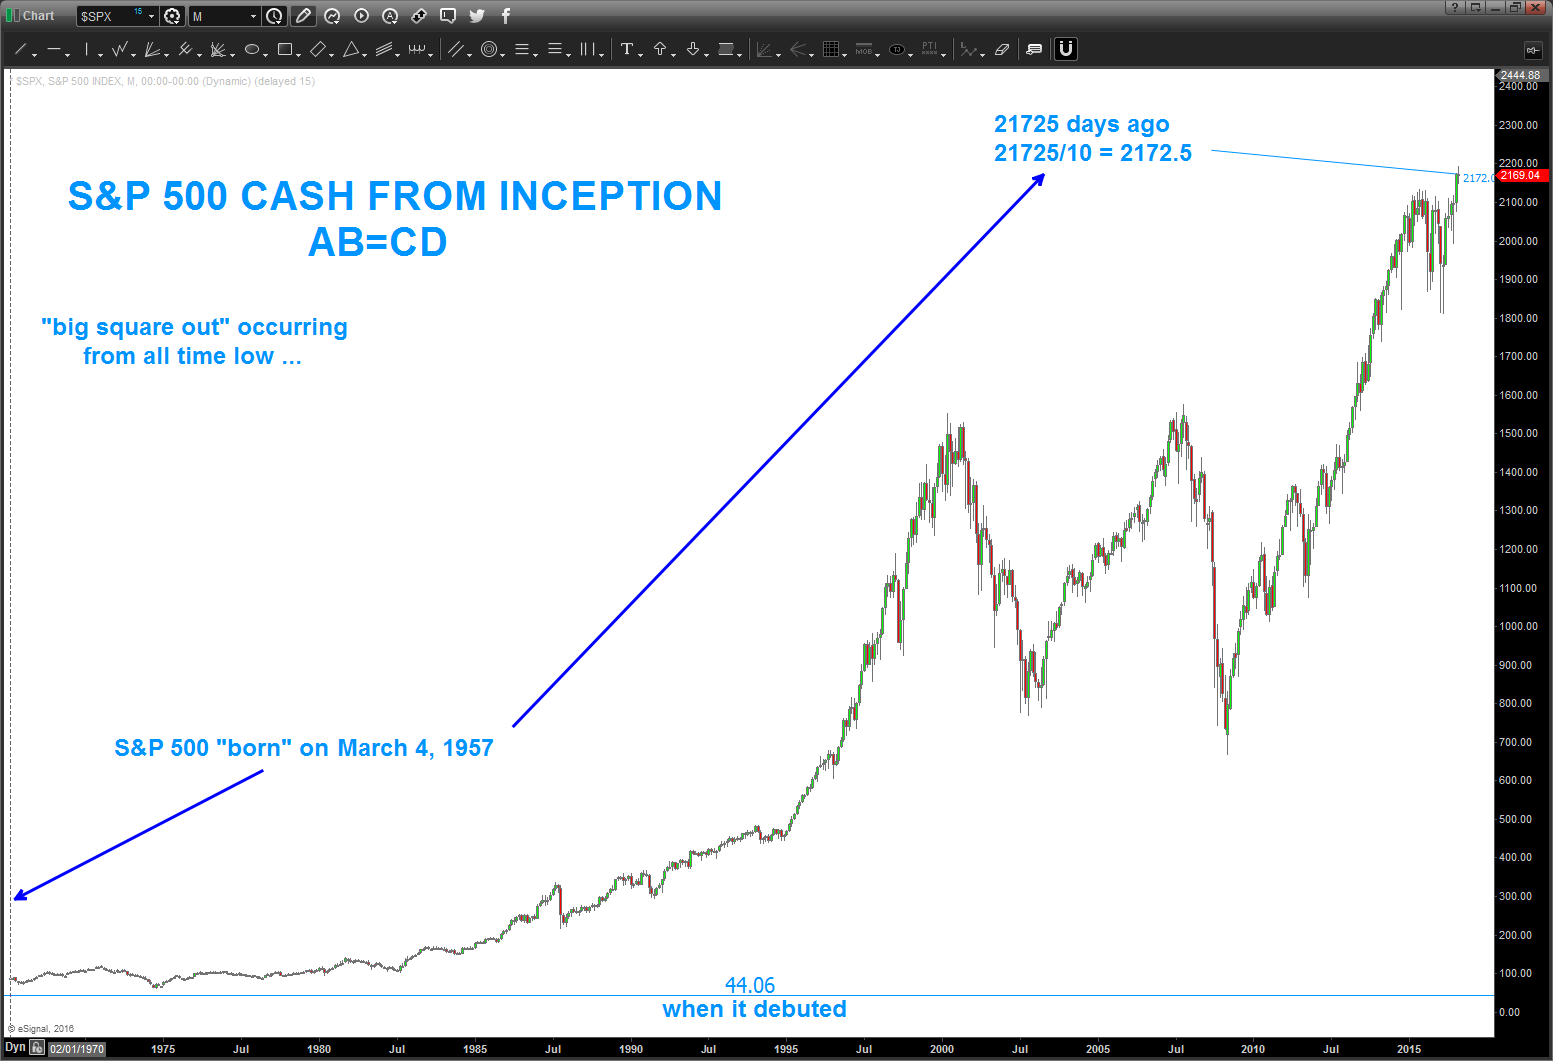
PS — also, the you’ll note the SK&P was BORN on March 4, 1957 or 21708 days ago. 21708/10 = 2170.8. Were only 10 points away from that price … if we close below 2171,2172,2173 etc. in the coming days the market has SQUARED OUT PRICE and TIME. “Stuff” usually happens around those occurrences. An FYI …
