PCLN continuing to monitor and update
Posted on January 21, 2017 Leave a Comment
1/21/2016 – continuing to update. note, didn’t go down and complete the pattern. Support held at 1459.
where are we now … we have 3 ratio’s coming together at current levels but could go up to 1560 or 1570… monitor the 1528 and 1515 level closely as DAILY closes below those levels could spell trouble.
again, read down below when everything came together at 1600. that is why I still favor the downside.

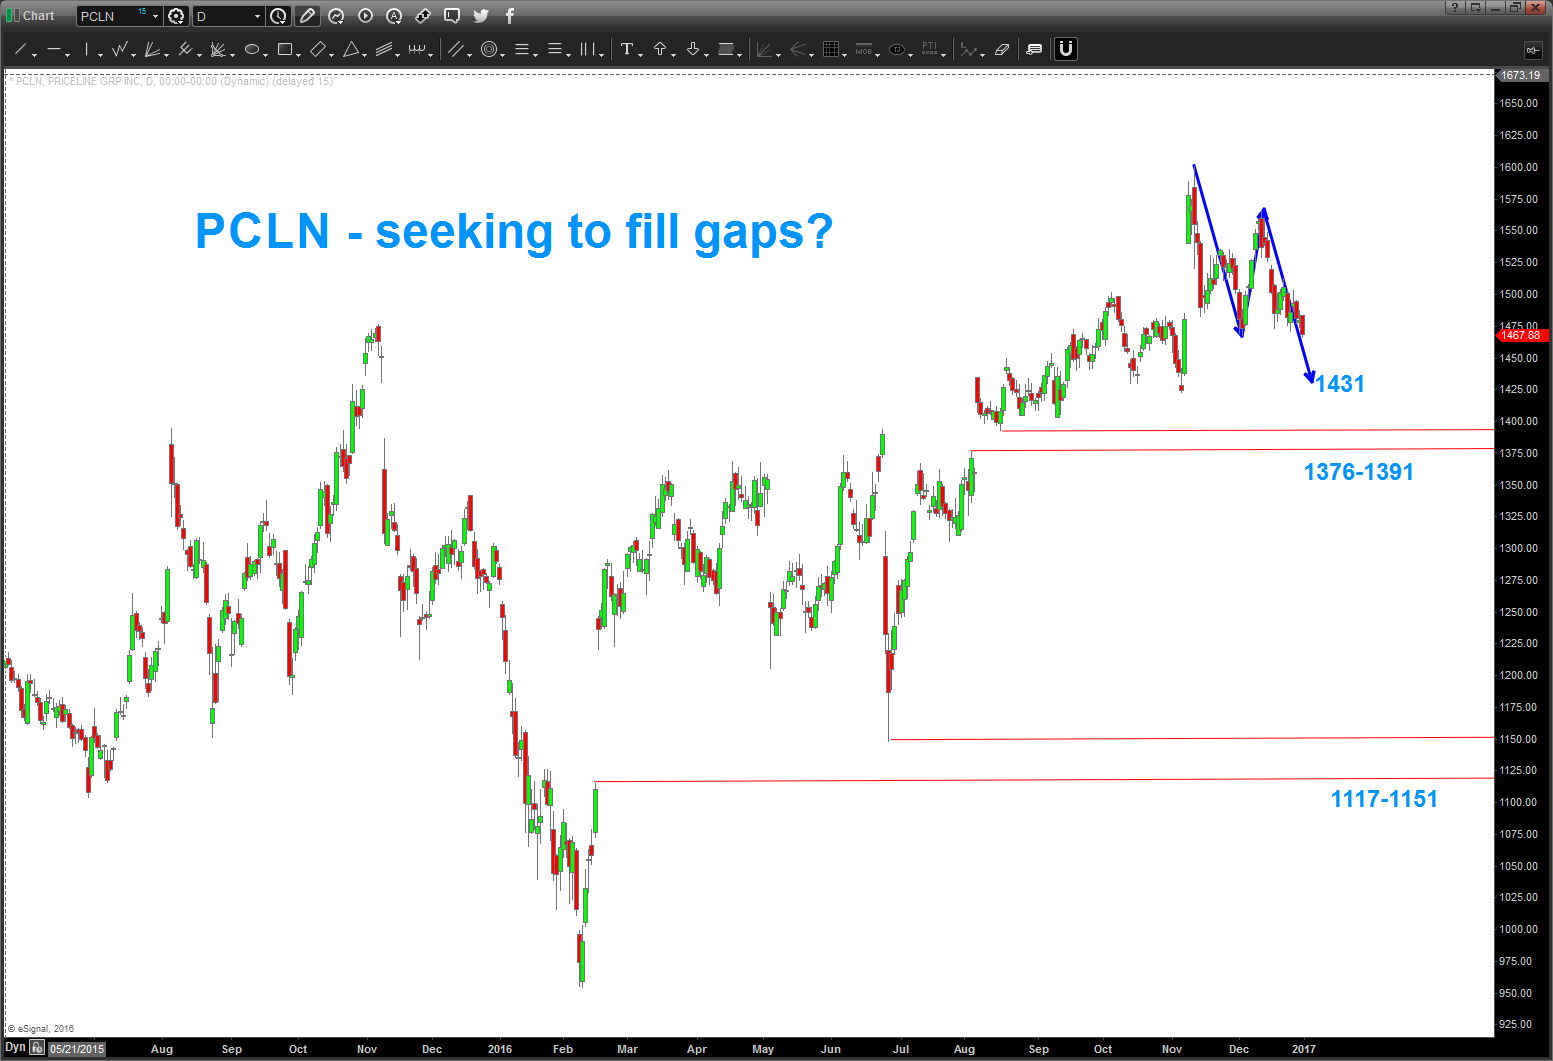
12/30/2016 – PCLN seeking to fill gaps? note the first target is the ‘basic’ ab=cd at 1431. also, read below … the 1600 level was the convergence of 5 major patterns.
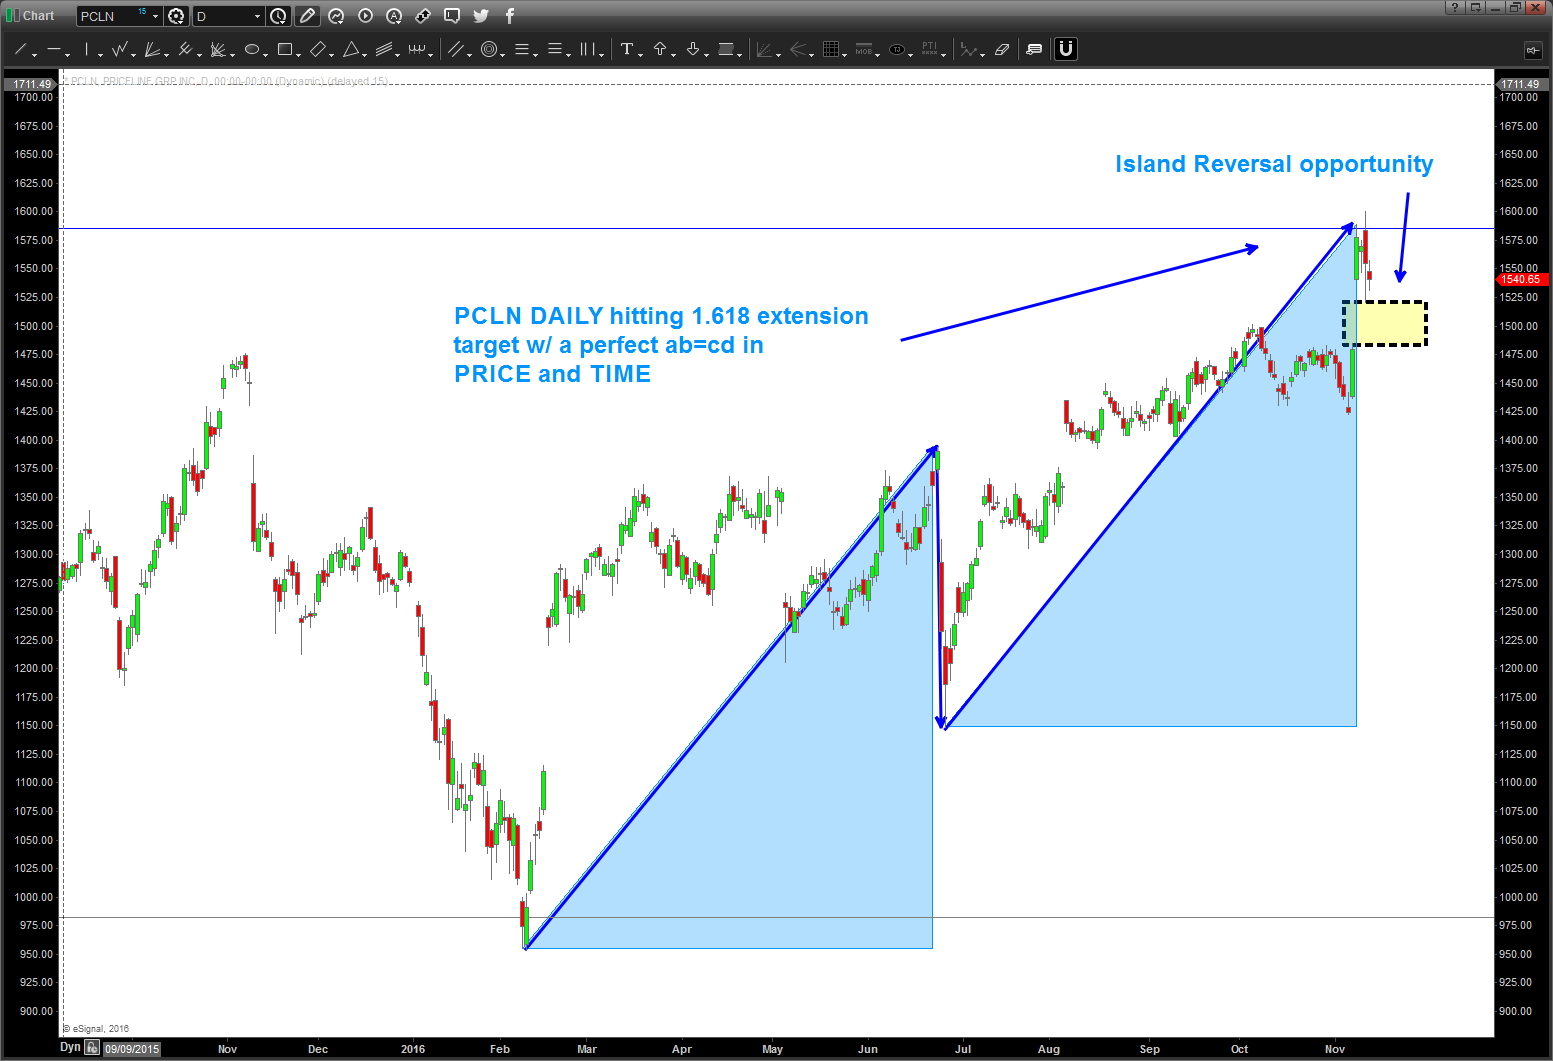
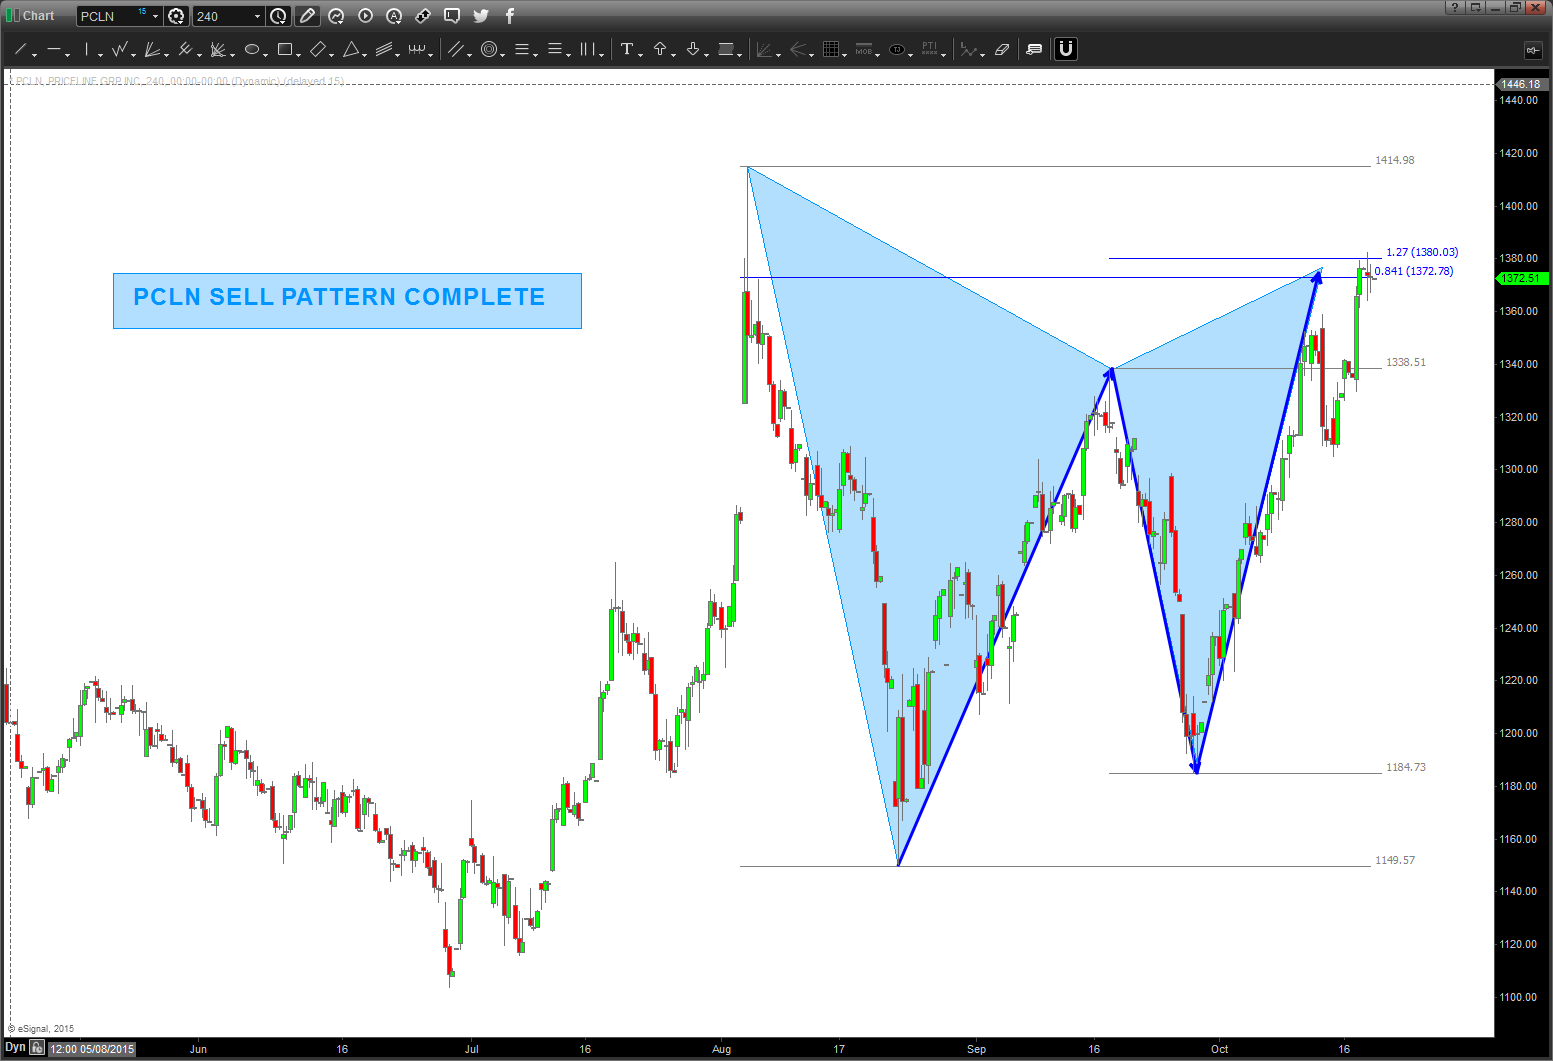
11/12/2016 – well PLCN went up and hit the level shown below. Folks that’s 5 monthly patterns on PCLN. IT SHOULD BE MONSTEROUS RESISTANCE for PCLN to go higher. As always, patterns do fail and they do work so it’s all probability. Also, when we go down to the daily time frame NOTE the perfect AB-CD in price and time. This completed the butterfly sell pattern and it’s extremely helpful when TIME of the last leg of the butterfly balances itself …also, note the ‘classic island reversal opportunity” where all we need to complete is a gap down below the shaded yellow box and this puppy could get rolling.
last thing – there are targets a little higher so any strategy should take that into account ..but, for now, we have 5 MONTHLY PATTERNS COMPLETING ON PCLN.
TAKE NOTE!
Bart
10/9/2016
PCLN found support on the “polarity” from the IPO and, essentially, negated the mirror image foldback pattern discussed below. What now?
If you take a look at the long term chart, again, you’ll see some powerful sell patterns all coming together. as for right now, appears we are in no mans land w/ no pattern (buy or sell) present.
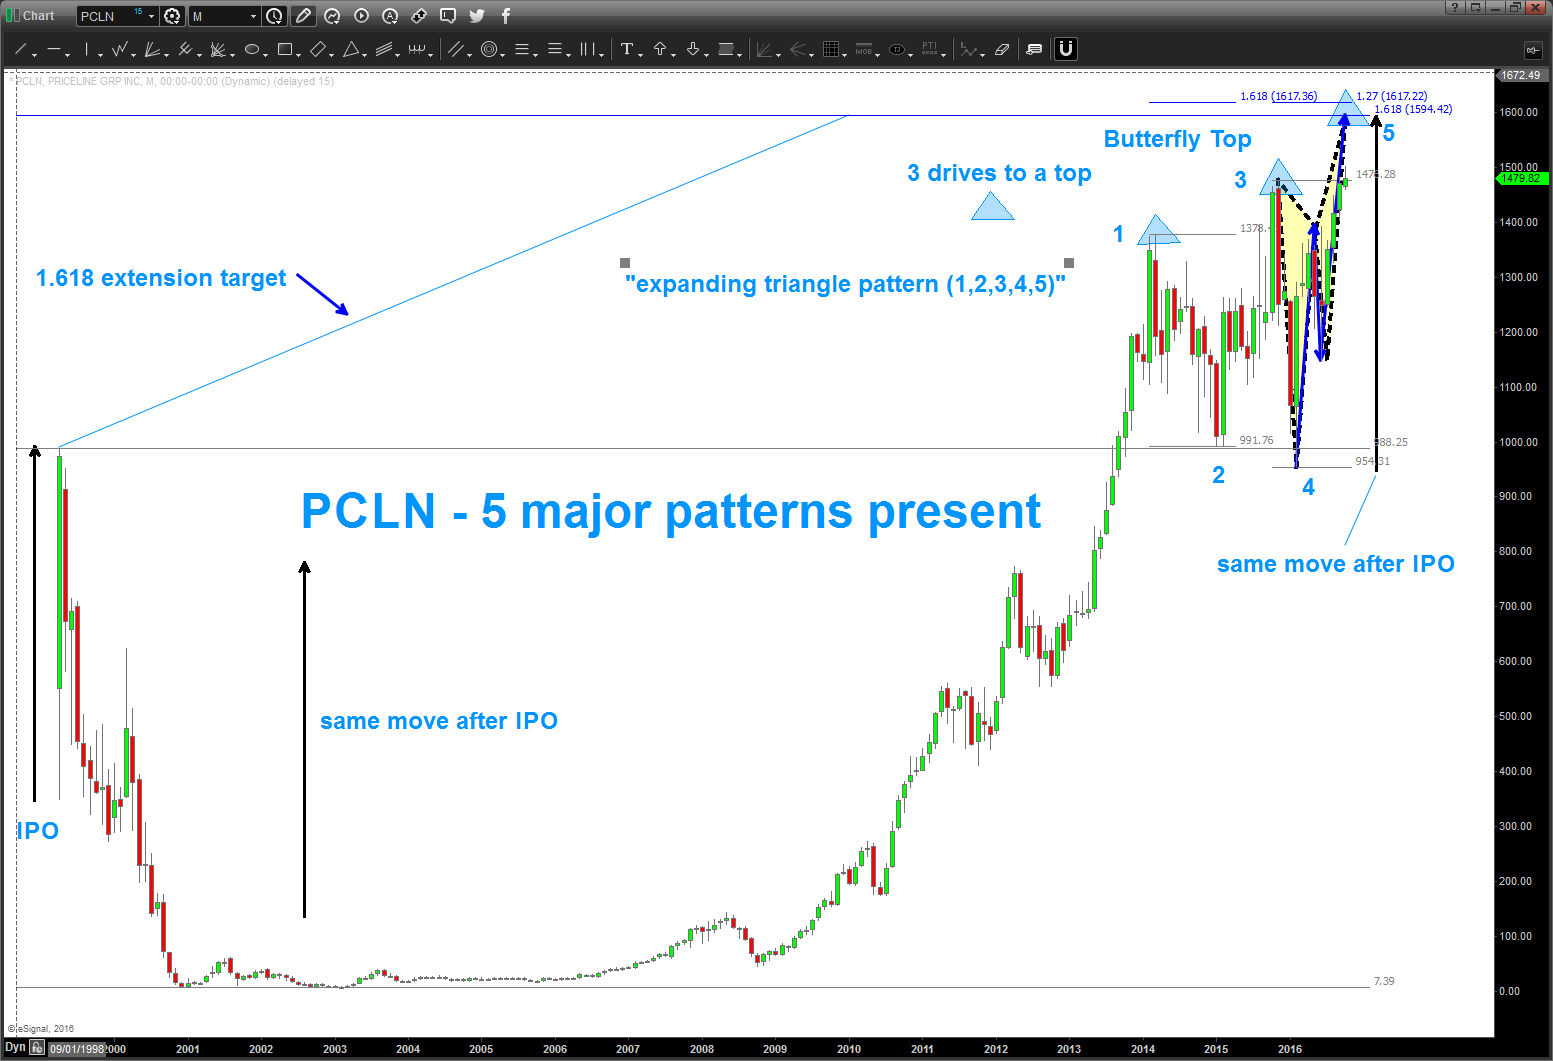
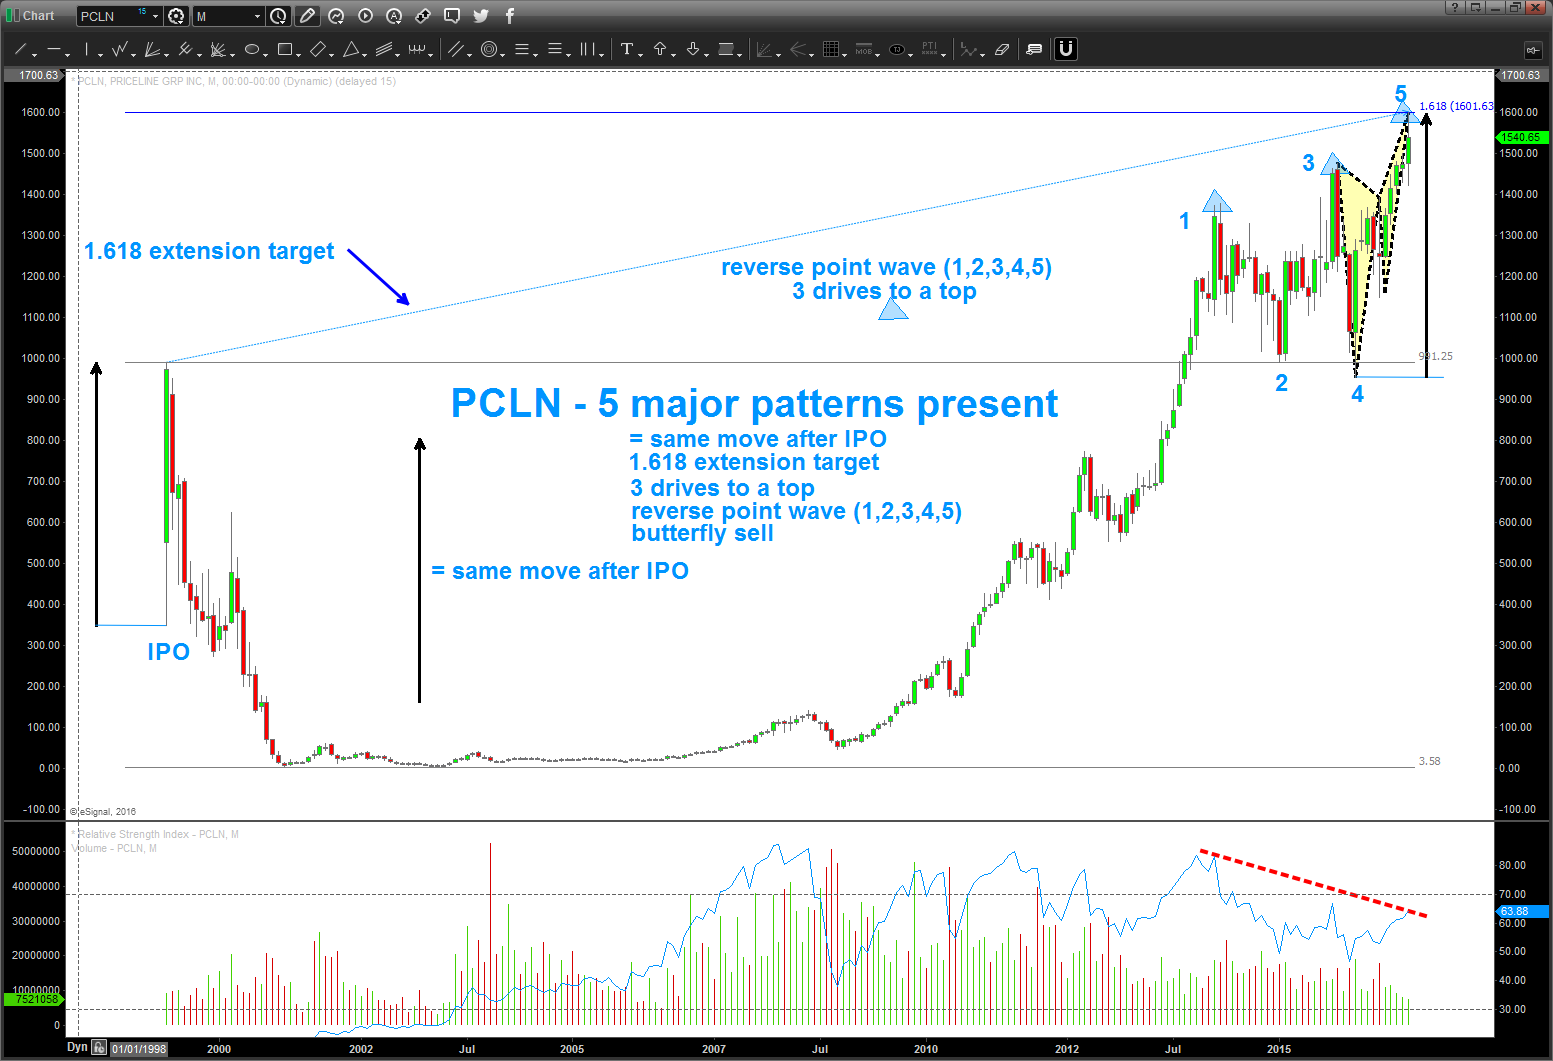
here’s the patterns present:
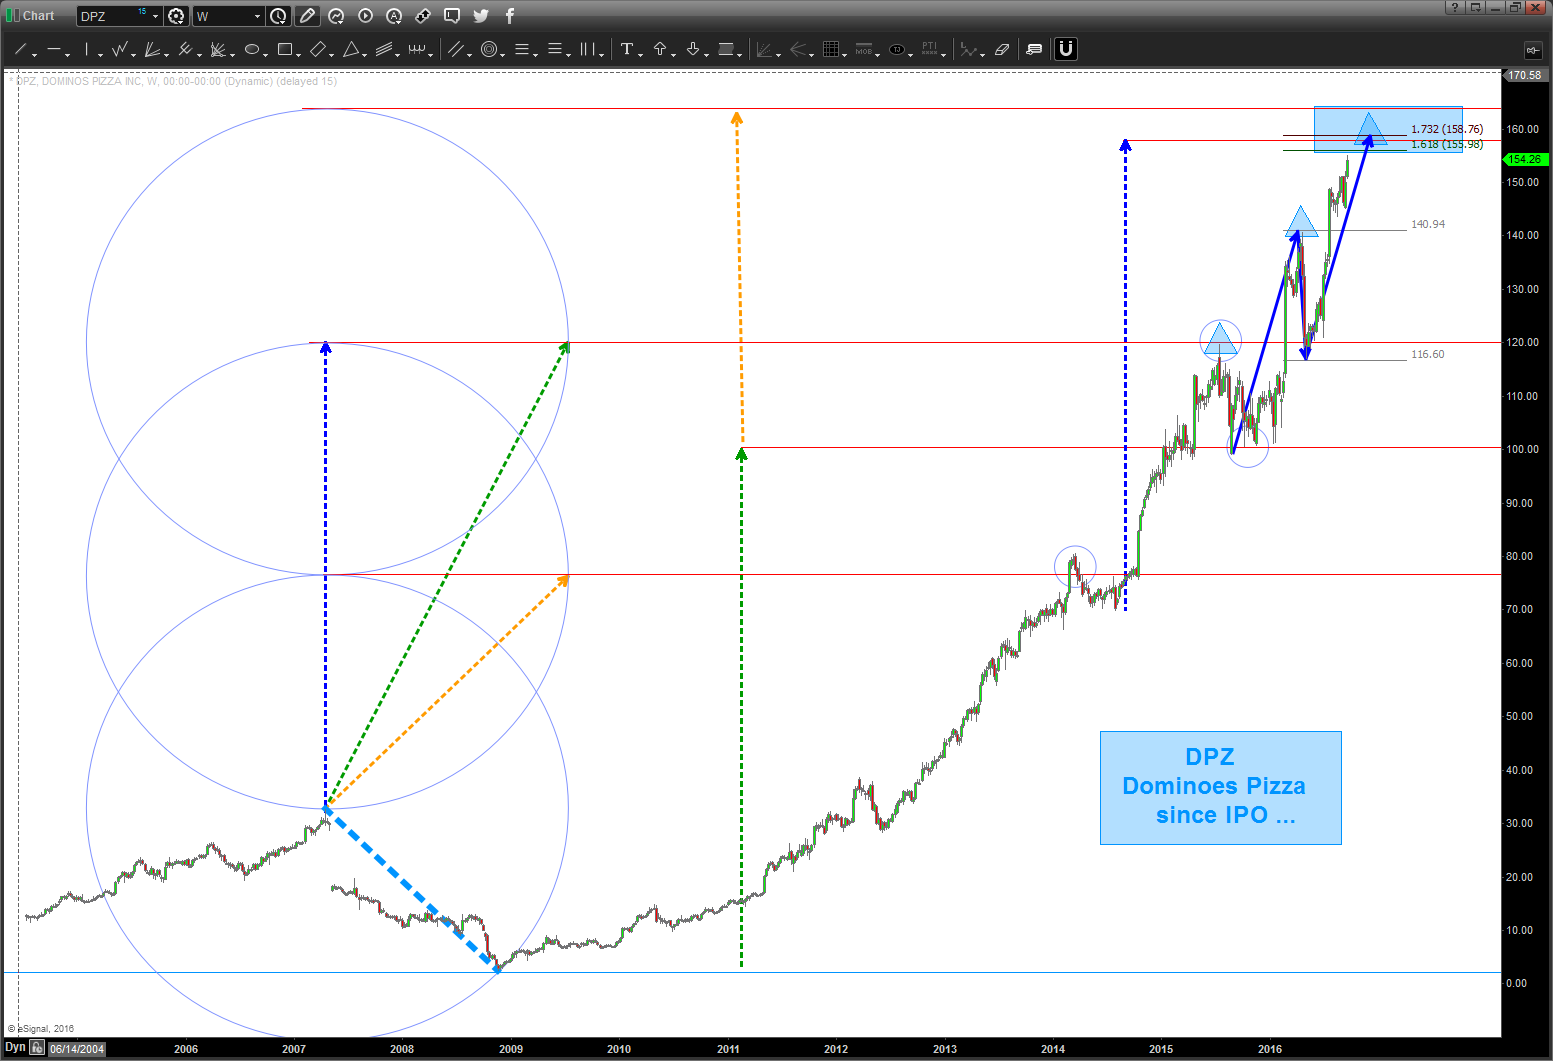
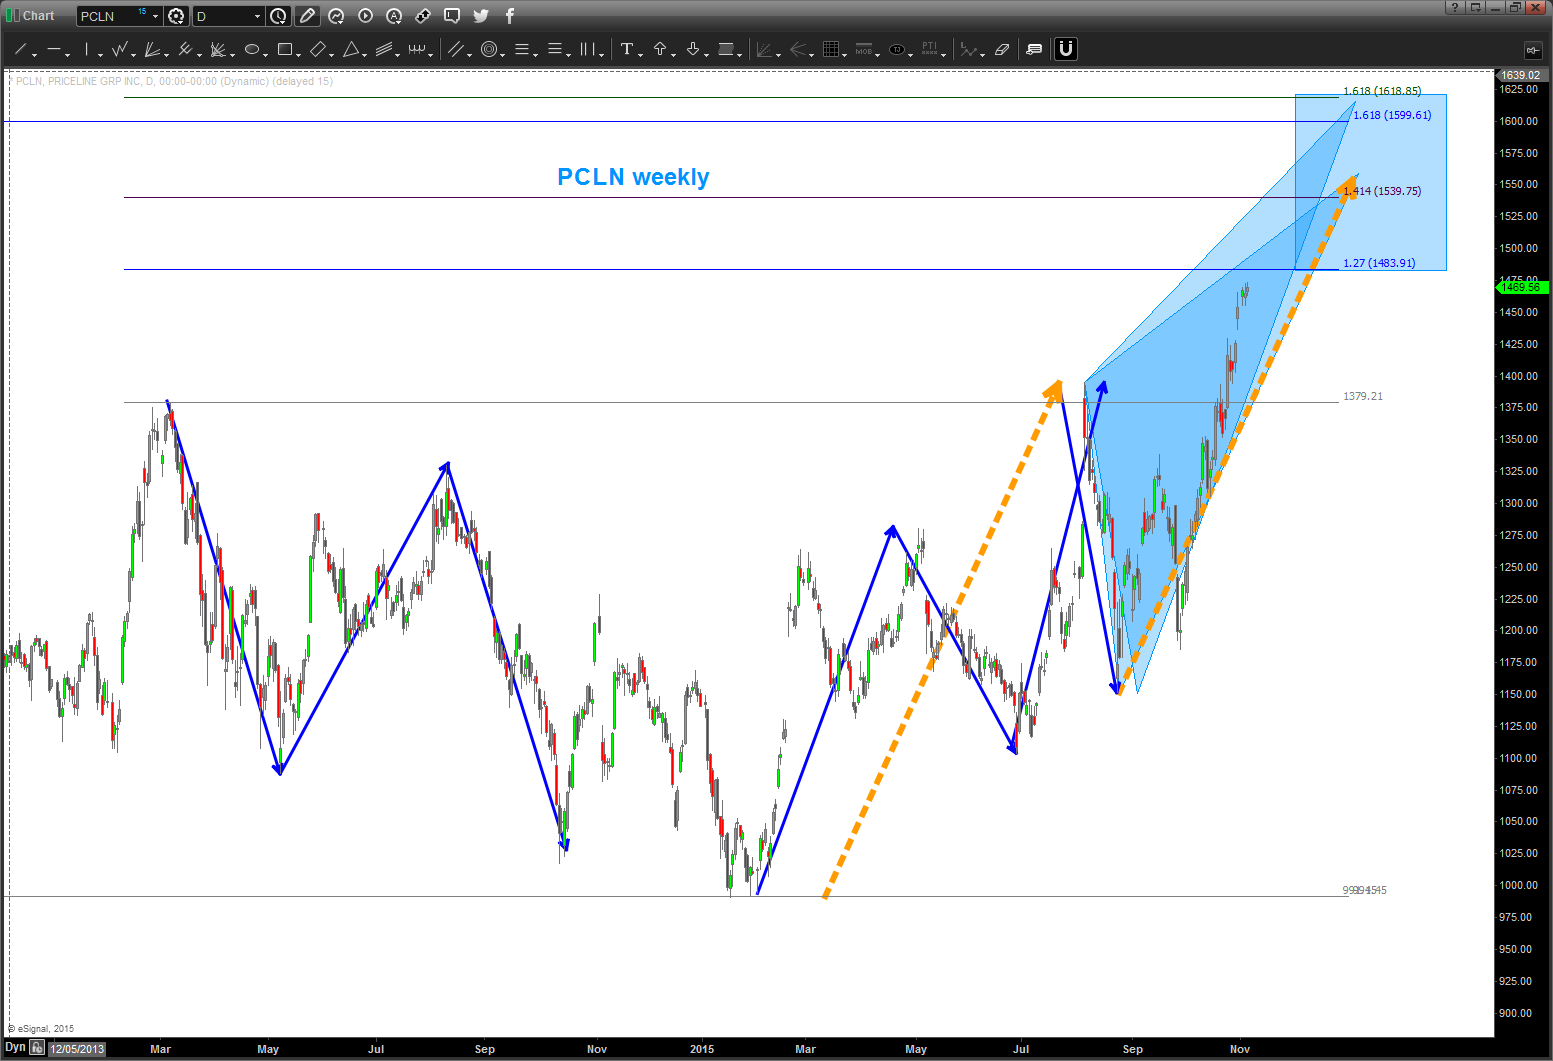
- 1.1618 extension from the IPO high
- note the black arrow going up from the post IPO low to the IPO high. That same “move” is present into the target area. the black arrow is “copy” and “pasted” from the IPO to current market prices.
- 3 drive to a top – the blue triangles
- 1,2,3,4,5 reverse point wave
- a “perfect” Butterfly Sell pattern – (it has an AB=CD present in the last leg of the Butterfly)
who knows if it will get that high right now .. but certainly realize that 1600-1625 has a TON of resistance.
B
02/01/2016
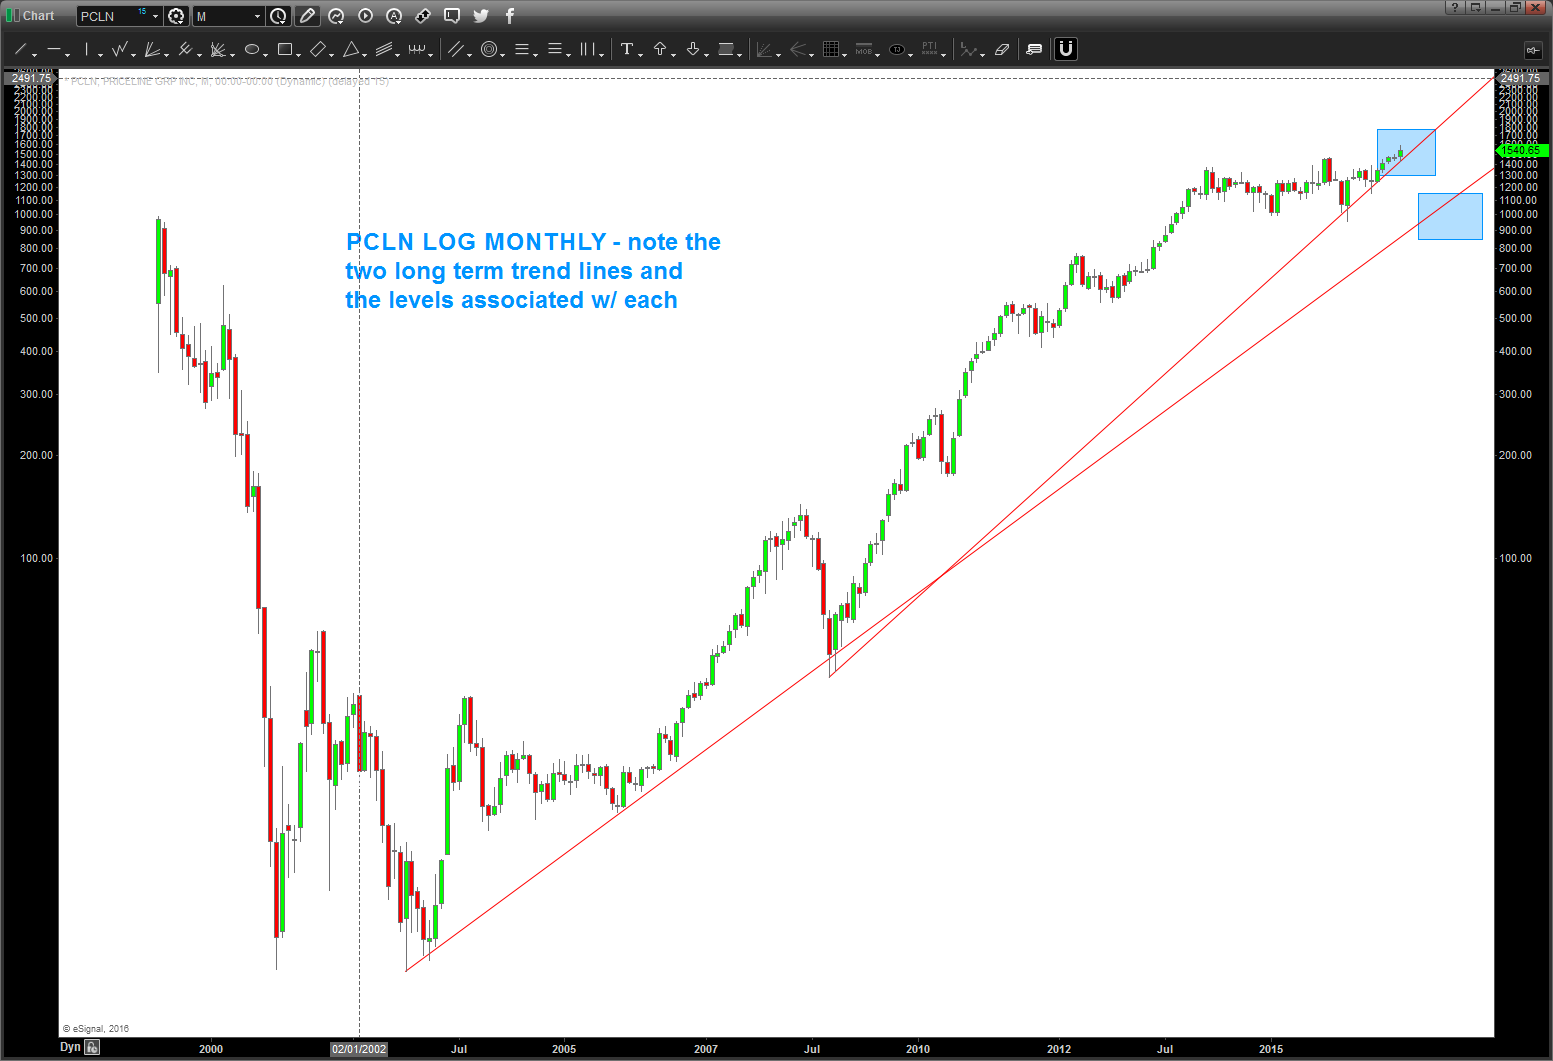
as you can see below, the light blue trend line below was taken out. now we are approaching major support as shown by the polarity principle. some bid thrust/candles going into this level so this will be a key test in the coming days/weeks. if we lose this level, then expect 1.27 level to be attacked in the high 800’s.

12/20/2015: update to PCLN.
one can see that this has been an amazing rocket ship.
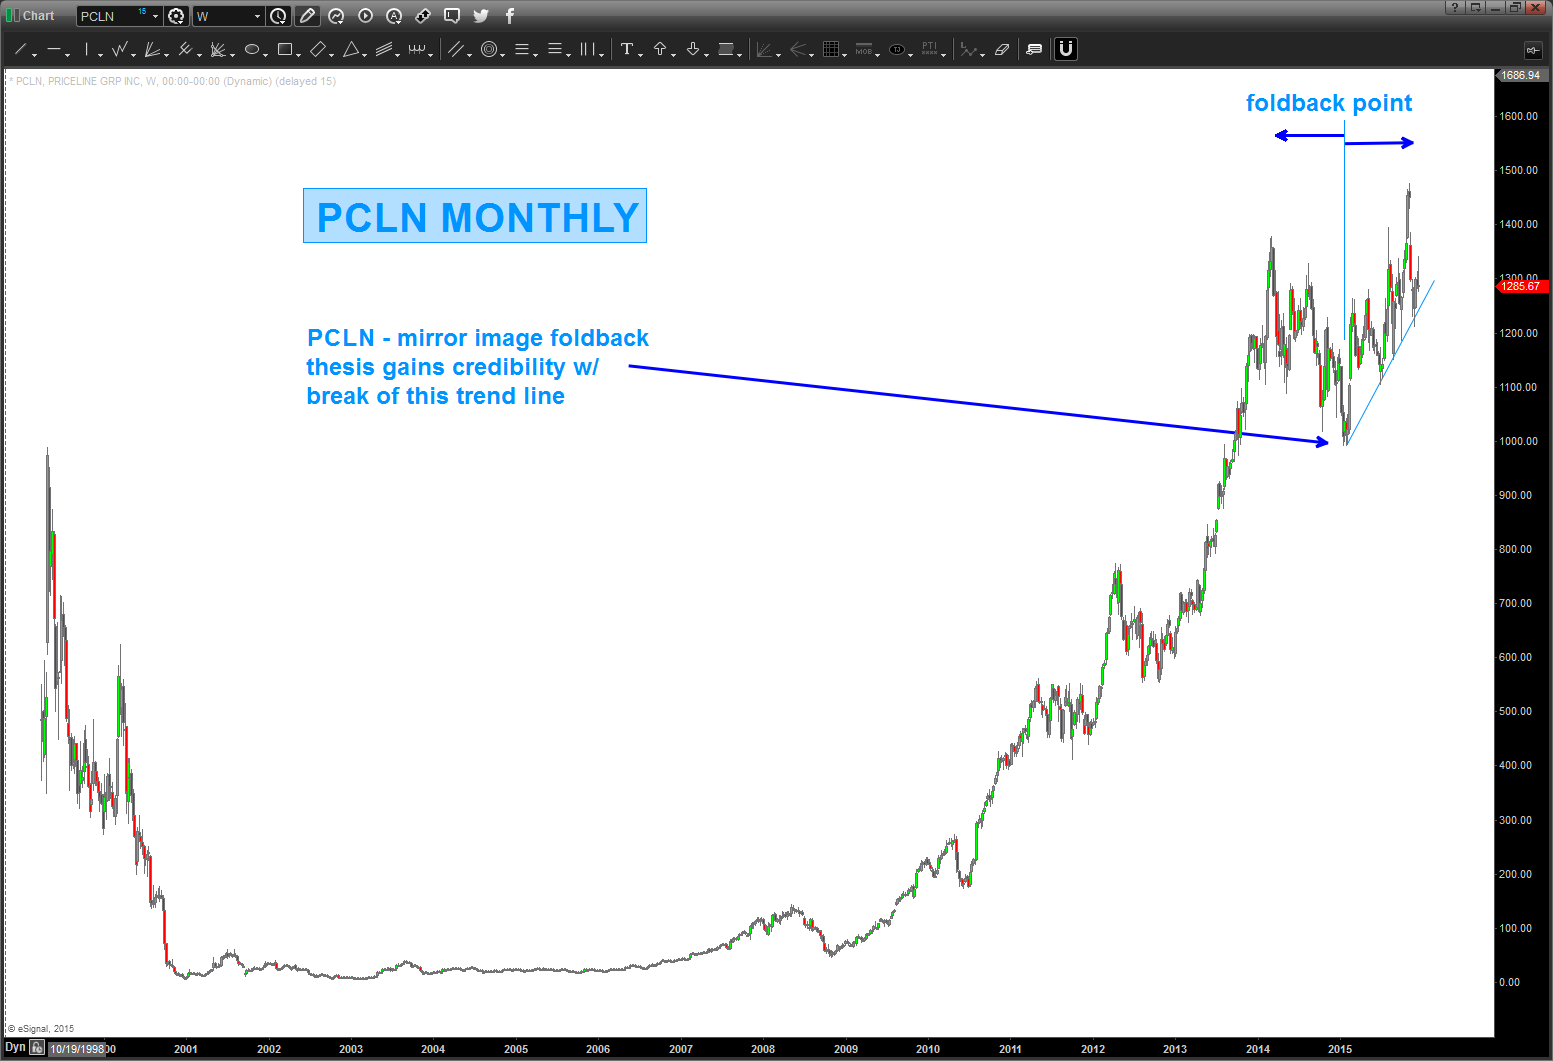
one can also see below that I was “seeing” a top coming in and tried the mirror image foldback, which from a price perspective DID NOT work. then, you can see that I was “seeing” a butterfly pattern and that missed the target area by a few bucks.
so, in summary, let’s watch the key low to high trend line shown in the chart below. also note the TIME symmetry around the foldback points. I missed that below, but that actually lends some credence to a potential big top.
this one has been tough .. but, then again, when you go from 3 dollars to 1450+ it’s going to take some time to digest.
anyway, for those who asked me, hope this helps w/ the gameplan for $PCLN.
Folks, this mirror image got smoked. Much like the mirror image for Natural Gas … the mirror images fail at the inflection points and $PCLN has rolled thru the pattern. ERASE … ERASE…ERASE.
Where are we now?
Well, if we look at the candles you’ll see the 2nd largest monthly candle since the IPO occurred last month (OCT) So, we have 1484 coming in but it sure looks like momentum and thrust will carry it to the 1600 level. I’m going to spend some time on this one over the next couple days …
here’s the MONTHLY picture …
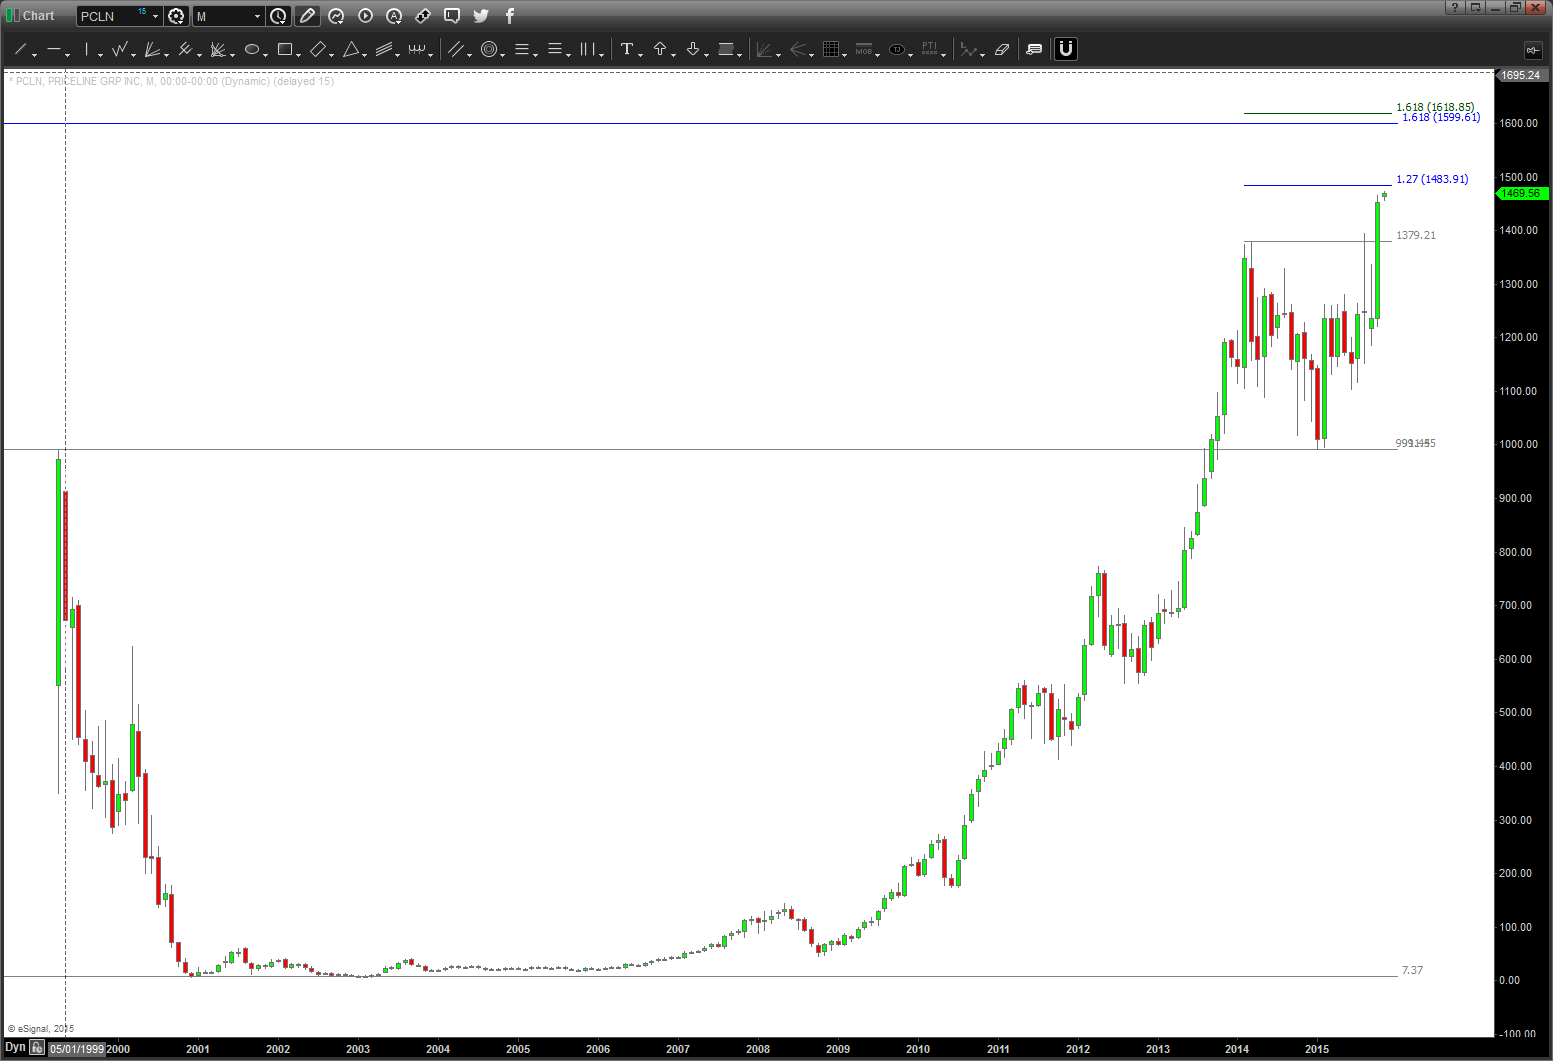
IF the mirror image foldback is in play THEN this pattern needs to hold and start down. a move below 1360 would bolster conviction that the mirror image mentioned earlier is in play.
update on TLT and Bonds over @seeitmarket updated
Posted on January 21, 2017 Leave a Comment
1/21/2017 – would really like this to start back up again into the areas highlighted. could be the trade of the year …

sent to this to Andy and the gang over the weekend …let me know if you have any questions.
Bart
$NFLX another short swing at the bat? Perhaps?
Posted on January 21, 2017 Leave a Comment
1/12/2017 – well if at first you don’t succeed, try again. doesn’t matter this its NFLX, in the world I live in, it’s just a ‘chart’ so here we are at it again …
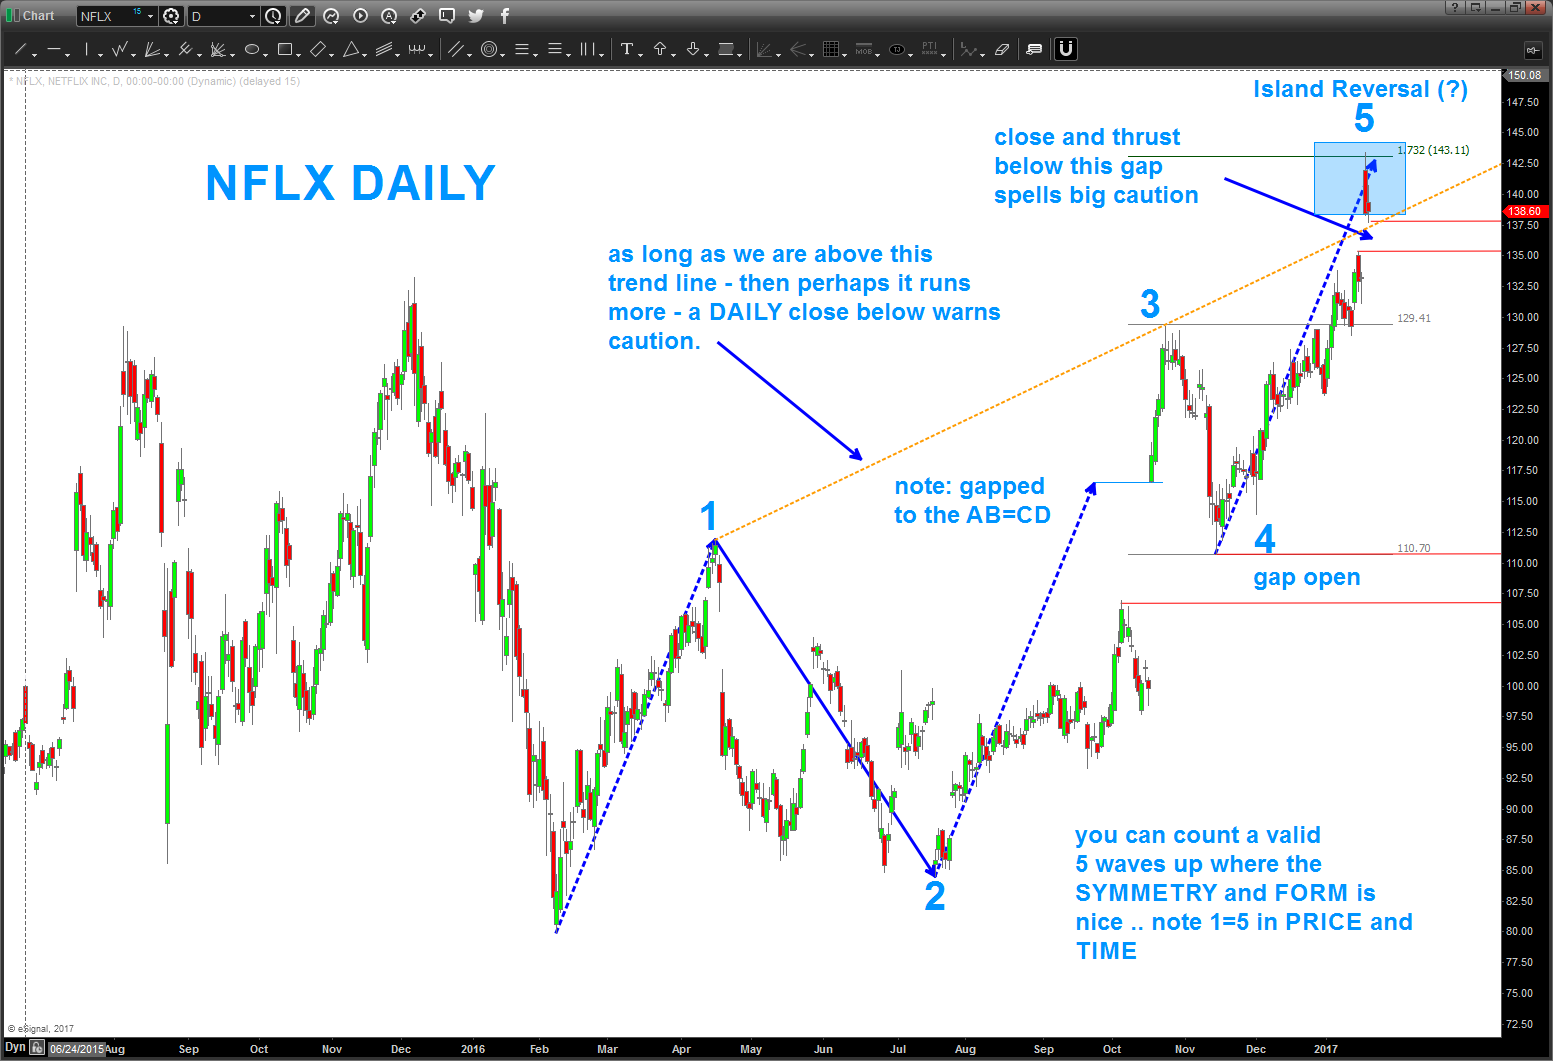
well, the GAP from the former congestion area into new highs was powerful BUT note that we have been selling off since the gap and IF (the big if folks) we close back below the dashed orange trend line AND close the open gap (a gap down back below is ‘technically’ the island reversal THEN guess what things could get going to the downside. so use those levels noted below as your guide.
some key stuff:
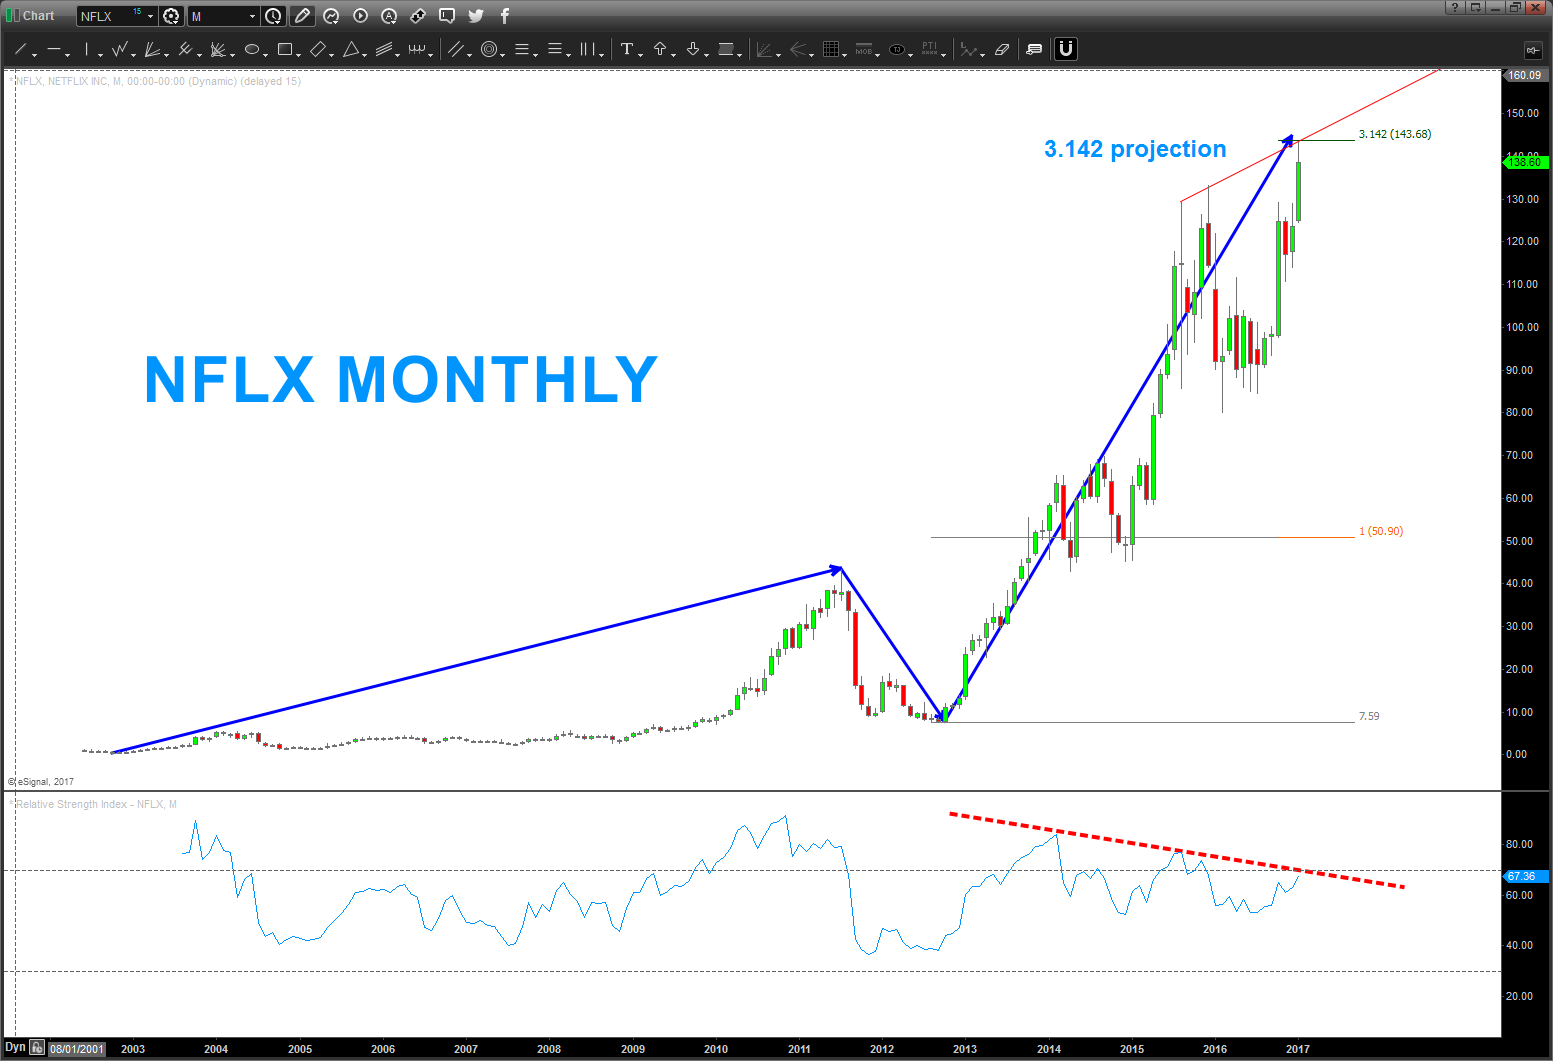
- note the monthly
- that’s some pretty large bearish divergence
- also note, from the first move up way back when it ‘perfectly’ hit the 3.142 (PI) projection
- also note the top trend line … a daily close above that is VERY bullish but right now, banged right into it as resistance
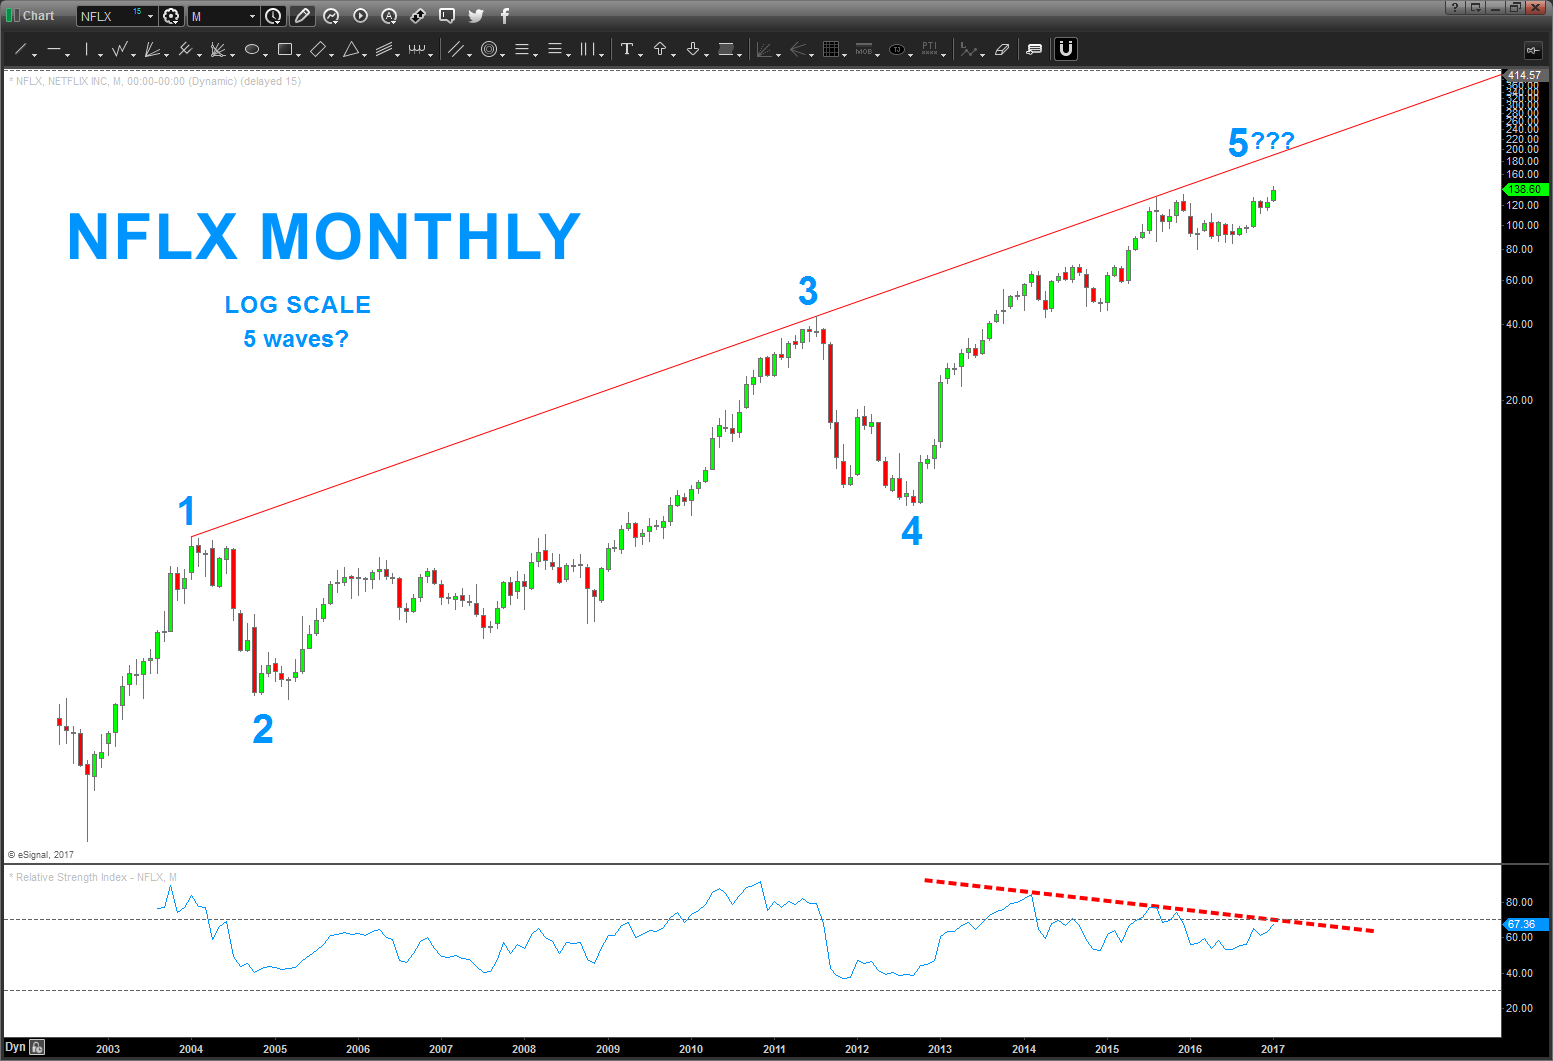
- note the monthly ‘log’ chart
- the top trend line held price at bay (that caused the consolidation IMHO) but if we keep going that top trend line would be the next logical target
- note the daily
- see the orange dotted trendline … that’s the one to really watch for now
- I REALLY like that wave 1 up and wave 5 up are equal in PRICE and TIME
- note how wave 3 gapped rigth up to the AB=CD where wave 1=3 and then ran ….
- REALLY pay attention to the gap that was left a couple days ago – that’s the one which, if gapped down below will cause the island reversal
perhaps NFLX will kick my butt again … we’ll see.
cheers!
B
if you look thru or have been reading my blog you’ll realize that the patterns do fail .. invariably when this occurs I’ll go back to the drawing board and come up w/ another PATTERN. check out WYNN … you never know what’s going to happen and the PATTERNS do fail. manage the risk …
$NFLX has beaten me – alot. Uncle ….
https://bartscharts.com//?s=NFLX
that being said, I hit erase all on $NFLX chart and took a fresh look at it … I still see 5 waves up w/ no RULES broken so the count is valid and there’s monthly bearish divergence and we are about to tag the upper long term trend line that is roughly 10 years old. I still say be careful up here but .. again … UNCLE.
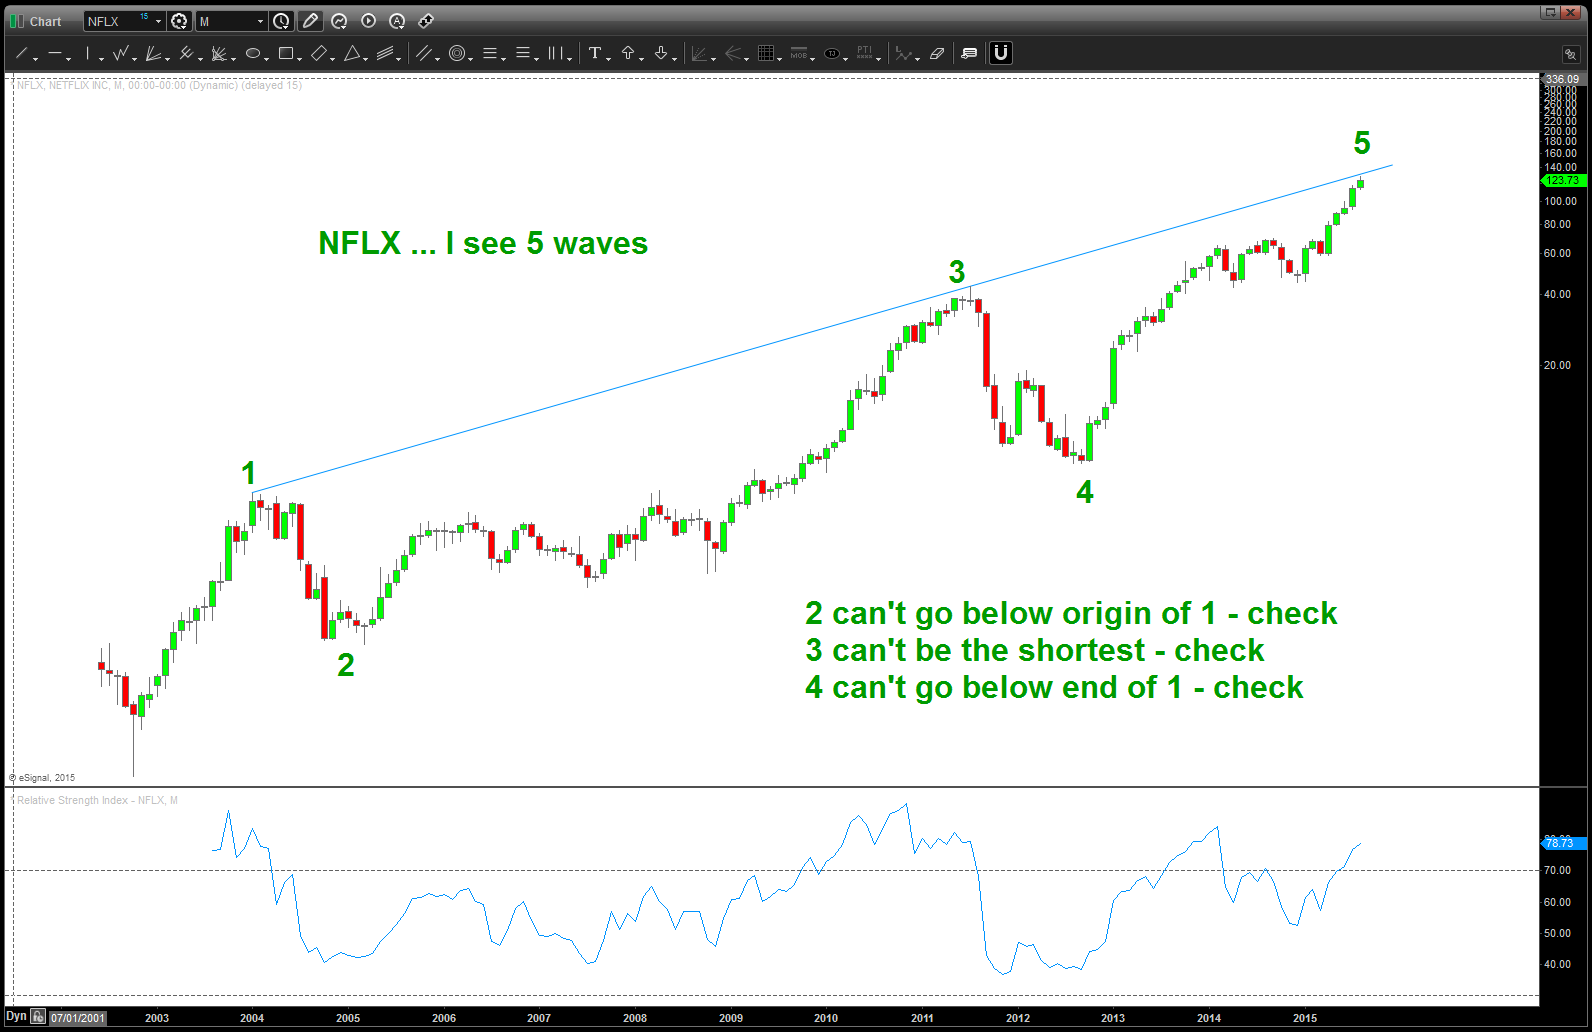
NFLX Monthly
but what’s the next pattern or set of target areas? No flipping idea …nope, not going to do it.
“f’it dude, let’s go bowling”
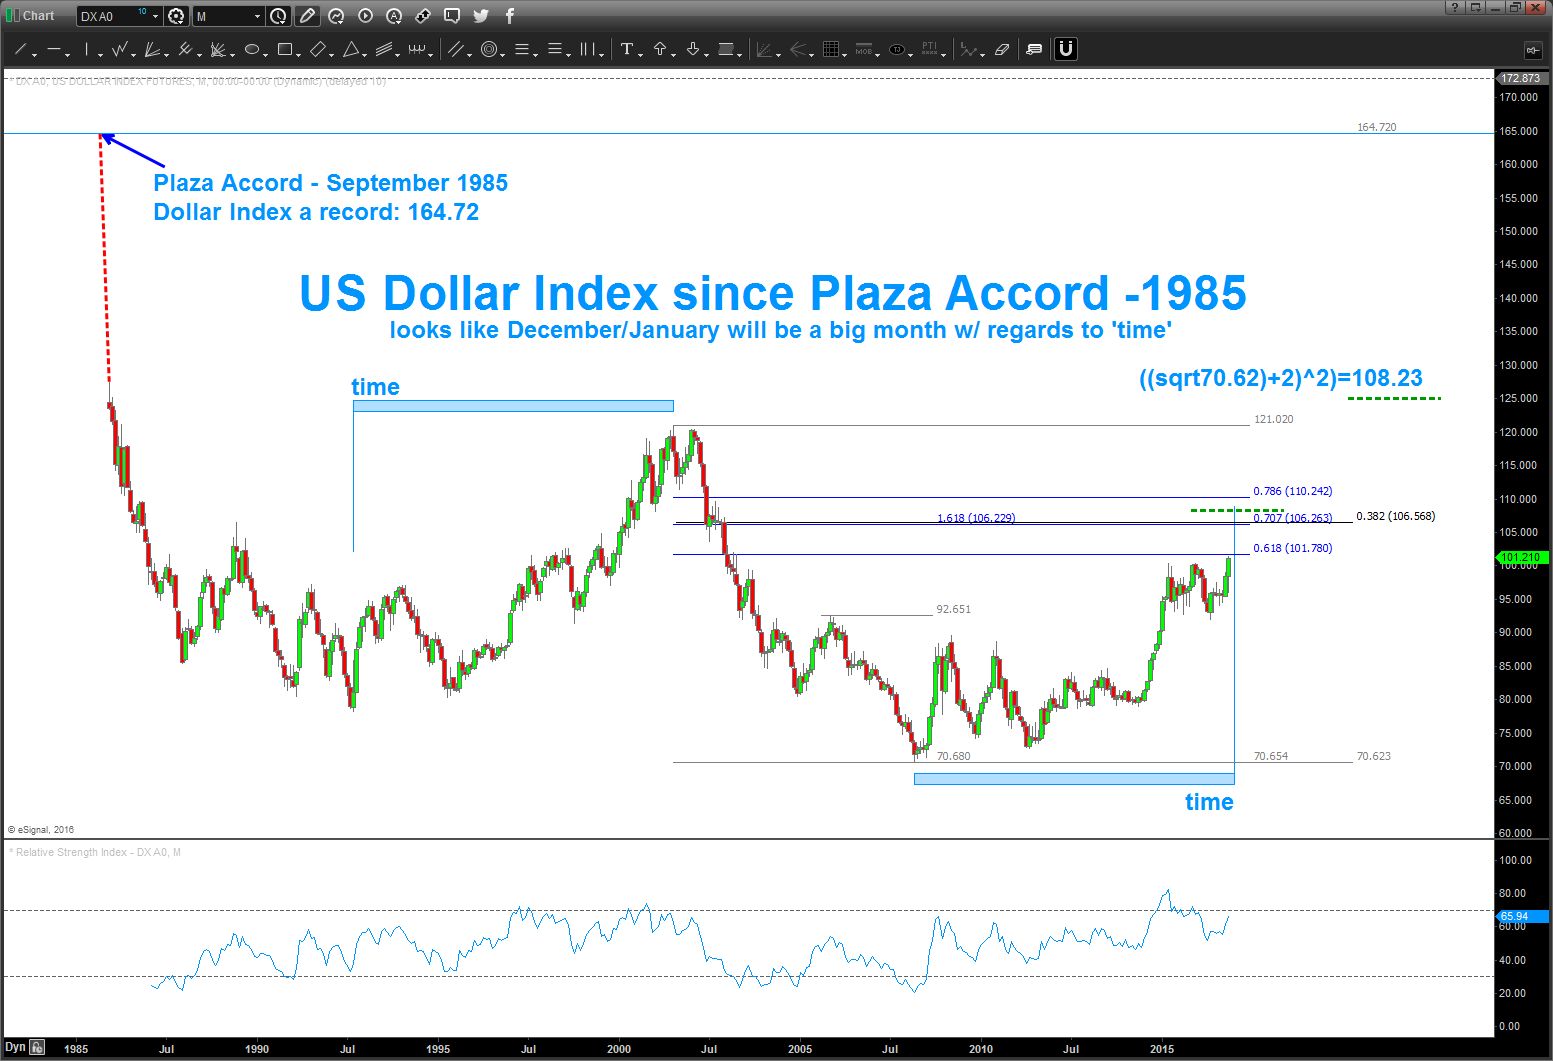
Dollar Index since the Plaza Accord …room to run, BUT (?) …UPDATED
Posted on January 15, 2017 Leave a Comment
1/14/2017 – if your into harmonics and patterns, then read below. If you just want the bottom line up font (BLUF) then read this: WAIT to do anything on the US Dollar.

Obviously, I’m “called” or “attracted” to a movie like this because of the amazing synchronicity to ‘string theory’ and ‘time’ … so if I really want to go ‘deep’, so to speak, I will play a soundtrack like this w/ only this music in the background and a chart …
what’s most important .. ? where are we now ..,
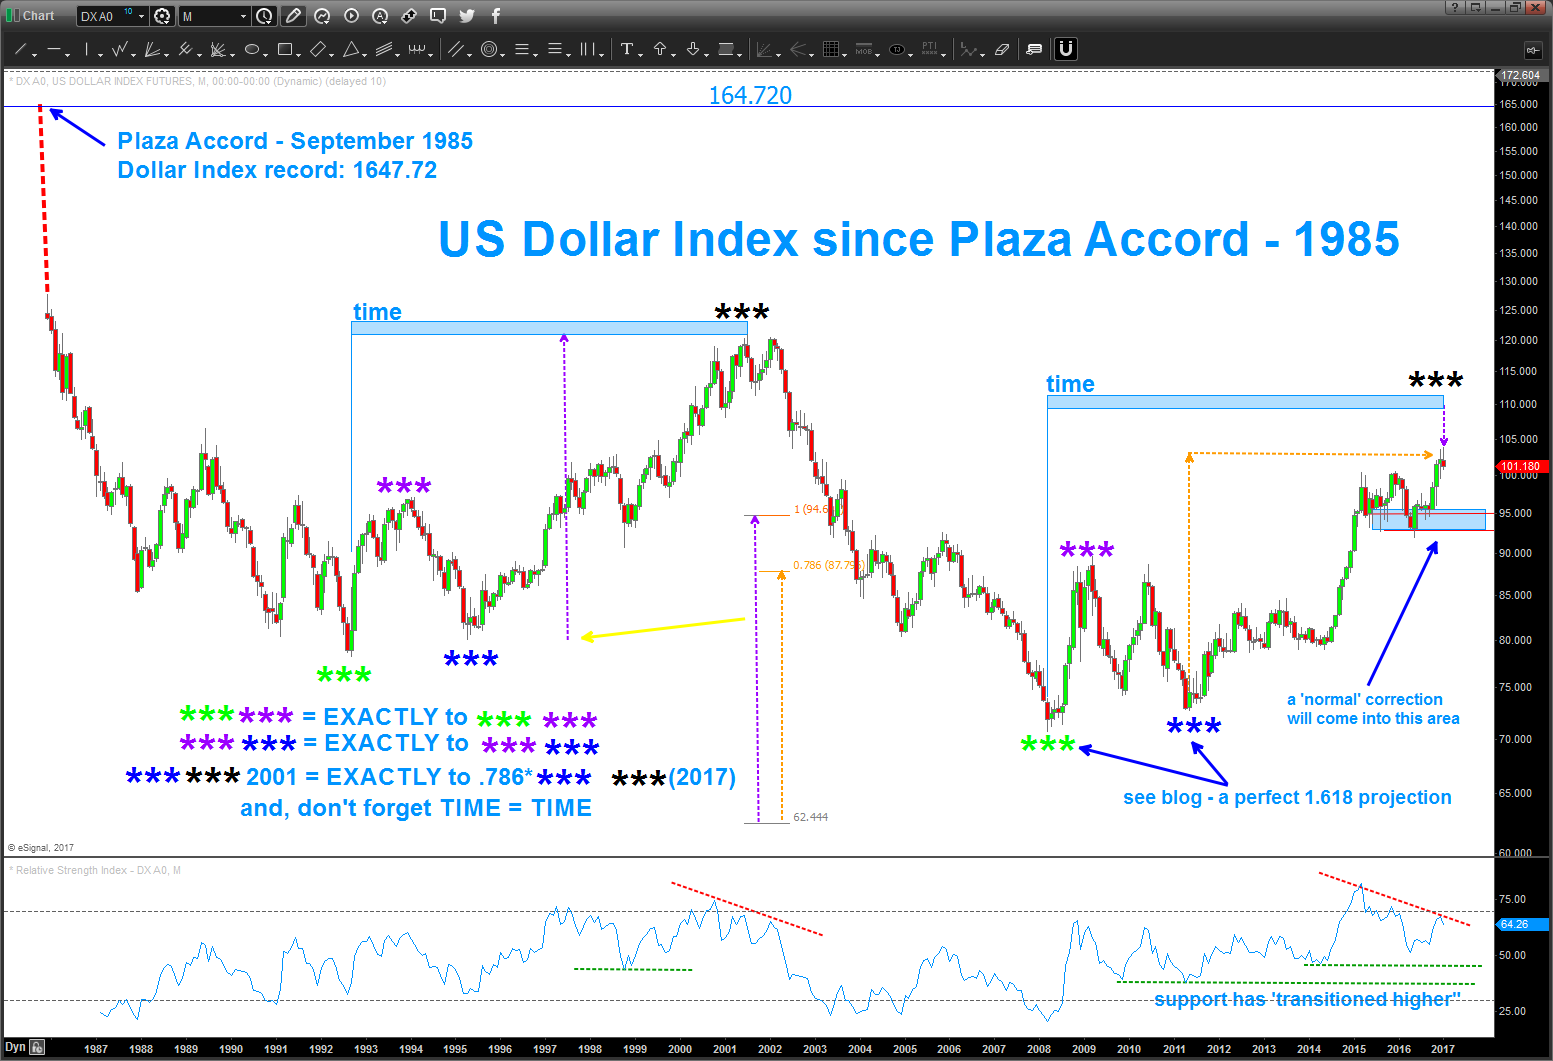
- there is BEARISH RSI divergence on the monthly
- the TIME component (a big deal) is EXACTLY equal to the last major rally in the index since the Plaza Accord
- the most recent high is a 1.1618 projection and EXACTLY .786 the rally from 1995-2201 – EXACTLY
- we have RECORD NEGATIVE/BEARISH sentiment for the EURO (a major component of the index)
- see blog and note the cycles on the POUND and the AUSSIE and LOONIE
- note: the RSI ‘transition’ to higher support zones … that’s bullish
So, UNFORTUNATELY, my friend we need to WAIT and IF (the big IF ) every thing is to come together then we should see support come in around 92-95 to get long on the dollar.
Bart
PS – you read it here … I’m REALLY ‘believing’ (not supposed to do that) that the $$$ will find support in/around the areas sighted below. BUT .. if you try and SEE the picture that’s painted .. this COULD BE A MONSTROUS $$$ TOP. How will we know …. no flipping idea. You guys/gals tell me ….
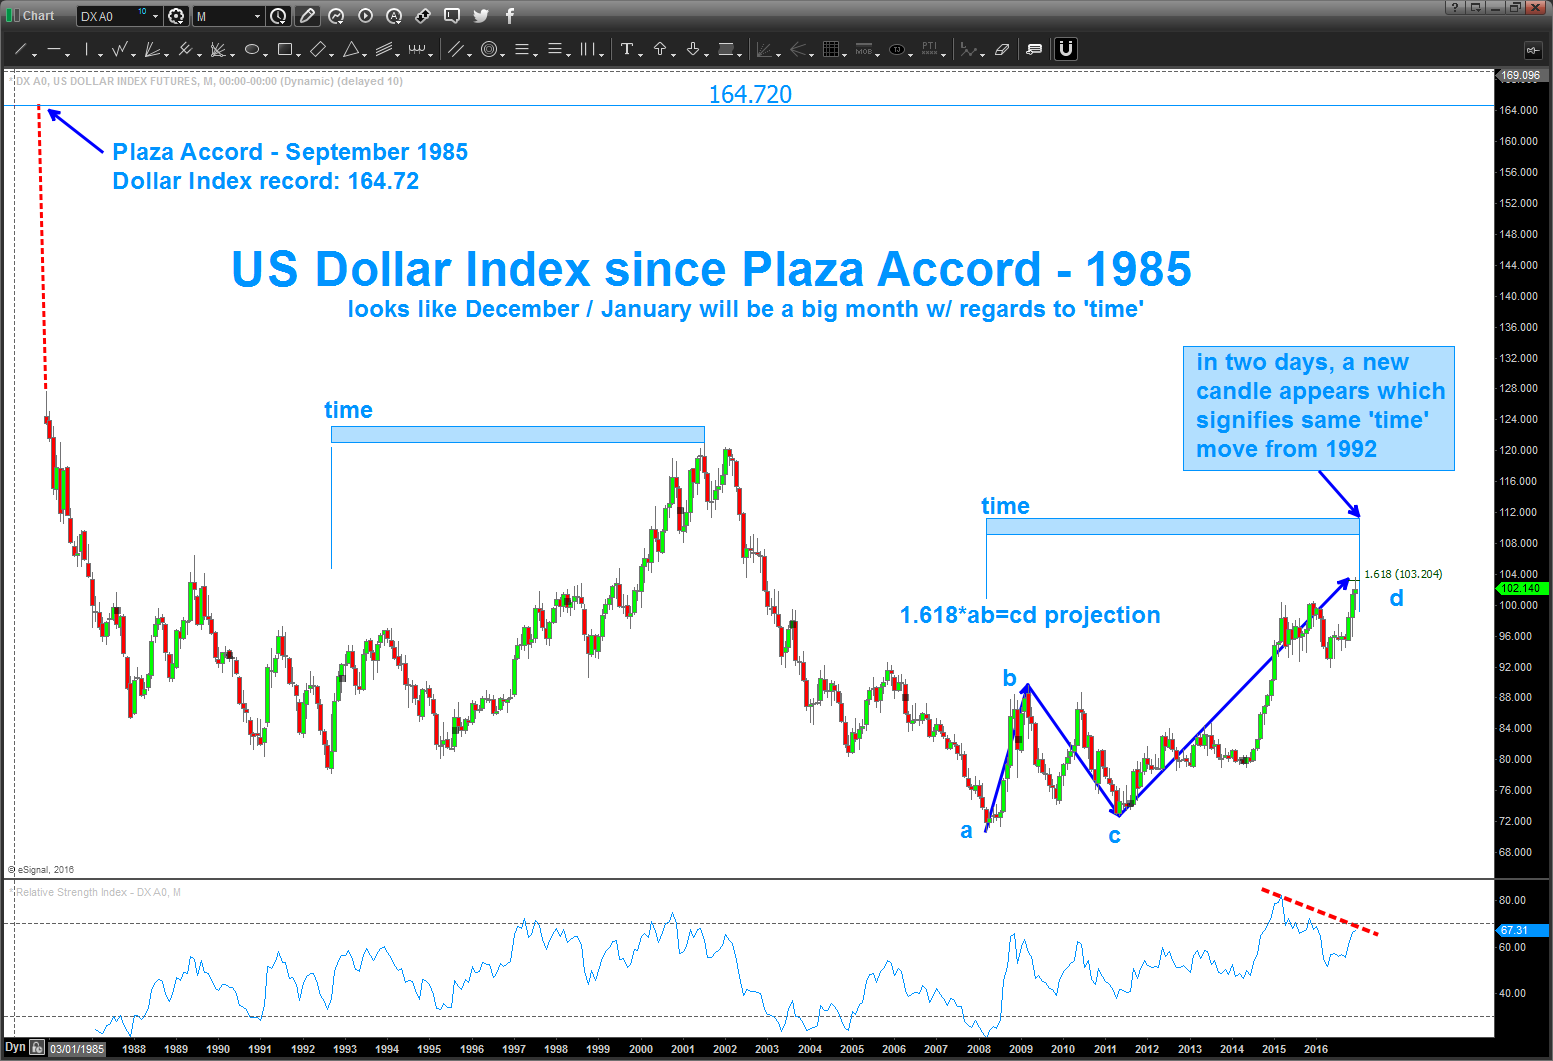
12/30/2016 – updating the US Dollar Index post
- bearish divergence – check
- 1.618 price projection hit – is this an a-b-c correction and the dollar has peaked? Potentially … or is wave 3 of 5 concluding w/ a pull back imminent?
- SENTIMENT is extreme bearish for the EURO and GOLD
- note – we are hitting the same TIME correction in a couple days as the move up from 1992-2001
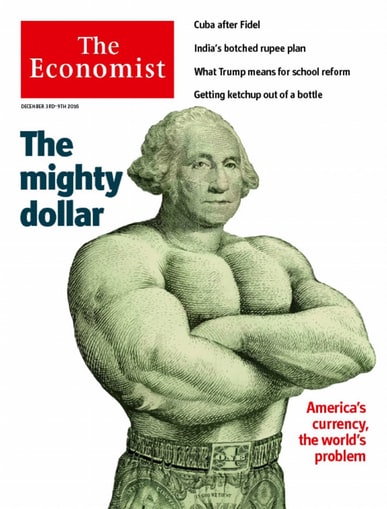
- Economist .. the best contrarian indicator out there.
CLIFF NOTES: if you read below you’ll see there are other targets higher. We are approaching the same TIME as the last move up in the dollar against the smash from the Plaza accord so the ‘no brainer’ long dollar trade is one that begs of caution. Is this THE top in the USD and now we go back below 70? Don’t know, but a preponderance of evidence suggests STIFF resistance from now into January for the USD.
11/19/2016 – if you want to follow the Dollar posts, just search dollar on the top right area of the blog. the overall thesis, which has proven to be correct so far, was the dollar was going to strengthen all the way from the low 70’s. it’s been a nice run …
is there higher to go … yes.
but then …
here’s the picture – note, I’ve used the high from the Plaza Accord in 1985 to put the .382 retracement on the chart. That also overlaps w/ some nice other extension and retracement ratios. Believe the highlighted area in/around 107-108 is going to be key.
also, note the TIME component between the last major rally from 1992-2001. Next month, or, depending on how you draw the time component, perhaps January the Dollar Index should run into some pretty stiff resistance in TIME.
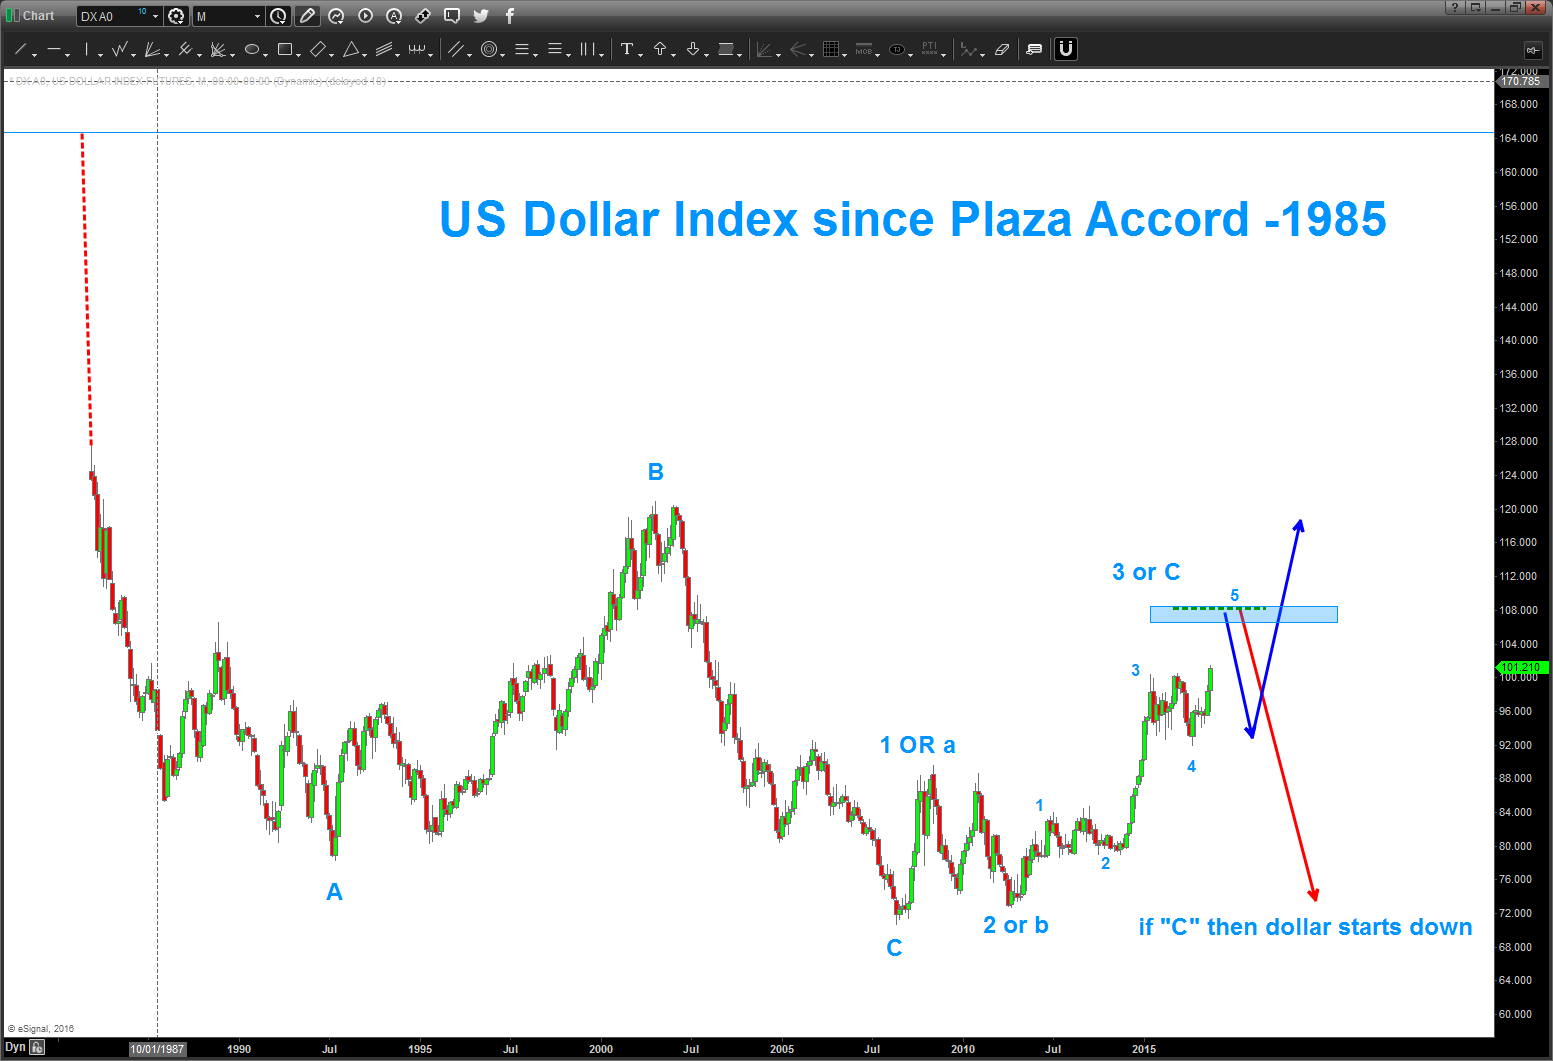
last thing is the Elliott Wave count … I always tell people – I LOVE Elliott wave – when it works. here, the count has been pretty much a “Ray Charles count” on a long term basis. I’ll try to walk you thru the importance:
- market corrects in 3 waves labeled a-b-c
- the market moves impulsively in 5 waves
- wave 2 can’t overlap the beginning of wave 1
- wave 3 can’t be the shortest
- wave 4 can’t overlap the beginning of wave 1
- if you take the low in 2008 and start working your way up we see that we are ‘clearly’ creating 3 waves into yesterdays price action.
- here’s where it gets tricky .. simply, I don’t know if this an a-b-c big corrective move OR we are impulsively going higher in a 1-2-3-4-5 sequence.
- the key here – wave c (of a-b-c) always has to be 5 waves (unless in a triangle)
- so if you look you can see the ‘small’ 1,2,3,4,5 being carved out (Turkey reference) so the blue highlighted area 107-108 COULD be the end of a C wave and the entire A-B-C move OR the end of wave 3 and we correct 4 and then off we go again in 5.
I honestly have no idea ….
Here’s what the charts are SHOWING US:
- square root target
- the ‘time’ of the last corrective move
- the ‘count’ showing we are in the 5th wave of C and 3
- EXTREME sentiment for a strong dollar
- the .382 from the all time high
- divergence set up on Monthly RSI
- ‘other’ extension and retracement targets
Expect some major resistance .. again, we are 6 handles away from the target area and that represents HUGE moves in currency .. BUT remember, right now, we are at extreme (not historic) but extreme sentiment and this has never proven to be wrong from a contrarian indicator. This puppy could snap back on you really really quick.
only TIME will tell … let me know if you have any questions.
B
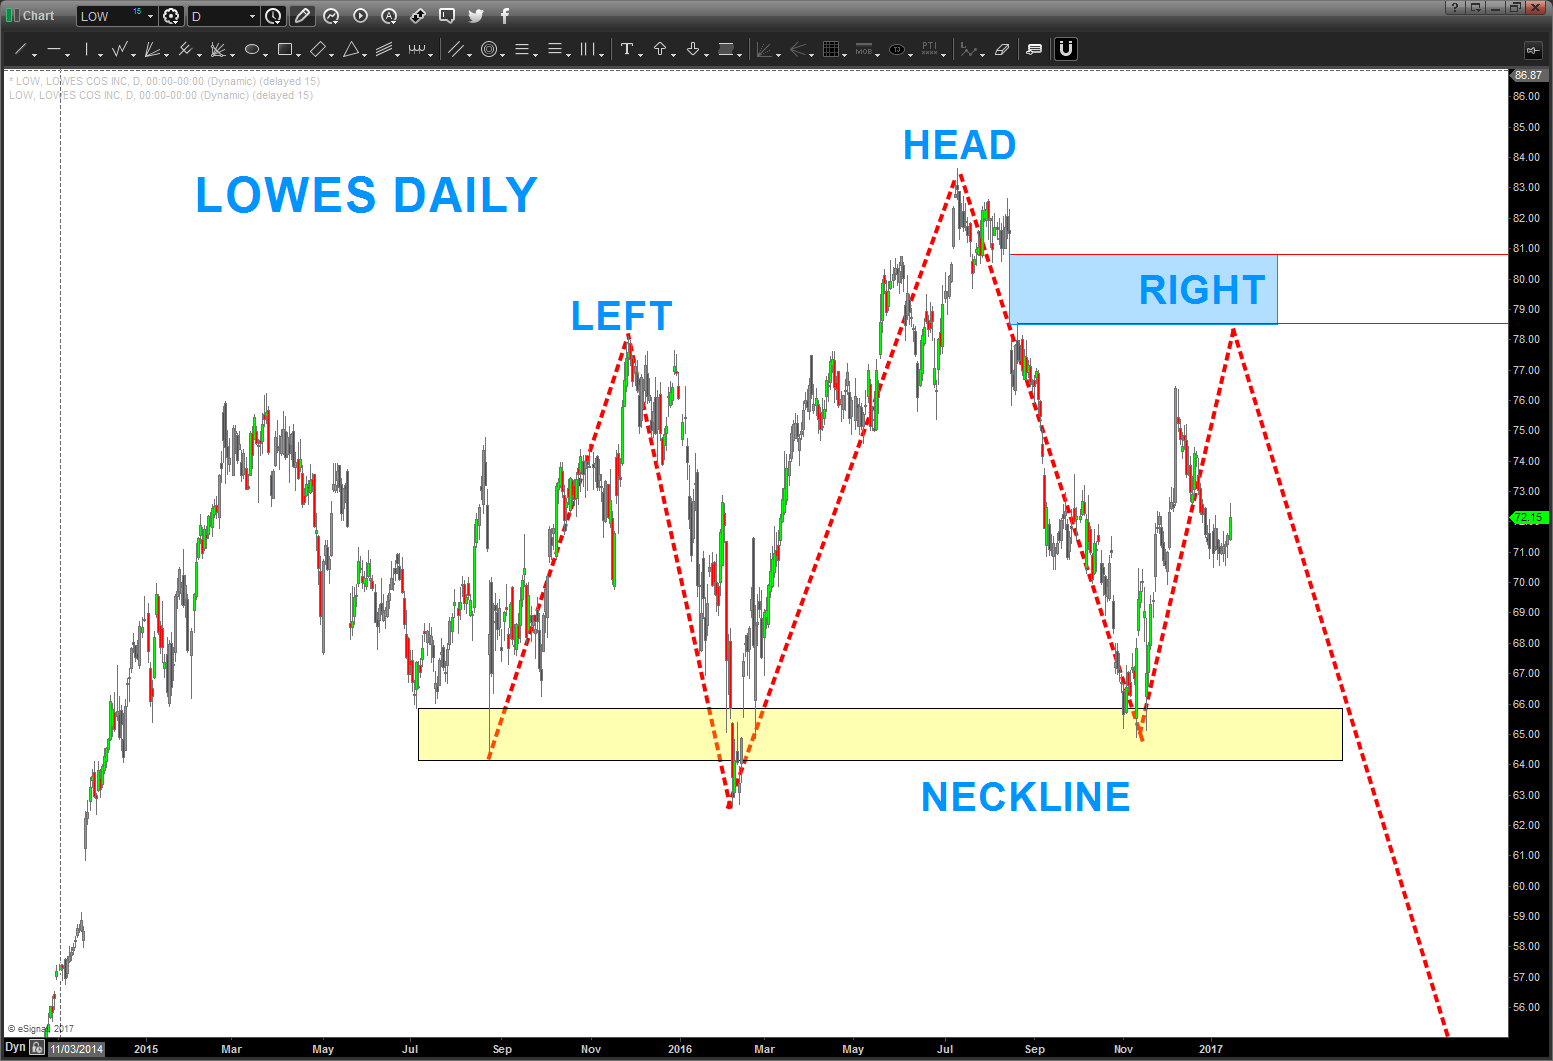
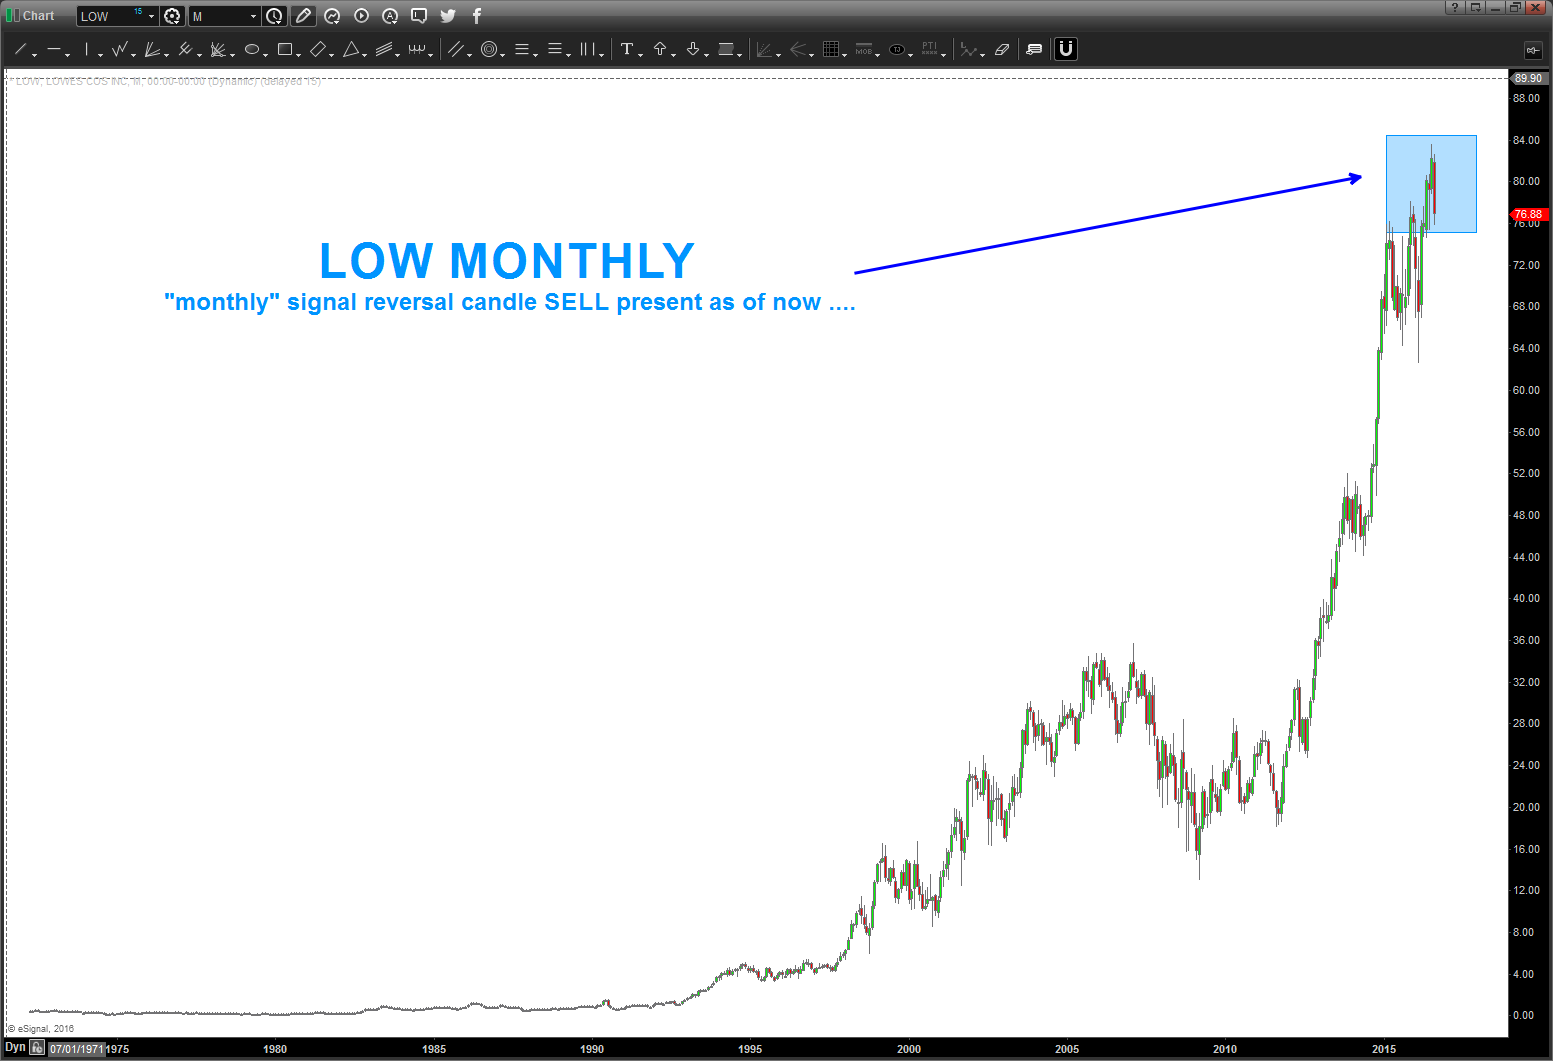
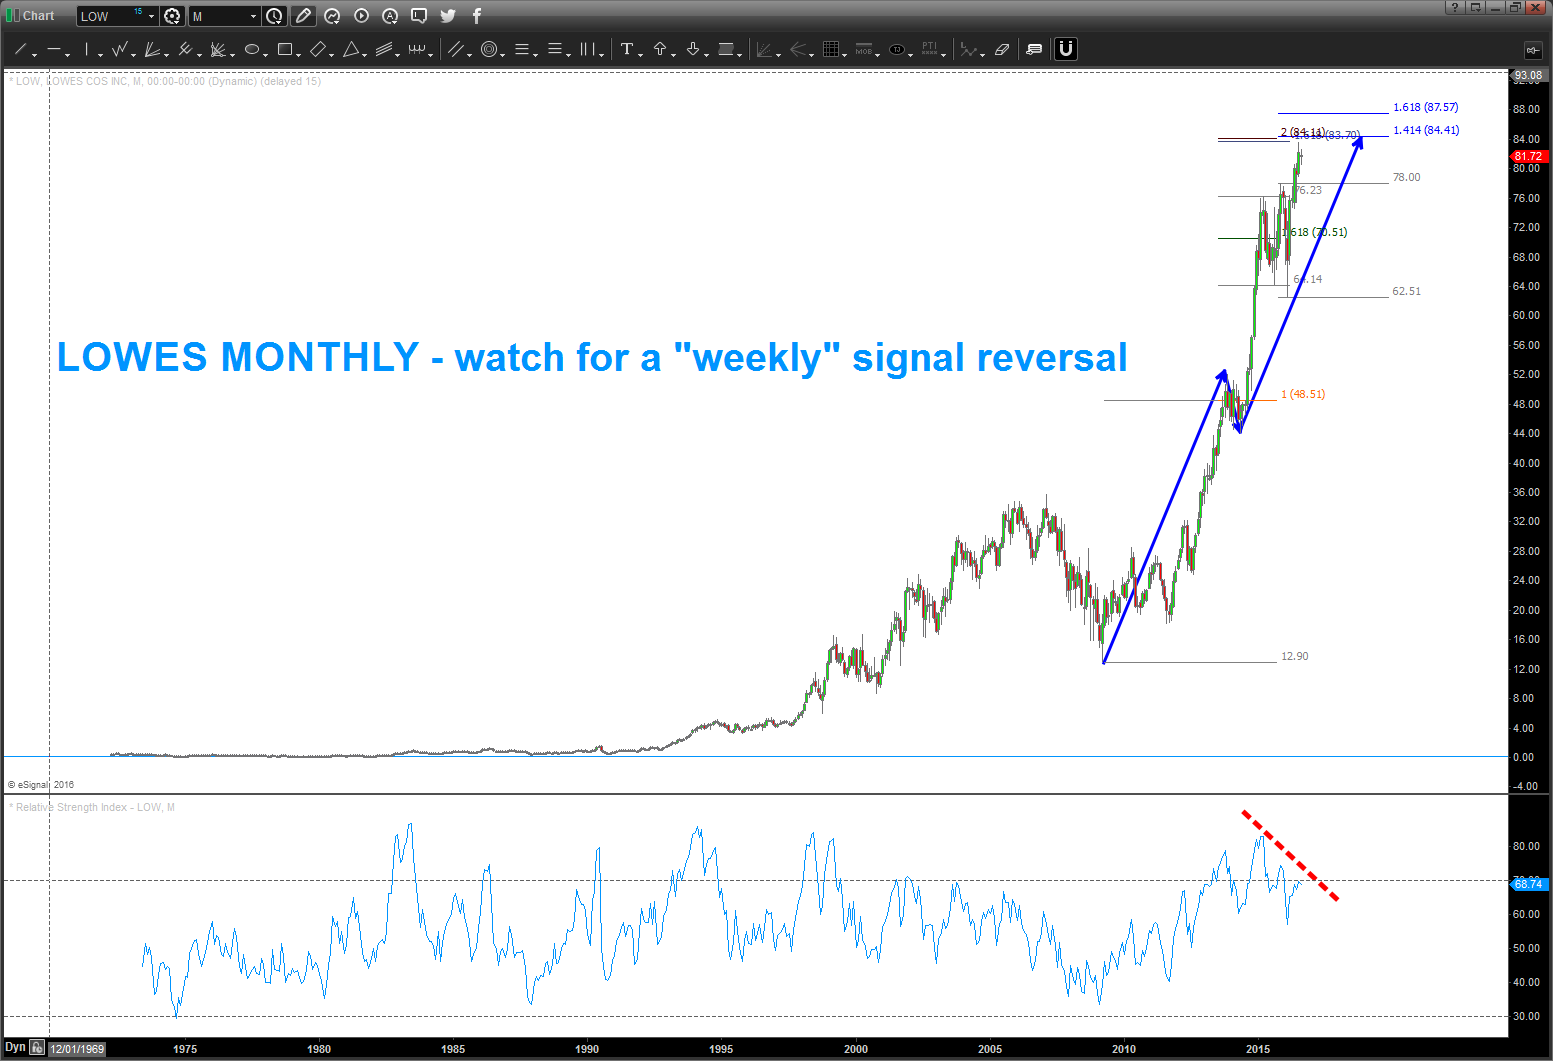
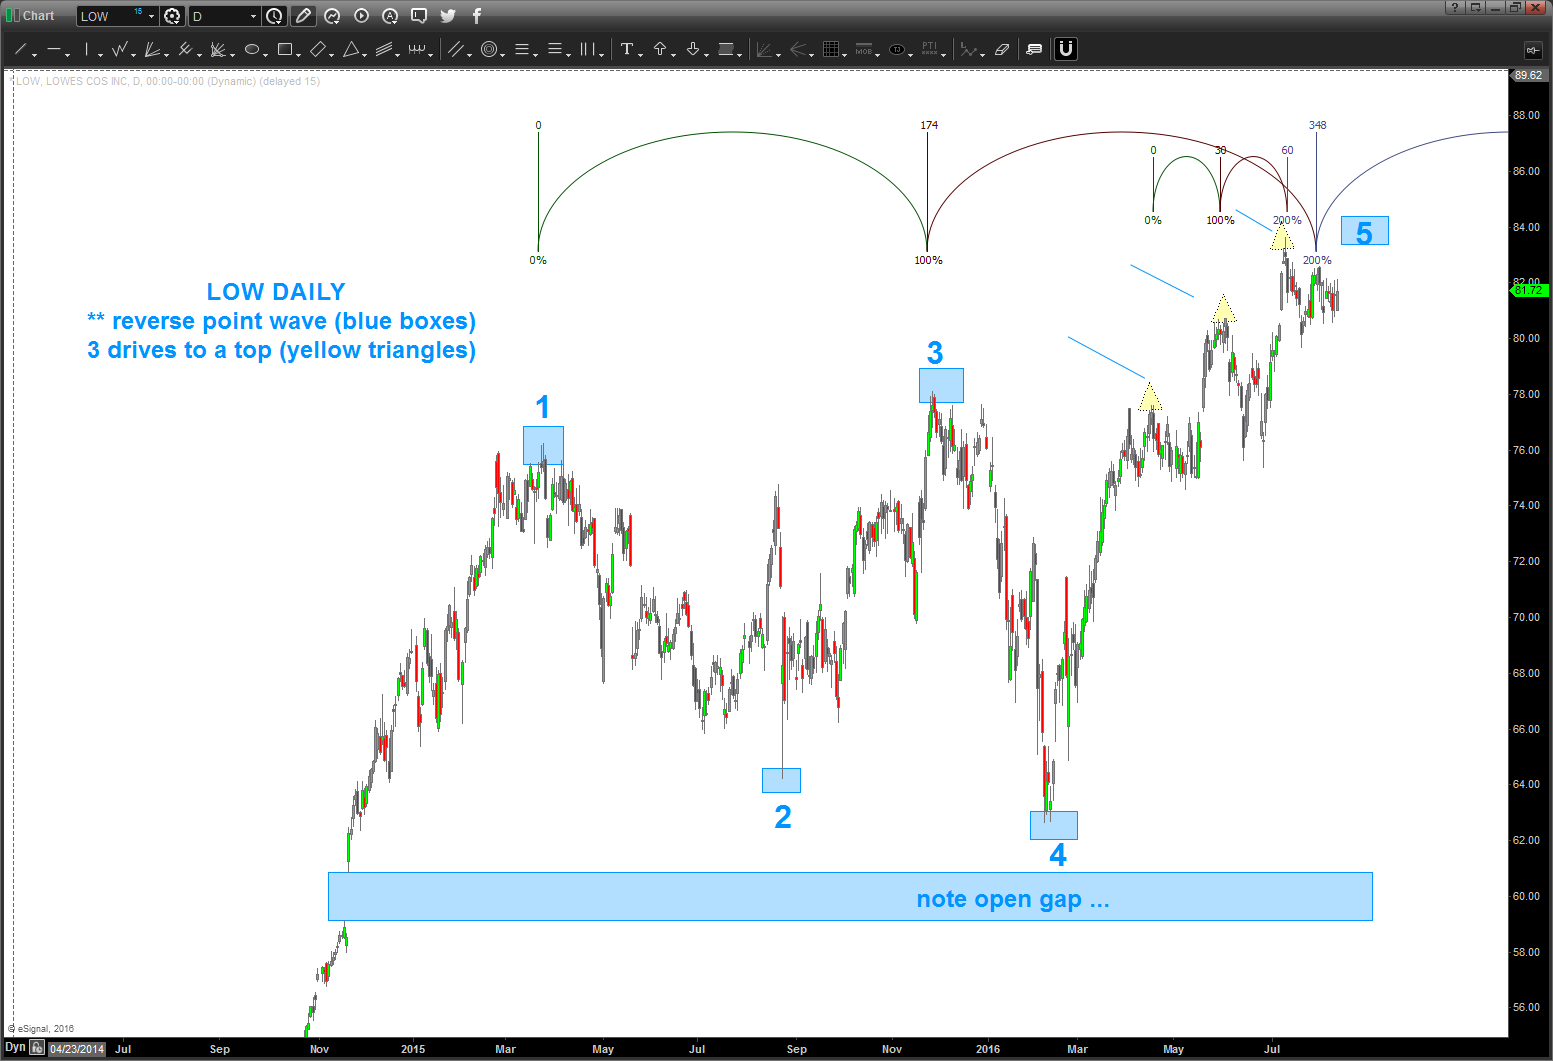
$LOW a short appearing updated …updated
Posted on January 15, 2017 Leave a Comment
1/14/2017 – can you see the Head and Shoulders Set Up coming at us …? Totally wrong above the $81 dollar gap. Wouldn’t play w/ it if it gets above there … will need to CTRL-ALT-DEL
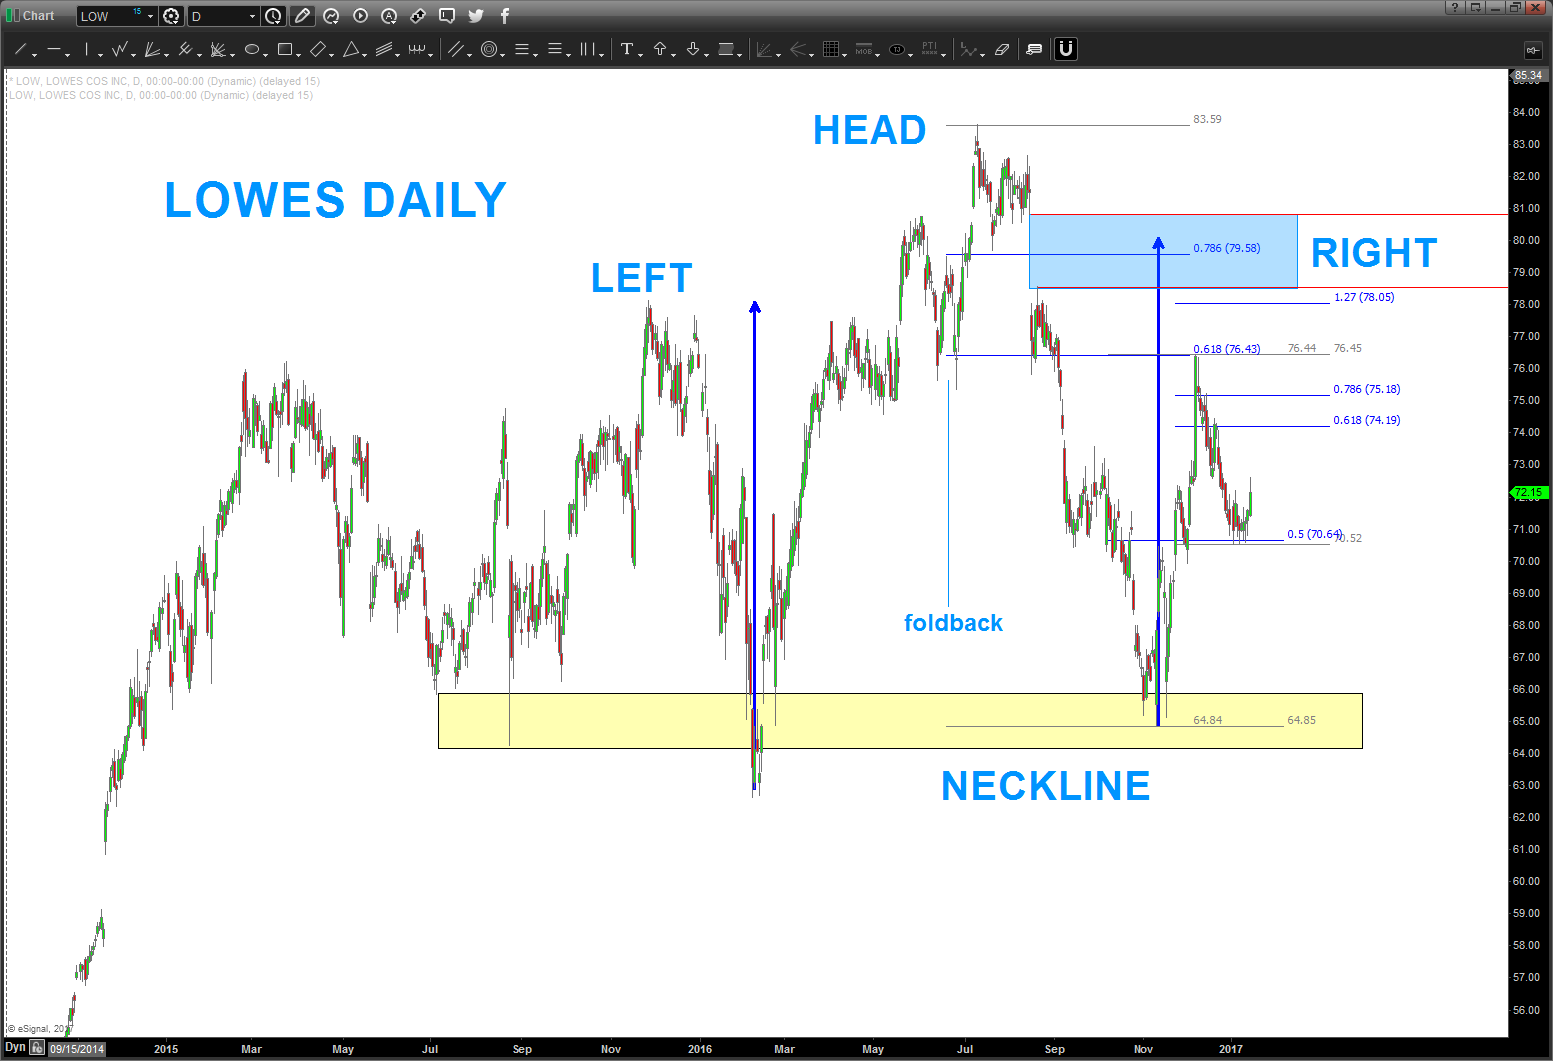
here’s a chart all cleaned up …
08/17/16 – so we have a gap down today. cool, whatever … a pattern was present and it POTENTIALLY worked this time. key here is to go big picture and go “LOG” chart … as you can see we have shown the propensity to negate the trend from 2011 by the breakdown today but we are still “far off” from a trend change .. not saying it won’t go much lower (it could) or that it wont seek the low 60’s but for now it’s working and if you played w/ LOW move your stop to entry and forget about it …
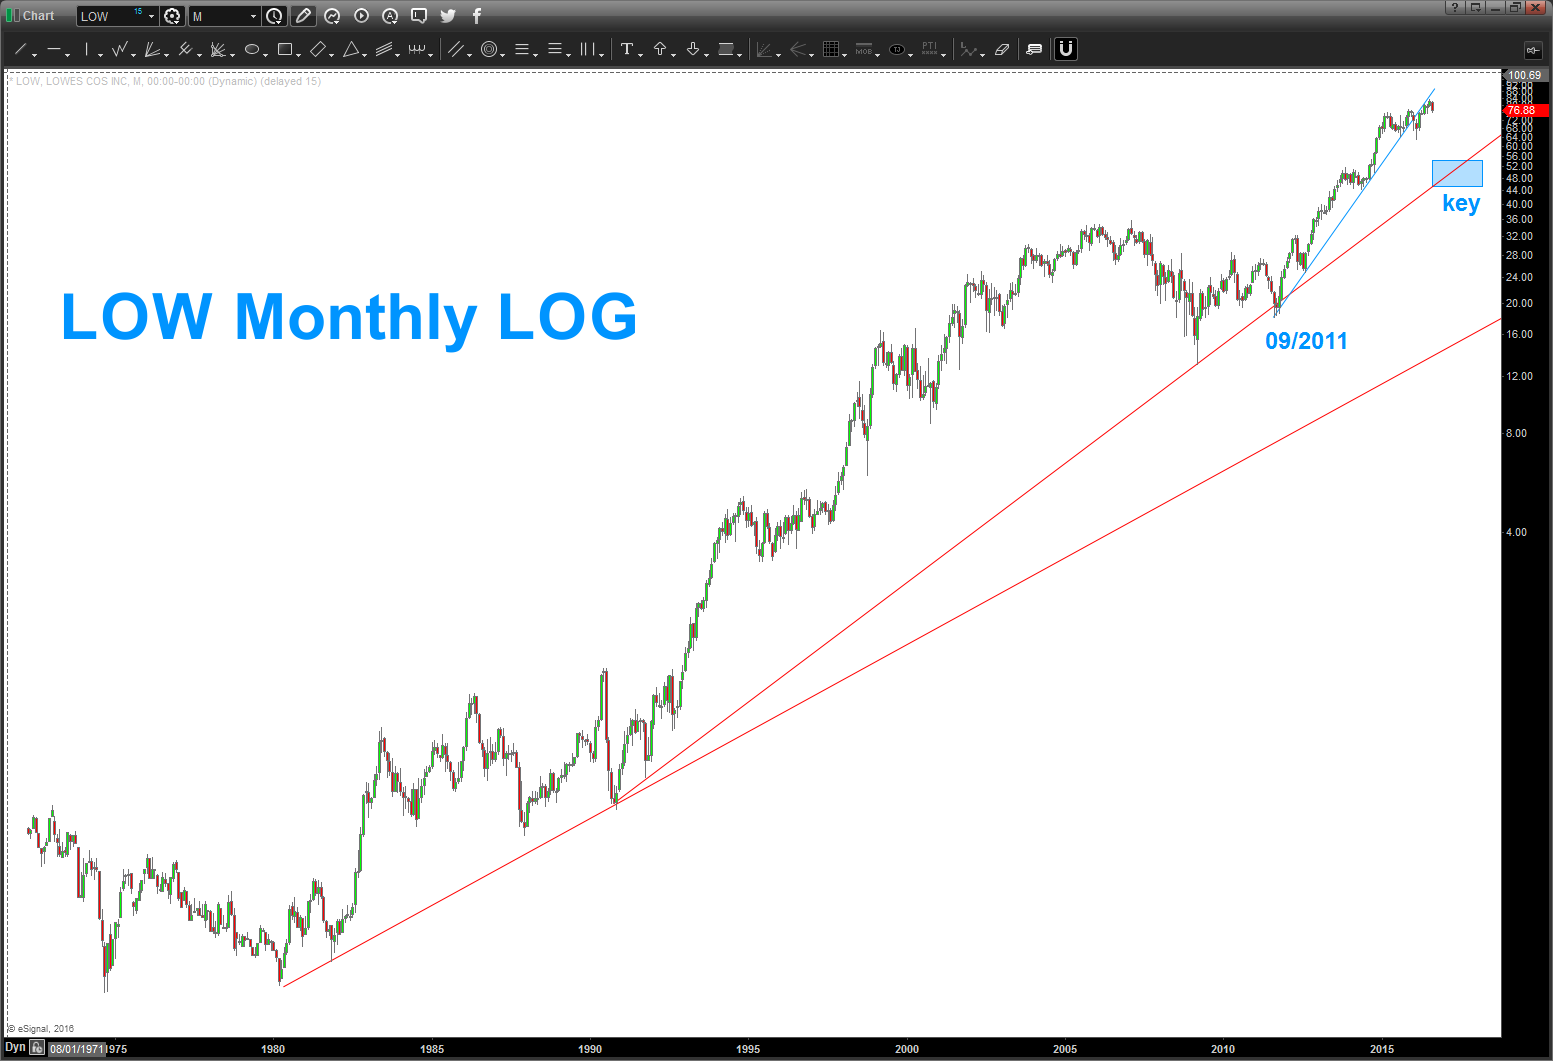
here’s what happened today .. pretty nice bounce back at the end of day trading but some seriously liquidation.
will try to keep up w/ this one, cheers for now.
B
most important chart to end 2014 .. revisited in December 2015… revisited in Dec 2016
Posted on December 31, 2016 Leave a Comment
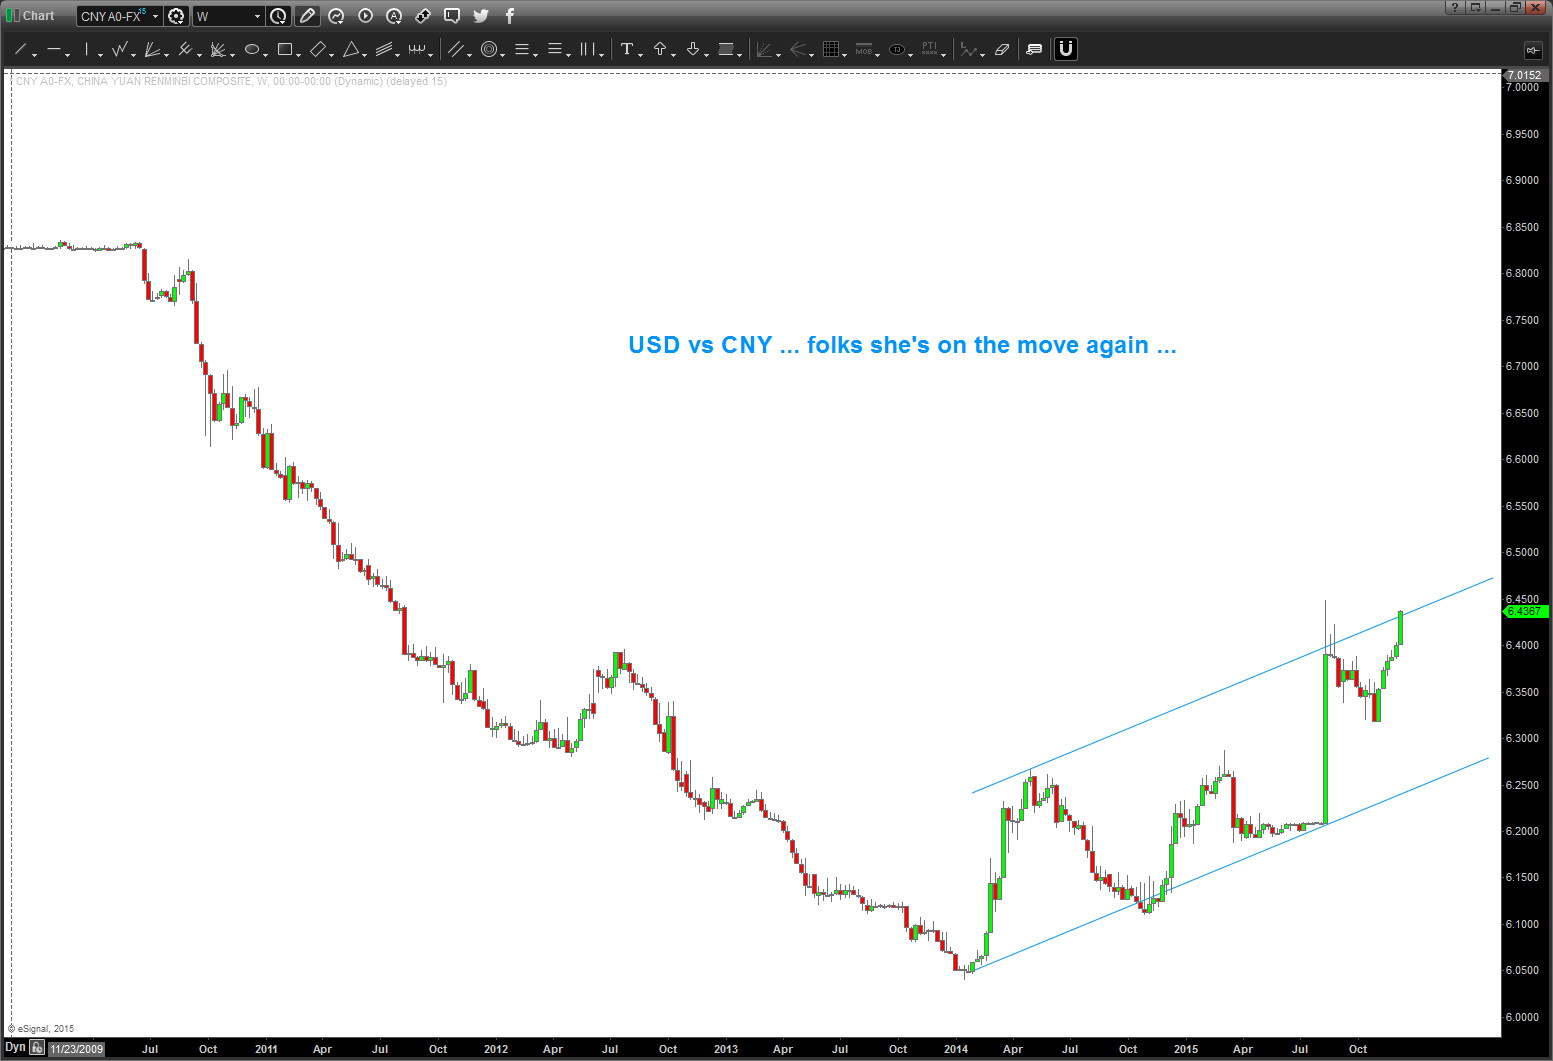
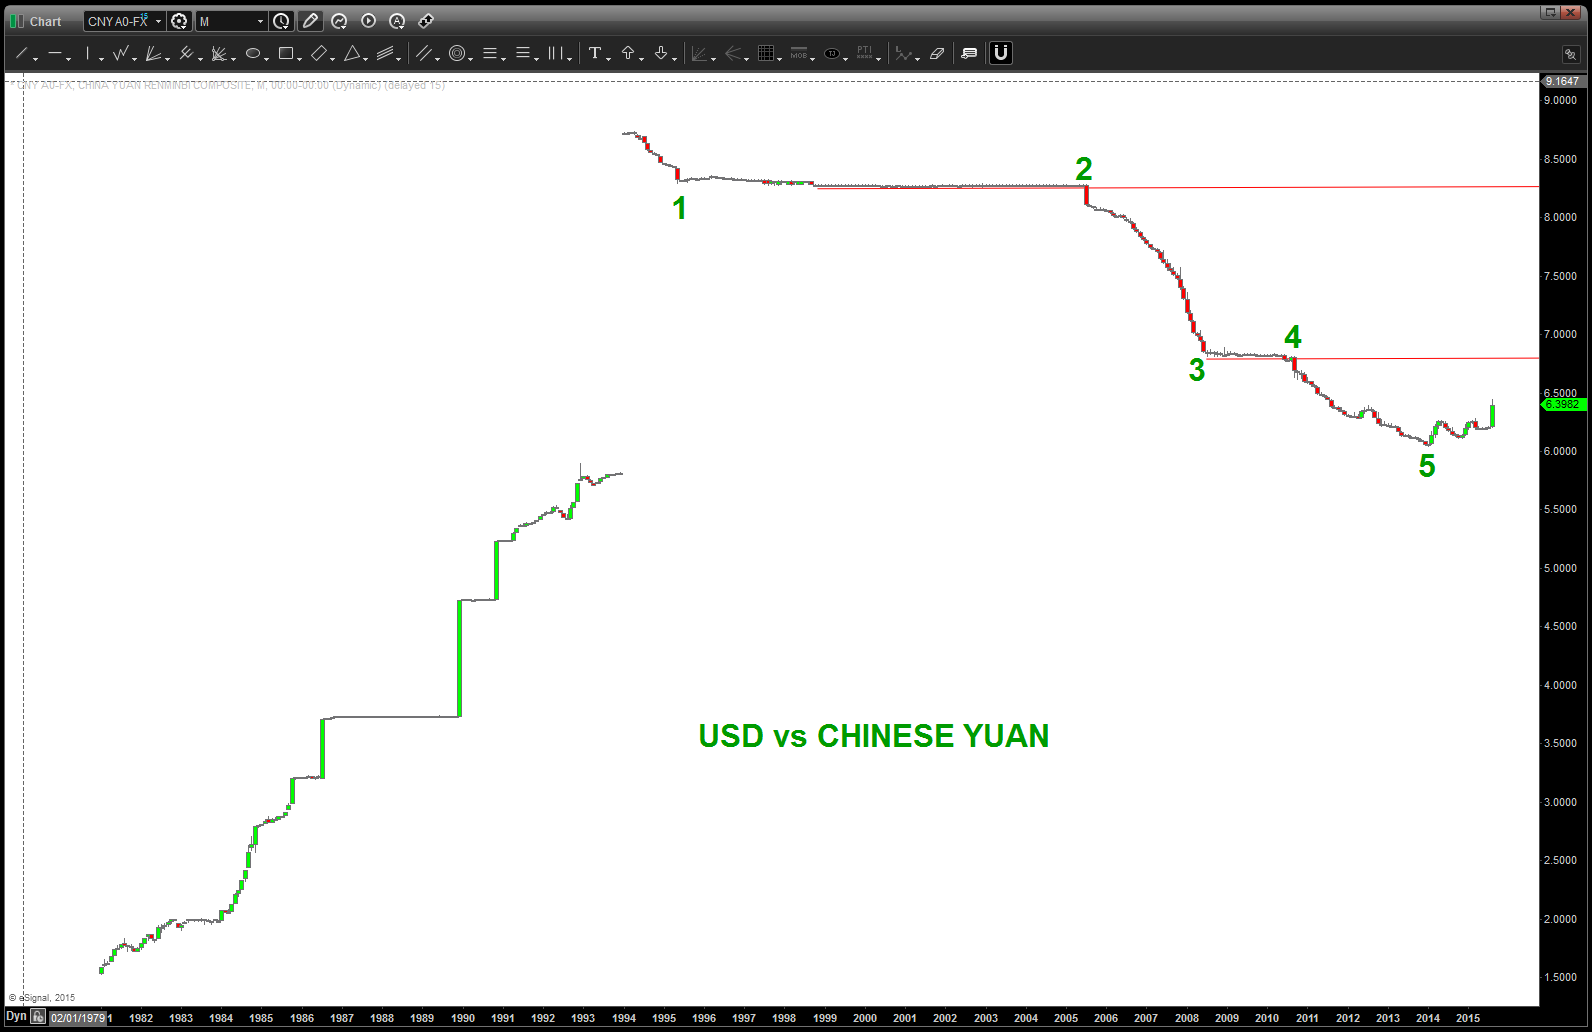
12/31/2016 – I count 5 waves UP so let’s see if the USD relents a little. Folks, this is a big deal and will be interesting to see what the Trump administration is able to do OR not w/ this one ….
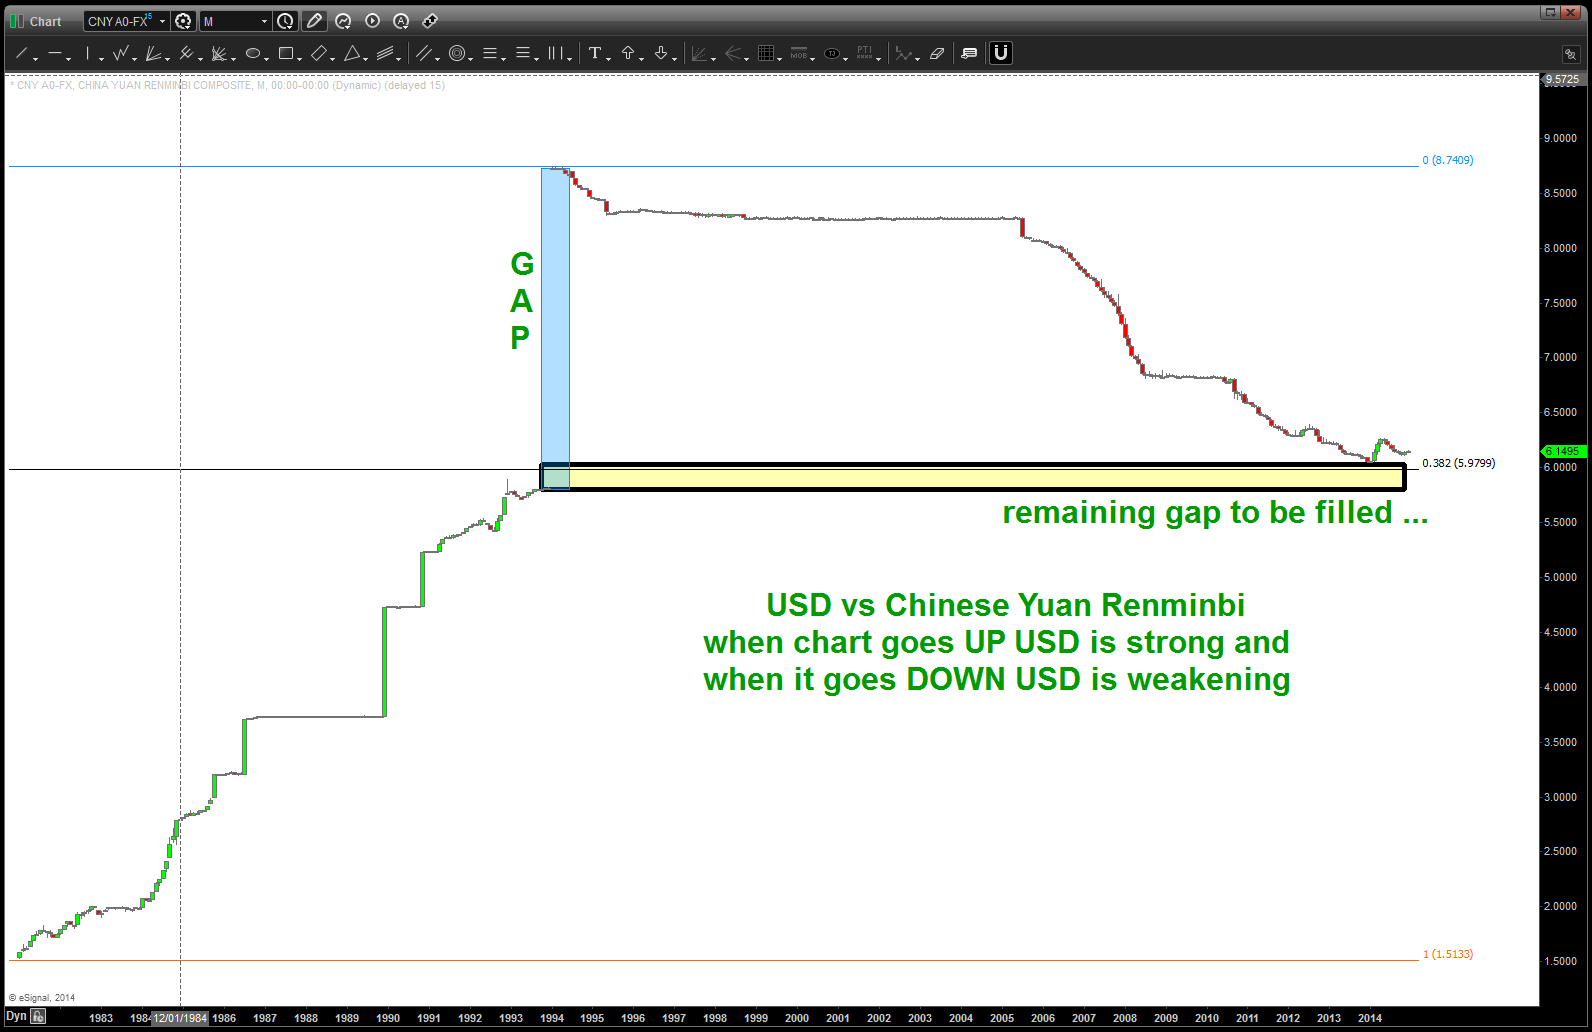
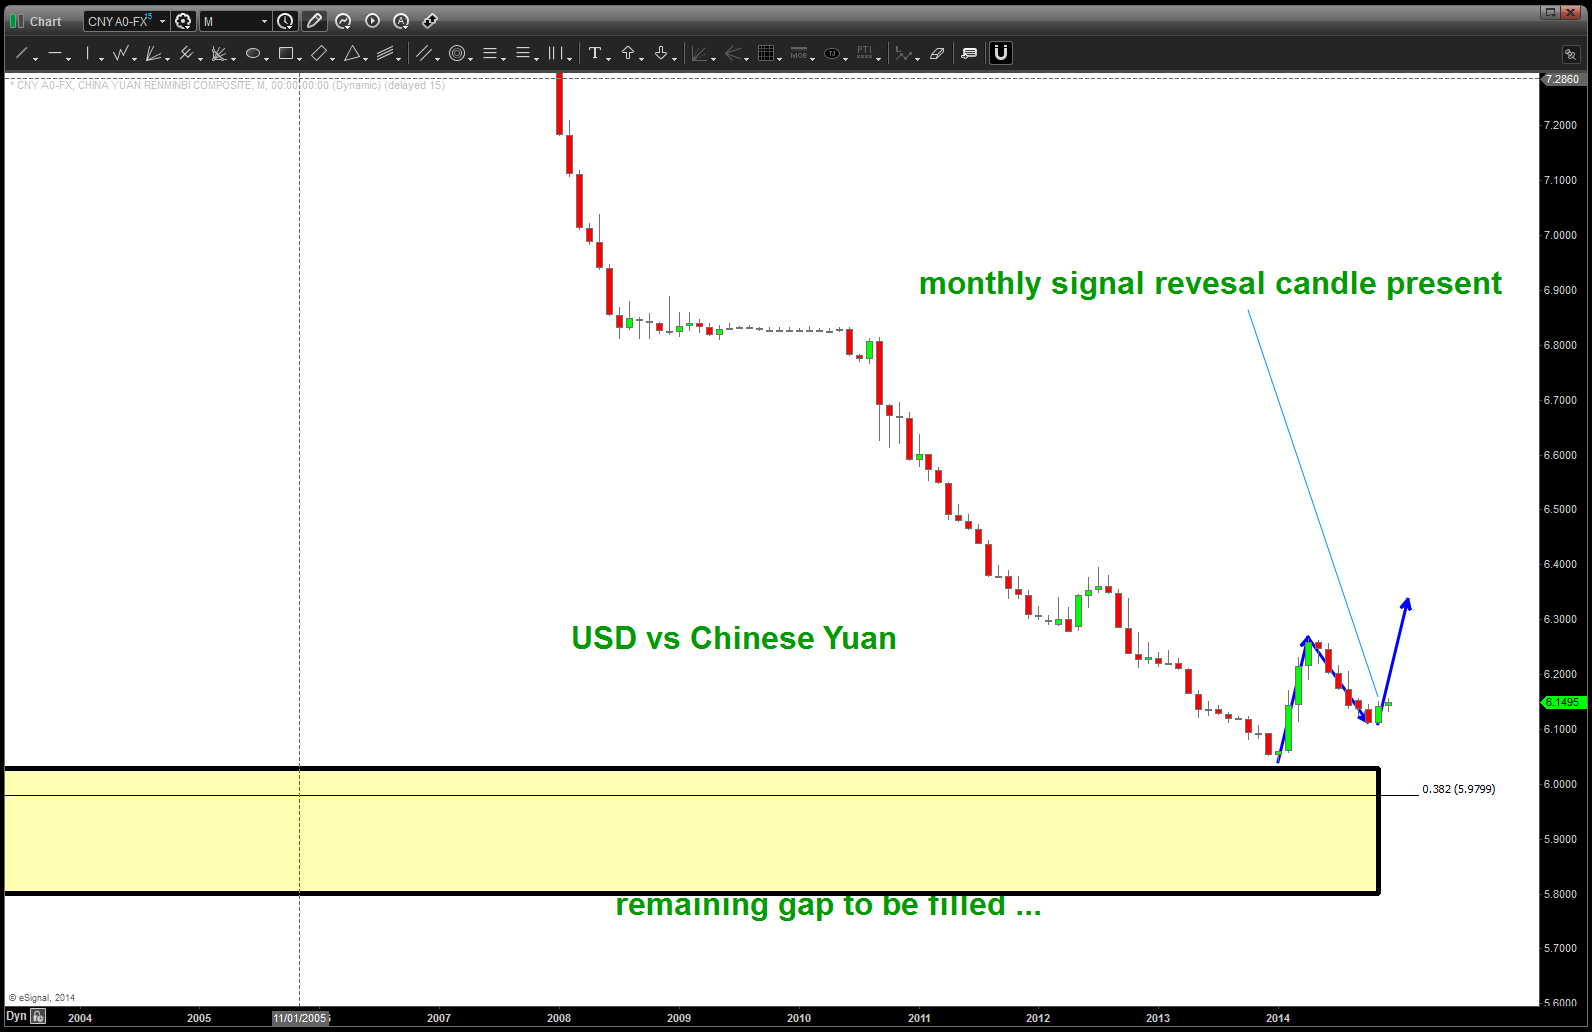
KABOOM goes the USD vs Chinese Yuan … below you’ll see when I first posted on the YUAN. Pattern was complete .. Monthly SRC – new trend begins.
big deal folks .. Stay tuned.
Bart
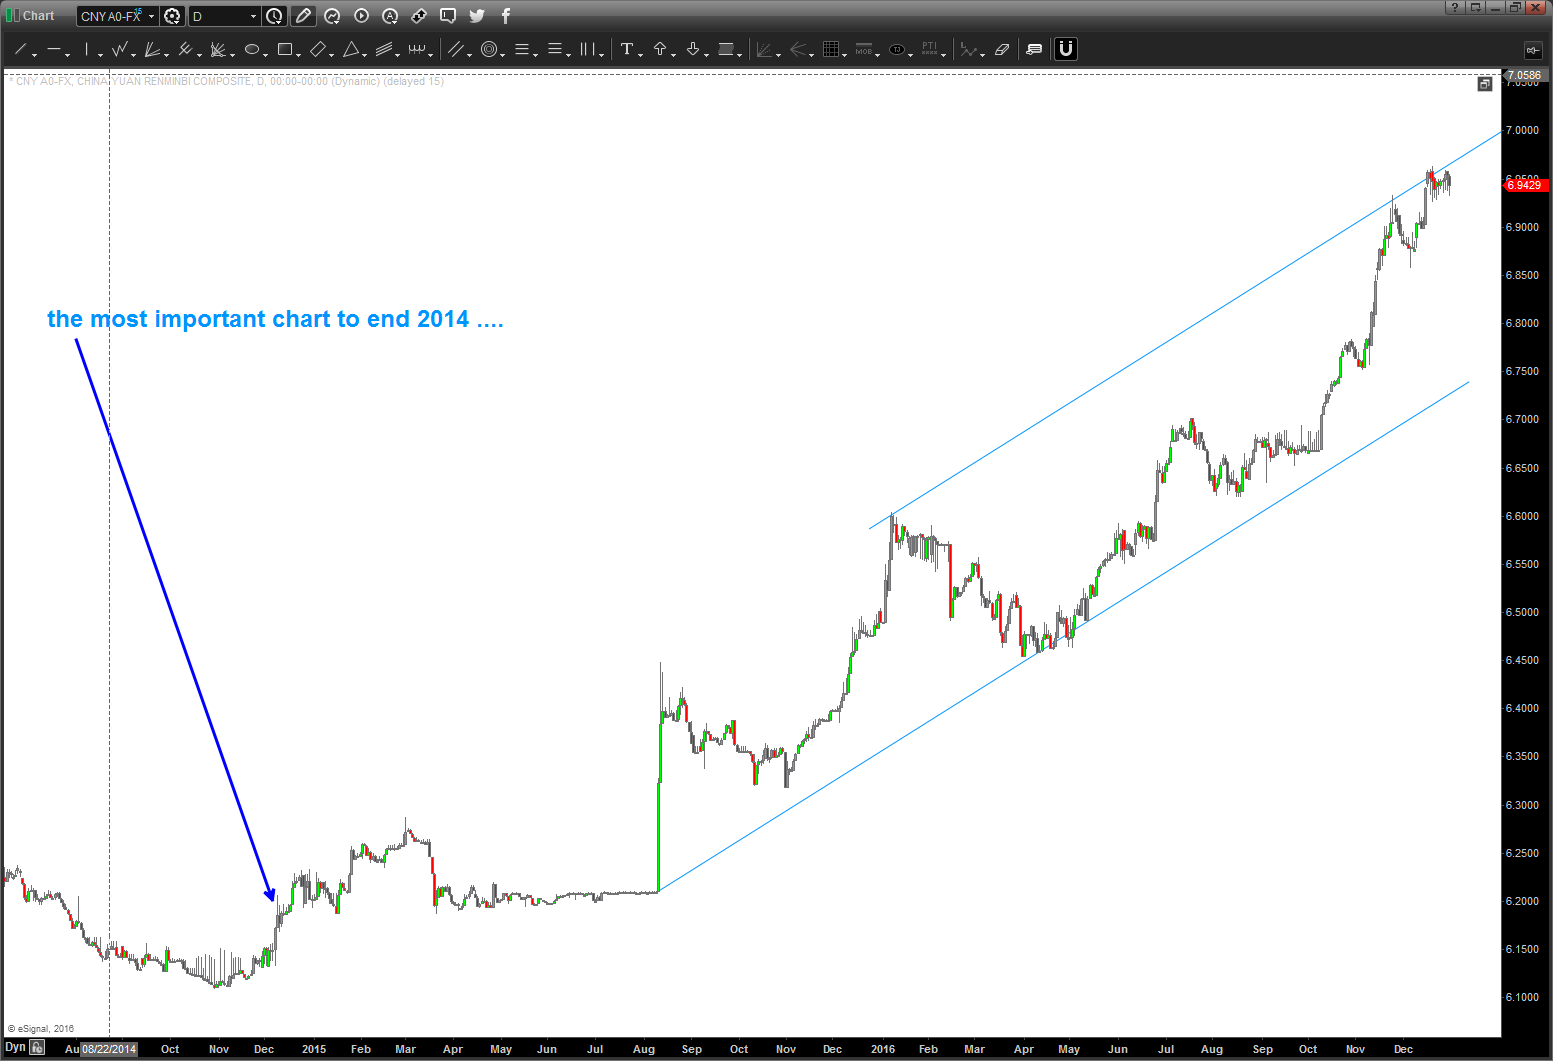
Folks, pay attention here … I know I can’t make this my “most important chart of 2016” like I did last year for 2015 but the dollar is on the move again versus the Chinese Yuan.
this is a big deal folks …
I felt pretty strongly about this one back at the tip of the year. I still do … here’s what I know – FX is the name of the game. Again, you can watch, talk and also make a lot of money trading the $YELP, $GPRO, $GOOGL, $AAPL, etc of the world but the REAL market is the currency market … this past year we have had a very real race to debase. and, quite frankly, it ain’t good folks.
This move by the Chinese was 1) expected and 2) ranks up there as a very big deal … nothing to really watch now, believe they are committed to depreciating their currency also.
One has to ask .. why is the worlds second largest economy taking these measures? Well, of course it’s because all is well and the global economy is doing GREAT! Or, could it be a global sovereign debt crisis and a house of cards?

Folks, there is a major global move occurring in the biggest market in the world – the FX market.
Not only is the YEN,RUBBLE and EURO simply crashing the Chinese Yuan continues to weaken against the USD. This is a big deal and should be watched closely. We’ve been blogging about it for a while (https://bartscharts.com//?s=yuan )
Appears, for now, our pattern has worked and the $$$ has again started to rise …
Trade / Investment of the Year?
Posted on December 31, 2016 Leave a Comment
12/31/2016 – just updating the ‘trade of the year 2016’ from August. I’m updating it because, right now, at the end of 2016 I don’t have a CLEAR CUT pattern. This triangle worked out grandly … we’ve hit a sentiment extreme in the Gold and EURO pessimism world so probably time to start throttling it back a little. We’ll see …
if anyone has some trade investment of the year ideas they would like to share – hit me. again, I’m simply looking for a PATTERN. the ‘trade of the year’ is a PATTERN not what I ‘believe’ but what I ‘see’ …
put the next 3 charts in context … they are an update to the post from August. Study the post all the way thru …
as always, rock on, ok?
HAPPY NEW YEAR!
you wait, patiently, for opportunities to appear which “change the game.”
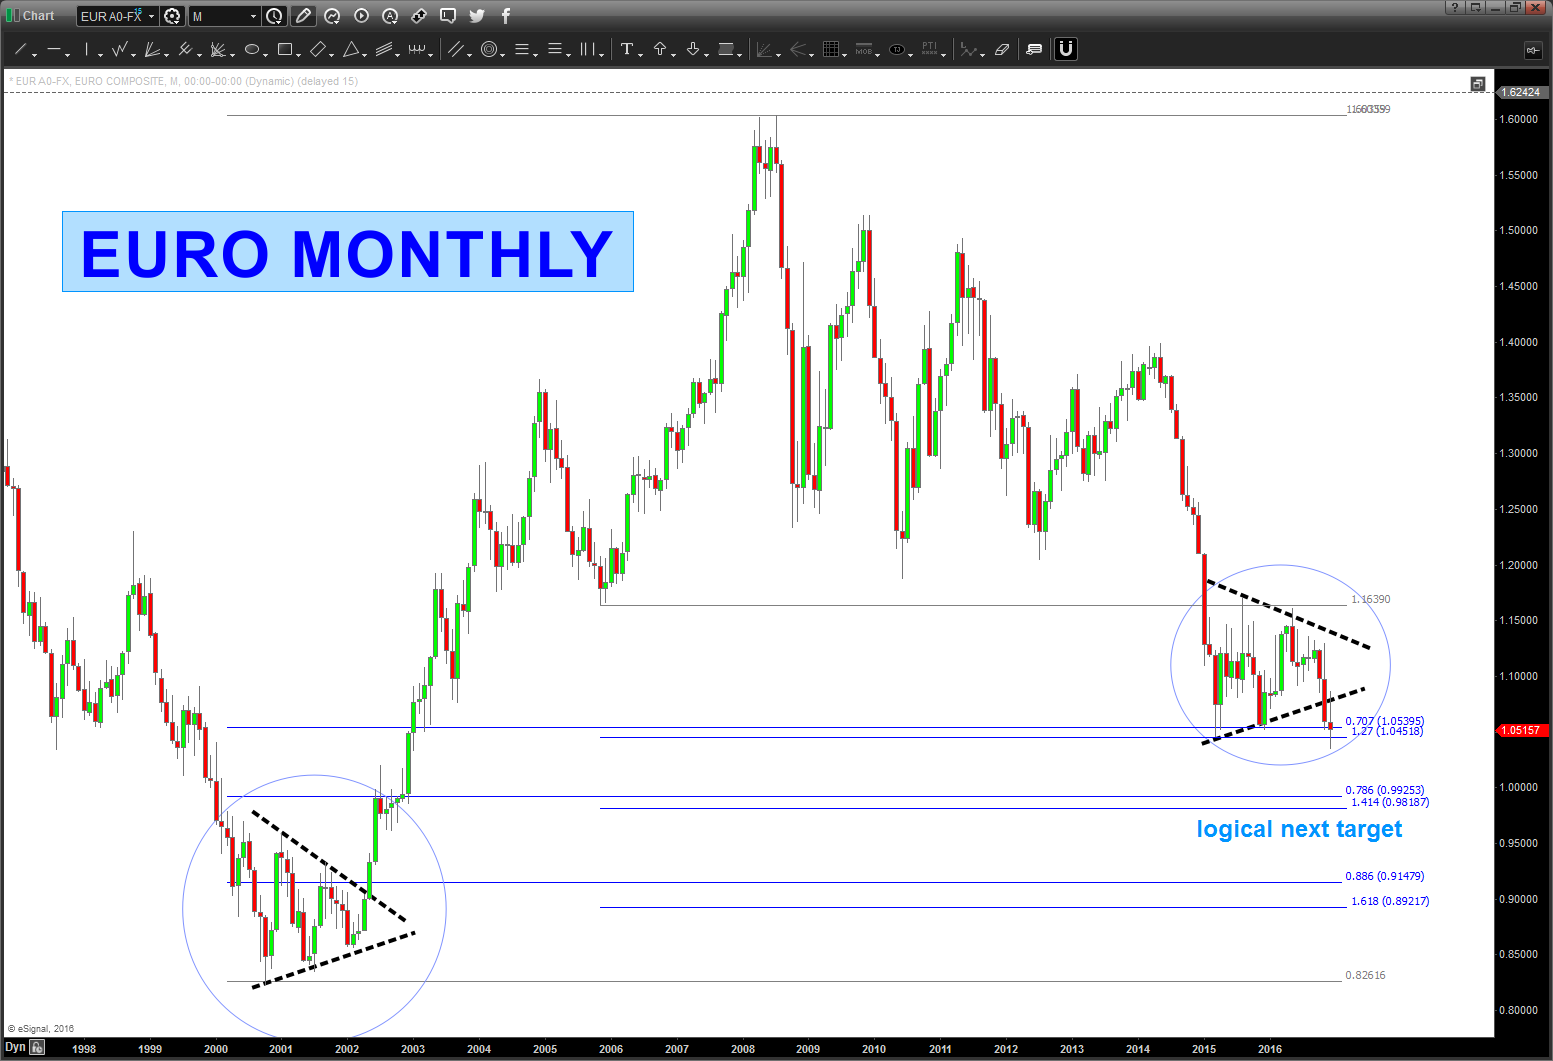
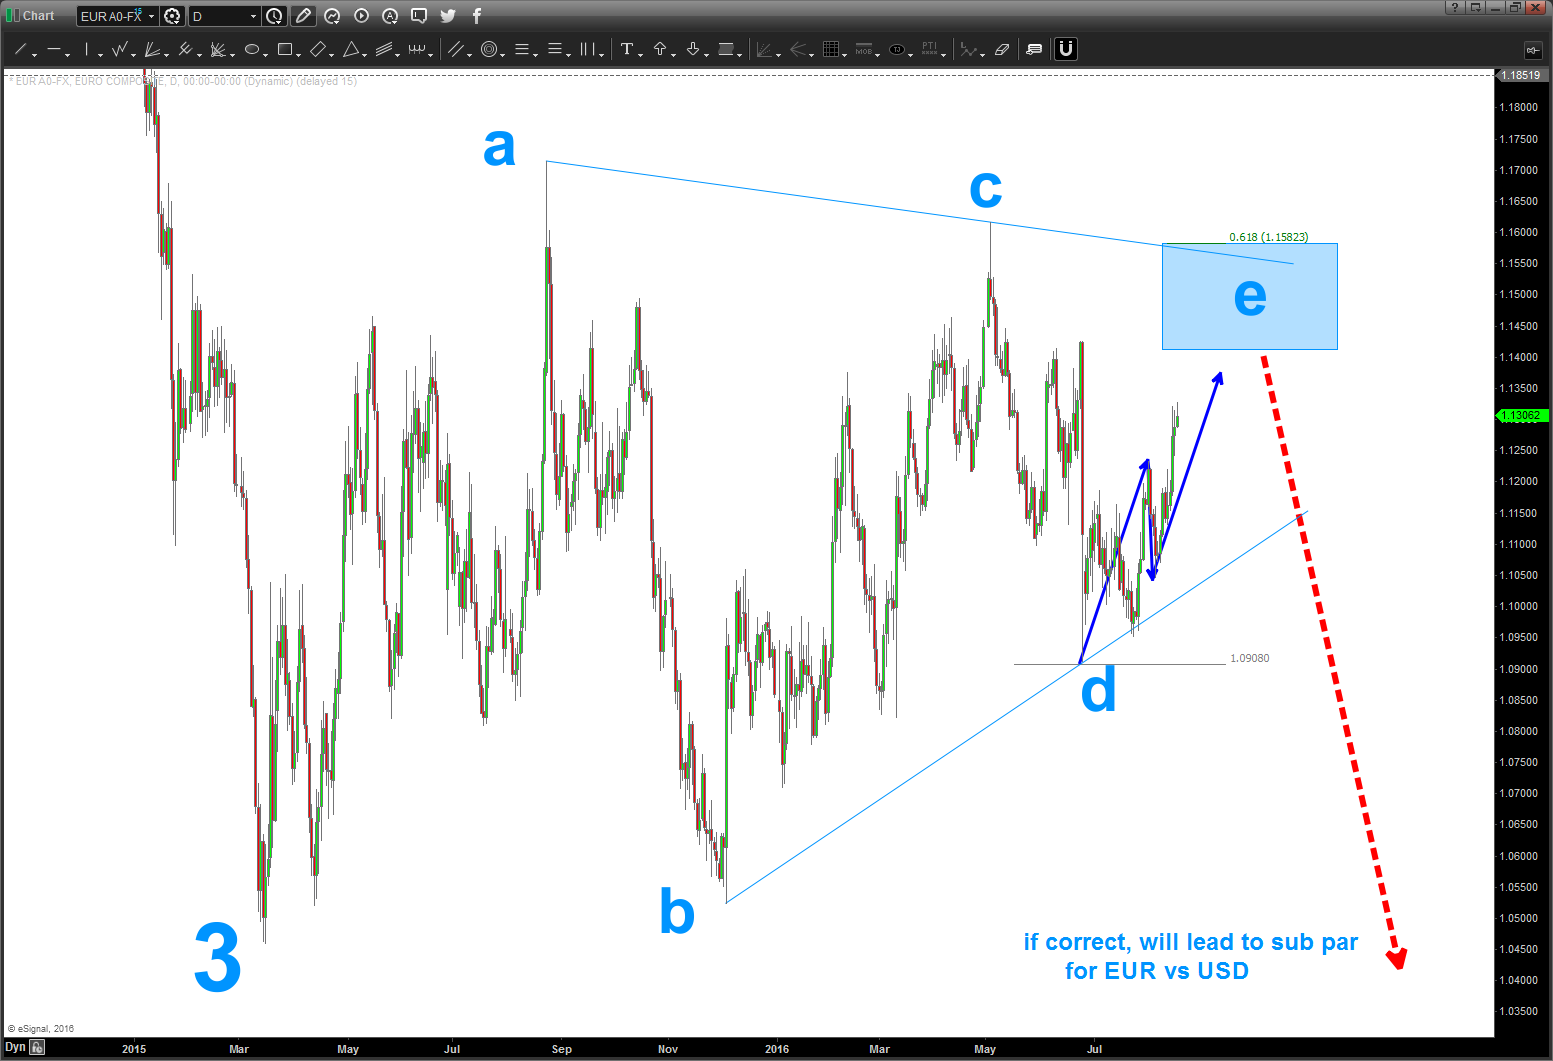
as many of you have been following me know, the swing patterns that we watch take some time to develop … in this case a thesis is made for the “trade of the year” to be SHORT EURO vs USD.
what do we have working?
here you go …
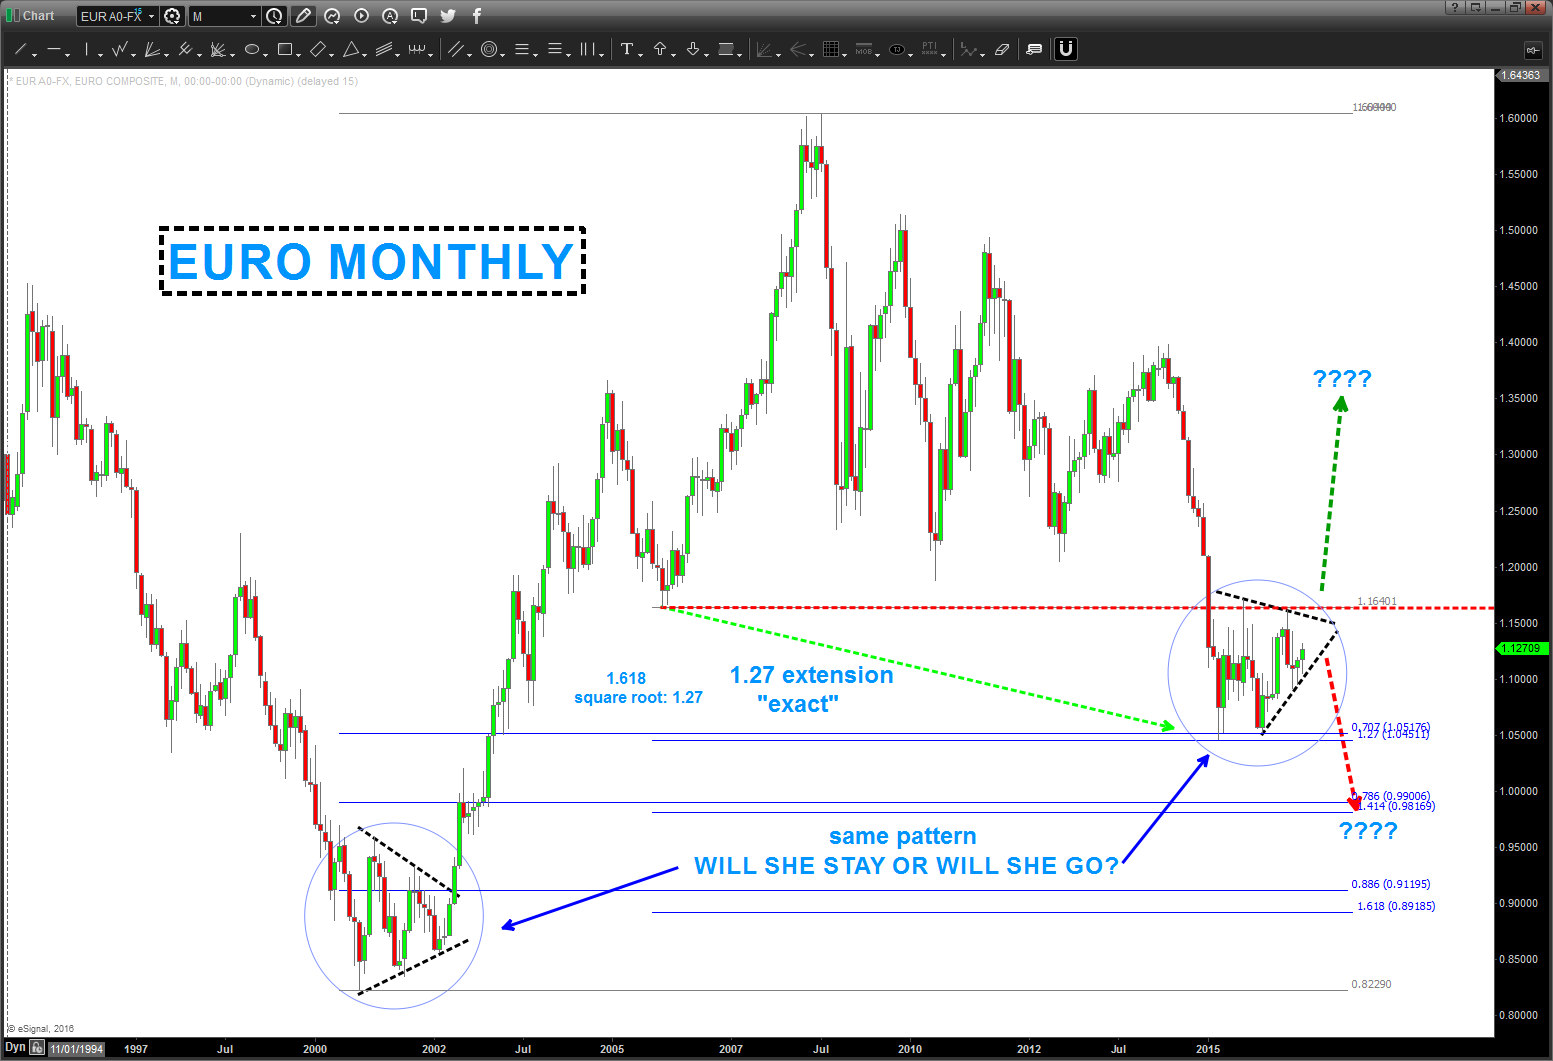
note, the MATH stopped the decline of the EURO and we are carving out – almost exactly – the same pattern that appeared at the all time low of the EURO after it was introduced. if you take the time to measure the moves …(I have) you’ll find the swings are almost exact. the LAST TIME the EURO did this it EXPLODED in a multi-year advance that crushed the dollar. is that going to happen again …?
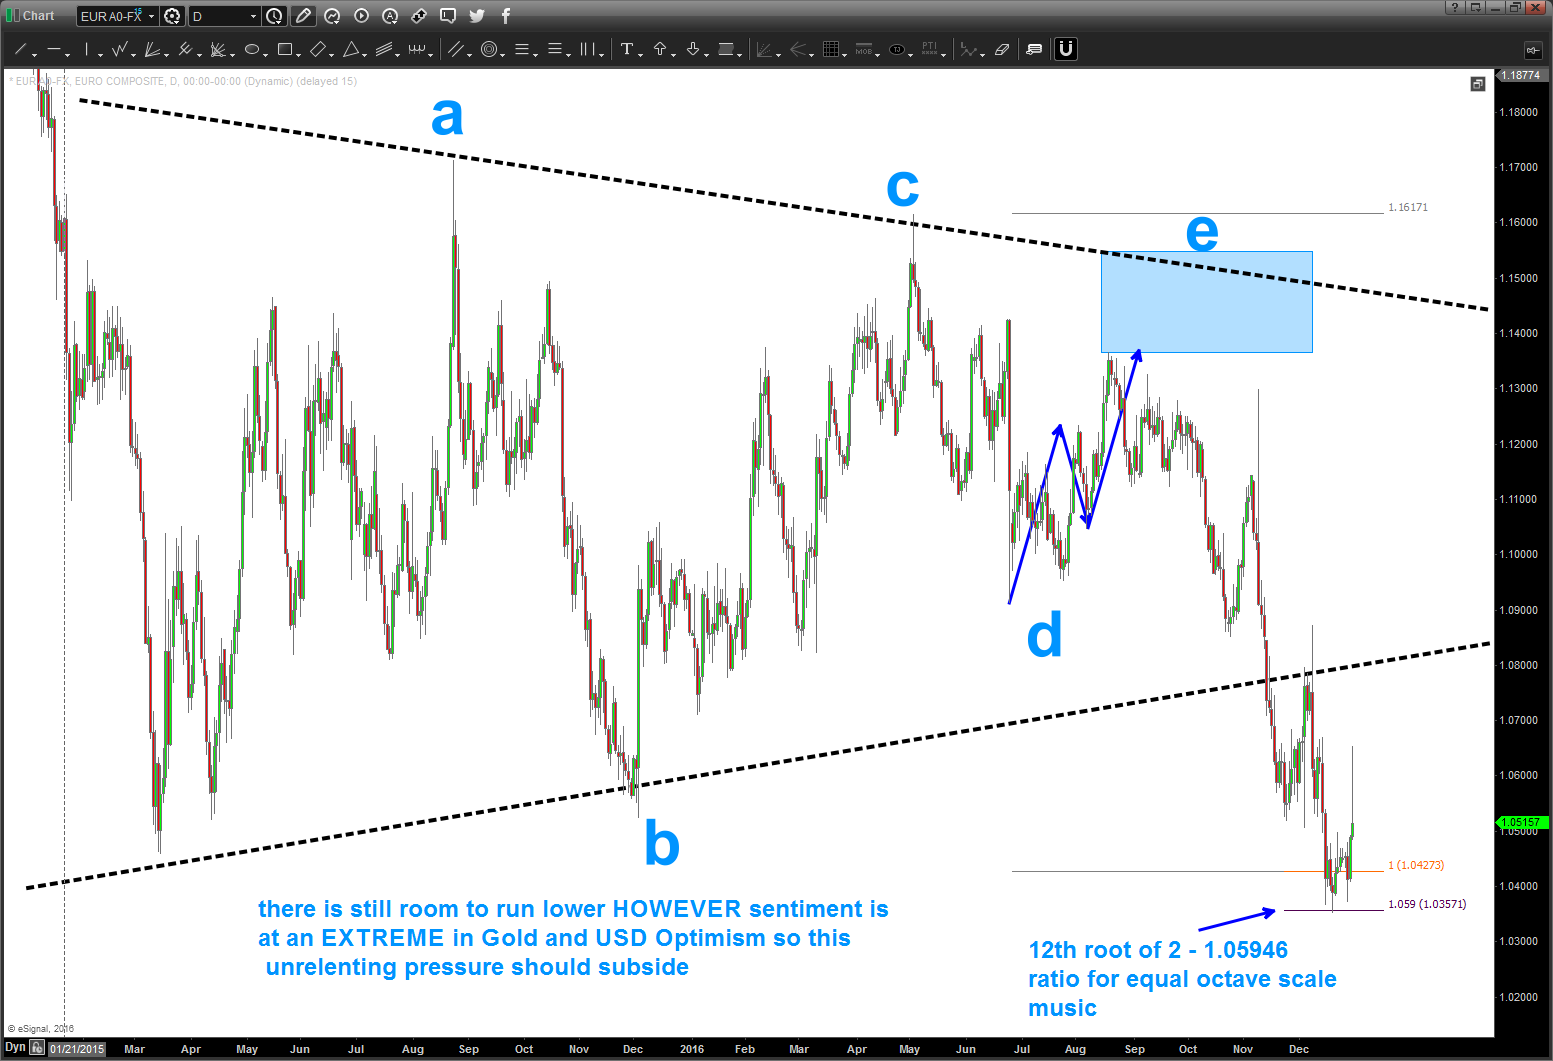
have no idea … but the “rule” from the great land of the CMT is that the consolidated triangle breaks in the direction of the trend going into it …so, in this case, the EURO “should” breakdown against the USD. As shown from the lows in early 2000 .. it certainly didn’t do that. but here’s the daily … and remember the triangle has 5 legs labeled a,b,c,d,e ..
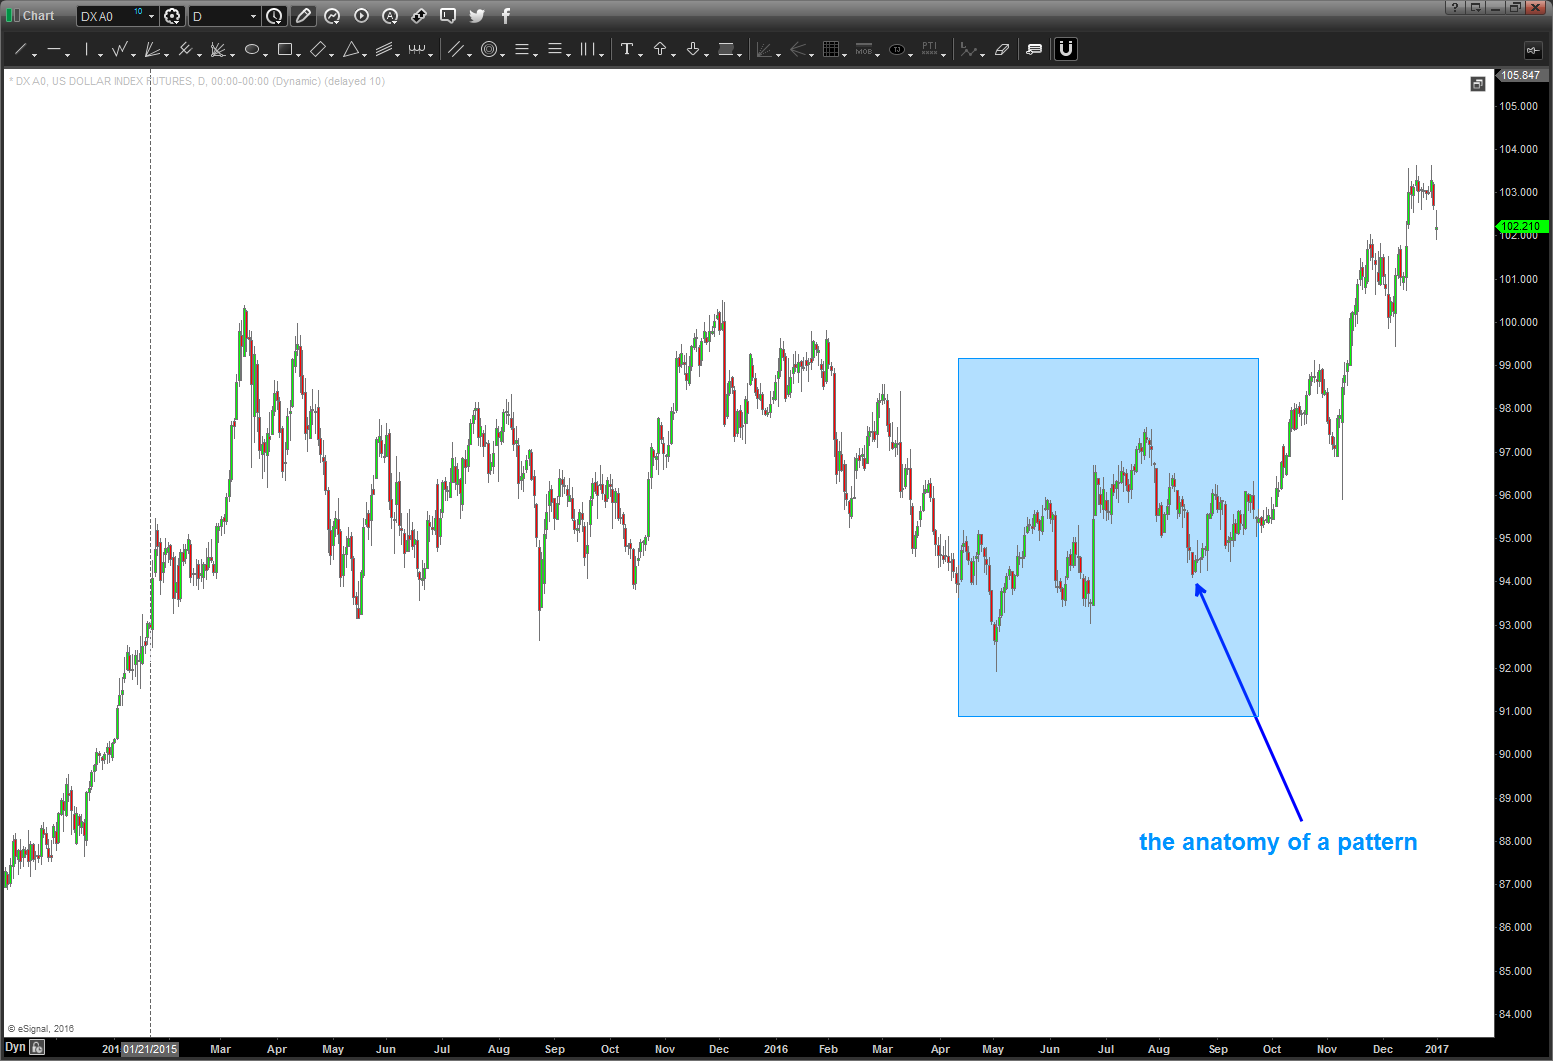
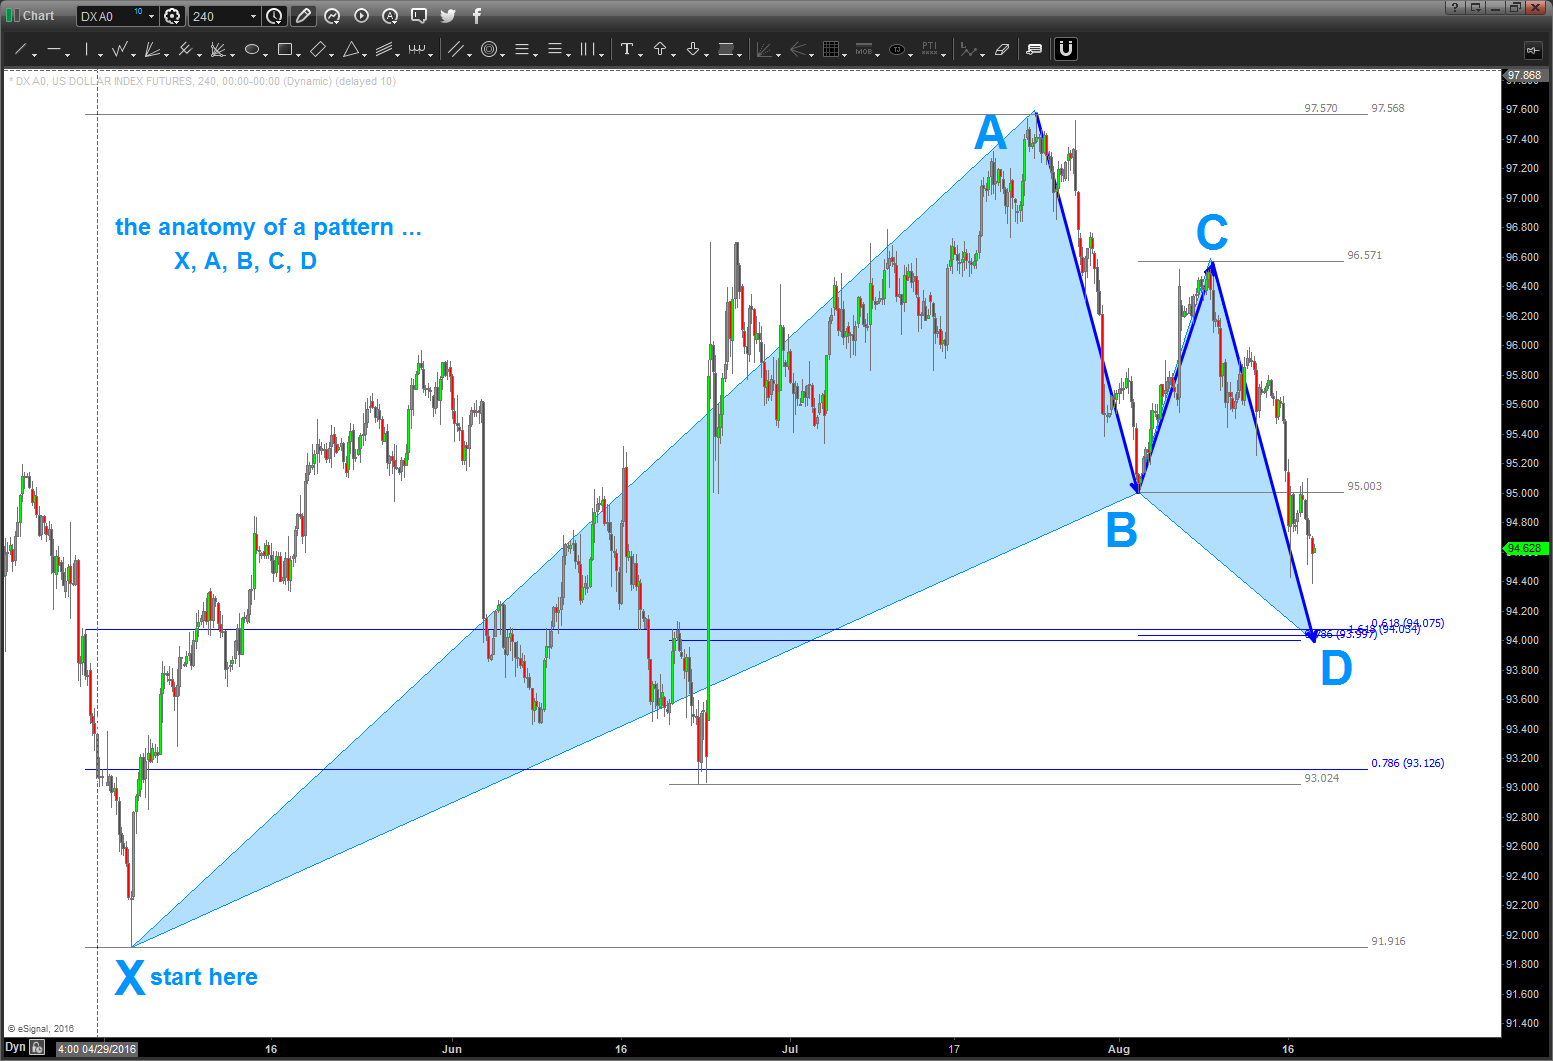
here’s the dollar index pattern:
note we have an AB-CD present, a .618/.786 overlap and a 1.612 extension present. THIS COULD BE THE SUPPORT TO CATAPULT THE DOLLAR HIGHER …just a pattern.
it’s just a pattern but the probability that we are in the final ‘e’ leg of the 1.5+ year consolidation of the EURO is high … this is POTENTIALLY a monster move coming ….
let me know if you have any questions …
B
PS – here’s the geometry of the consolidation .. one line oriented w/ price and time and 90 degree angles created this trend line. (I am writing this before I draw it – cheers)
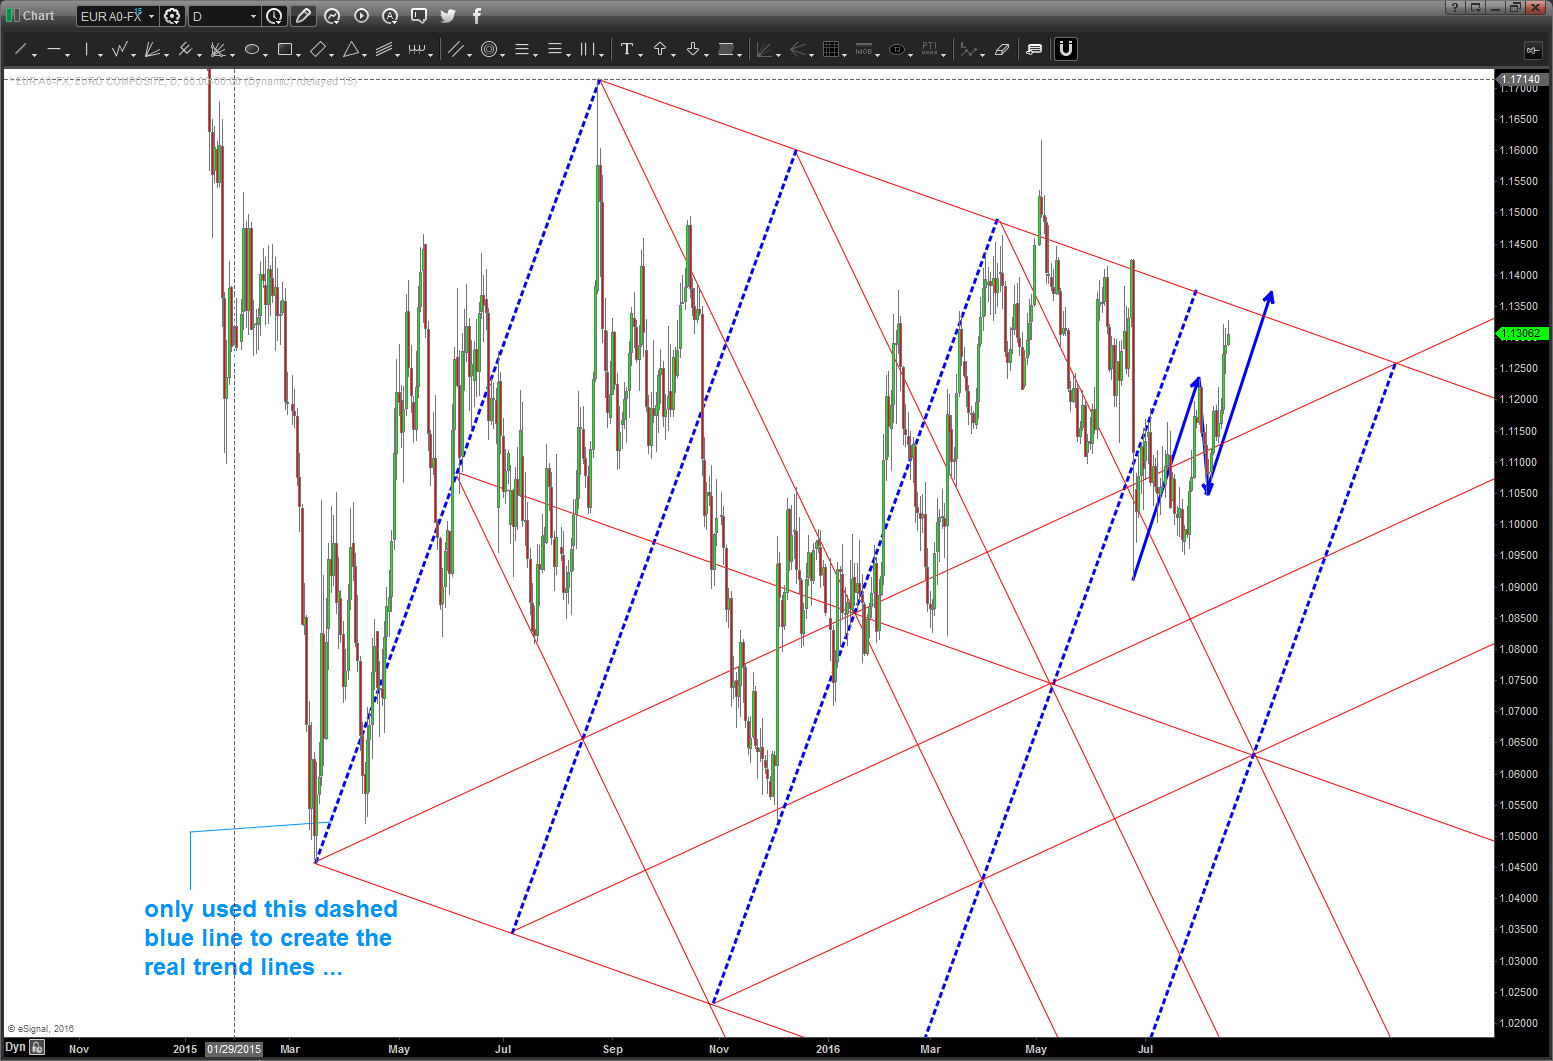
IF you take the time to study this – and why not if you subscribe to my blog you’ll find that MOST if not ALL the major pivots occurred around the construction of this simple square.
Here’s a great picture from Mr. Joe Dubs:
here’s the monthly square:
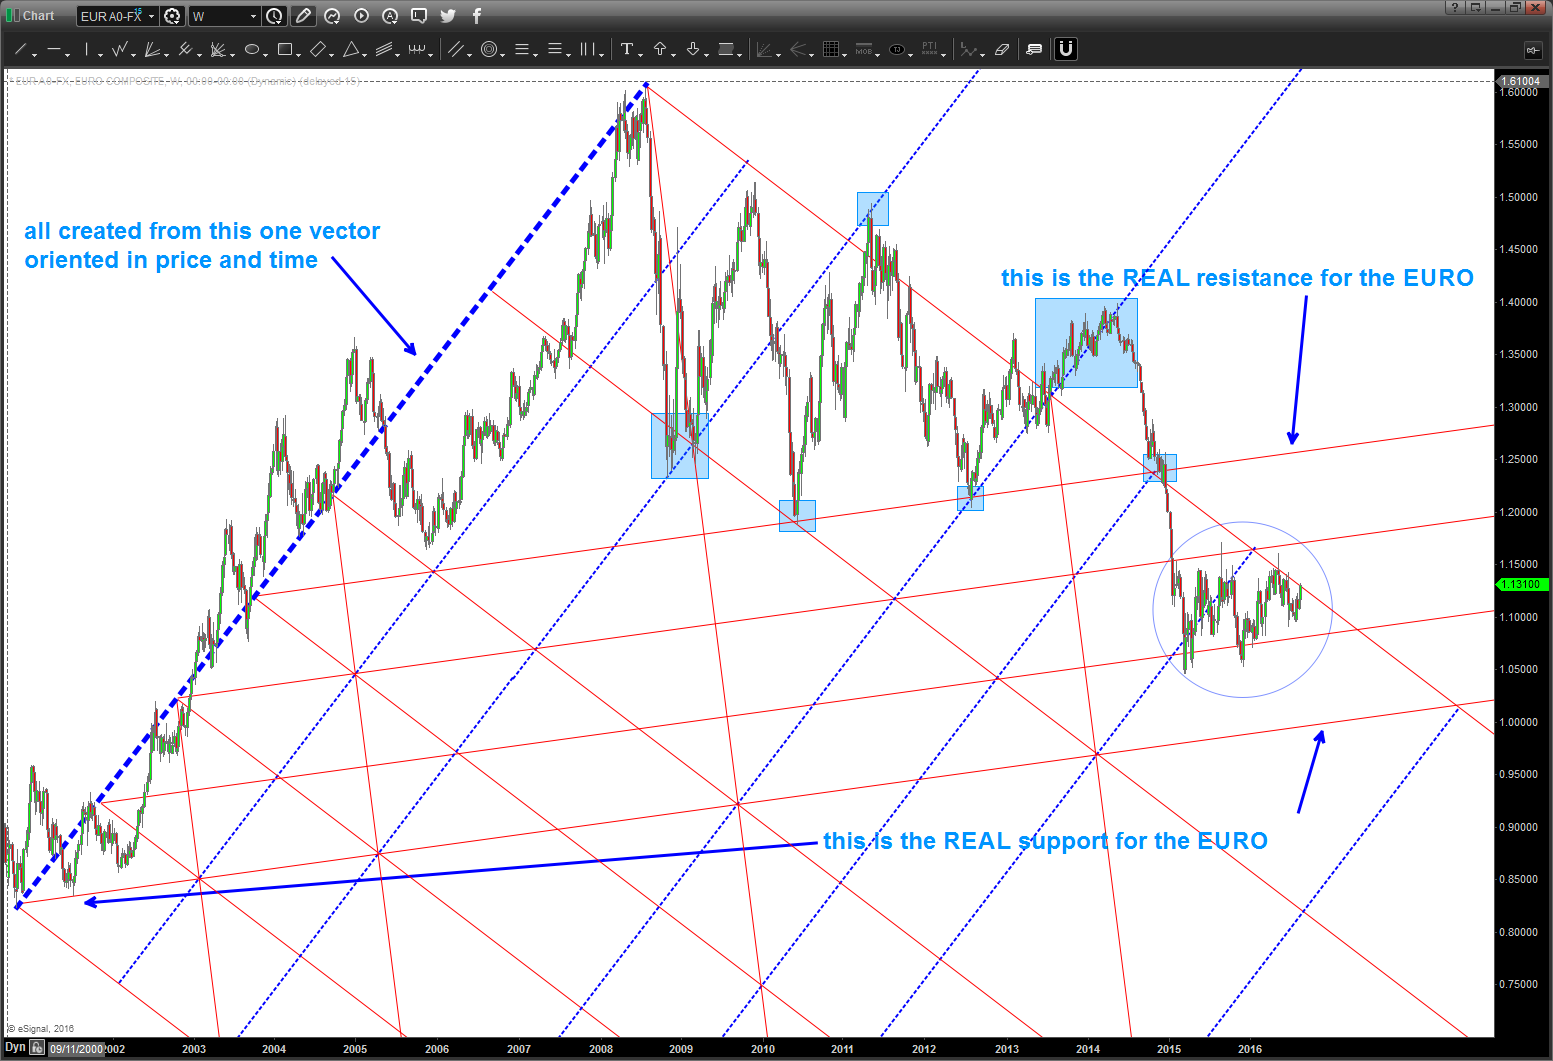
again, only one line created these trend lines and it was the low to high and then 90 degree angles. folks, take the time, defy human nature and prove it to yourself …look at the geometry present.
the other thing you can do, if you REALLY want to dig deep is to use the box height and widths to create the time cycles present in the EURO or any security. but I’m tired, it’s late …just think A^2+_B^2=C^2. perhaps there was something to Pythagoras and the Music of The Spheres …or not.
Bart
NVDA
Posted on December 30, 2016 Leave a Comment
was asked to take a look at NVDA.
what an amazing parabolic run and that’s what scares me right now … parabolic explosions do not end well so I expect now to very soon a very violent and CORRECTIVE move … however, I’ll watch this stock to find, hopefully, a pattern to BUY because this entire moves feels like a 3rd wave so another leg up is coming but for now … watch for weekly/monthly signal reversal candles to get defensive.
also, note the ‘extreme’ reading on the RSI. there is no bearish divergence, yet. so, it certainly appears that it needs/wants to correct from current levels to ‘set-up’ the bearish divergence play when it gets to new highs. but, again, this correction starting/coming is from a parabolic move so don’t get spooked if it’s violent and much more deeper than anticipated – it’s just working off the parabolic energy that blew it out.
the monthly signal reversal candle level is roughly 85, still a ways away. for now, that corresponds to the ‘top’ of the log trend line is broke out above earlier this month.
hope this helps …
B

$PCLN update 11/12/2016 and now updated again for 12/30/2016
Posted on December 30, 2016 Leave a Comment
12/30/2016 – PCLN seeking to fill gaps? note the first target is the ‘basic’ ab=cd at 1431. also, read below … the 1600 level was the convergence of 5 major patterns.
11/12/2016 – well PLCN went up and hit the level shown below. Folks that’s 5 monthly patterns on PCLN. IT SHOULD BE MONSTEROUS RESISTANCE for PCLN to go higher. As always, patterns do fail and they do work so it’s all probability. Also, when we go down to the daily time frame NOTE the perfect AB-CD in price and time. This completed the butterfly sell pattern and it’s extremely helpful when TIME of the last leg of the butterfly balances itself …also, note the ‘classic island reversal opportunity” where all we need to complete is a gap down below the shaded yellow box and this puppy could get rolling.
last thing – there are targets a little higher so any strategy should take that into account ..but, for now, we have 5 MONTHLY PATTERNS COMPLETING ON PCLN.
TAKE NOTE!
Bart
10/9/2016
PCLN found support on the “polarity” from the IPO and, essentially, negated the mirror image foldback pattern discussed below. What now?
If you take a look at the long term chart, again, you’ll see some powerful sell patterns all coming together. as for right now, appears we are in no mans land w/ no pattern (buy or sell) present.
here’s the patterns present:
- 1.1618 extension from the IPO high
- note the black arrow going up from the post IPO low to the IPO high. That same “move” is present into the target area. the black arrow is “copy” and “pasted” from the IPO to current market prices.
- 3 drive to a top – the blue triangles
- 1,2,3,4,5 reverse point wave
- a “perfect” Butterfly Sell pattern – (it has an AB=CD present in the last leg of the Butterfly)
who knows if it will get that high right now .. but certainly realize that 1600-1625 has a TON of resistance.
B
02/01/2016
as you can see below, the light blue trend line below was taken out. now we are approaching major support as shown by the polarity principle. some bid thrust/candles going into this level so this will be a key test in the coming days/weeks. if we lose this level, then expect 1.27 level to be attacked in the high 800’s.
12/20/2015: update to PCLN.
one can see that this has been an amazing rocket ship.
one can also see below that I was “seeing” a top coming in and tried the mirror image foldback, which from a price perspective DID NOT work. then, you can see that I was “seeing” a butterfly pattern and that missed the target area by a few bucks.
so, in summary, let’s watch the key low to high trend line shown in the chart below. also note the TIME symmetry around the foldback points. I missed that below, but that actually lends some credence to a potential big top.
this one has been tough .. but, then again, when you go from 3 dollars to 1450+ it’s going to take some time to digest.
anyway, for those who asked me, hope this helps w/ the gameplan for $PCLN.
Folks, this mirror image got smoked. Much like the mirror image for Natural Gas … the mirror images fail at the inflection points and $PCLN has rolled thru the pattern. ERASE … ERASE…ERASE.
Where are we now?
Well, if we look at the candles you’ll see the 2nd largest monthly candle since the IPO occurred last month (OCT) So, we have 1484 coming in but it sure looks like momentum and thrust will carry it to the 1600 level. I’m going to spend some time on this one over the next couple days …
here’s the MONTHLY picture …
IF the mirror image foldback is in play THEN this pattern needs to hold and start down. a move below 1360 would bolster conviction that the mirror image mentioned earlier is in play.
DPZ .. updated and updated again
Posted on December 30, 2016 Leave a Comment
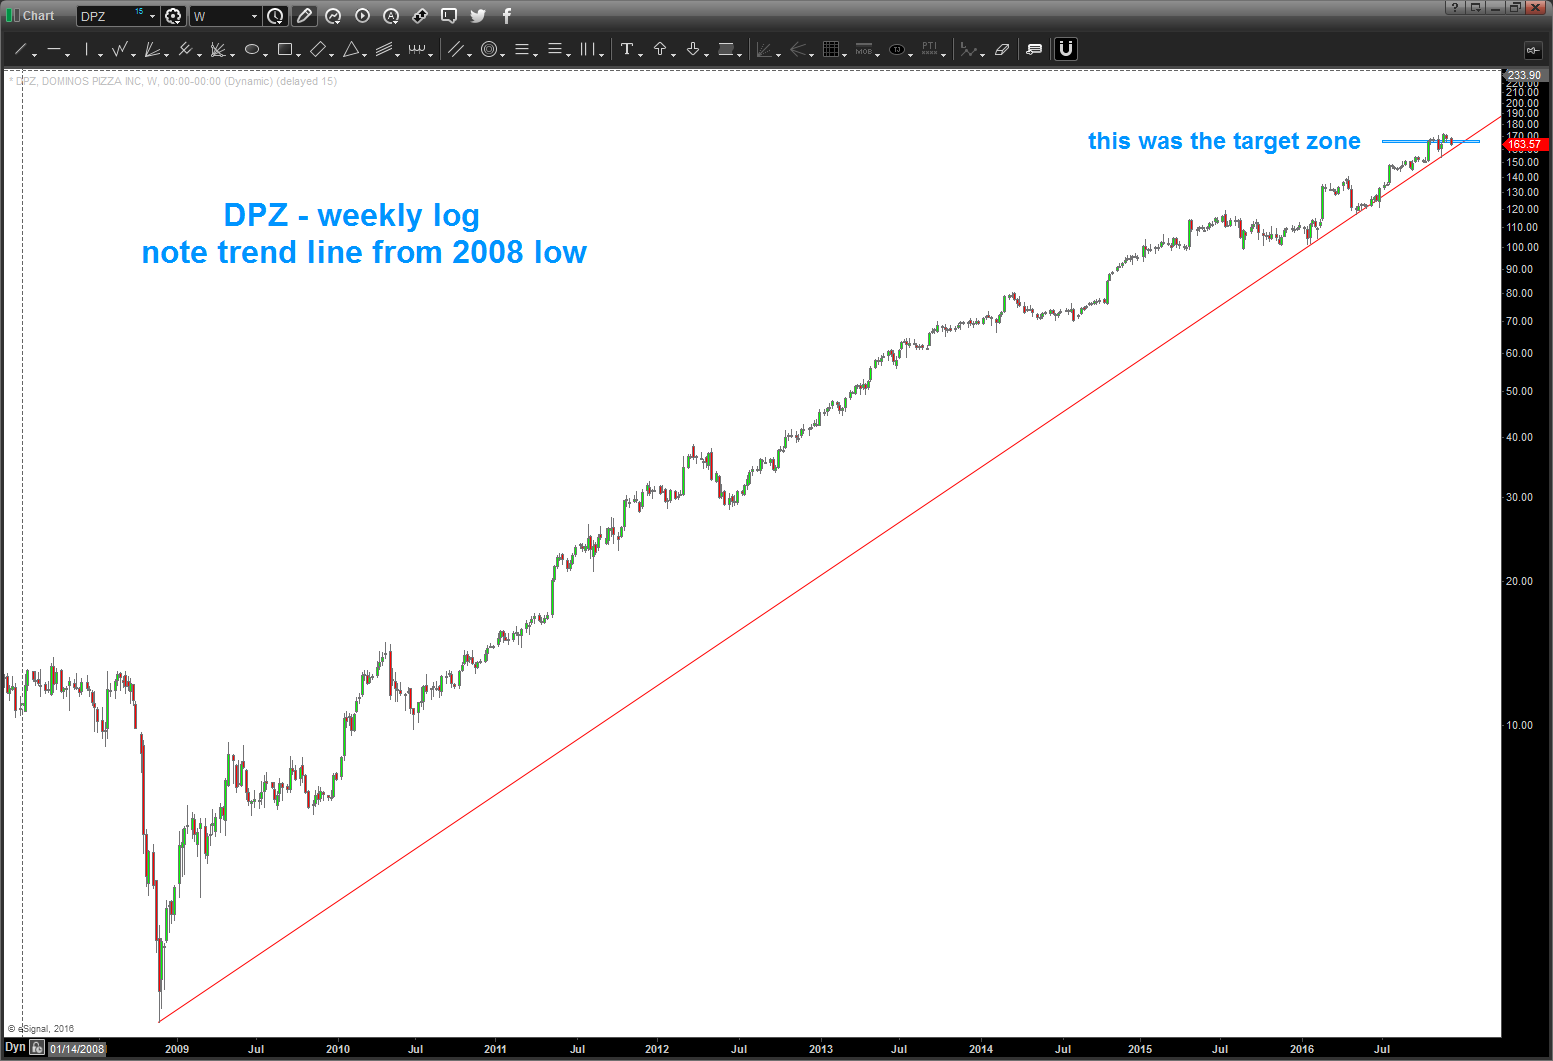
12/30/2016 – starting to flirt w/ the long term trend line .. watch closely if long.
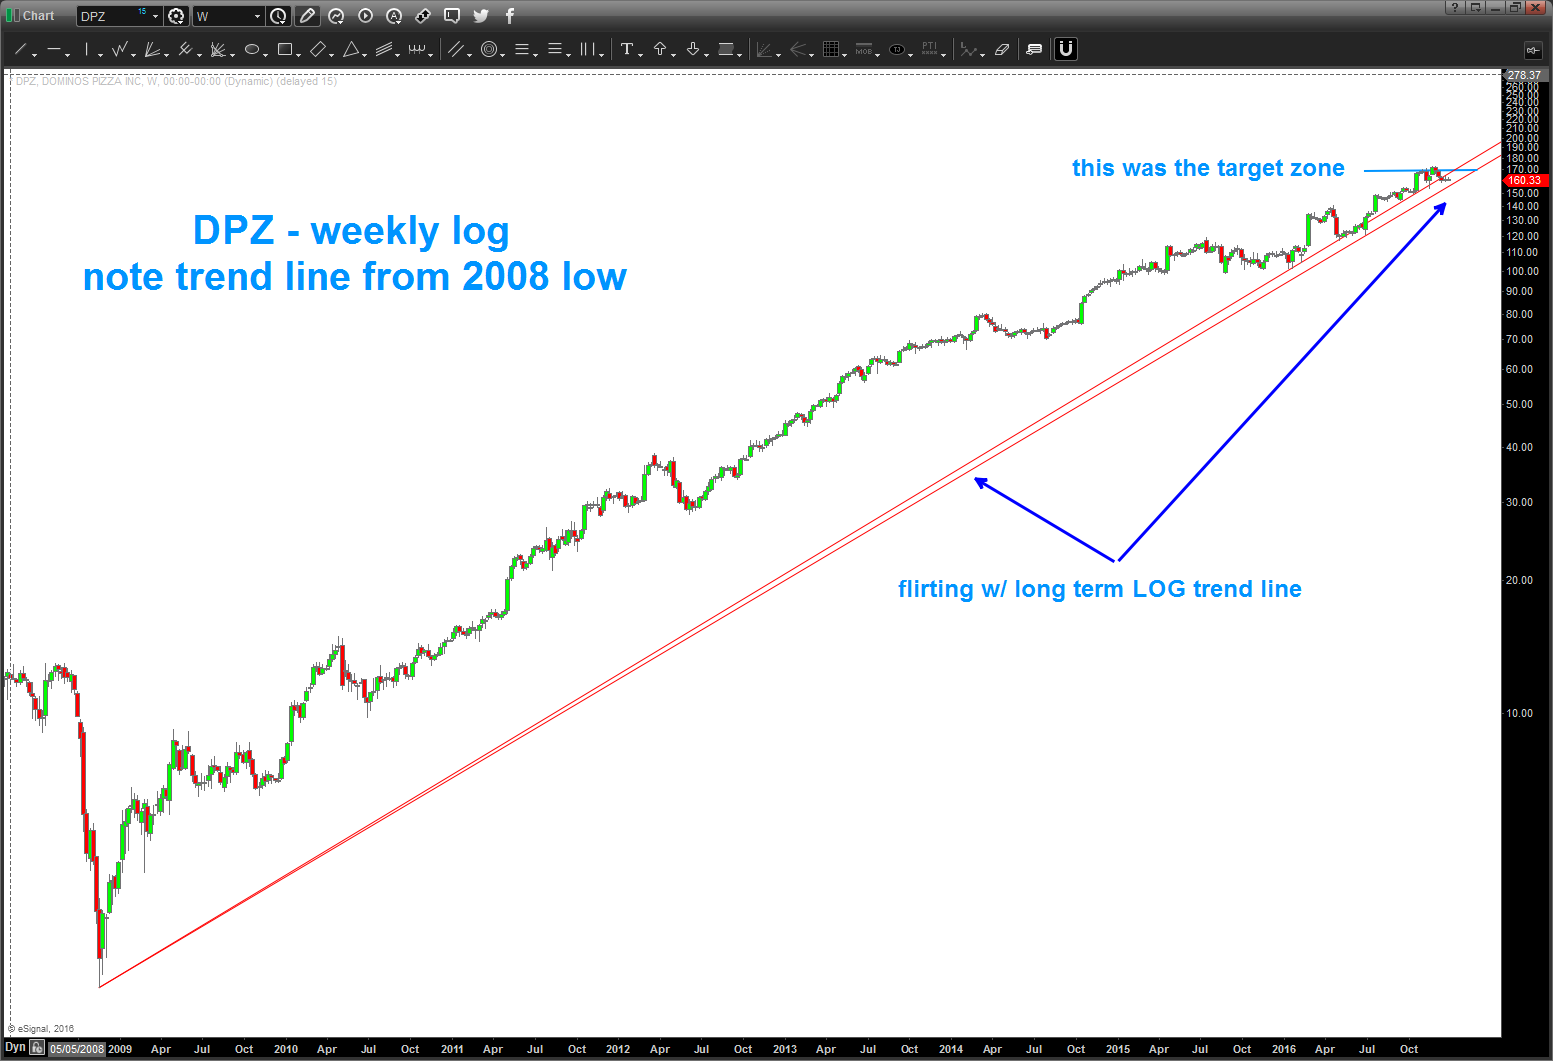
12/9/2016 – area shown in the original post was exceeded by a percentage point or two but we should be a stiff resistance w/ DPZ. Note, the long term trend line from 2009. a weekly close below this would signal the trend is weakening or done.