JPM update
Posted on November 19, 2016 2 Comments
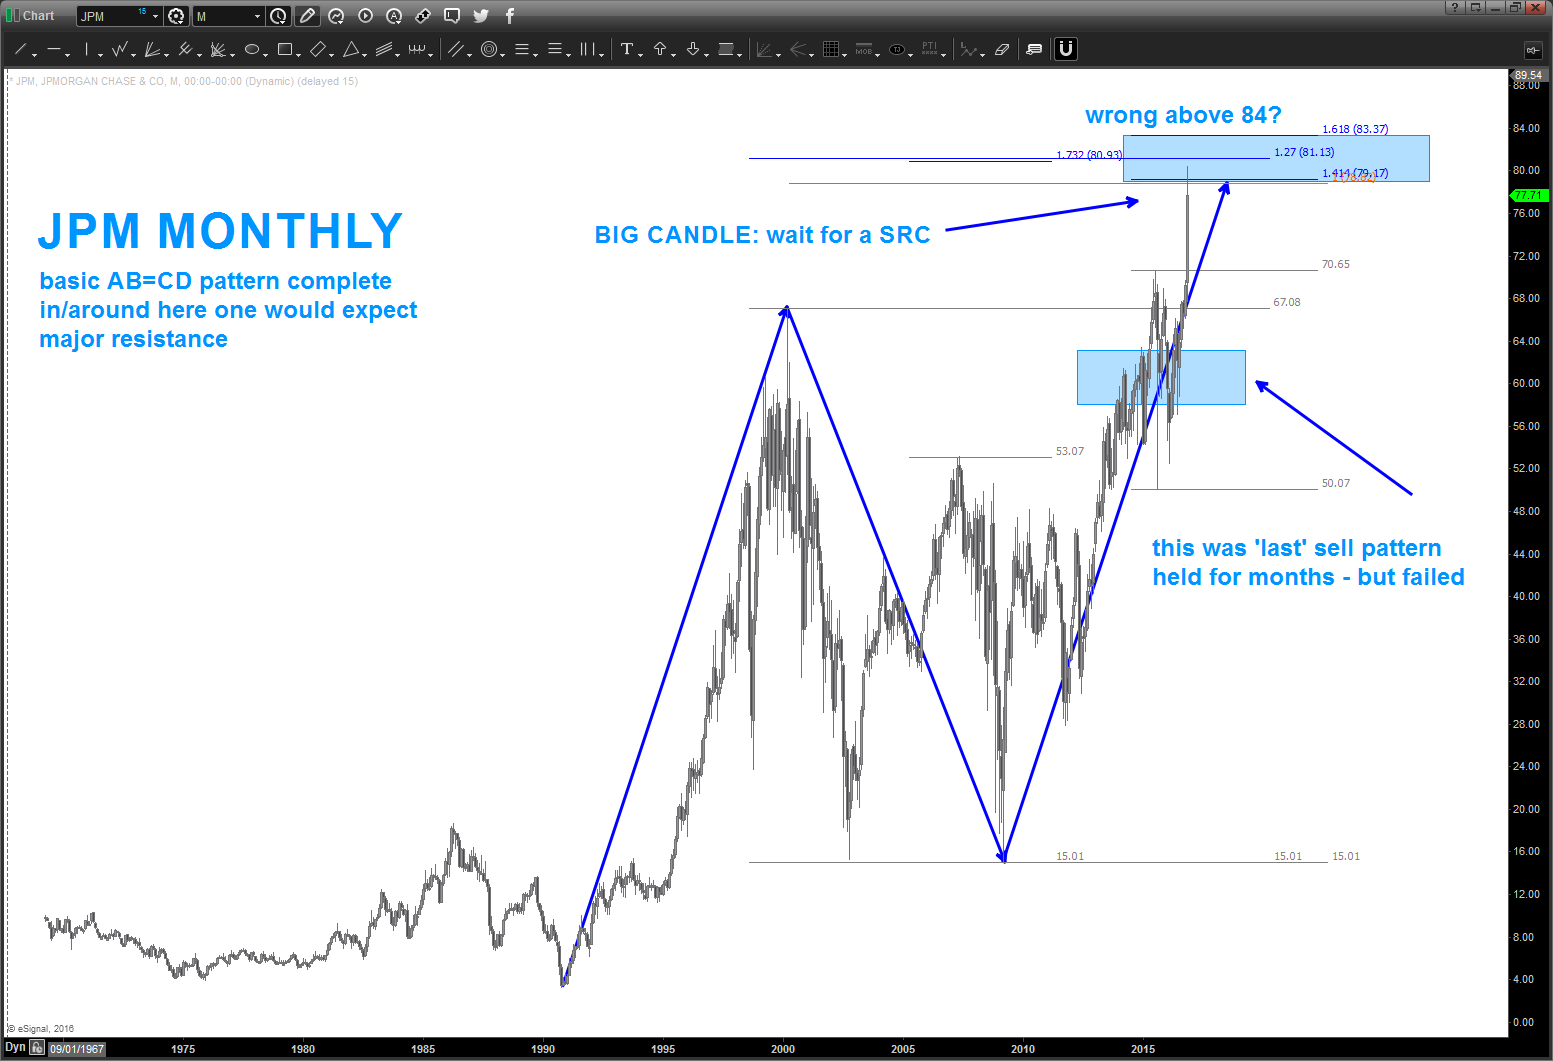
11/19/2016 – update to JPM.
the pattern in/around the 60’s caused quite the chop fest but was, ultimately, defeated.
now, since the election, JPM has vaulted out of the gate into the ‘big AB=CD’ and extension area … because of such a big candle coming into this level, it begs of caution if trying to short – perhaps look for a weekly or daily signal reversal?
wrong above 84 …
B
JPM sell pattern
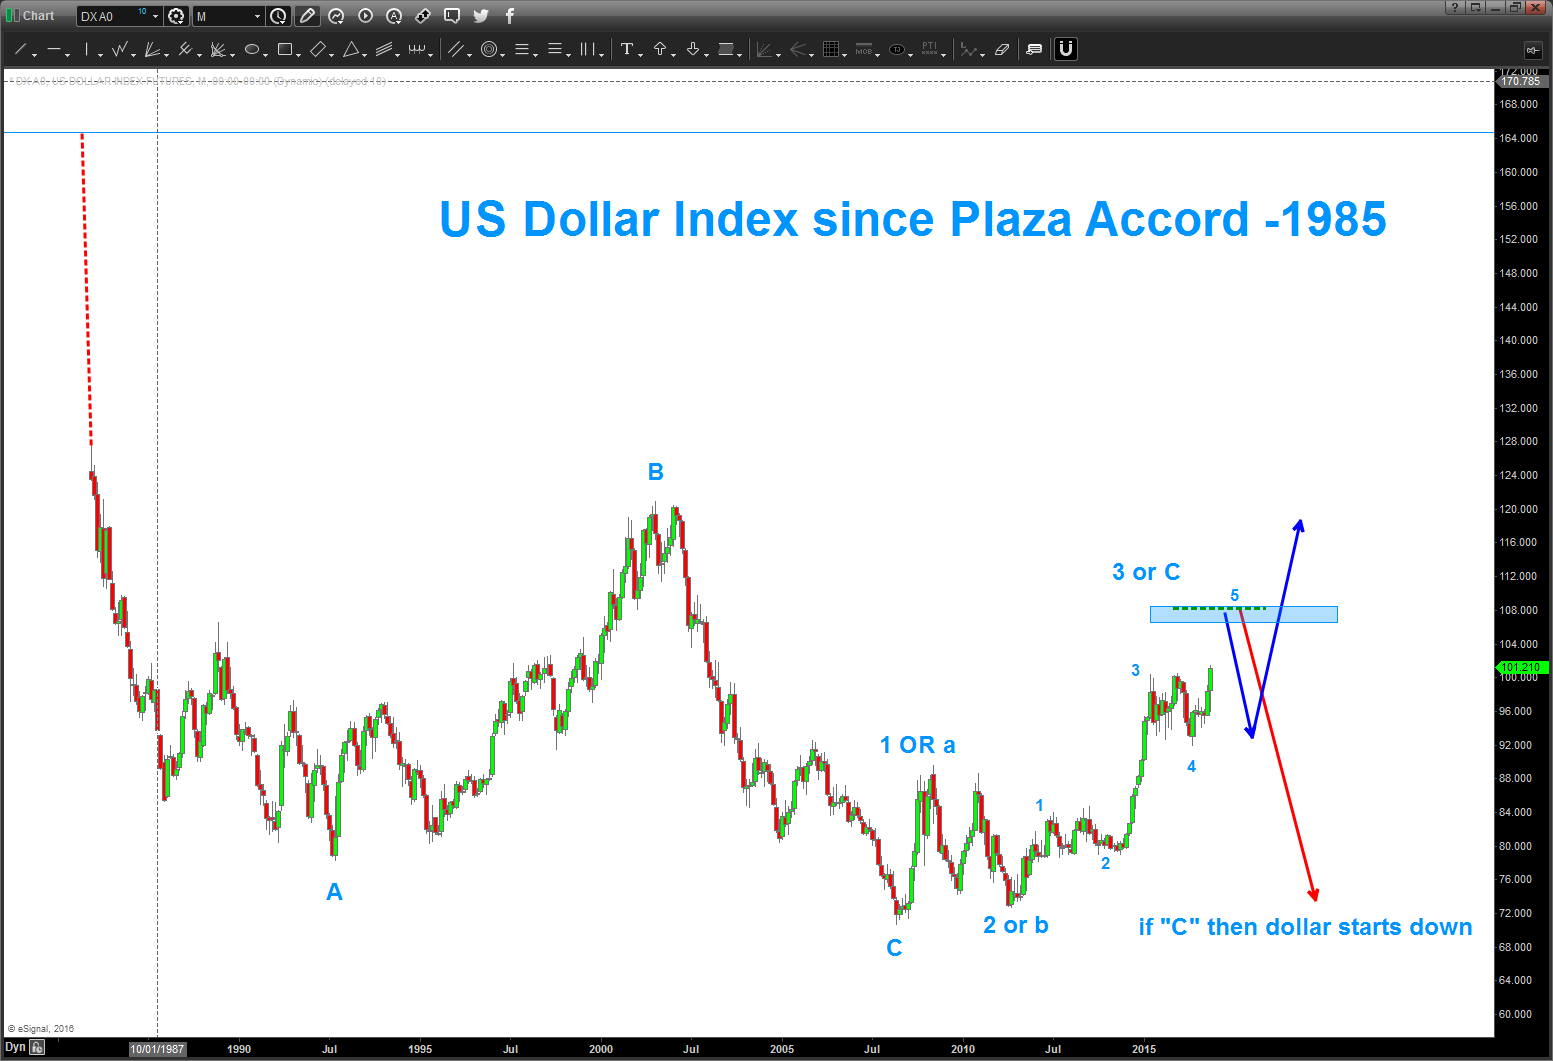
Dollar Index since the Plaza Accord …room to run, BUT (?)
Posted on November 19, 2016 Leave a Comment
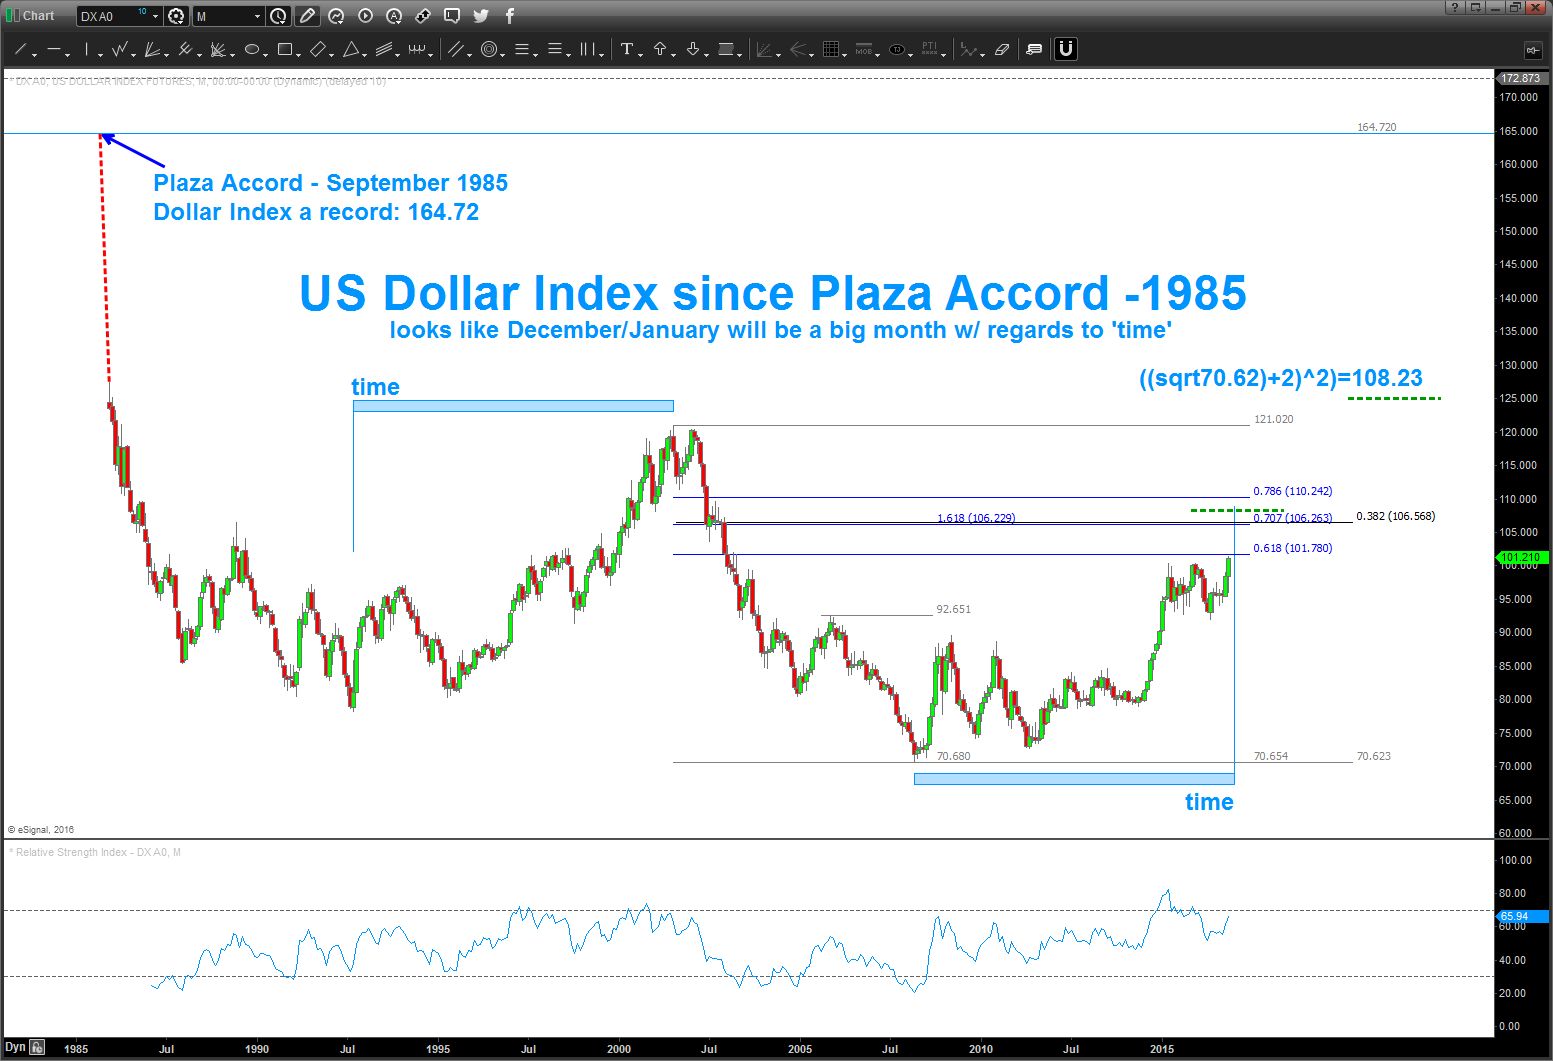
11/19/2016 – if you want to follow the Dollar posts, just search dollar on the top right area of the blog. the overall thesis, which has proven to be correct so far, was the dollar was going to strengthen all the way from the low 70’s. it’s been a nice run …
is there higher to go … yes.
but then …
here’s the picture – note, I’ve used the high from the Plaza Accord in 1985 to put the .382 retracement on the chart. That also overlaps w/ some nice other extension and retracement ratios. Believe the highlighted area in/around 107-108 is going to be key.
also, note the TIME component between the last major rally from 1992-2001. Next month, or, depending on how you draw the time component, perhaps January the Dollar Index should run into some pretty stiff resistance in TIME.
last thing is the Elliott Wave count … I always tell people – I LOVE Elliott wave – when it works. here, the count has been pretty much a “Ray Charles count” on a long term basis. I’ll try to walk you thru the importance:
- market corrects in 3 waves labeled a-b-c
- the market moves impulsively in 5 waves
- wave 2 can’t overlap the beginning of wave 1
- wave 3 can’t be the shortest
- wave 4 can’t overlap the beginning of wave 1
- if you take the low in 2008 and start working your way up we see that we are ‘clearly’ creating 3 waves into yesterdays price action.
- here’s where it gets tricky .. simply, I don’t know if this an a-b-c big corrective move OR we are impulsively going higher in a 1-2-3-4-5 sequence.
- the key here – wave c (of a-b-c) always has to be 5 waves (unless in a triangle)
- so if you look you can see the ‘small’ 1,2,3,4,5 being carved out (Turkey reference) so the blue highlighted area 107-108 COULD be the end of a C wave and the entire A-B-C move OR the end of wave 3 and we correct 4 and then off we go again in 5.
I honestly have no idea ….
Here’s what the charts are SHOWING US:
- square root target
- the ‘time’ of the last corrective move
- the ‘count’ showing we are in the 5th wave of C and 3
- EXTREME sentiment for a strong dollar
- the .382 from the all time high
- divergence set up on Monthly RSI
- ‘other’ extension and retracement targets
Expect some major resistance .. again, we are 6 handles away from the target area and that represents HUGE moves in currency .. BUT remember, right now, we are at extreme (not historic) but extreme sentiment and this has never proven to be wrong from a contrarian indicator. This puppy could snap back on you really really quick.
only TIME will tell … let me know if you have any questions.
B
Emerging Markets Sovereign Debt ETF PCY
Posted on November 15, 2016 Leave a Comment
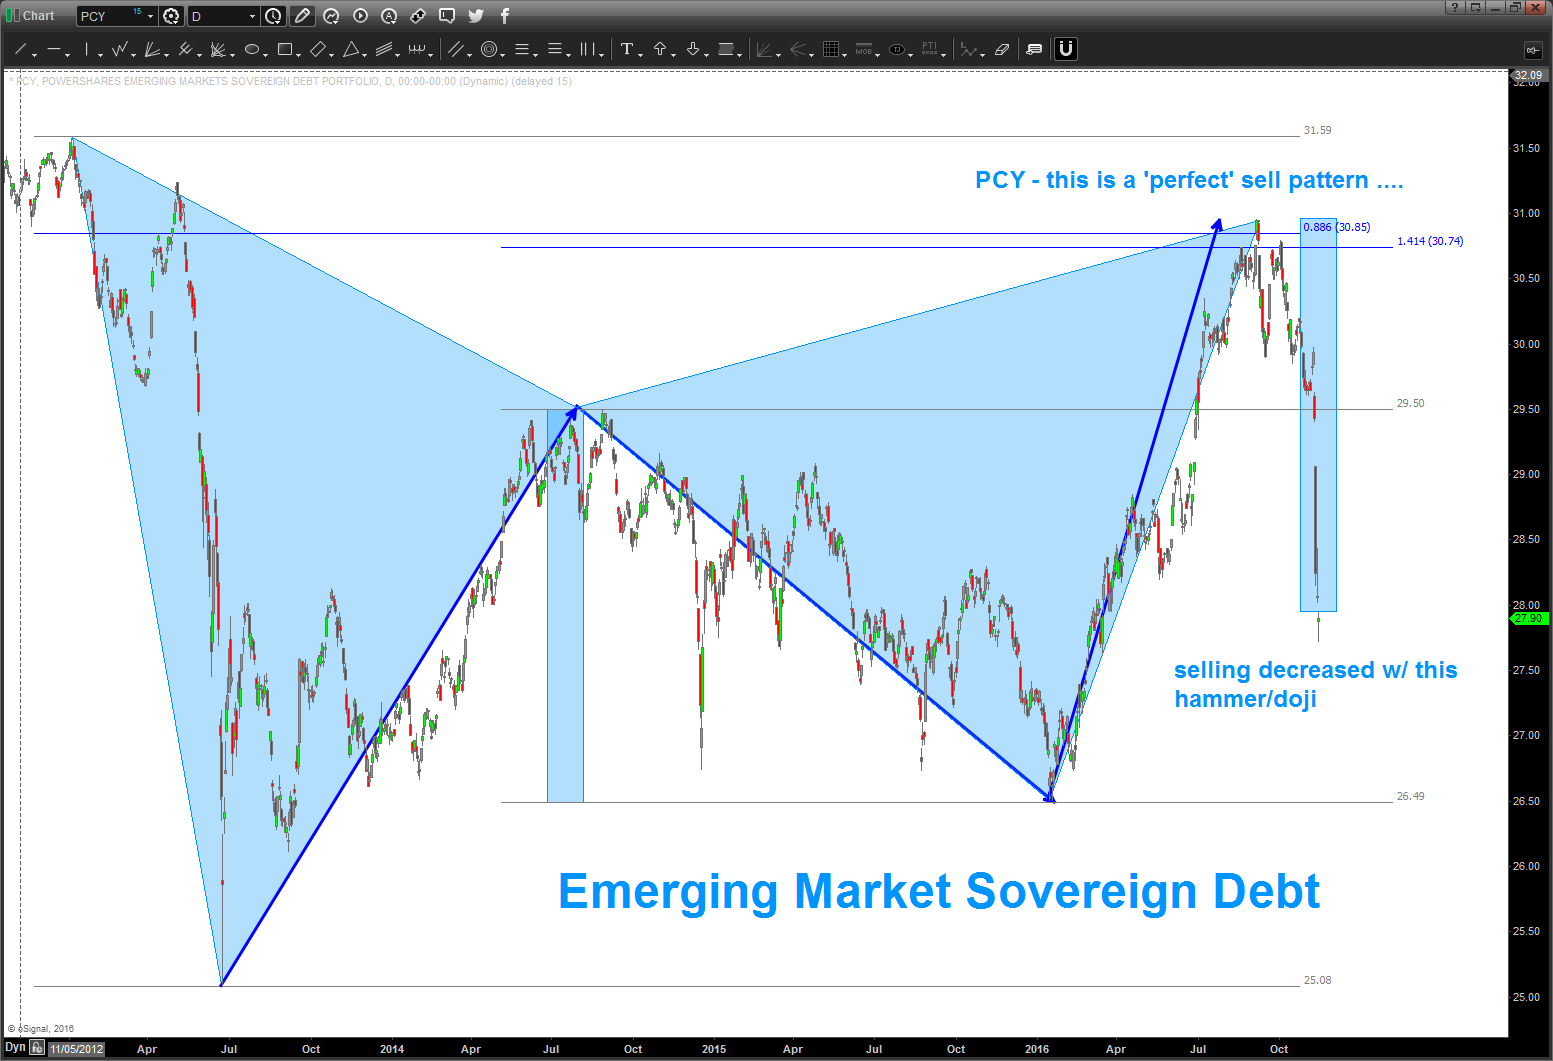
folks, so I was asked to take a look at this ETF. I had never looked at it before … but man, what a gorgeous sell pattern. This one worked….looks like the banking index sell signal. some work some don’t – use a stop.
anyway, here’s the PCY Sovereign Debt ETF .. the weekly shows a cliff of support much like crude a while ago before it thumped. the selling pressure appears to have stalled for now (note doji) but it ‘should’ go to 24-25 and that’s where the real fun begins.
one could say the neckline for this entire thing is at 27 or 25 … either way, see the big old thump forming?
let me know if you have any questions.
B

Housing … just keep your head in the sand OR are the clouds forming? UPDATE
Posted on November 14, 2016 Leave a Comment
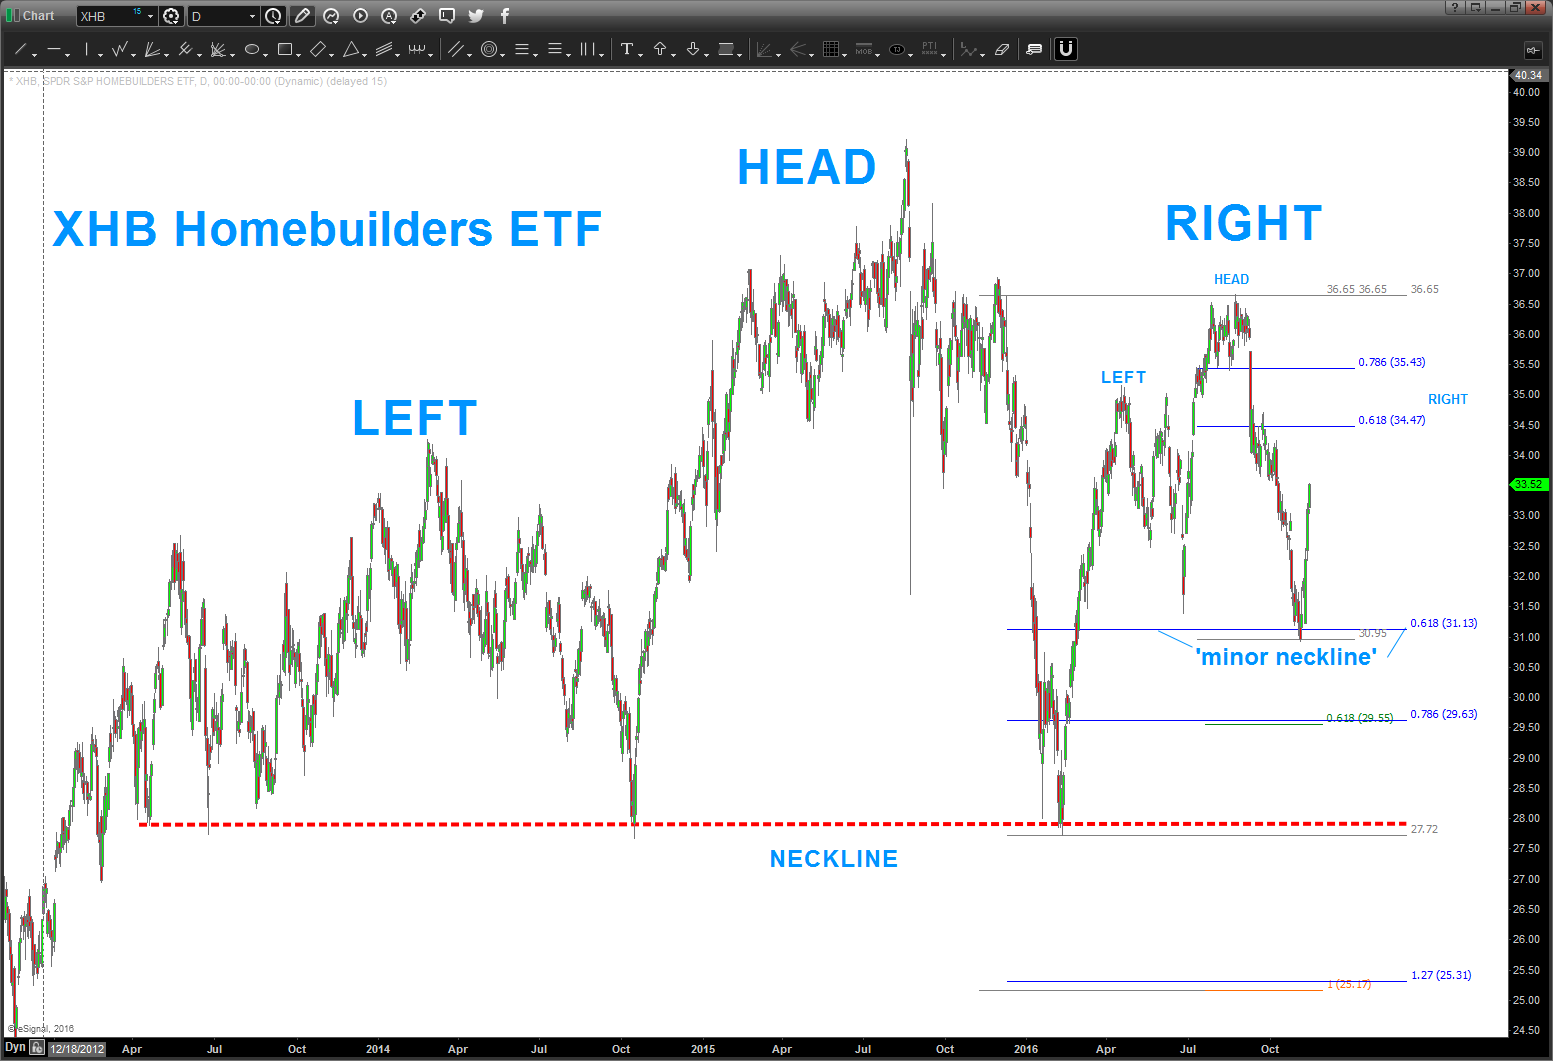
11/14/2016 – since the Election, the XHB ETF has taken off like a rocket ship. You can see below that it hit the .618 retracement from the Spring low of 16′. Upper targets are being shown in around 34-35.
were still working w/ the thesis that the 39 level was the completion of a major sell signal for the homebuilders. This straight up action of late is something to watch closely for this thesis to hold.
of note, a friend of mine sent me this headline:
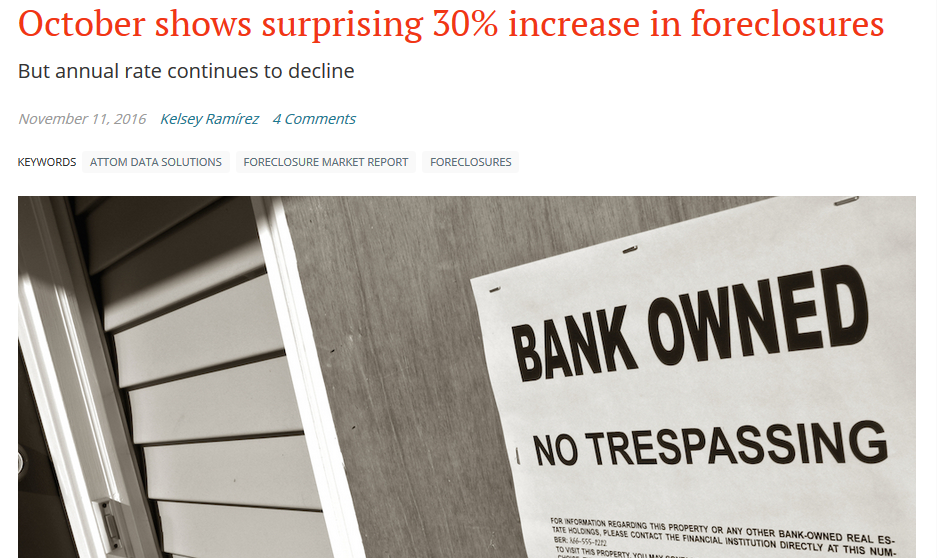
the rise in foreclosures last month was the highest since the big crash. Something to note .. however, the annual rate is still declining. Is this a divergence forming and a potential inflection point? I don’t know … but price/time will tell us.
Bonds are getting smoked of late causing rates to rise …
For those who have followed me you know that I’m usually ‘first to the party’ and ‘see’ things months if not a year in advance. that’s what patterns tell you … i’m not trying to put any spin on this folks. We are at ZIRP, I have houses all over the place going into standing inventory status, rates are rising and we just had a ‘big’ increase in foreclosures last month. Remember – almost a year before anyone paid attention to the Chinese Yuan I saw the BIG JUMP and said … this is something to notice. (https://bartscharts.com/2014/12/06/most-important-chart-to-end-2014/)
So, that’s all I’m doing again ….
Also, take notice of the big time SELL PATTERN FAILURE on the Banking Index. Multi-level chess game going on right now … trust the patterns and they will all line up. That I know …
Do well, be good and rock on, always.
Bart

I sold my house in VA and moved out to SoCal to rent .. did it for a number of reasons. The NUMBER 1 reason was to learn how to Stand Up Paddle-board Surf and enjoy the weather. YES, I understand it’s financial suicide out here .. the taxes are crazy, the cost of living is crazy but the surf is good man …
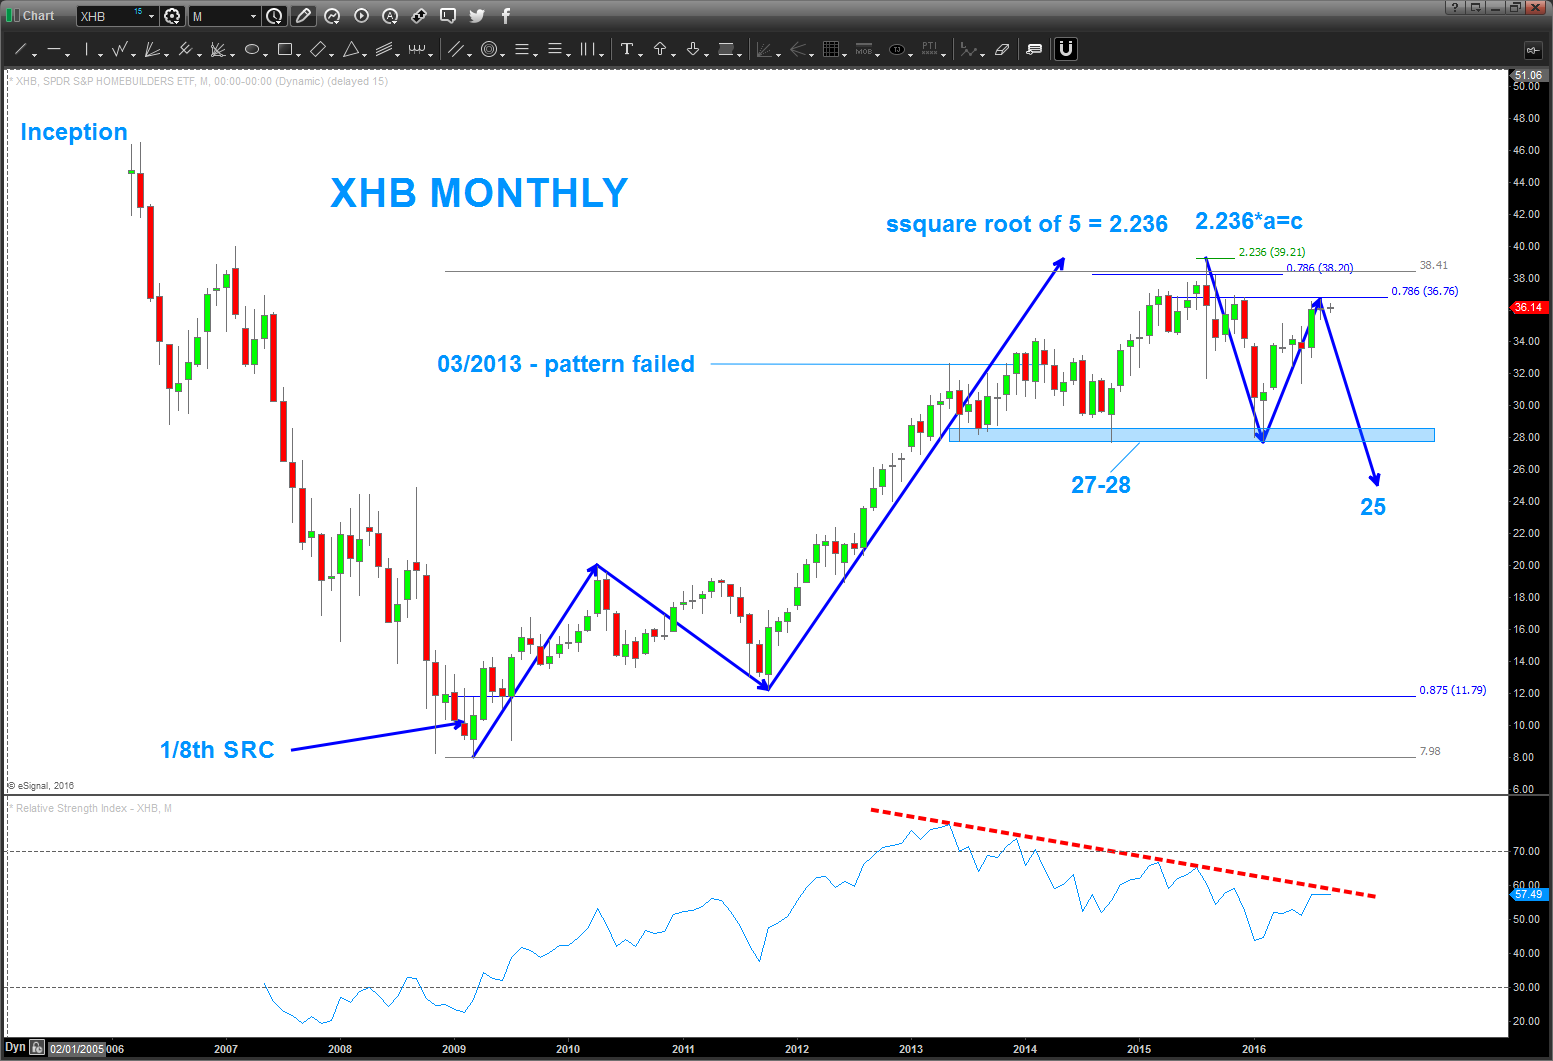
I was SO HAPPY to unload the house … why? Well, I think we are on the verge of another big old smack down in housing. Of note, my post from March 2013 (yes, 3+ years ago that the home builders had topped in/around 32 did not come to fruition. In essence the pattern failed .. so, it went up to the .786 and also completed the 1/8th signal reversal candle. Now, we’ve rallied right back up to the .786 level and are at the demarcation point.
Study:
- this ETF doesn’t want to go below 27. Big support …
- also, note the AB-CD projection down to 25.40 – if we crack from here expect support there and if BULLISH this will hold and bring it to new highs. If it fails … watch out below.
- THOSE are the levels to watch …
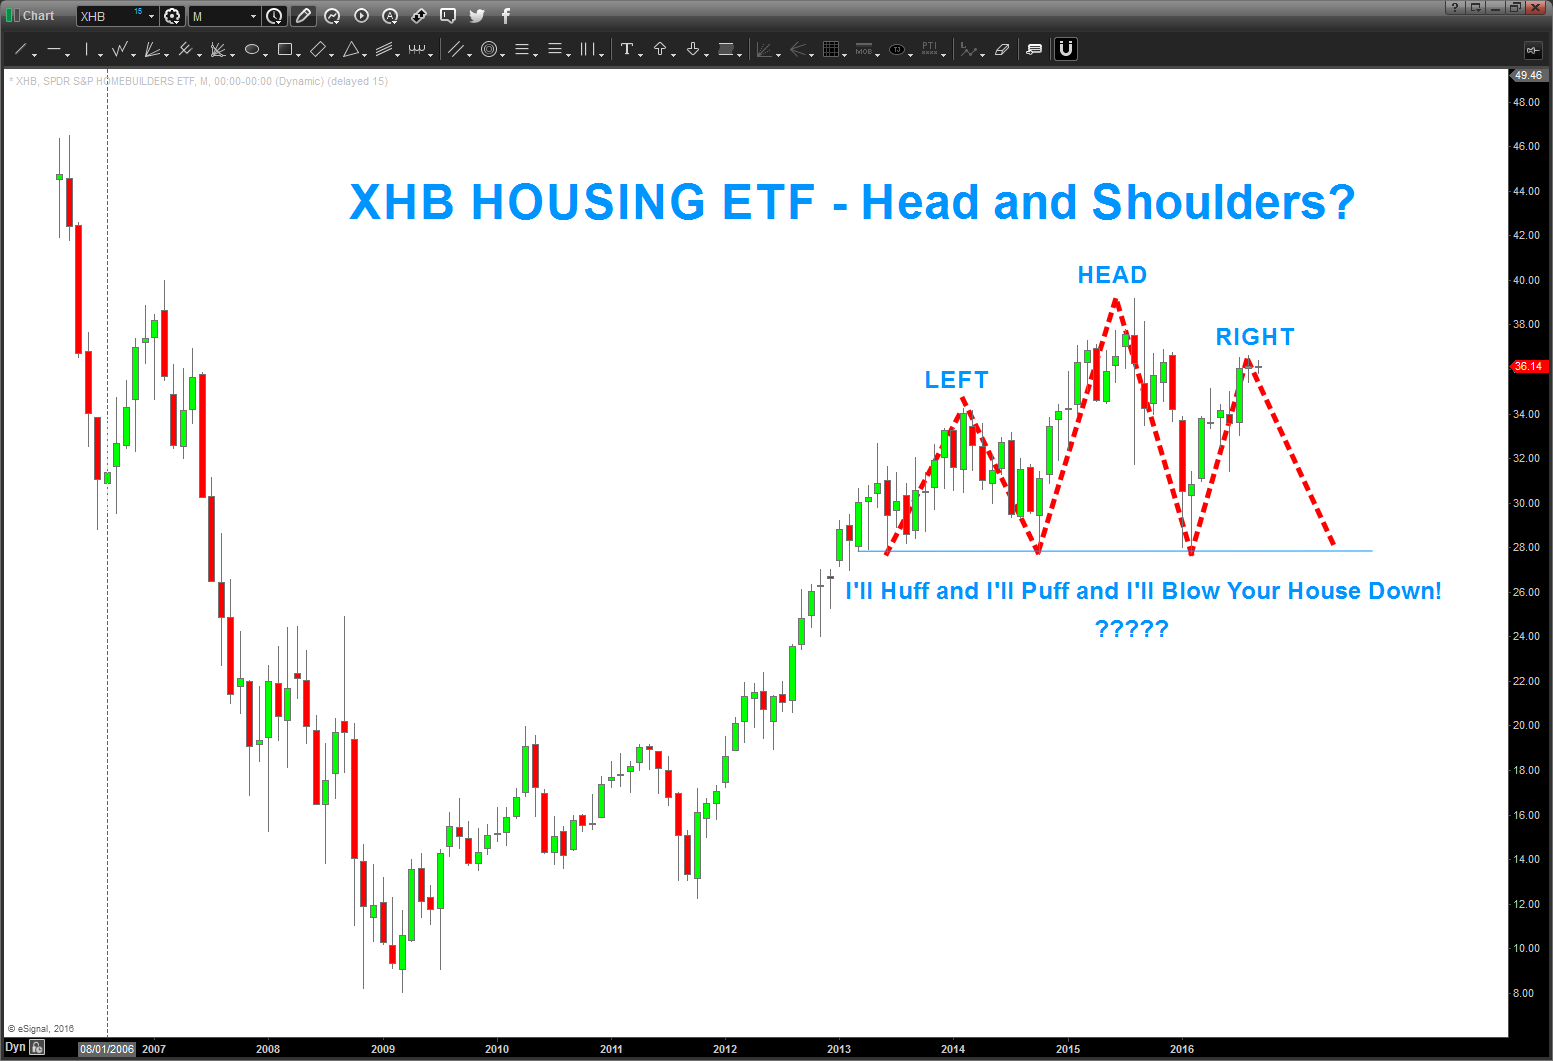
- sure looks like a MONTHLY H&S pattern for this ETF … doesn’t it?
To finish the story about San Diego … I was driving around the other day and noticed TONS of standing inventory …plus the houses were selling for 850K to 1.0 + MM. Folks, that dog don’t hunt man …
Also, the PATTERNS suggest a MAJOR top in bonds which means higher rates … so, it’s been 3+ years since my last post on home builders. It’s moved, a little, perhaps it will move more, but man this sure looks like a BIG top is coming in housing ….

Here’s the Home Construction and Home Builders ETF (ITB and EHF)
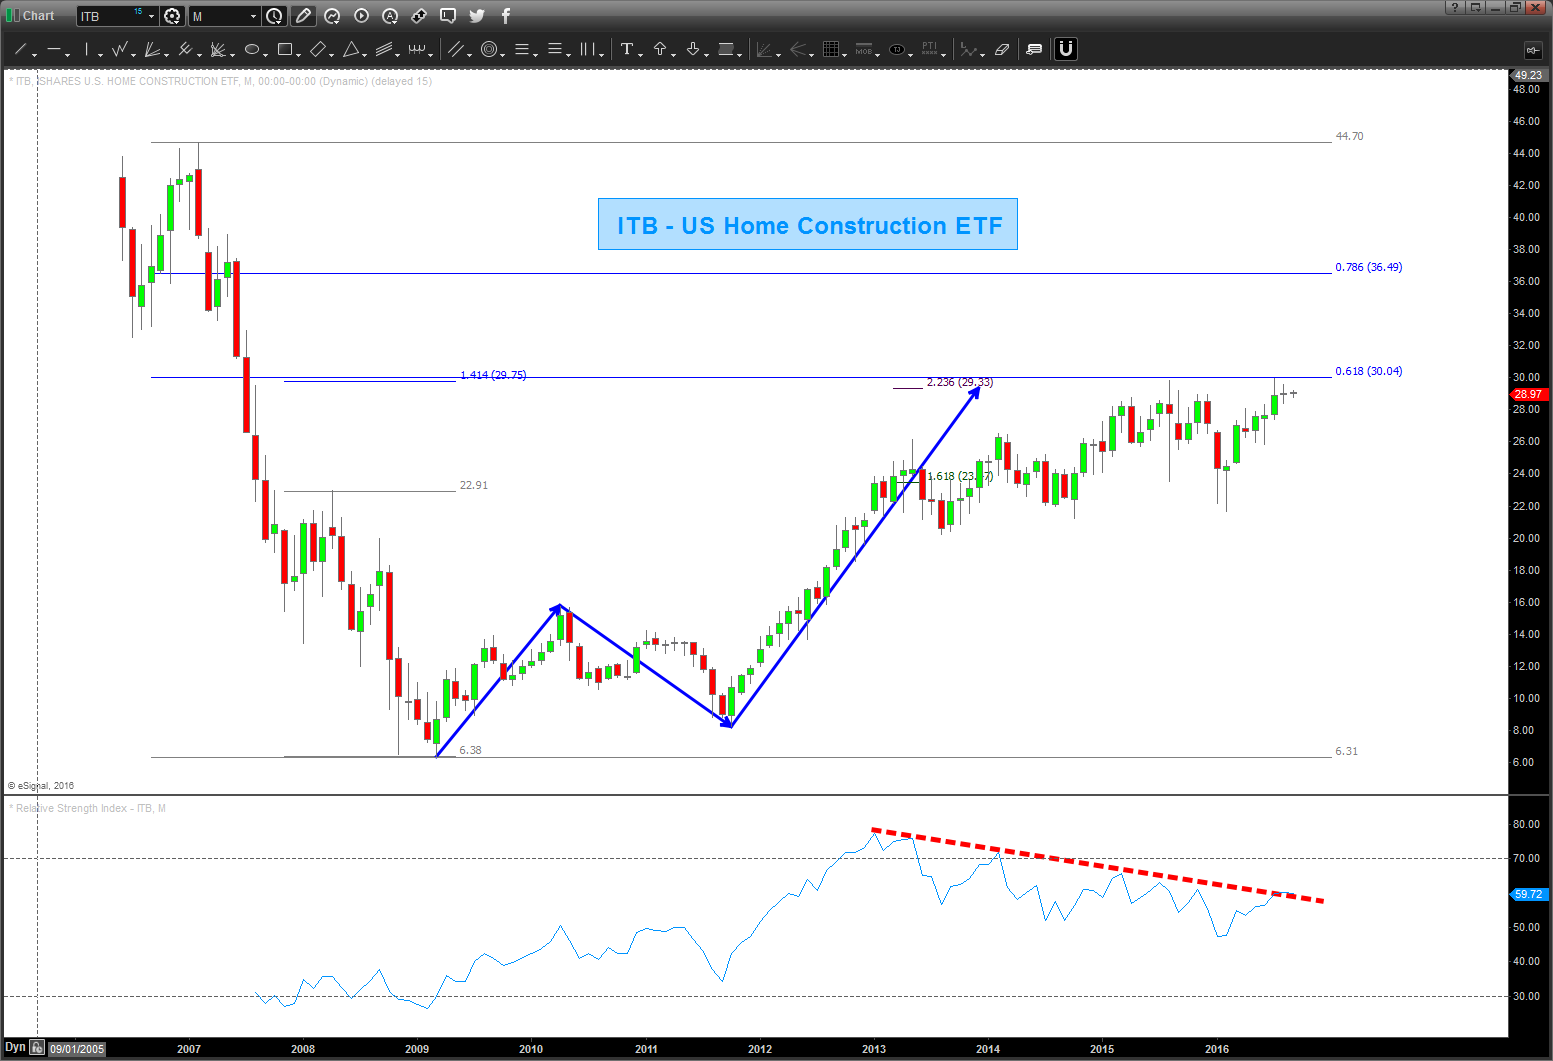
Again, folks, it’s just PATTERNS. Sometimes they work, sometimes they don’t … but at least we have some guides to support what could (could being the operative word) a BIG OLD THUMP in housing …
Bart
LONG BOND since 1981 UPDATED
Posted on November 13, 2016 Leave a Comment
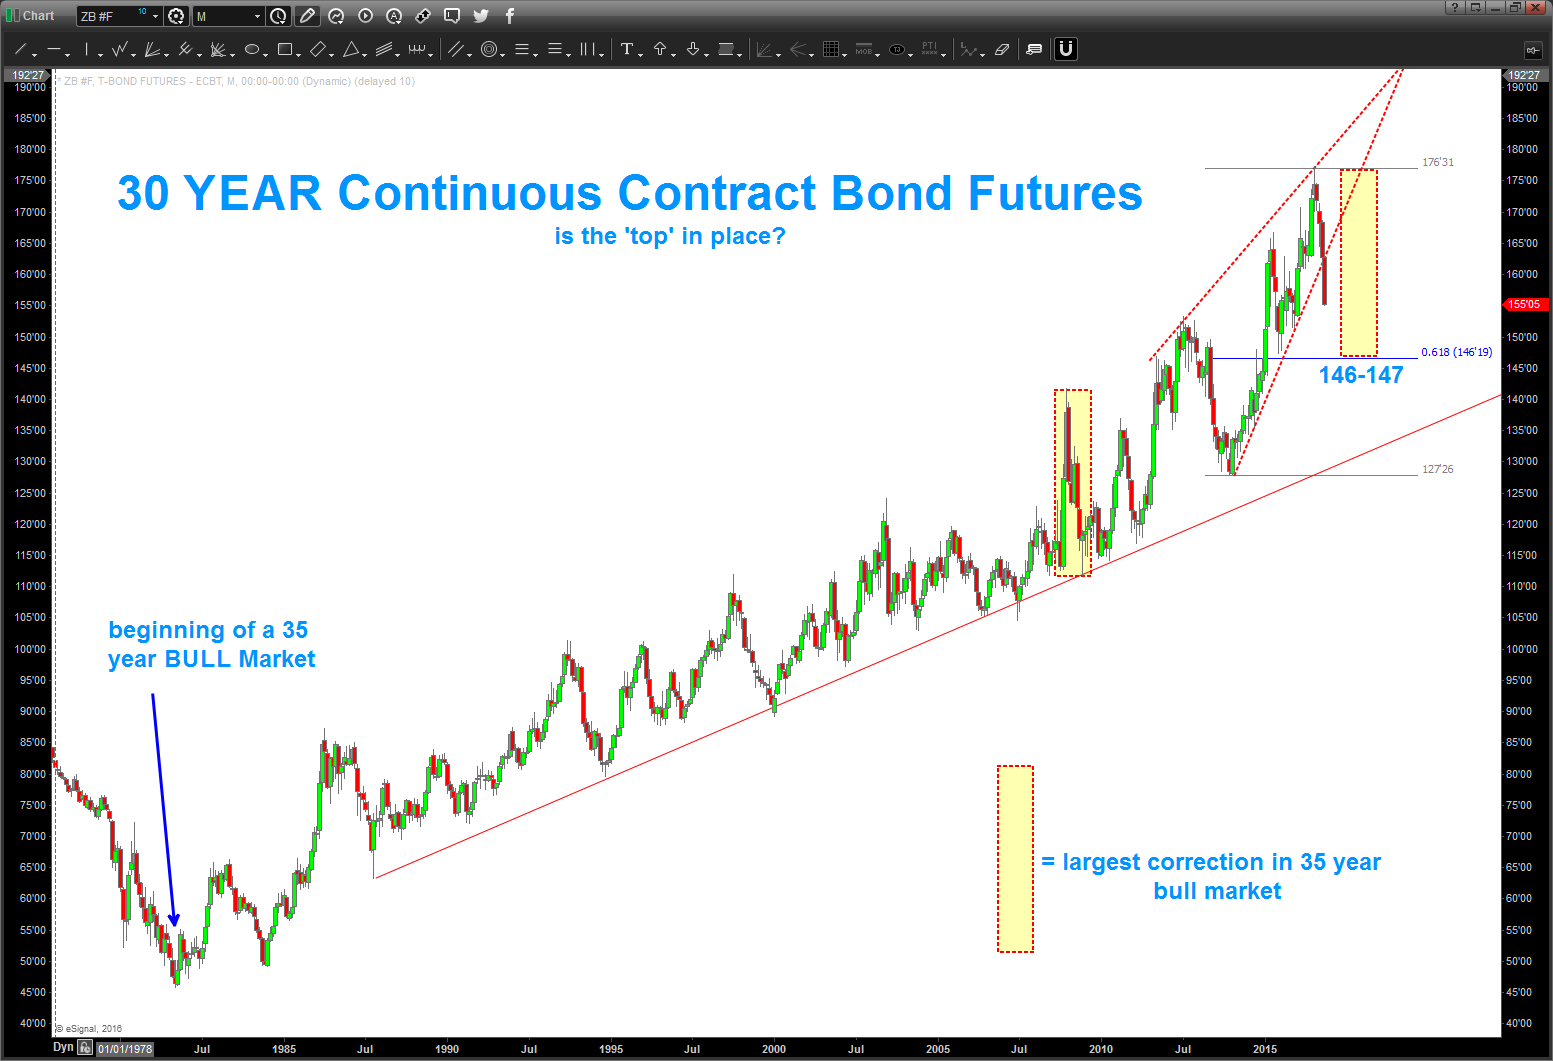
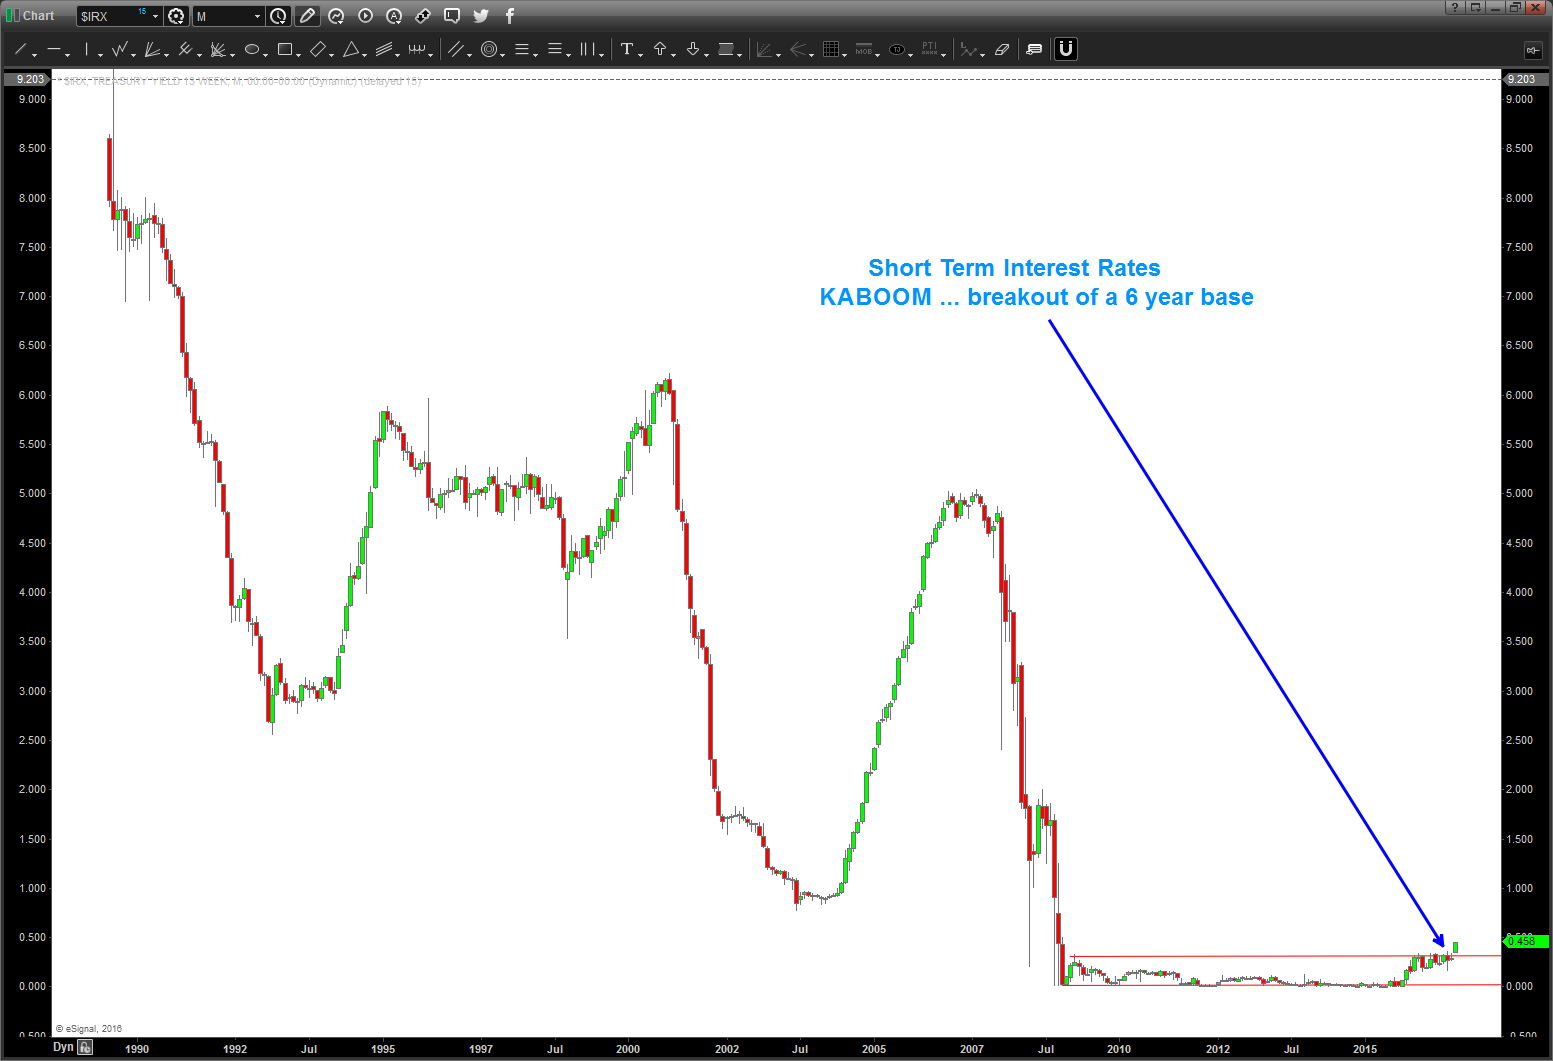
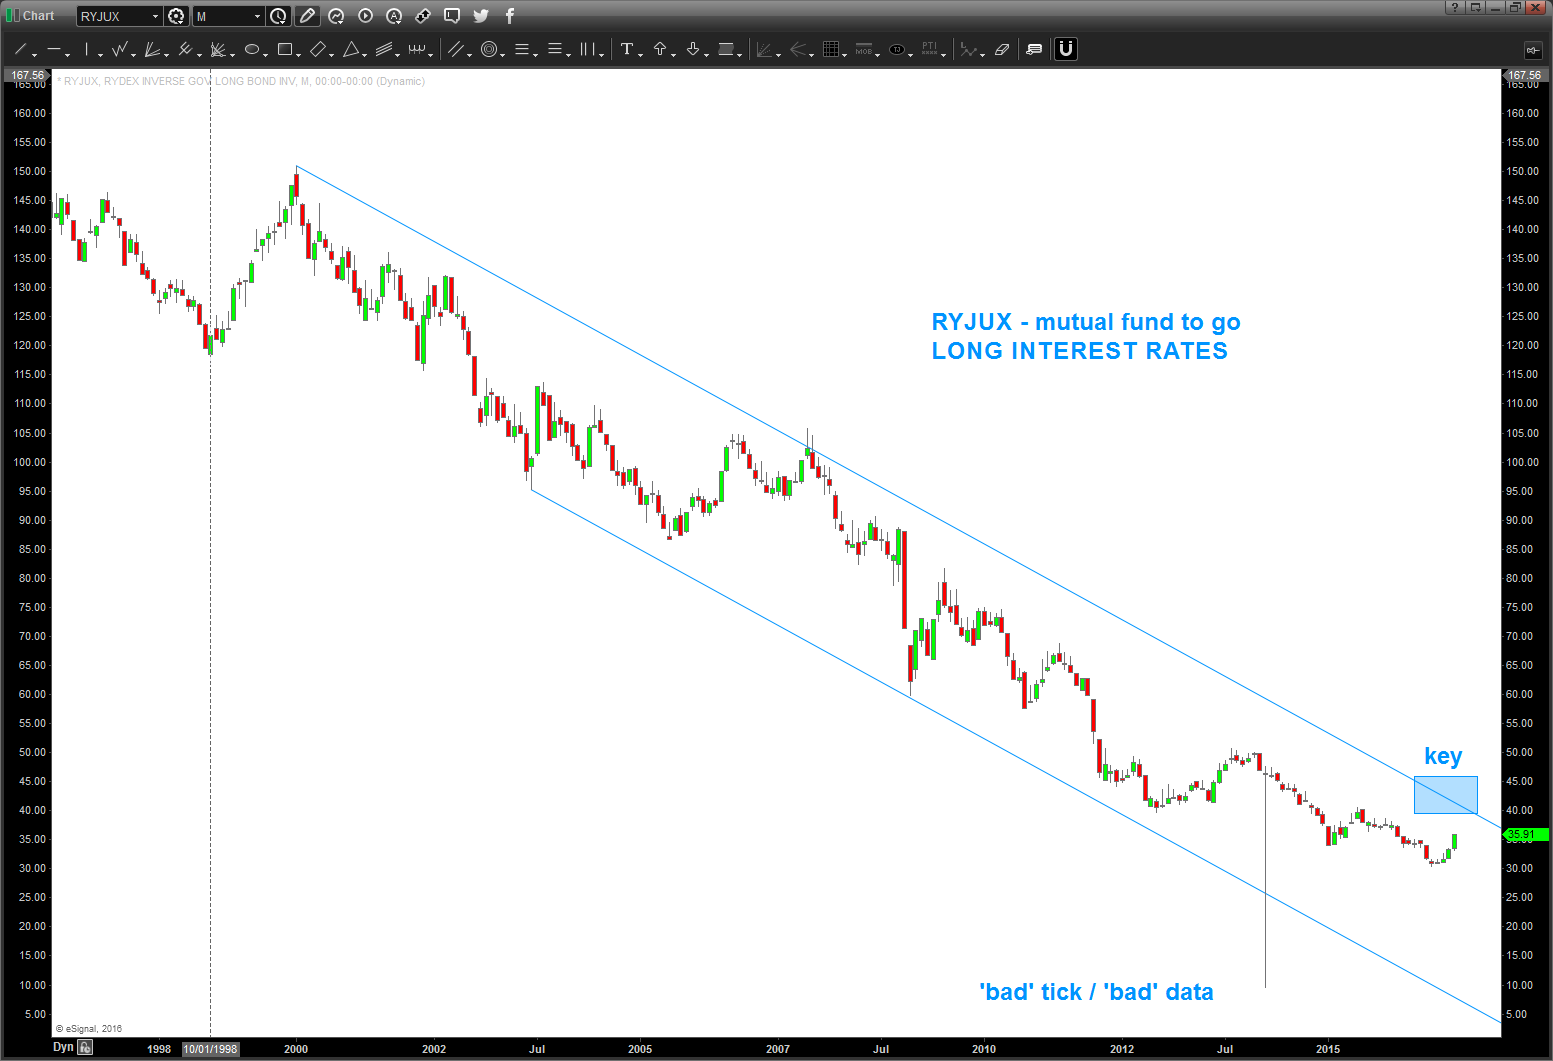
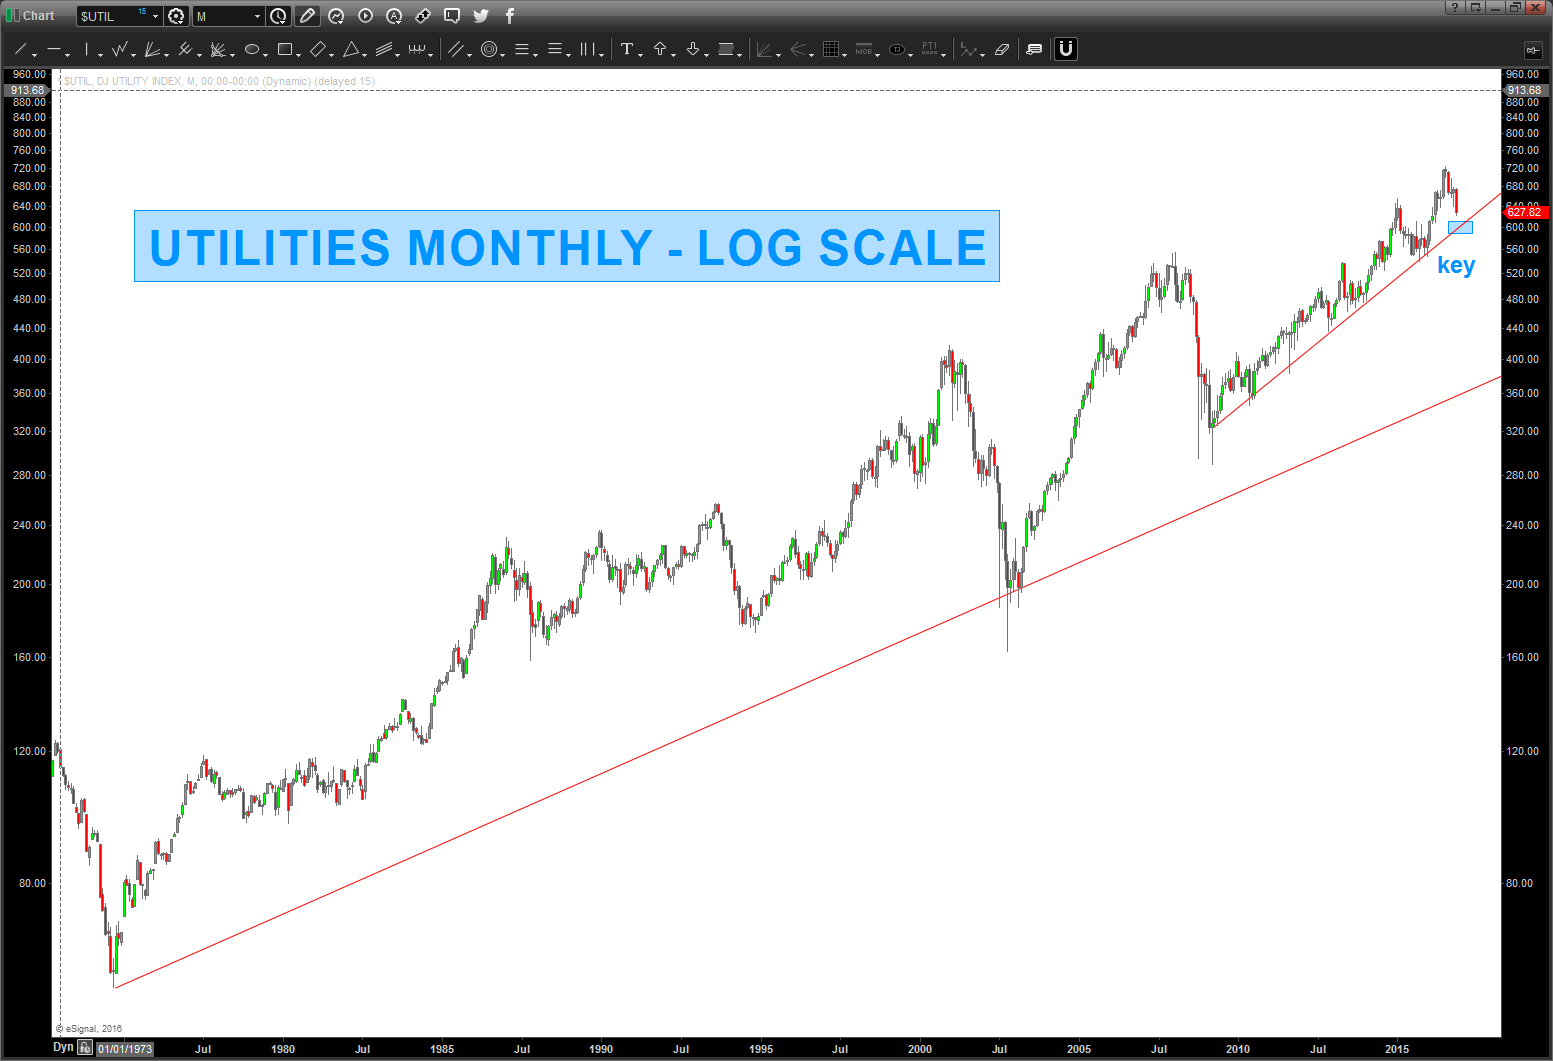
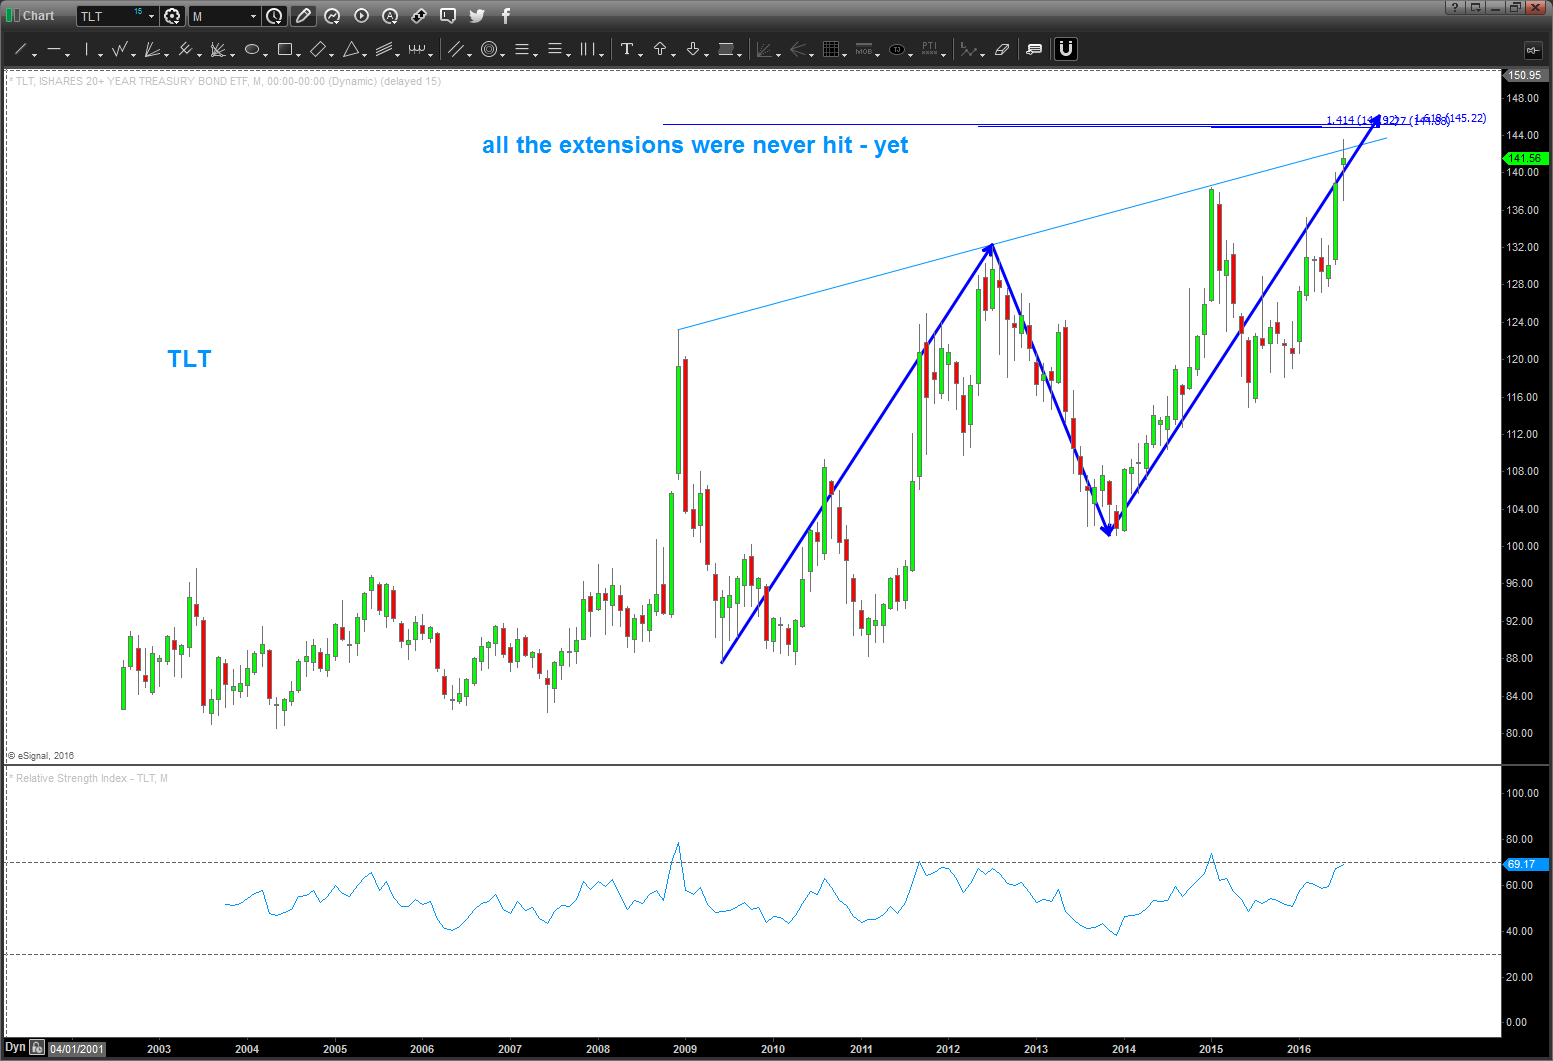
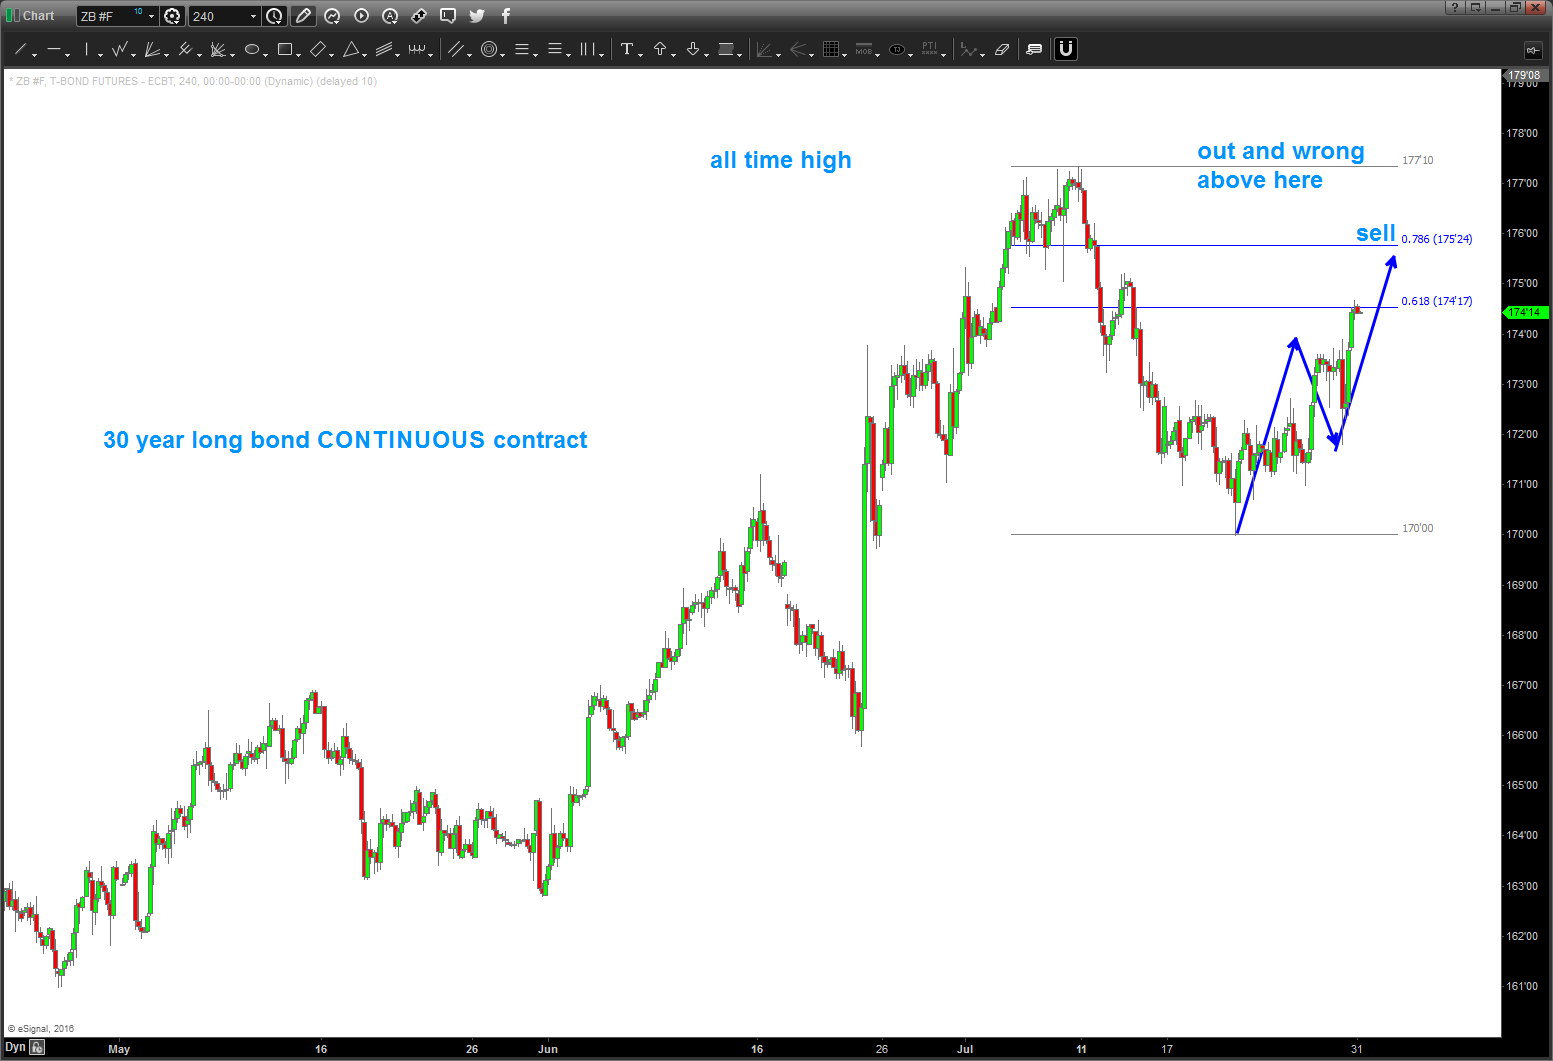
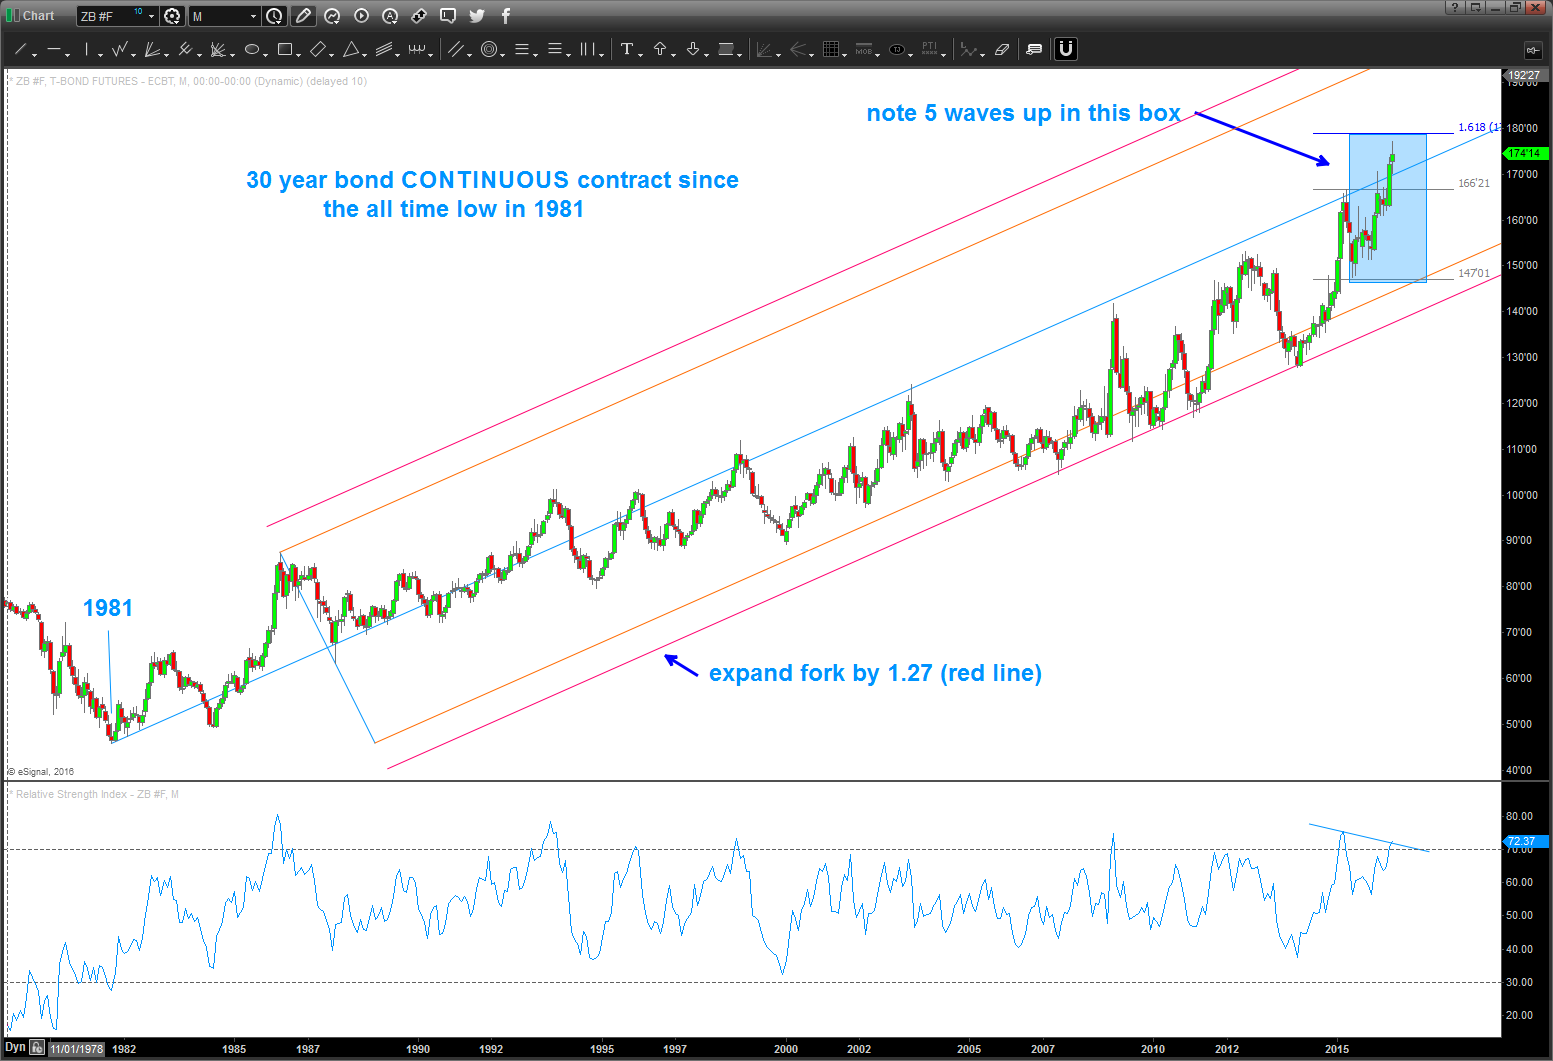
11/13/2016 – as you can see below, back in July I did the post for @seeitmarket and also here on the blog about a ‘potential’ top / resistance on the bond complex. the targets were hit and, since then, the bonds have been sold and, just this past week, have accelerated to the downside. am updating the charts of the Long Bond, TLT, $IRX, RYJUX (mutual fund to go long rates), Utilities, 10 year. it took some time to unfold and a pattern failed earlier in the year but this one certainly is putting probability in our corner that we MIGHT have a ‘generational’ high in bond prices. as always, stay tuned …
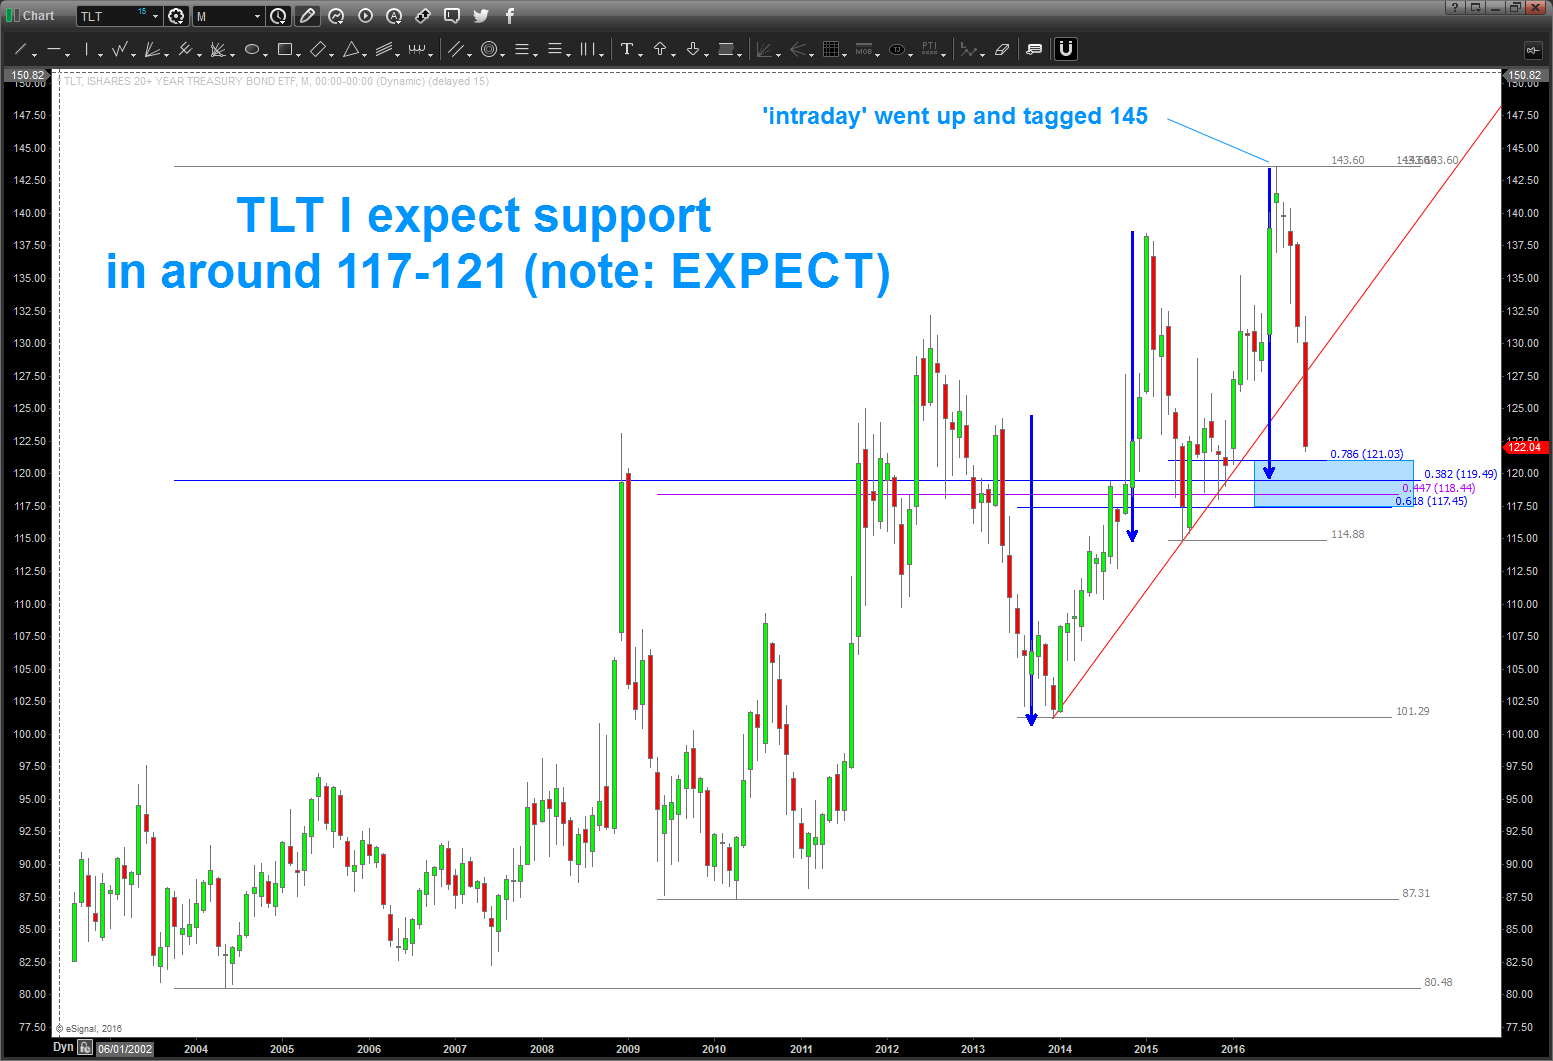
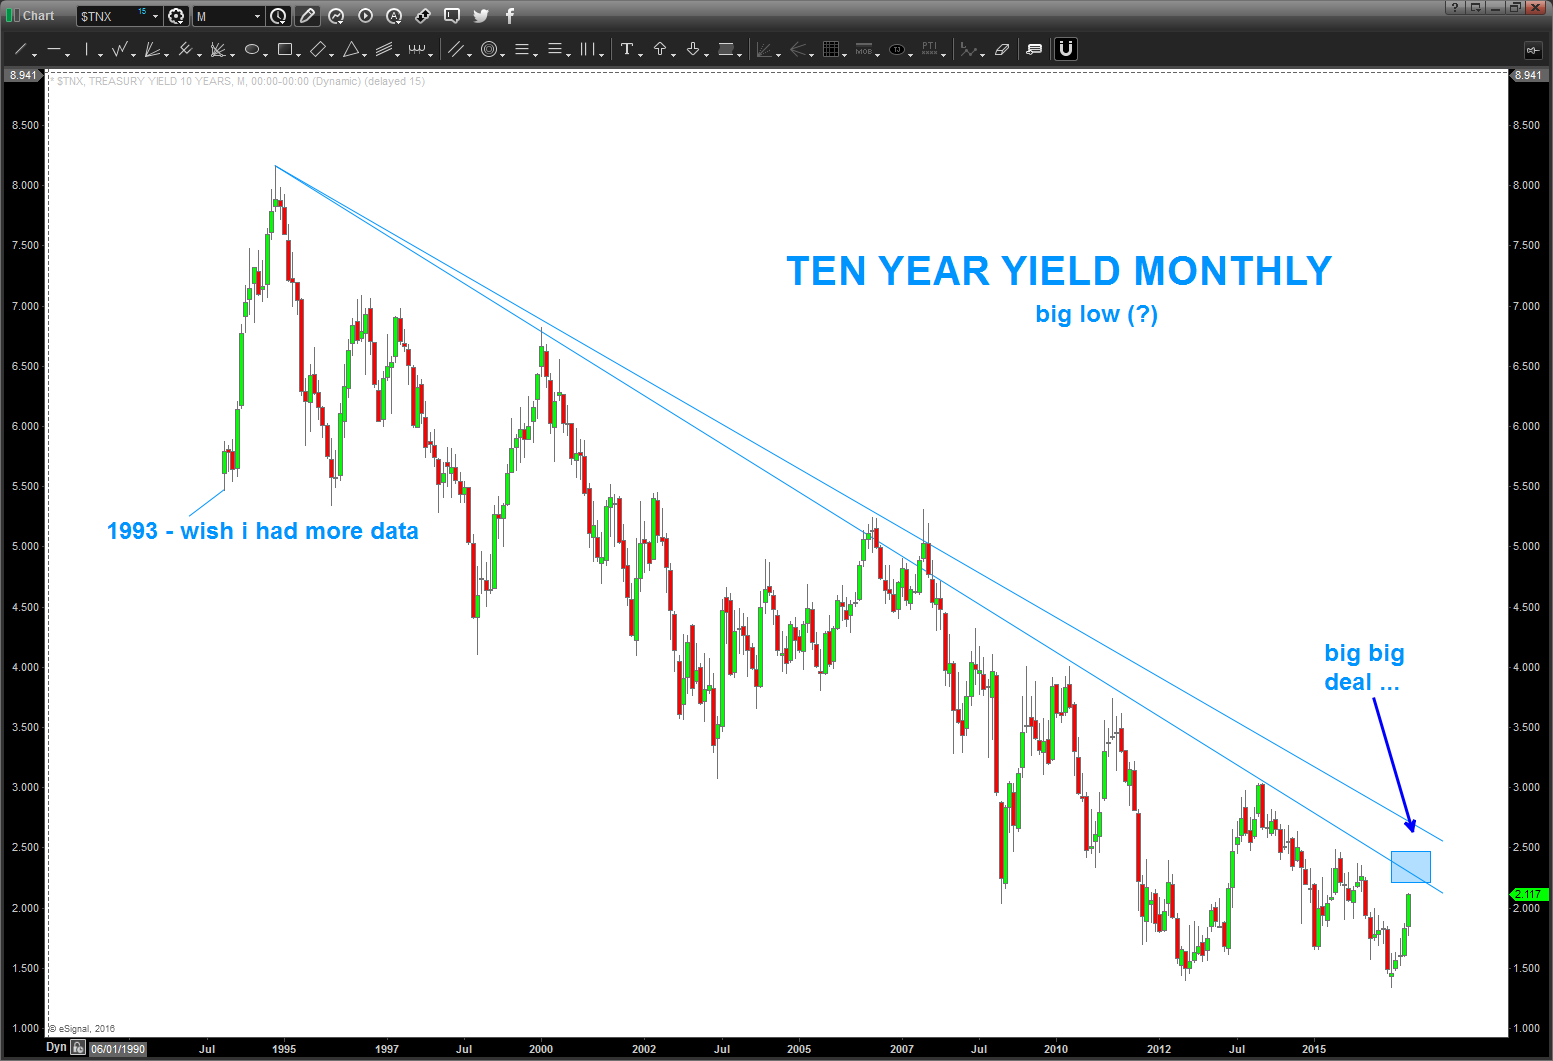
i did this post for @seeitmarket around the TLT (long bond (20 year +) ETF: http://www.seeitmarket.com/tlt-price-target-view-treasury-bonds-stretched-15862/ and the targets around 145 still loom ….
so, here’s the long bond and the TLT charts ….not trying to “call a top” just find patterns. could they keep going higher? well of course ..but man, this is really getting quite crazy now, isn’t it?
note, on a monthly you can see 5 waves completing (30 year continuous) and that should mean a pullback but is it the 5th of the 5th? who knows …
$PCLN update 11/12/2016
Posted on November 12, 2016 Leave a Comment
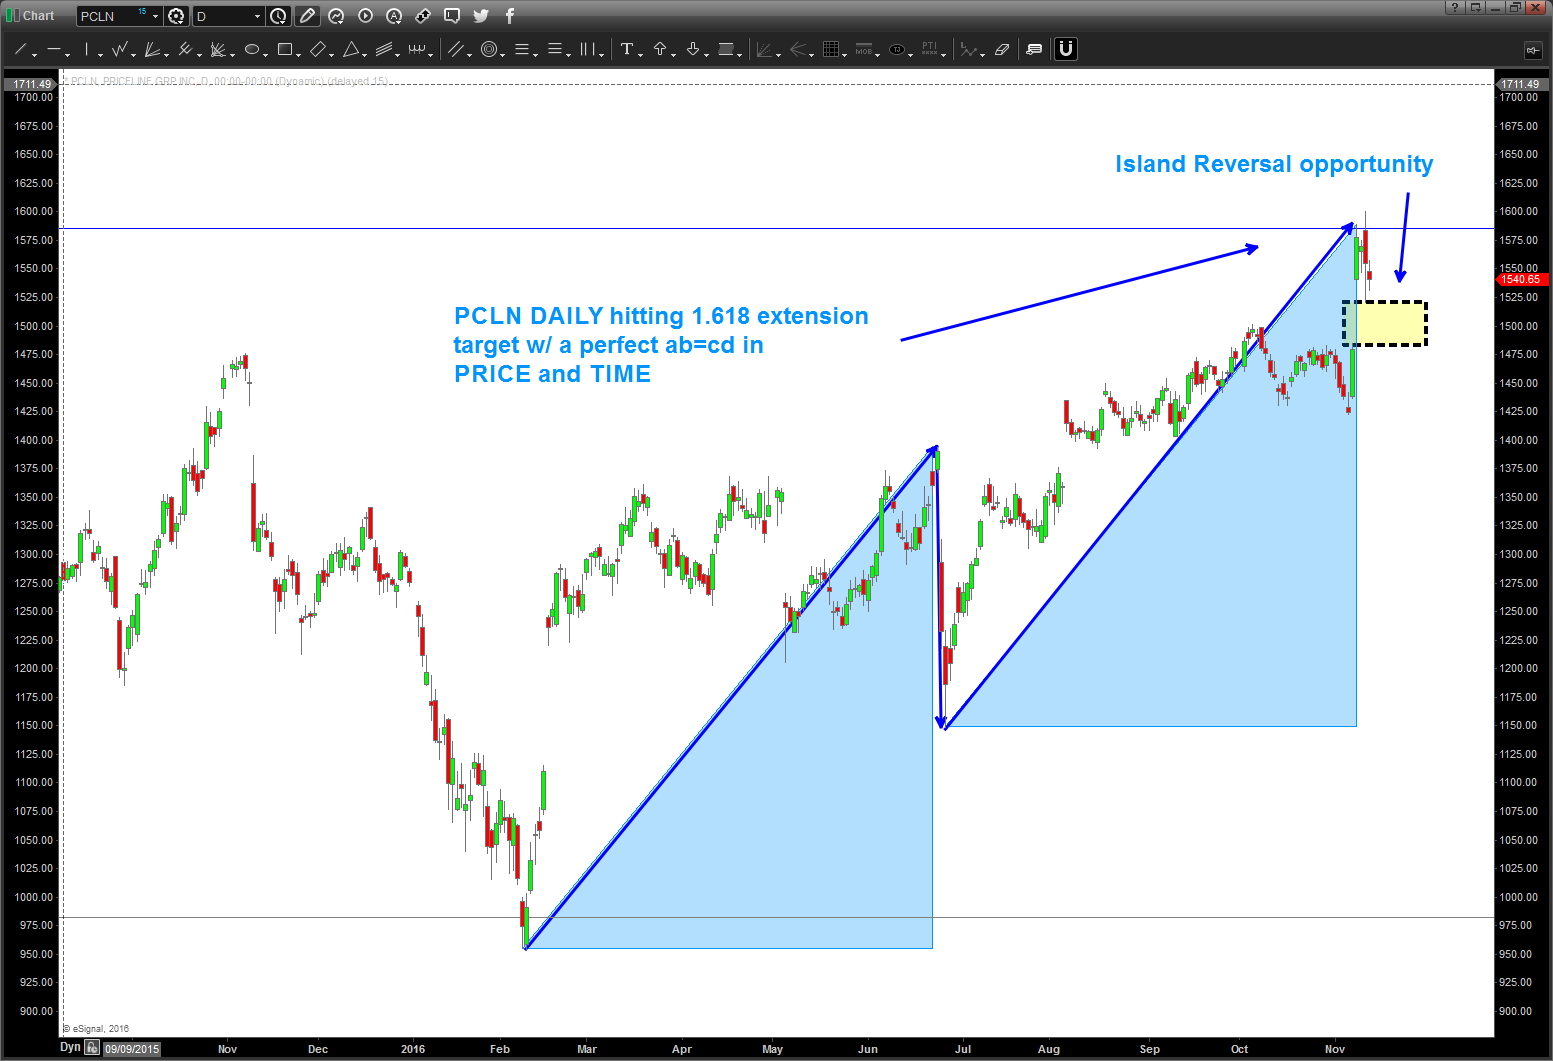
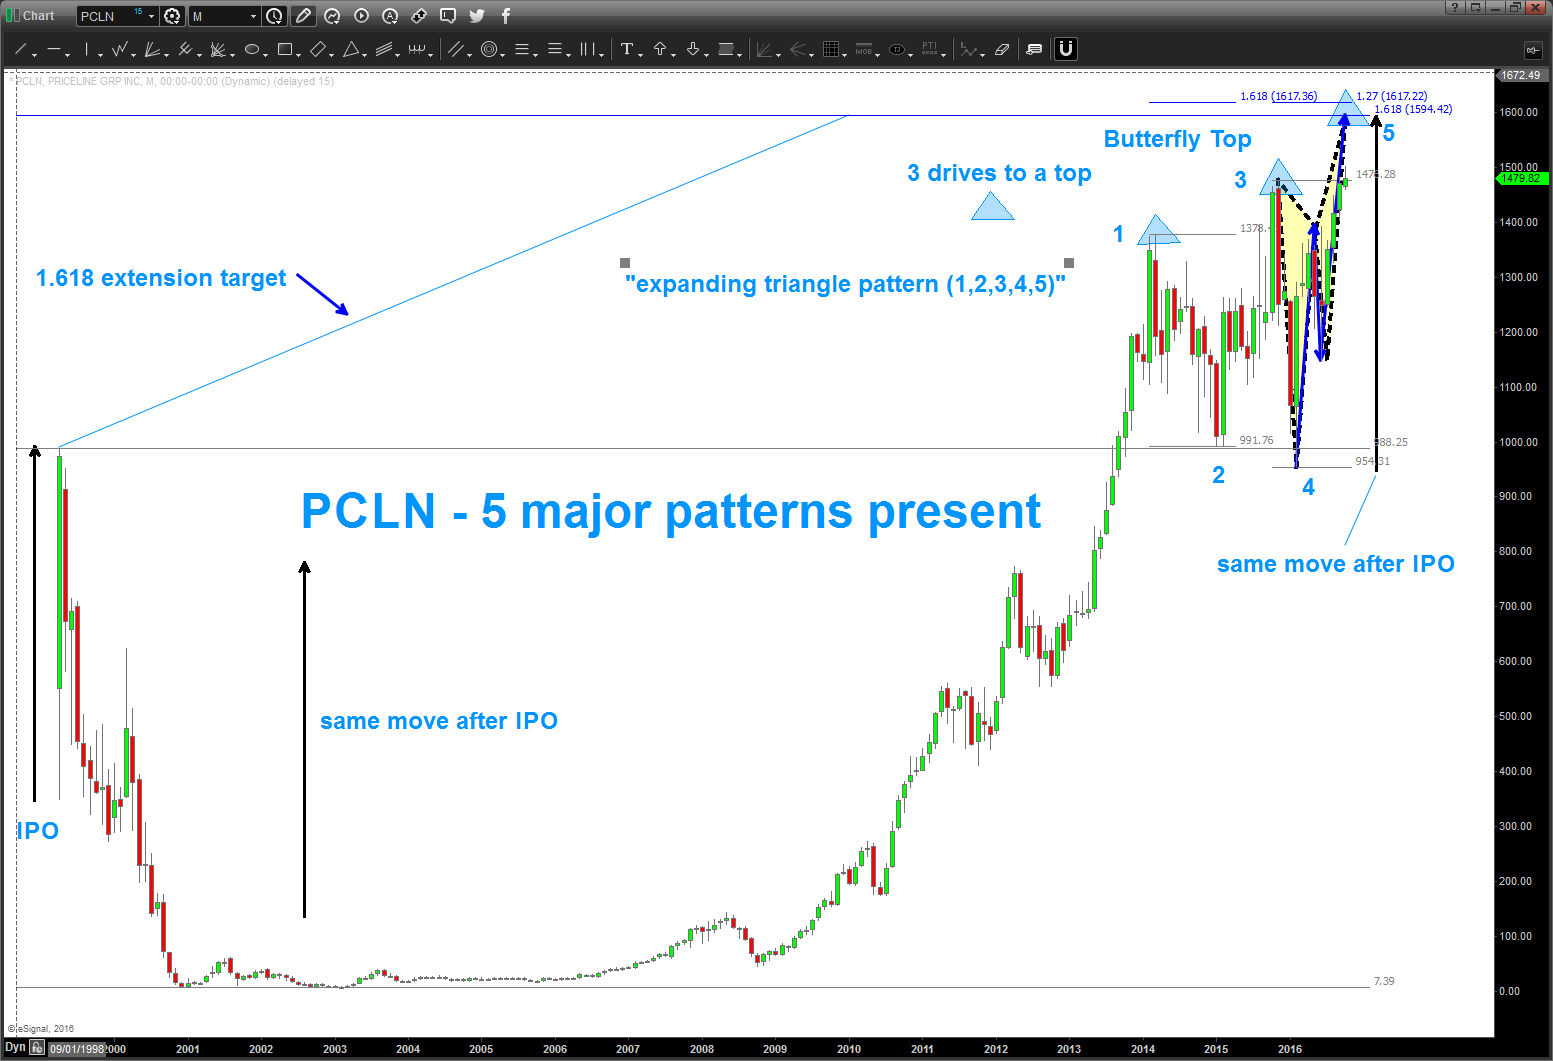
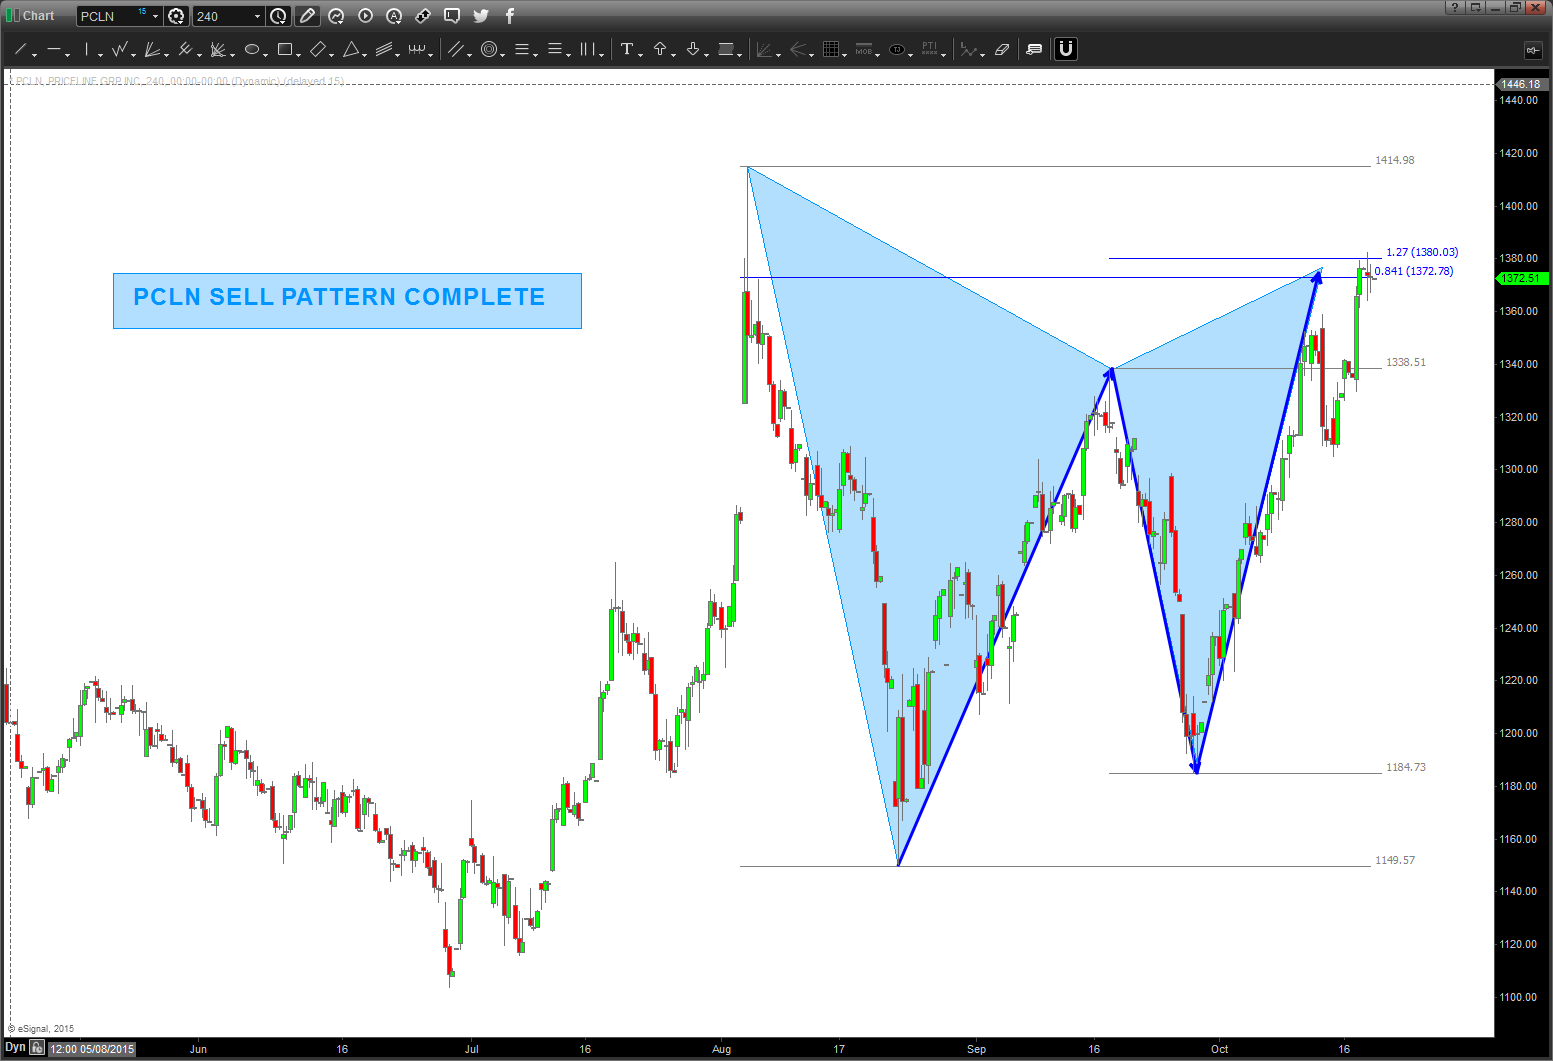
11/12/2016 – well PLCN went up and hit the level shown below. Folks that’s 5 monthly patterns on PCLN. IT SHOULD BE MONSTEROUS RESISTANCE for PCLN to go higher. As always, patterns do fail and they do work so it’s all probability. Also, when we go down to the daily time frame NOTE the perfect AB-CD in price and time. This completed the butterfly sell pattern and it’s extremely helpful when TIME of the last leg of the butterfly balances itself …also, note the ‘classic island reversal opportunity” where all we need to complete is a gap down below the shaded yellow box and this puppy could get rolling.
last thing – there are targets a little higher so any strategy should take that into account ..but, for now, we have 5 MONTHLY PATTERNS COMPLETING ON PCLN.
TAKE NOTE!
Bart
10/9/2016
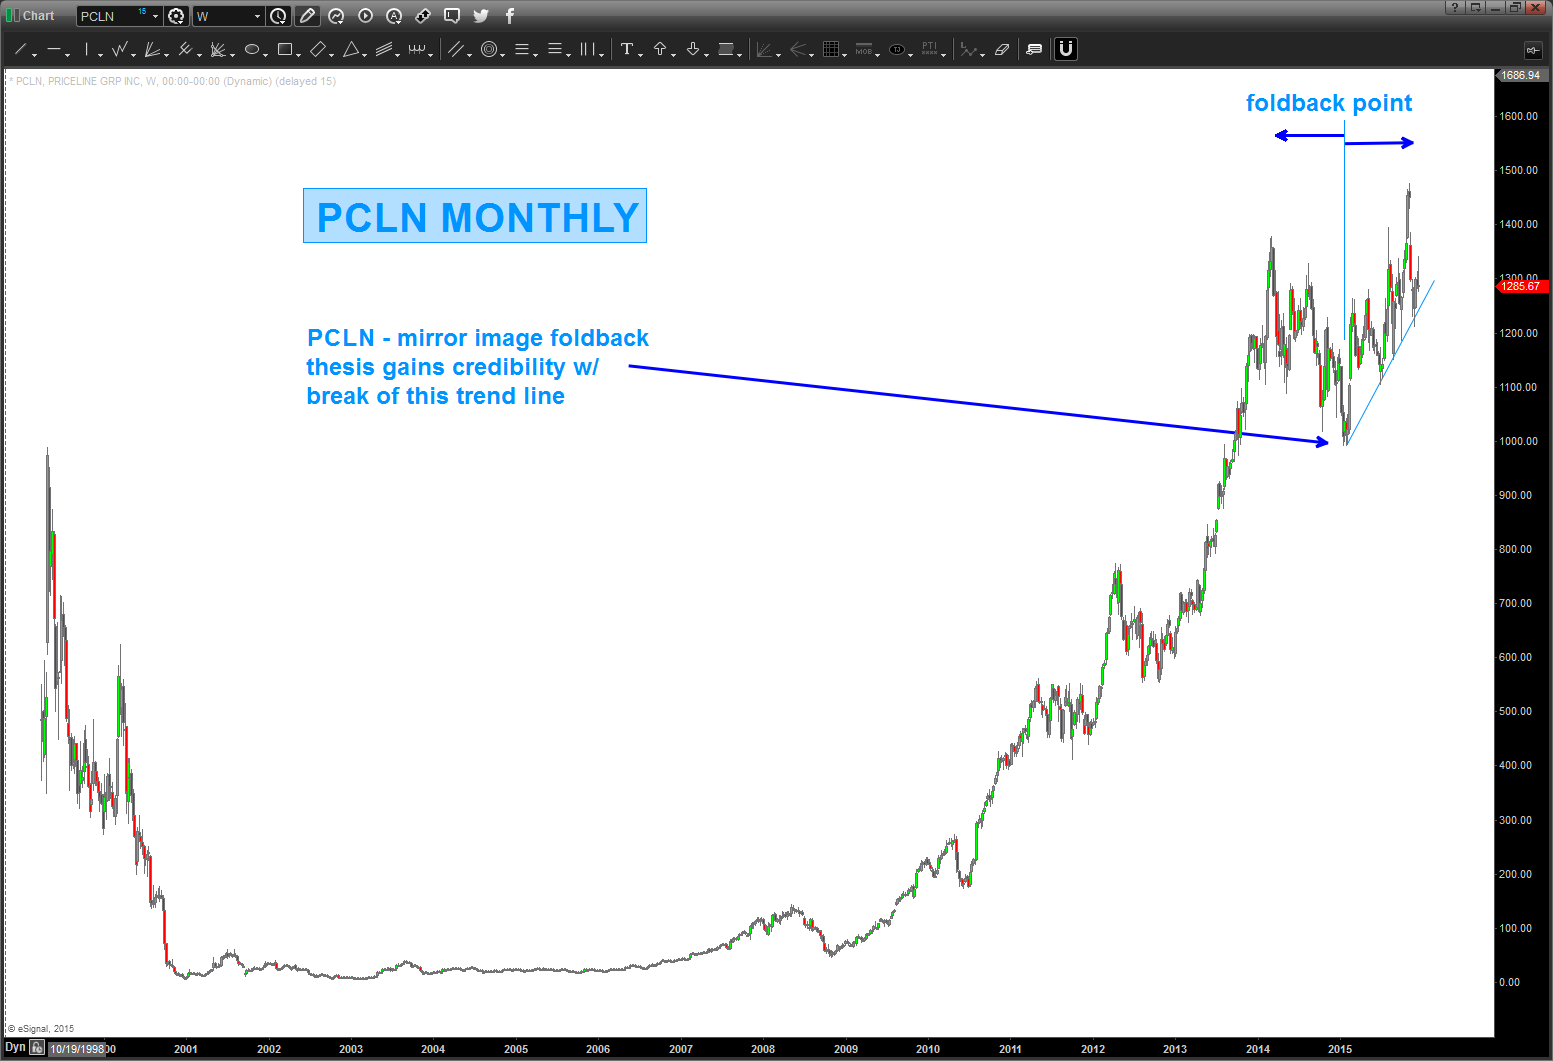
PCLN found support on the “polarity” from the IPO and, essentially, negated the mirror image foldback pattern discussed below. What now?
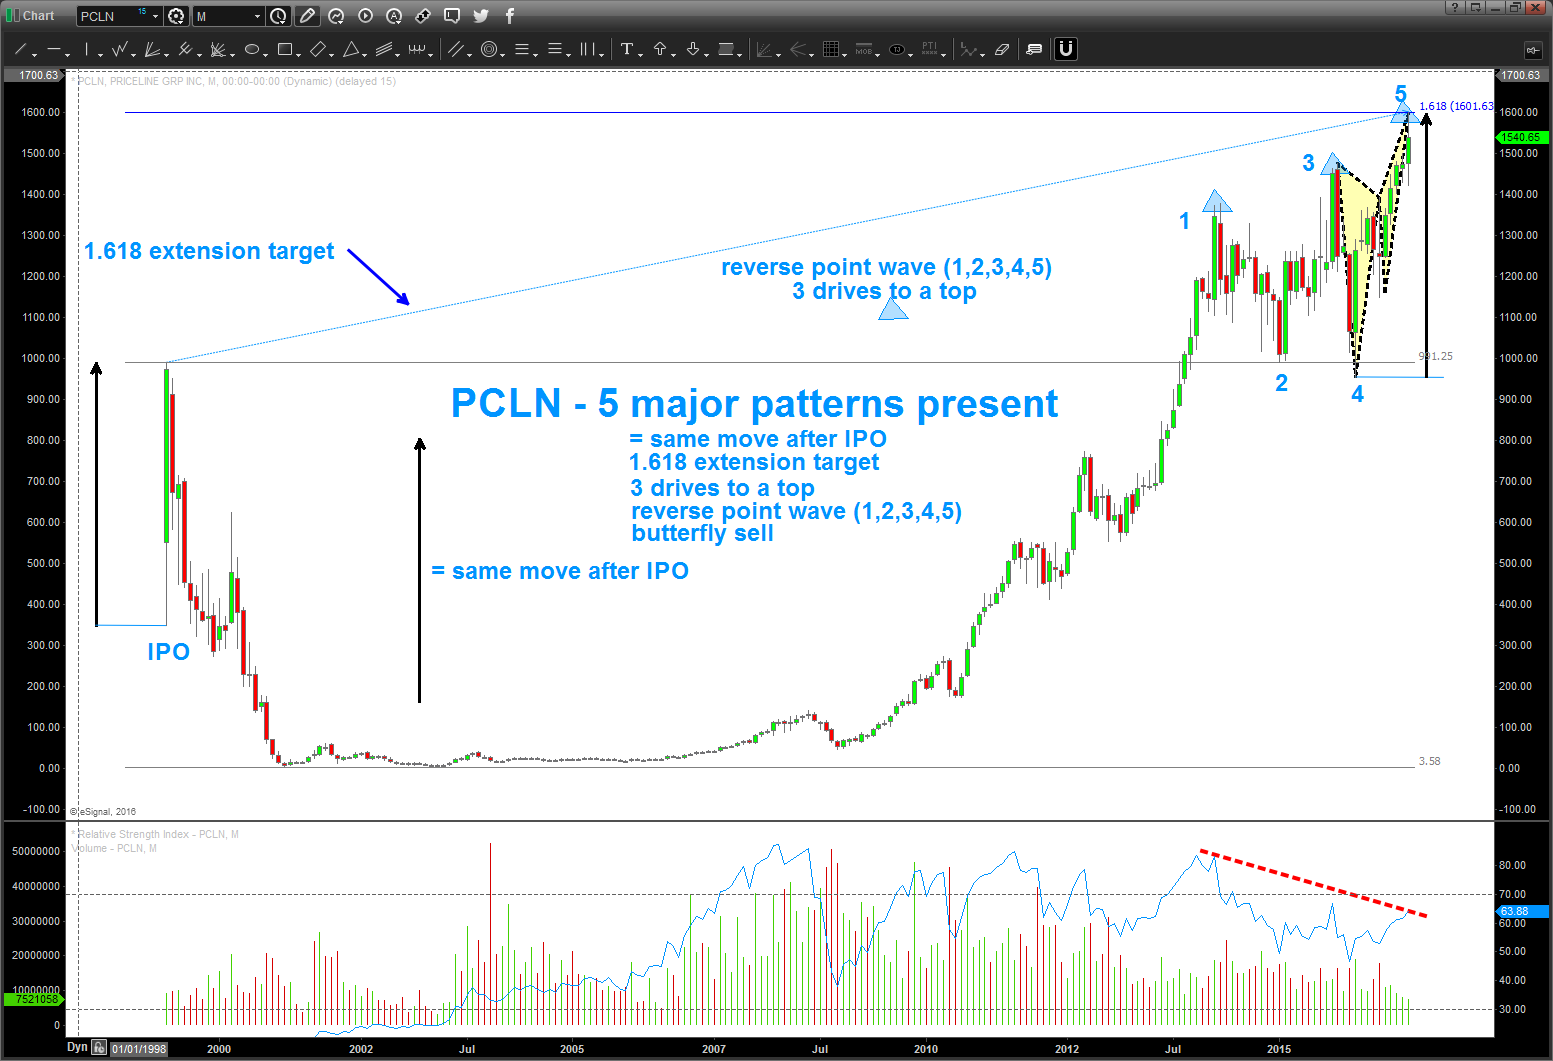
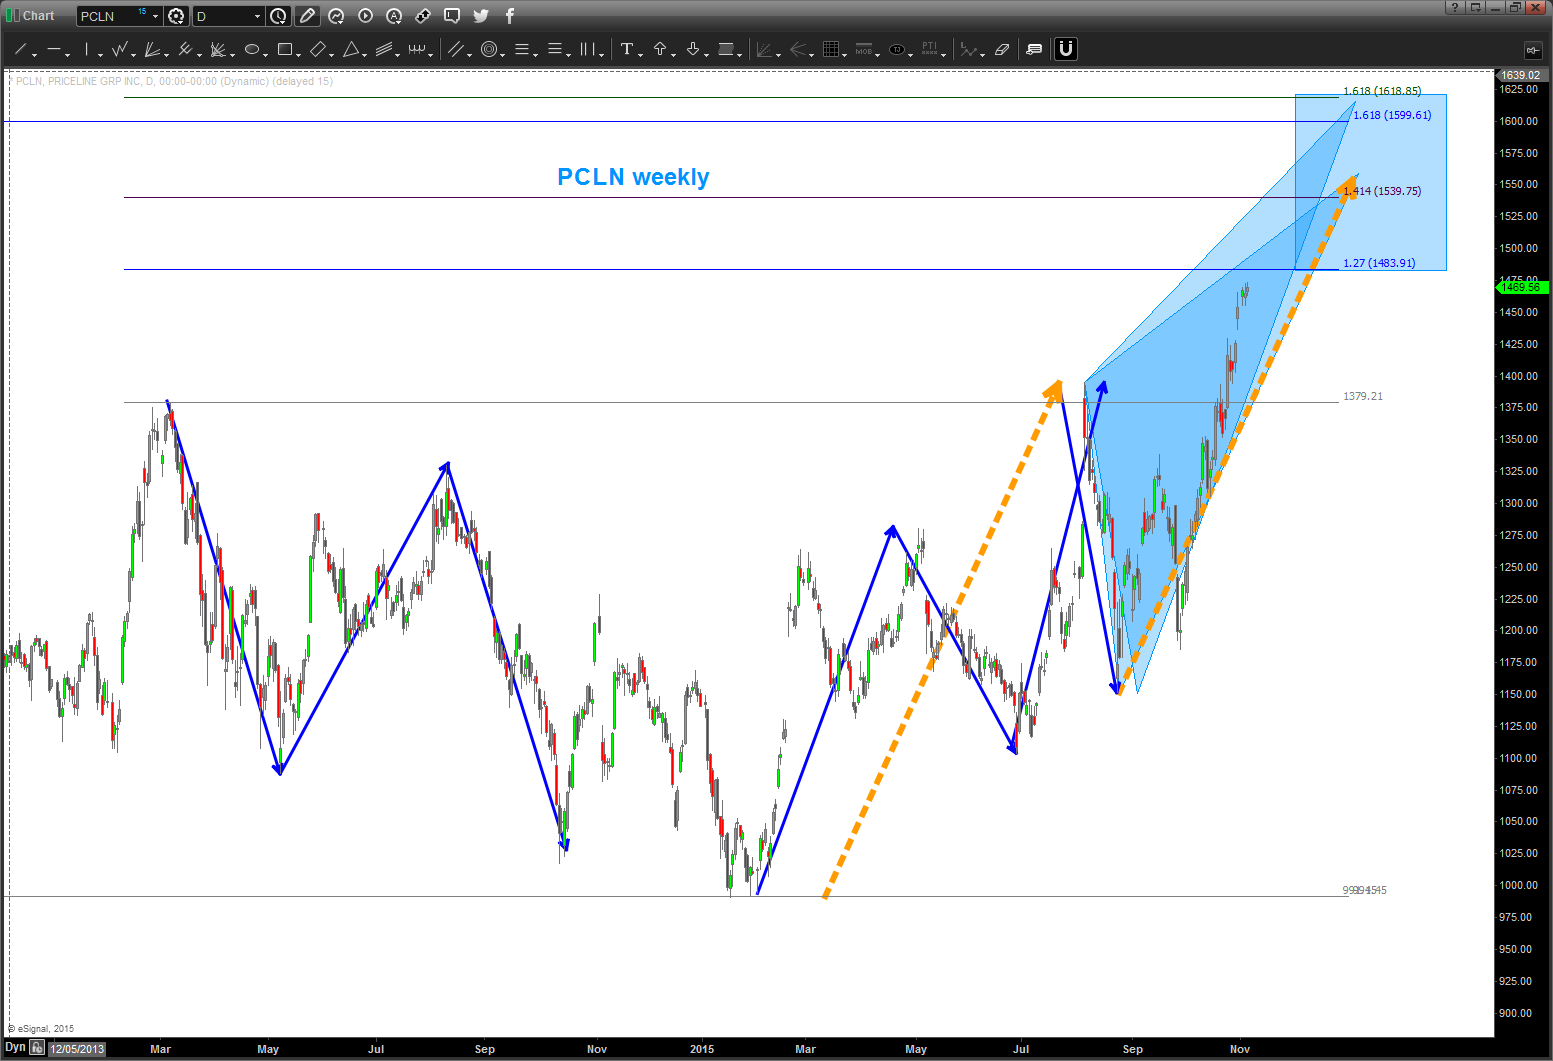
If you take a look at the long term chart, again, you’ll see some powerful sell patterns all coming together. as for right now, appears we are in no mans land w/ no pattern (buy or sell) present.
here’s the patterns present:
- 1.1618 extension from the IPO high
- note the black arrow going up from the post IPO low to the IPO high. That same “move” is present into the target area. the black arrow is “copy” and “pasted” from the IPO to current market prices.
- 3 drive to a top – the blue triangles
- 1,2,3,4,5 reverse point wave
- a “perfect” Butterfly Sell pattern – (it has an AB=CD present in the last leg of the Butterfly)
who knows if it will get that high right now .. but certainly realize that 1600-1625 has a TON of resistance.
B
02/01/2016
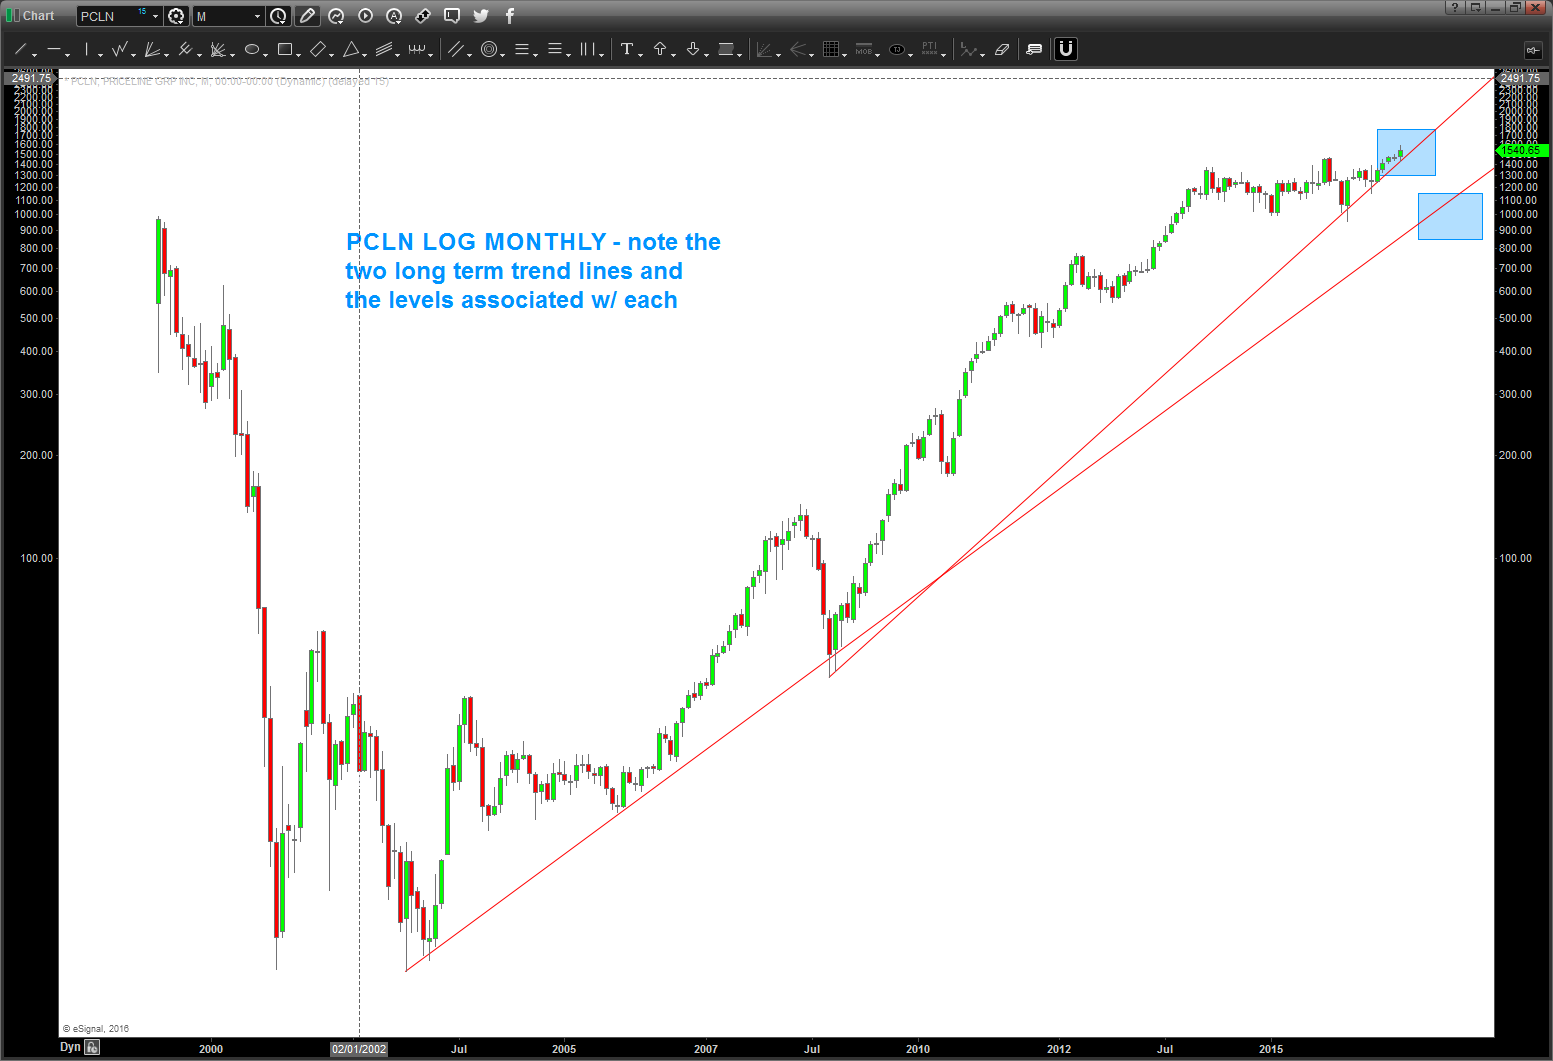
as you can see below, the light blue trend line below was taken out. now we are approaching major support as shown by the polarity principle. some bid thrust/candles going into this level so this will be a key test in the coming days/weeks. if we lose this level, then expect 1.27 level to be attacked in the high 800’s.

12/20/2015: update to PCLN.
one can see that this has been an amazing rocket ship.
one can also see below that I was “seeing” a top coming in and tried the mirror image foldback, which from a price perspective DID NOT work. then, you can see that I was “seeing” a butterfly pattern and that missed the target area by a few bucks.
so, in summary, let’s watch the key low to high trend line shown in the chart below. also note the TIME symmetry around the foldback points. I missed that below, but that actually lends some credence to a potential big top.
this one has been tough .. but, then again, when you go from 3 dollars to 1450+ it’s going to take some time to digest.
anyway, for those who asked me, hope this helps w/ the gameplan for $PCLN.
Folks, this mirror image got smoked. Much like the mirror image for Natural Gas … the mirror images fail at the inflection points and $PCLN has rolled thru the pattern. ERASE … ERASE…ERASE.
Where are we now?
Well, if we look at the candles you’ll see the 2nd largest monthly candle since the IPO occurred last month (OCT) So, we have 1484 coming in but it sure looks like momentum and thrust will carry it to the 1600 level. I’m going to spend some time on this one over the next couple days …
here’s the MONTHLY picture …
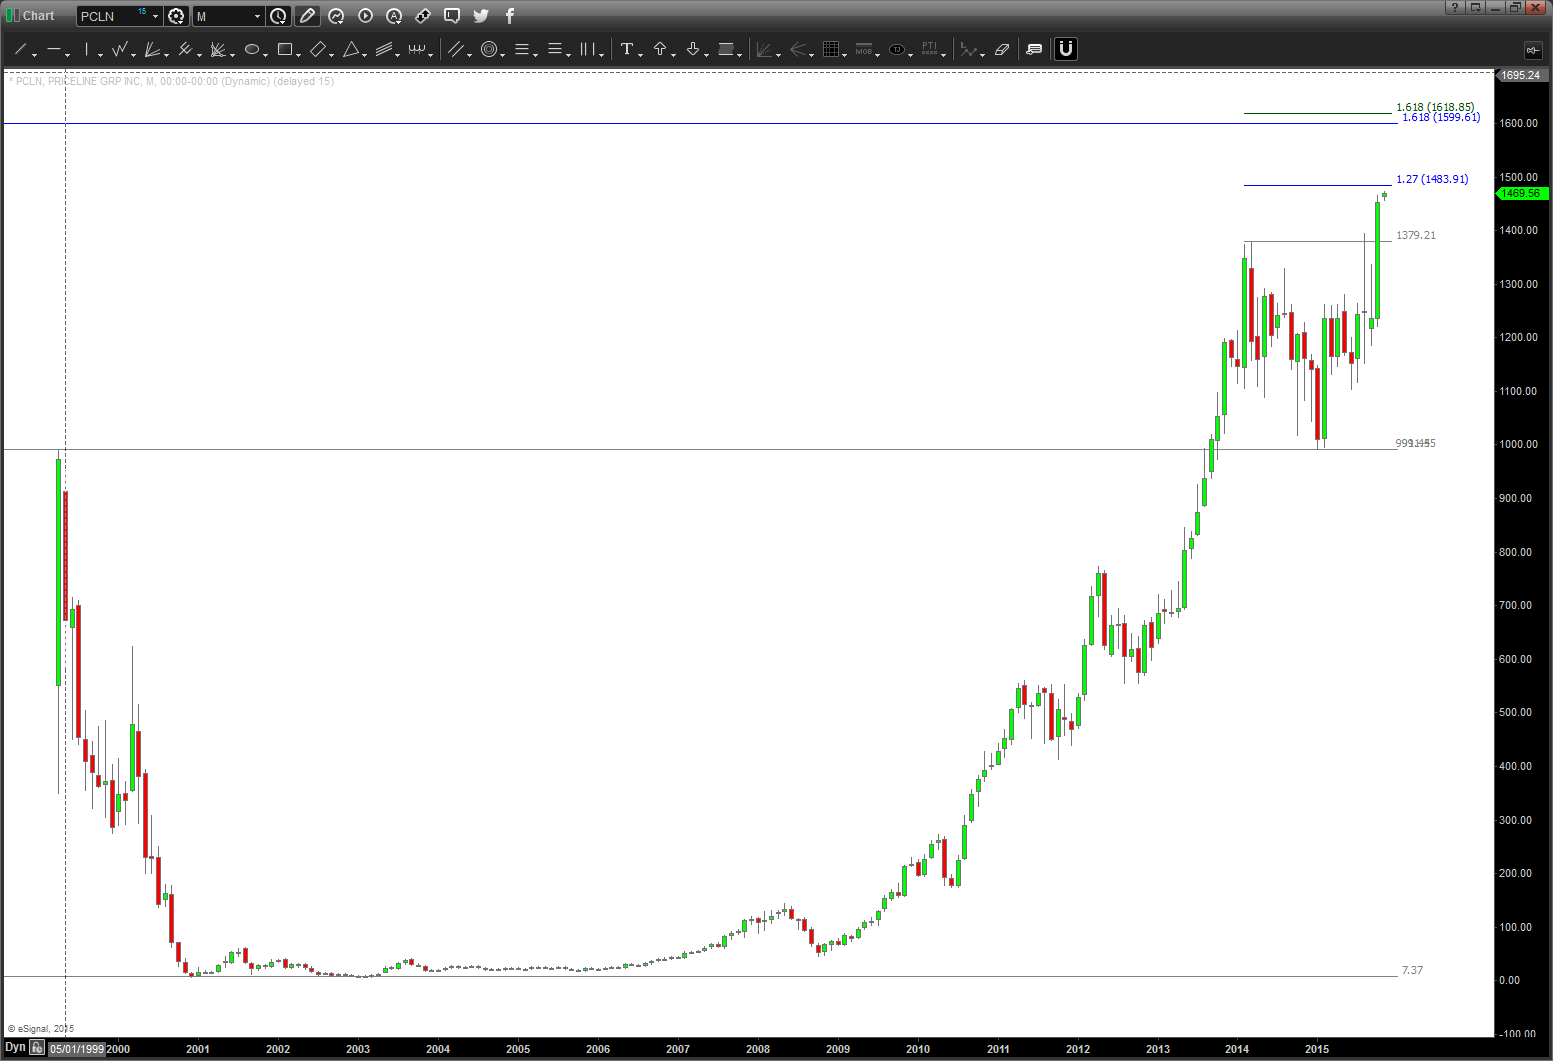
IF the mirror image foldback is in play THEN this pattern needs to hold and start down. a move below 1360 would bolster conviction that the mirror image mentioned earlier is in play.
How to create the “real” trend lines UPDATED
Posted on November 12, 2016 Leave a Comment
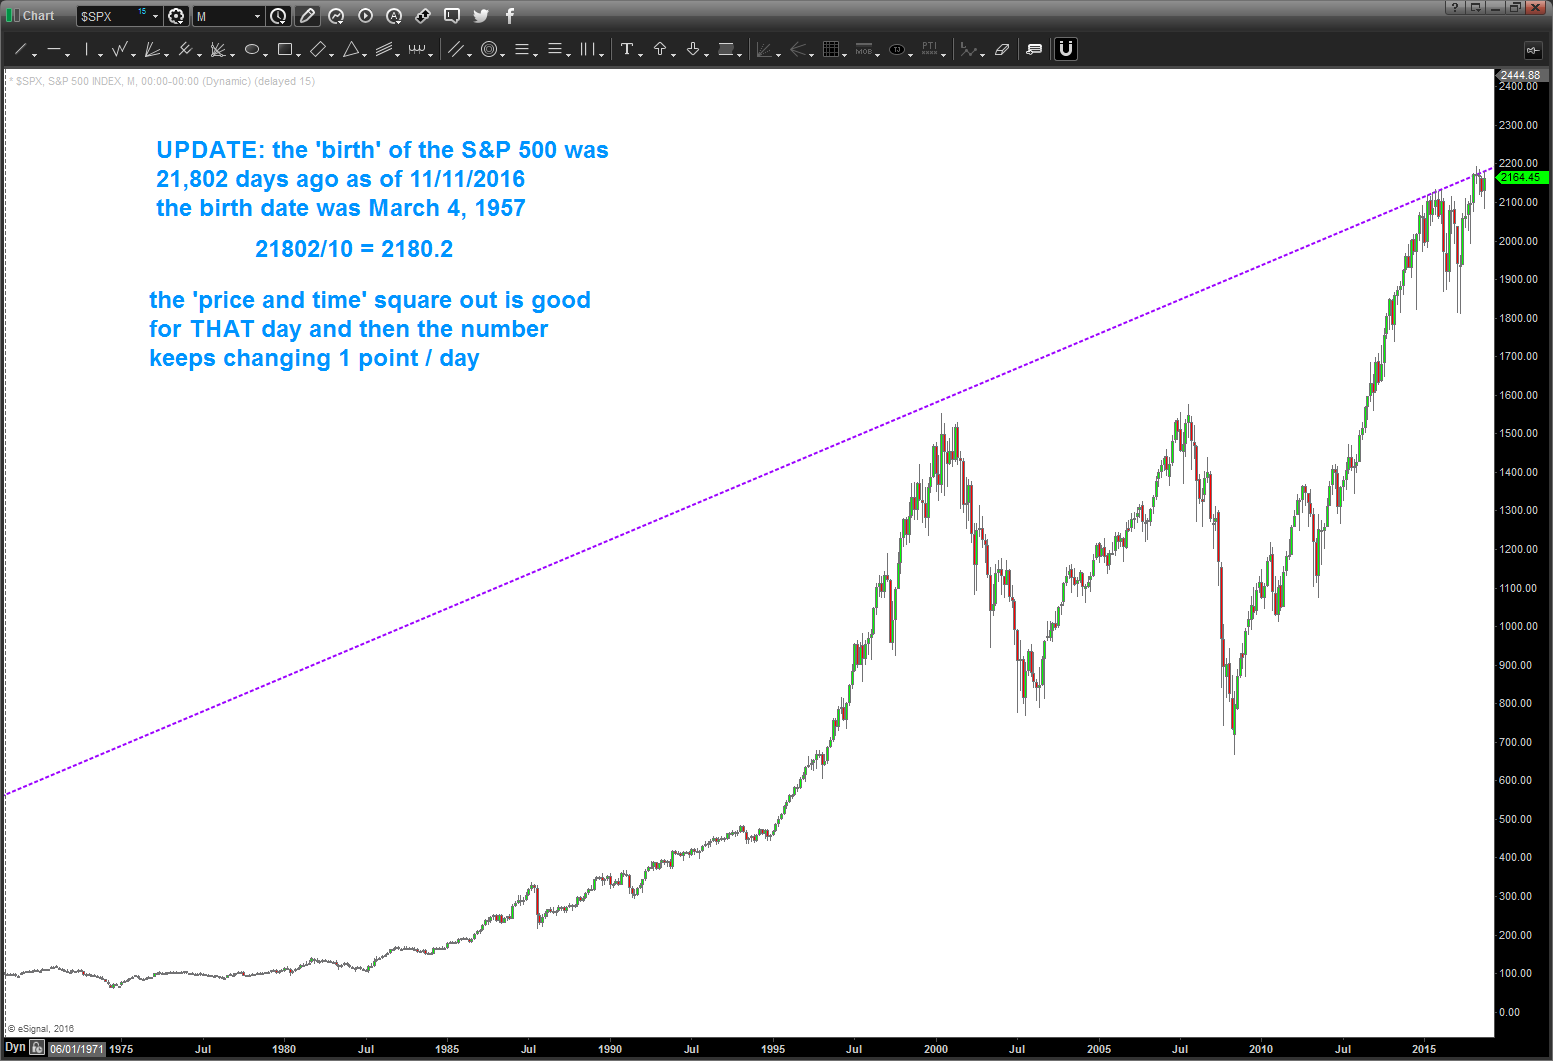
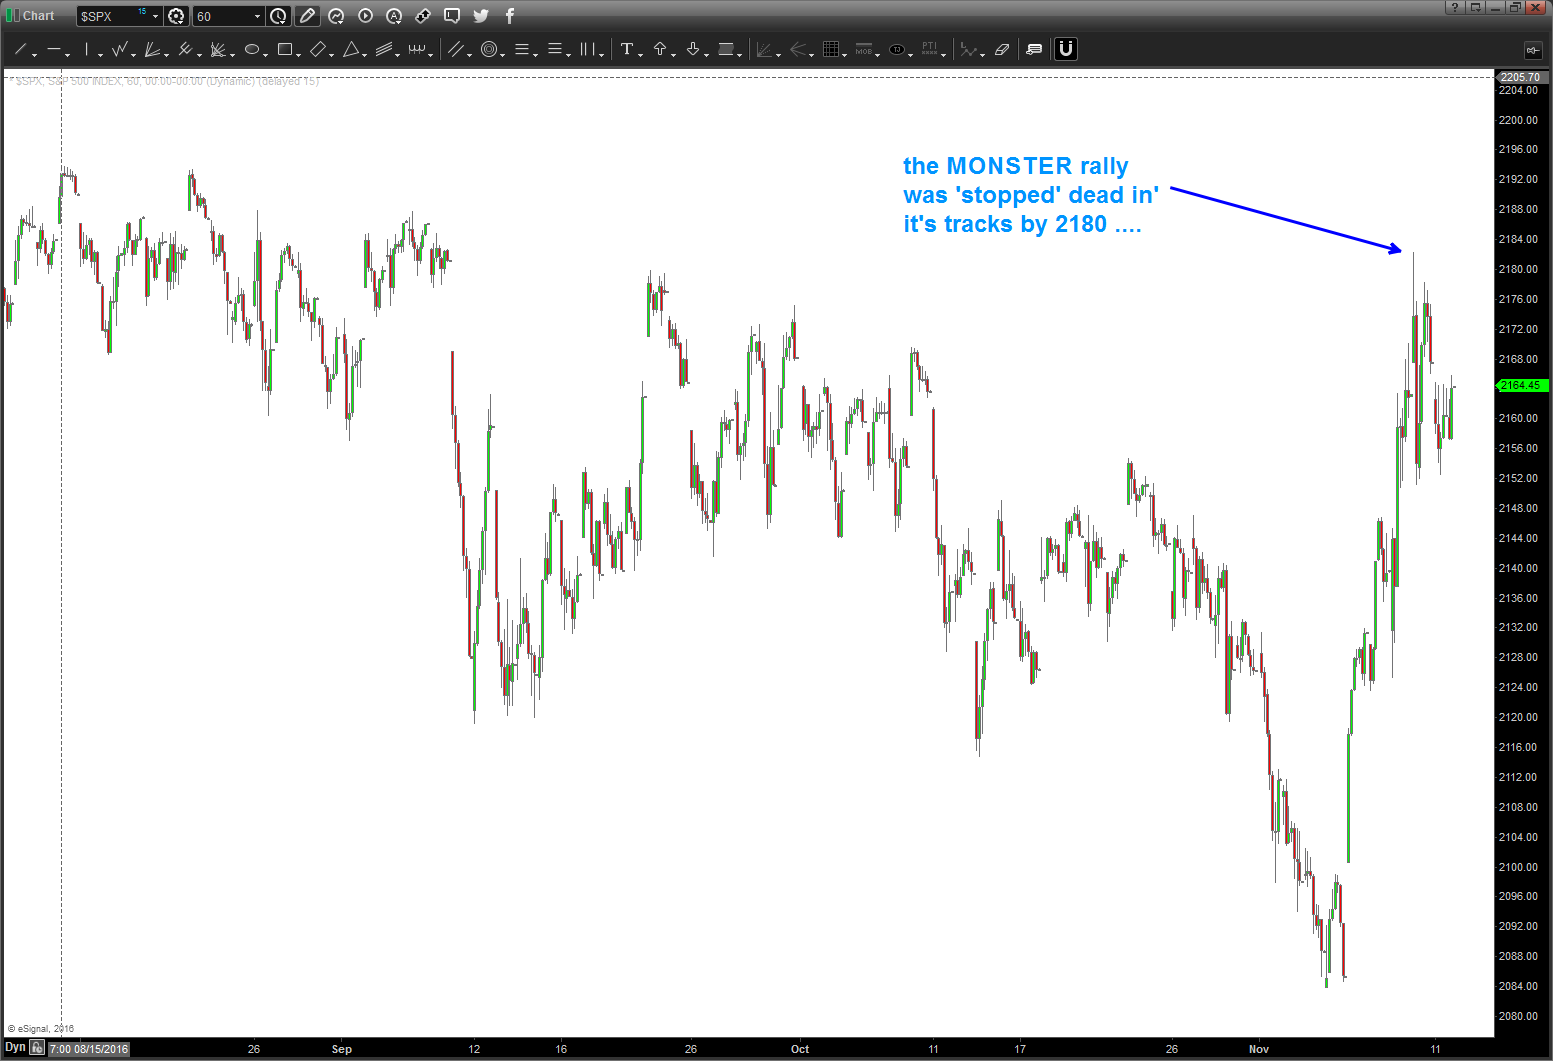
11/12/2016 – wanted to provide an update. the ‘square out number’ isn’t static. in fact, it changes every day. in this case, as we continue vortexing thru space we see that we are now, essentially, 2180 days since the ‘birth’ of the S&P 500. Of note, the post election crazy rally was stopped dead in it’s tracks by 2180. that’s the ‘key’ number right now … the market ‘wants’ to balance itself (remember: form, proportion, balance) so it’s no real surprise that the market went right up to that NUMBER.
so, what happens next? I honestly have no idea … but i do know that the market will move from these levels, usually, w/ a vengeance so just hang on to go up or down … a “weekly” close above one of the numbers tied to the square out would be bullish. a big break down below some former support would be bearish.
for now, as we bounce around these harmonic numbers of price/time – just chill and let it make up its mind.
hope this helps.
Bart
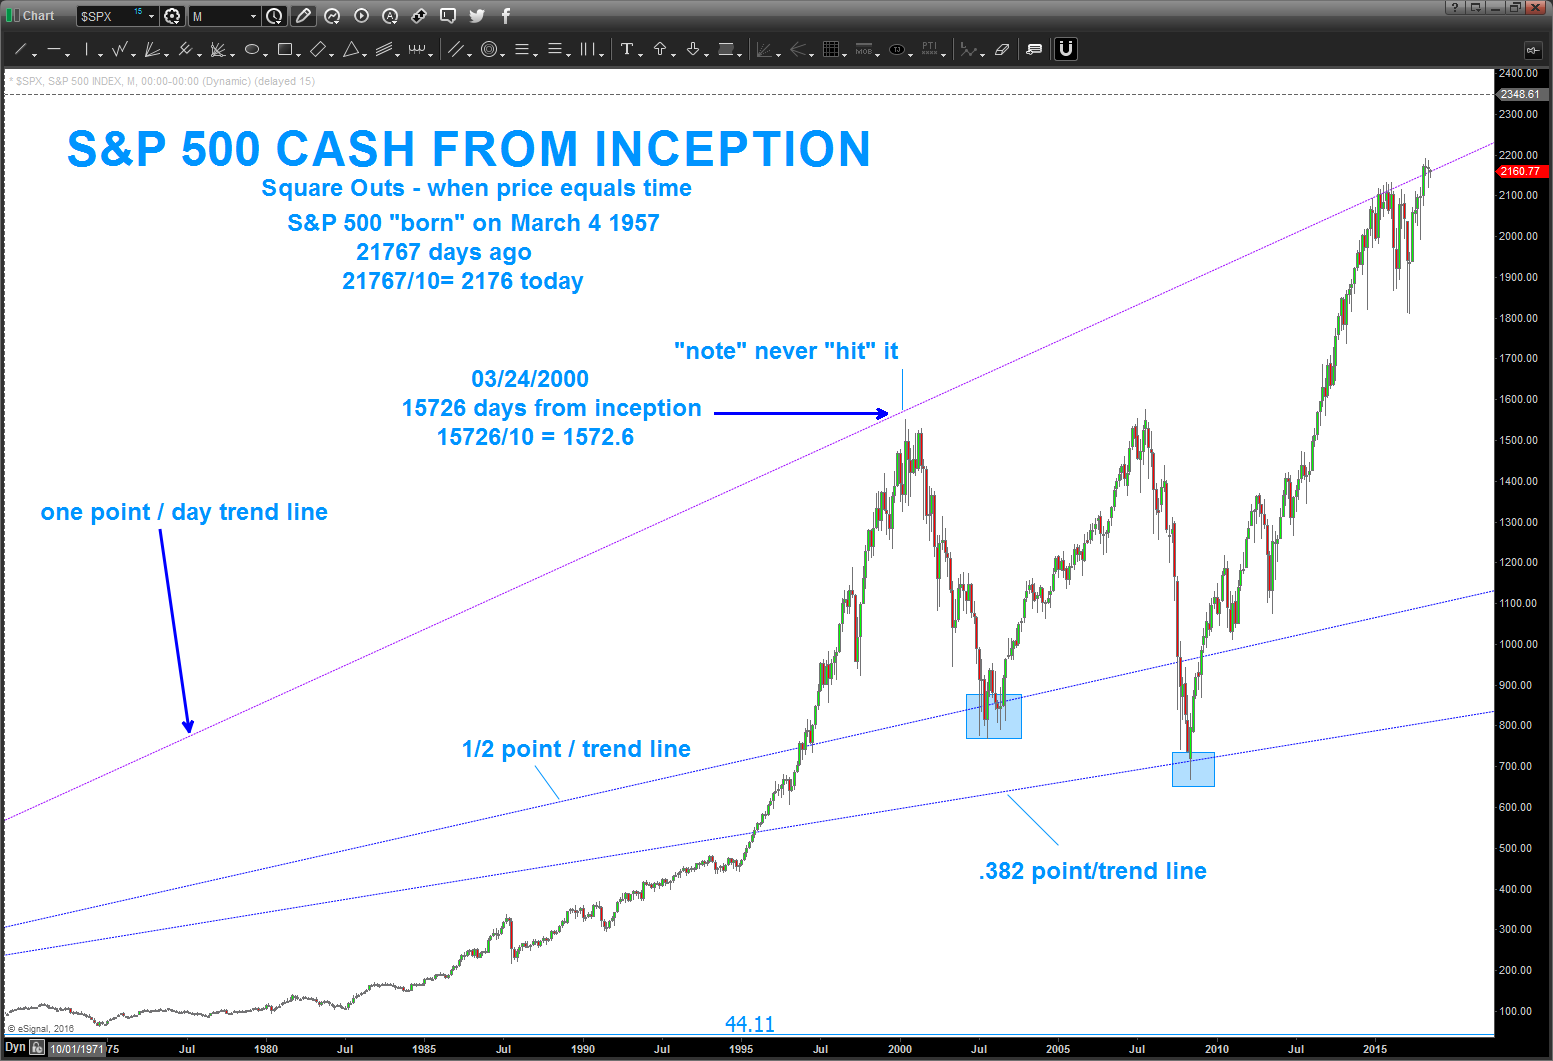
10/7/16 – just wanted to check in before the weekend. below is a chart that “visually” depicts the SQUARE OUT where PRICE EQUALS TIME and the TREND LINE you can create. In this case you can see the 1×1 is currently the REASON for the resistance on the S&P and then we simply did a 1/2 point/day and, why were were at it, a .382 point/day. HINT – why not try “musical notes” *days since inception or all time low. I bet, if we use, say .9438*days we’ll get close to the 2000 high and, while were are it, 1.05946*days we’ll be resistance on the cash S&P. It’s early on the West Coast … I don’t feel like doing it. Try it yourself.
also, we are using a CONSTANT 1 point/day “velocity” (in this case we use PRICE and TIME to create the vector math) and what else moves in a CONSTANT ? (hint – look up in the sky) YES, you got it … so, while your at it, use a planet and move them a certain amount of degrees in a certain amount of time. How about 100 degrees/100 days – 1 to 1 and see what happens.
Have a GREAT weekend.
B
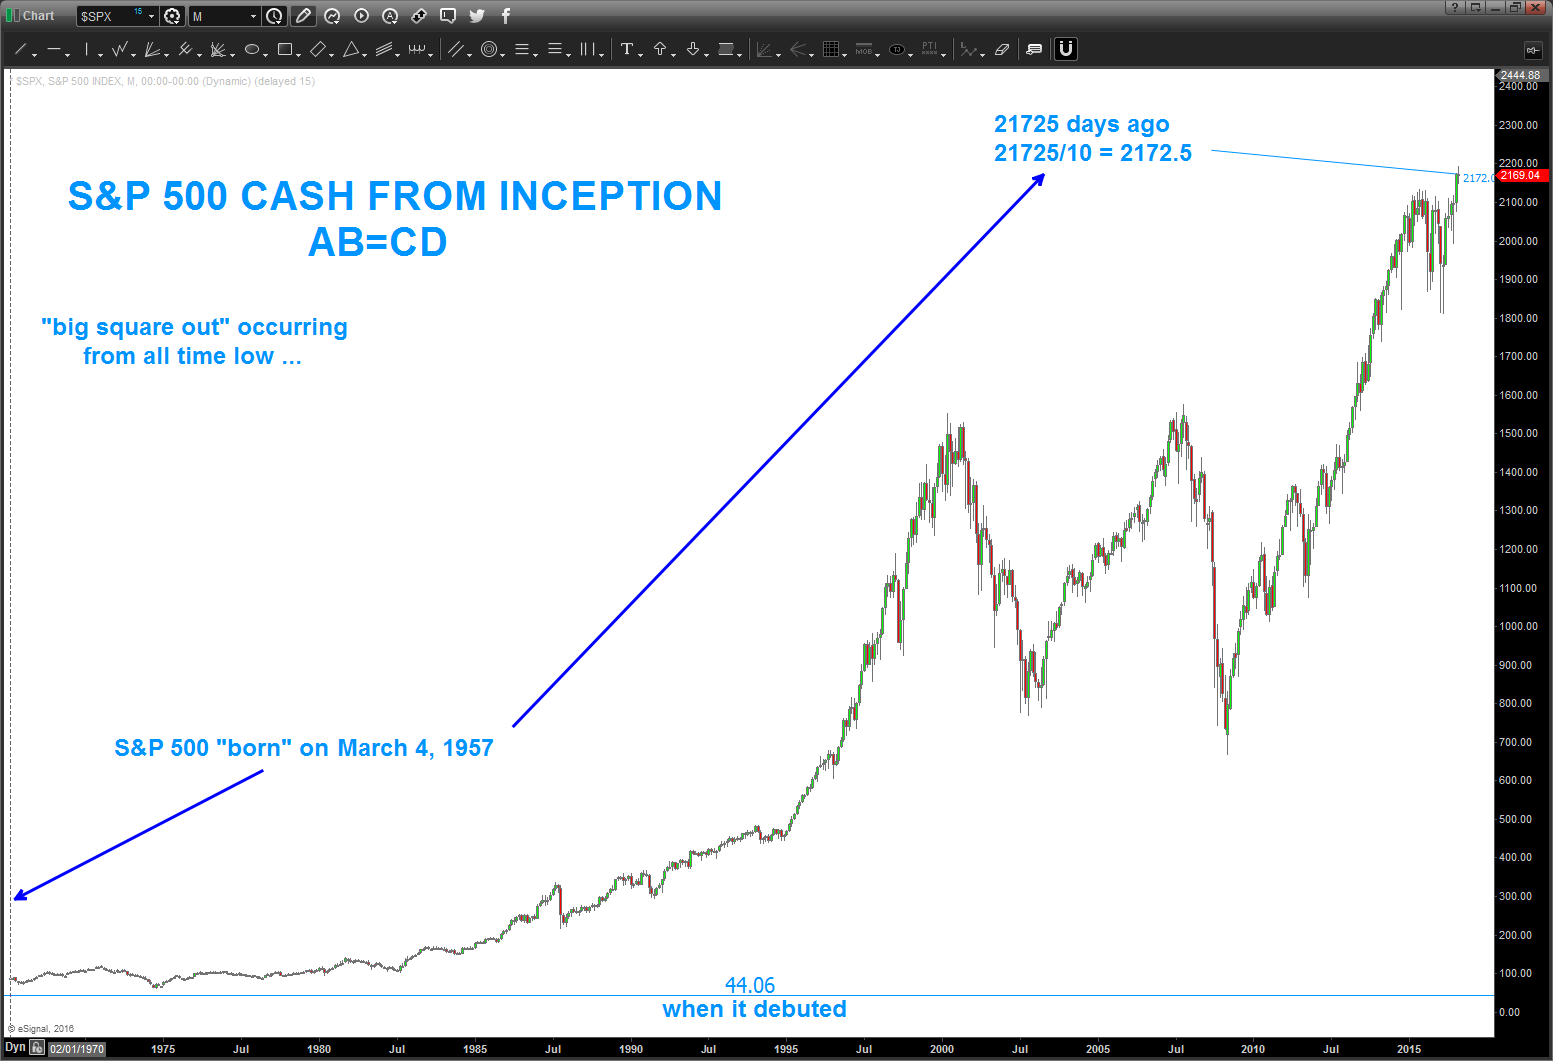
08/27/2016 – looks like we are still “squaring out” the date of the inception of the S&P500 w/ this past weeks weekly close.
again, this is not “bearish” or “bullish” but a heads up that at “square outs” stuff happens … go w/ the flow.
rock on, ok?
PATTERNS … work and they fail.
PATTERNS tell us of possible inflection points.
PATTERNS also tell us very important areas of interest to trade around ..
What if .. what if the PATTERN on the cash S&P has finished or is very close to finishing a sell signal?
That would mean we are at major resistance and the market “should” respect a PATTERN that has its genesis from it’s all time low 50 years ago….
IF the market DOES NOT respect this area and goes higher then we are really really really strong and I wold look to go LONG after a monthly or weekly close above these levels.
so, don’t shoot me- I got tons of crap this weekend for posting about the Utilities Pattern hitting (seems to be working so far) and I’m just mentioning that a “classic” AB=CD PATTERN is pretty much done on the S&P.
Pay Attention ….
Bart
PS – tons of cycles are hitting this week so just go w/ the flow and catch the wave that should begin soon. No idea which way it goes, it’s just a pattern. TRADE IT or NOT.
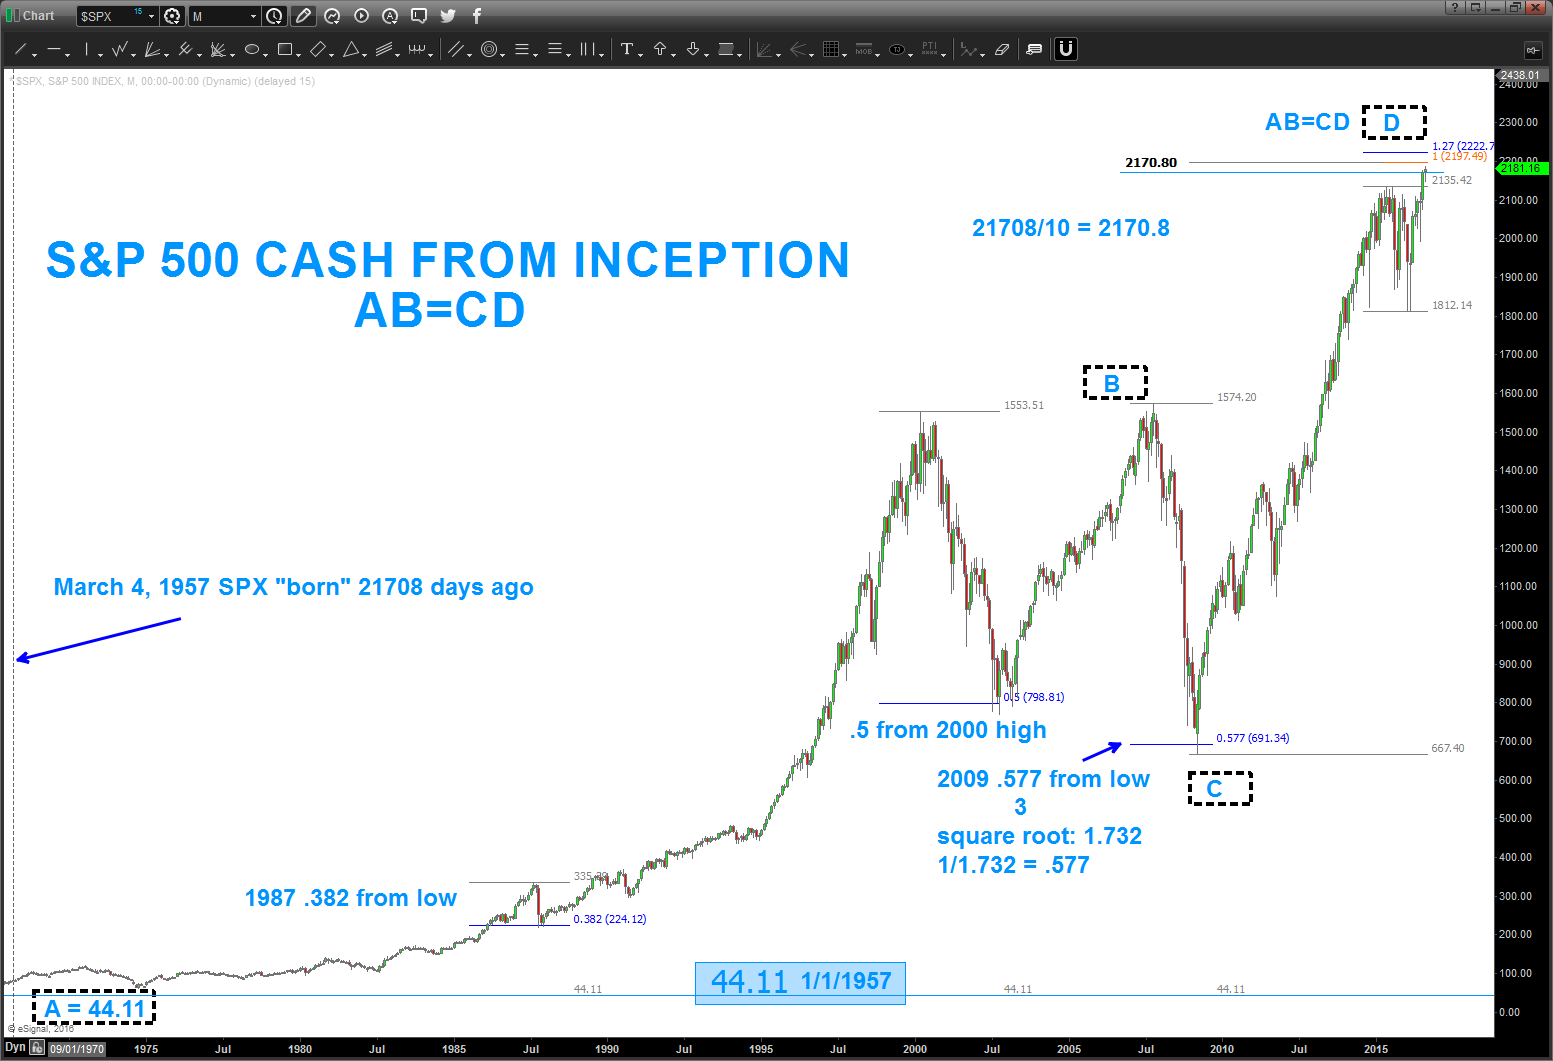
PS — also, the you’ll note the SK&P was BORN on March 4, 1957 or 21708 days ago. 21708/10 = 2170.8. Were only 10 points away from that price … if we close below 2171,2172,2173 etc. in the coming days the market has SQUARED OUT PRICE and TIME. “Stuff” usually happens around those occurrences. An FYI …
Banking Index FAILED PATTERN
Posted on November 9, 2016 2 Comments
I’ve tried to be pretty consistent ..sometimes they work and sometimes they don’t. When the SELL pattern on the banking index appeared it was, in fact, a beauty.
however, after today’s close would consider it a FAILED PATTERN.
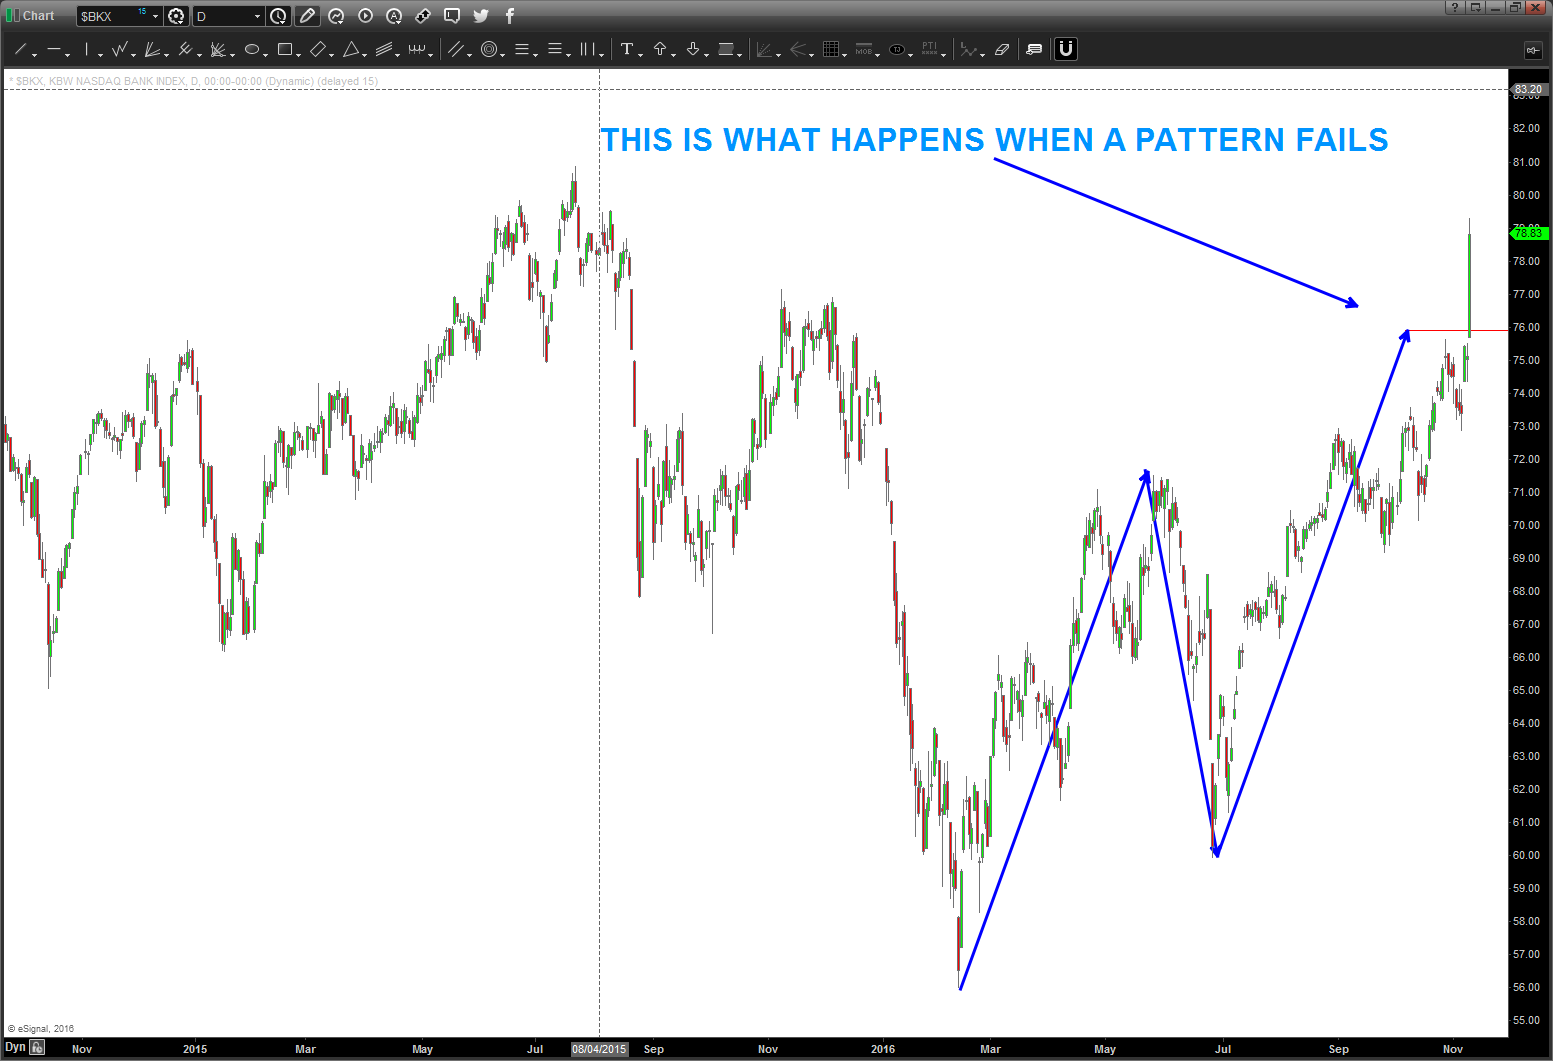
man … I don’t know
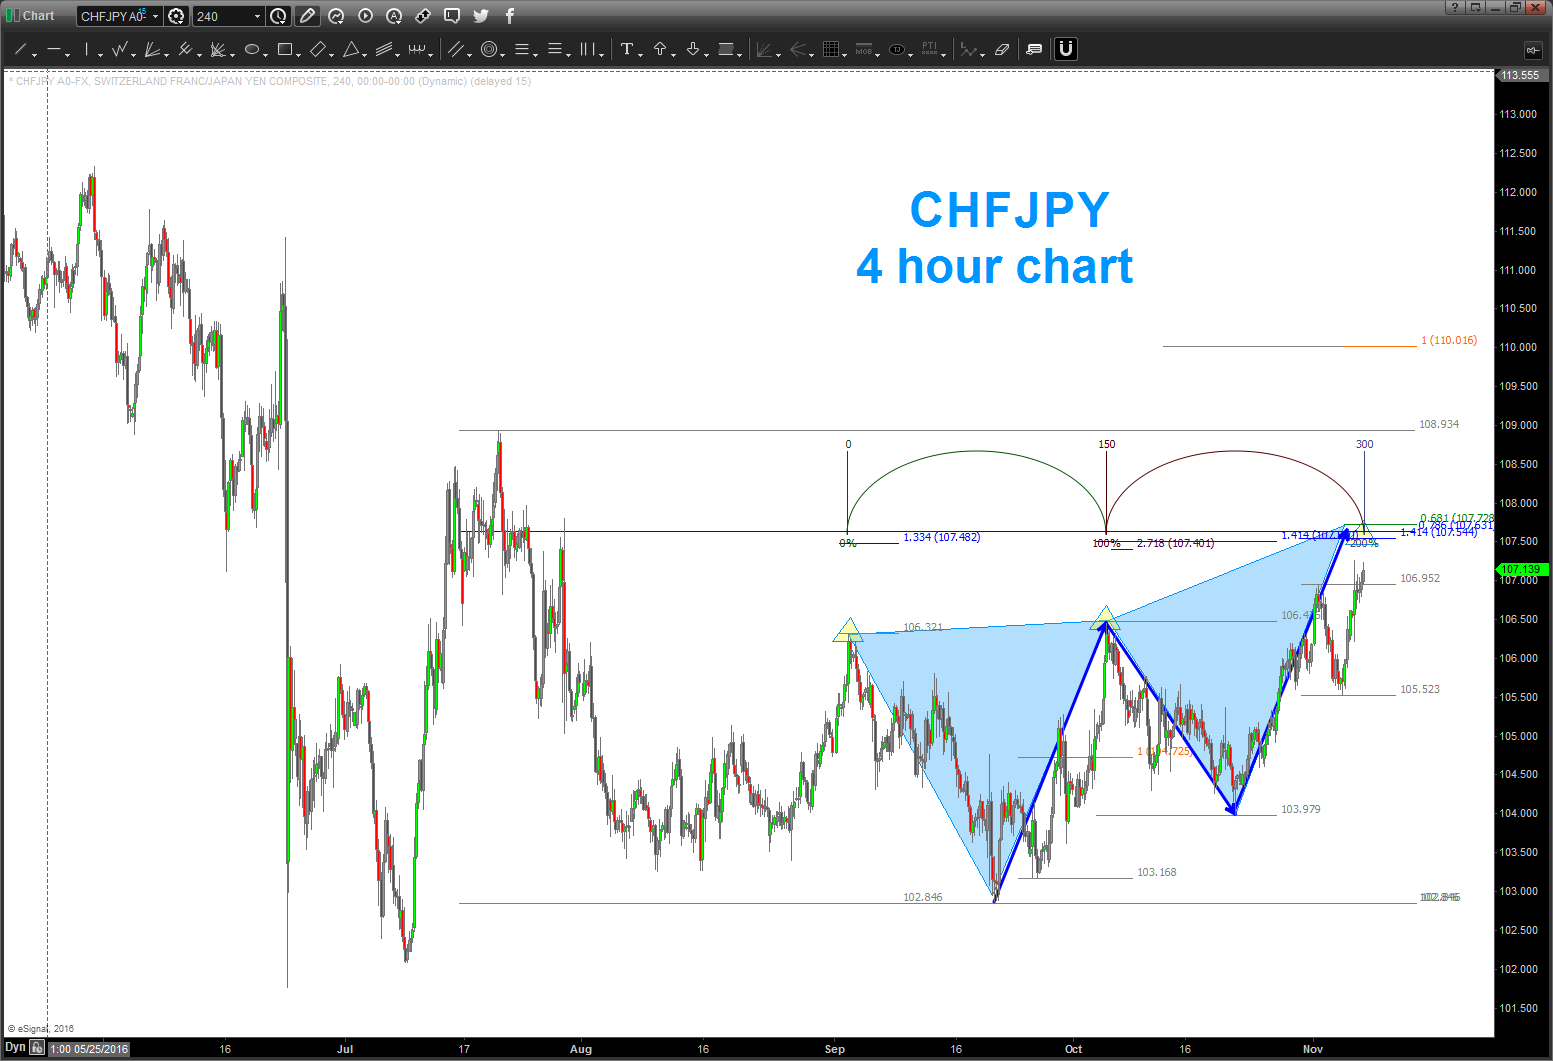
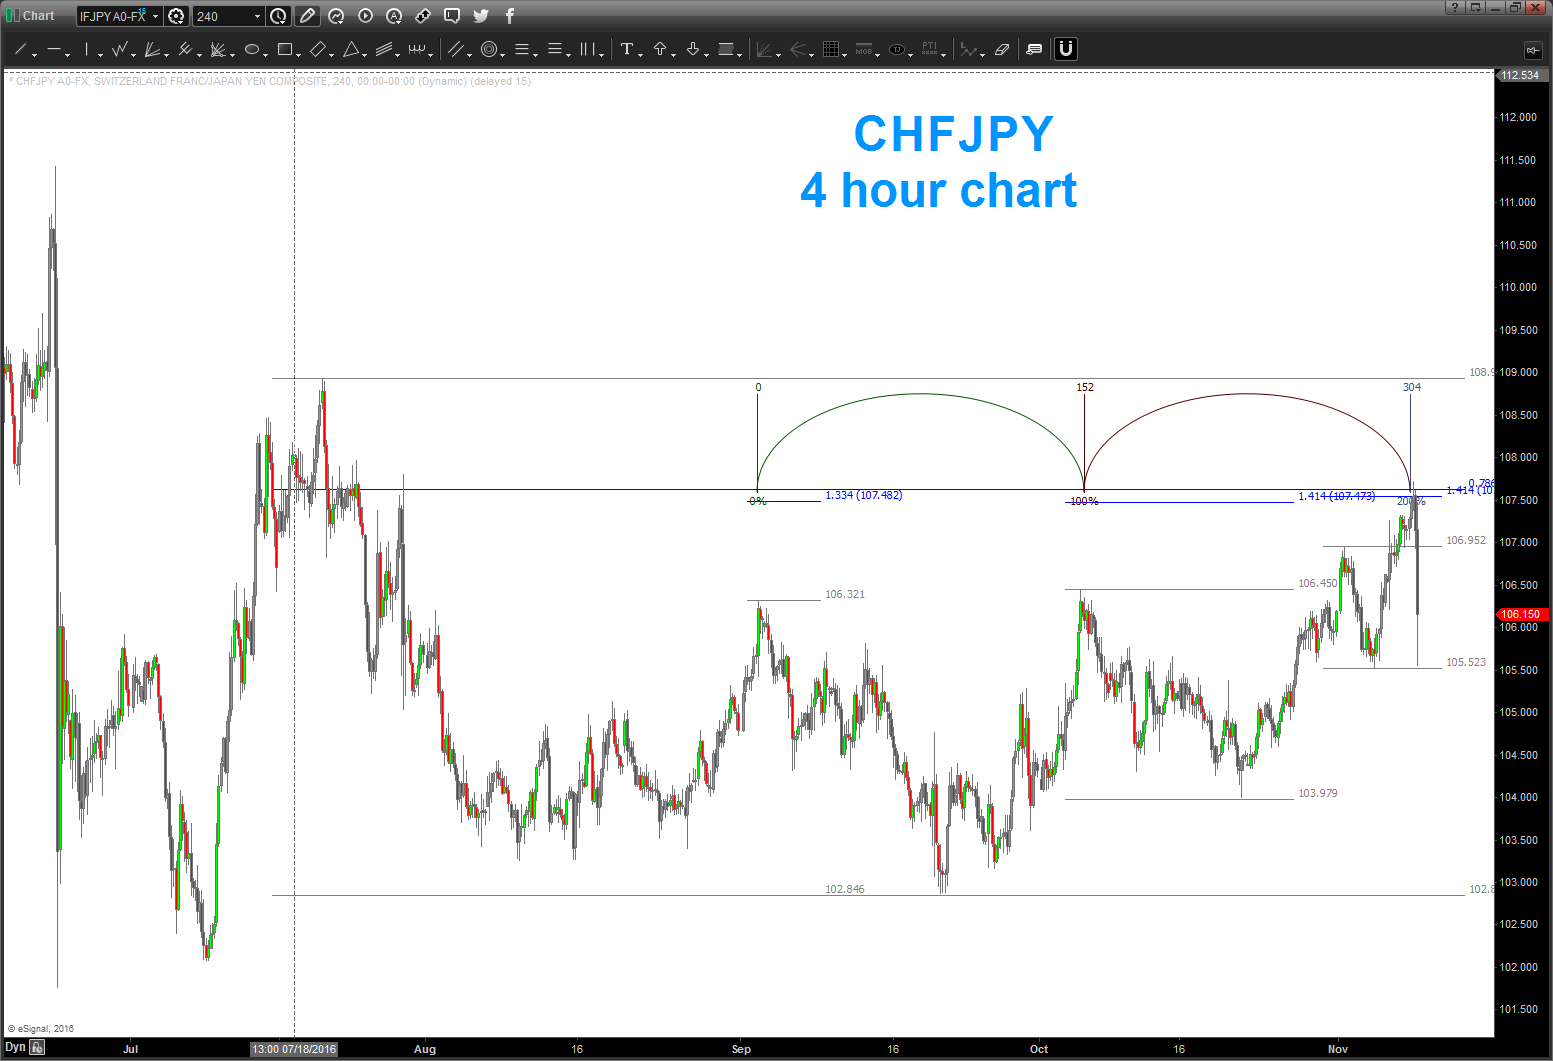
Posted on November 8, 2016 Leave a Comment
I have no idea what’s going on in the election … I can surmise by the markets that perhaps Trump has a lead? Really don’t know … but what I can say is this little pattern on the CHFJPY hit this afternoon to the pip and well … see below.
just take one second … and think about it. THIS PATTERN WAS BEFORE ANY ELECTION …of course, everyone trading the CHFJPY spot cross knew this …
um, not.
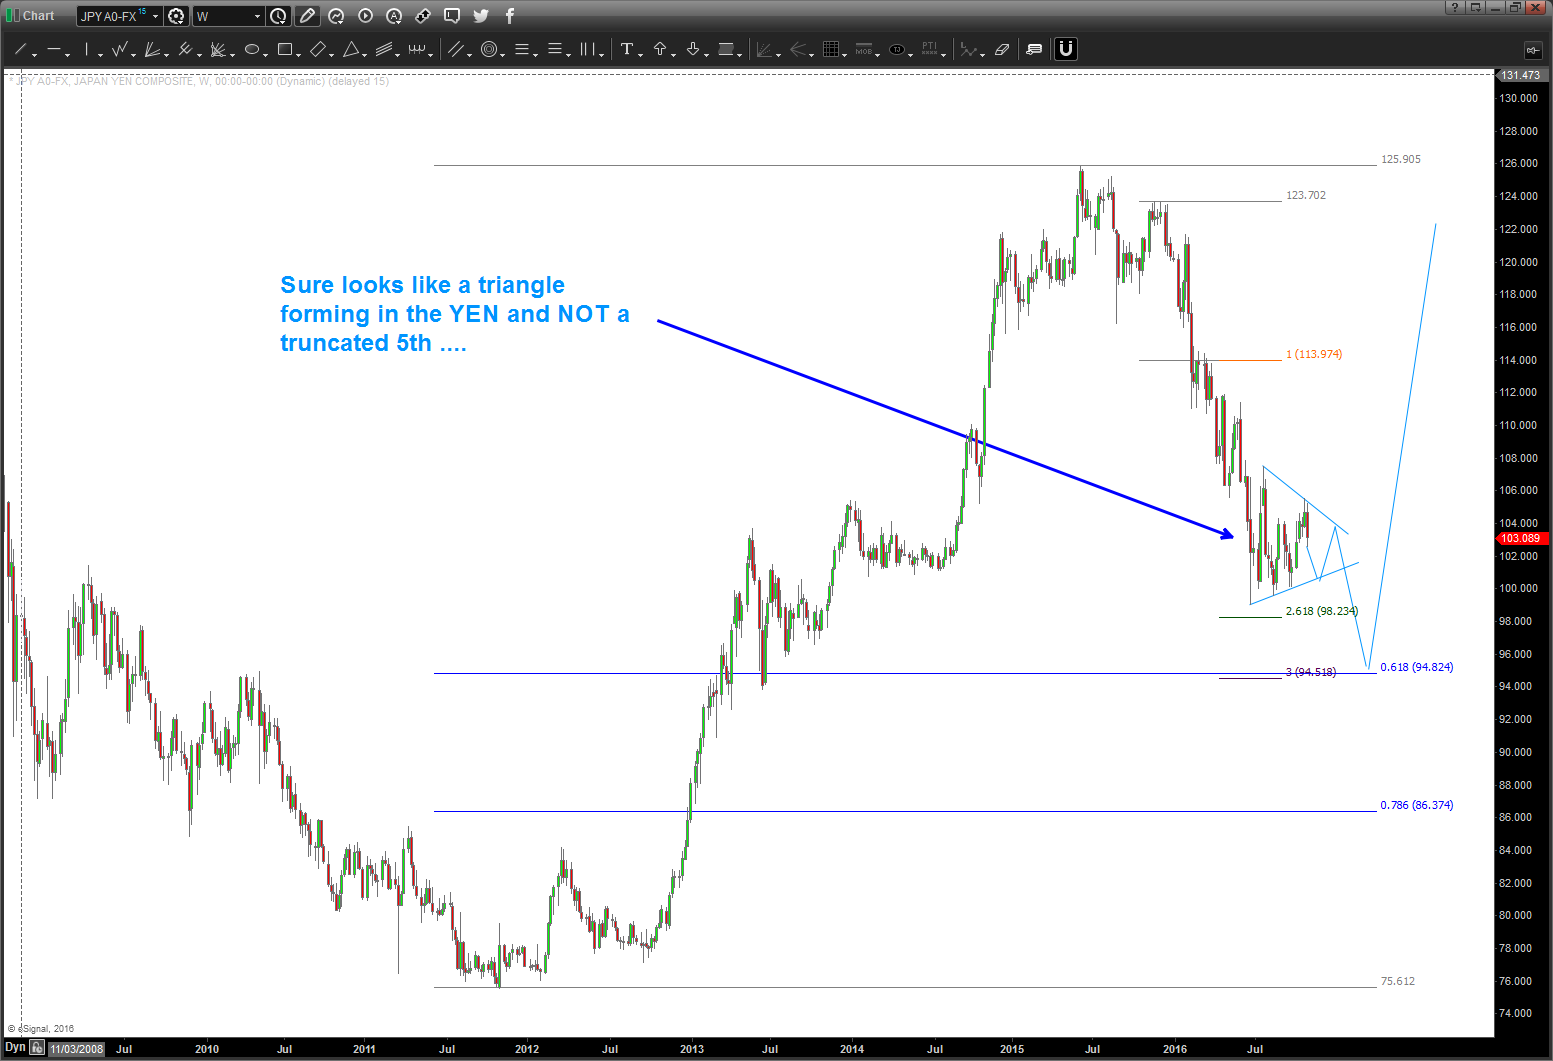
YEN – update
Posted on November 5, 2016 Leave a Comment
sure looks like a big ole triangle is forming and ‘not’ the truncated 5th. no clear pattern present but we’ll have to watch and see over the coming days and weeks.
NOT as clear cut as I thought …
B