the “Willie Willie” ,Derivatives and Deutsche Bank
Posted on October 1, 2016 2 Comments
October 01, 2016 – UPDATE on DB
yes, over a year ago, the storm clouds were brewing around $DB. there were some nice patterns present for the DB move on Friday. no conspiracy theories here BUT somebody BIG came in an bought DB. the “news” was heightened, the CNBC talking head pundits made it a story and THAT folks makes it time to cover. Once “markets in turmoil” CNBC or some chucklehead w/ an MBA from Harvard starts opining about it the move is done for now ..
so where are we? Well, if you look at the charts below you’ll see that 1) the EURO, the DAX and DB all moved together … makes sense as they both are flirting w/ disaster.

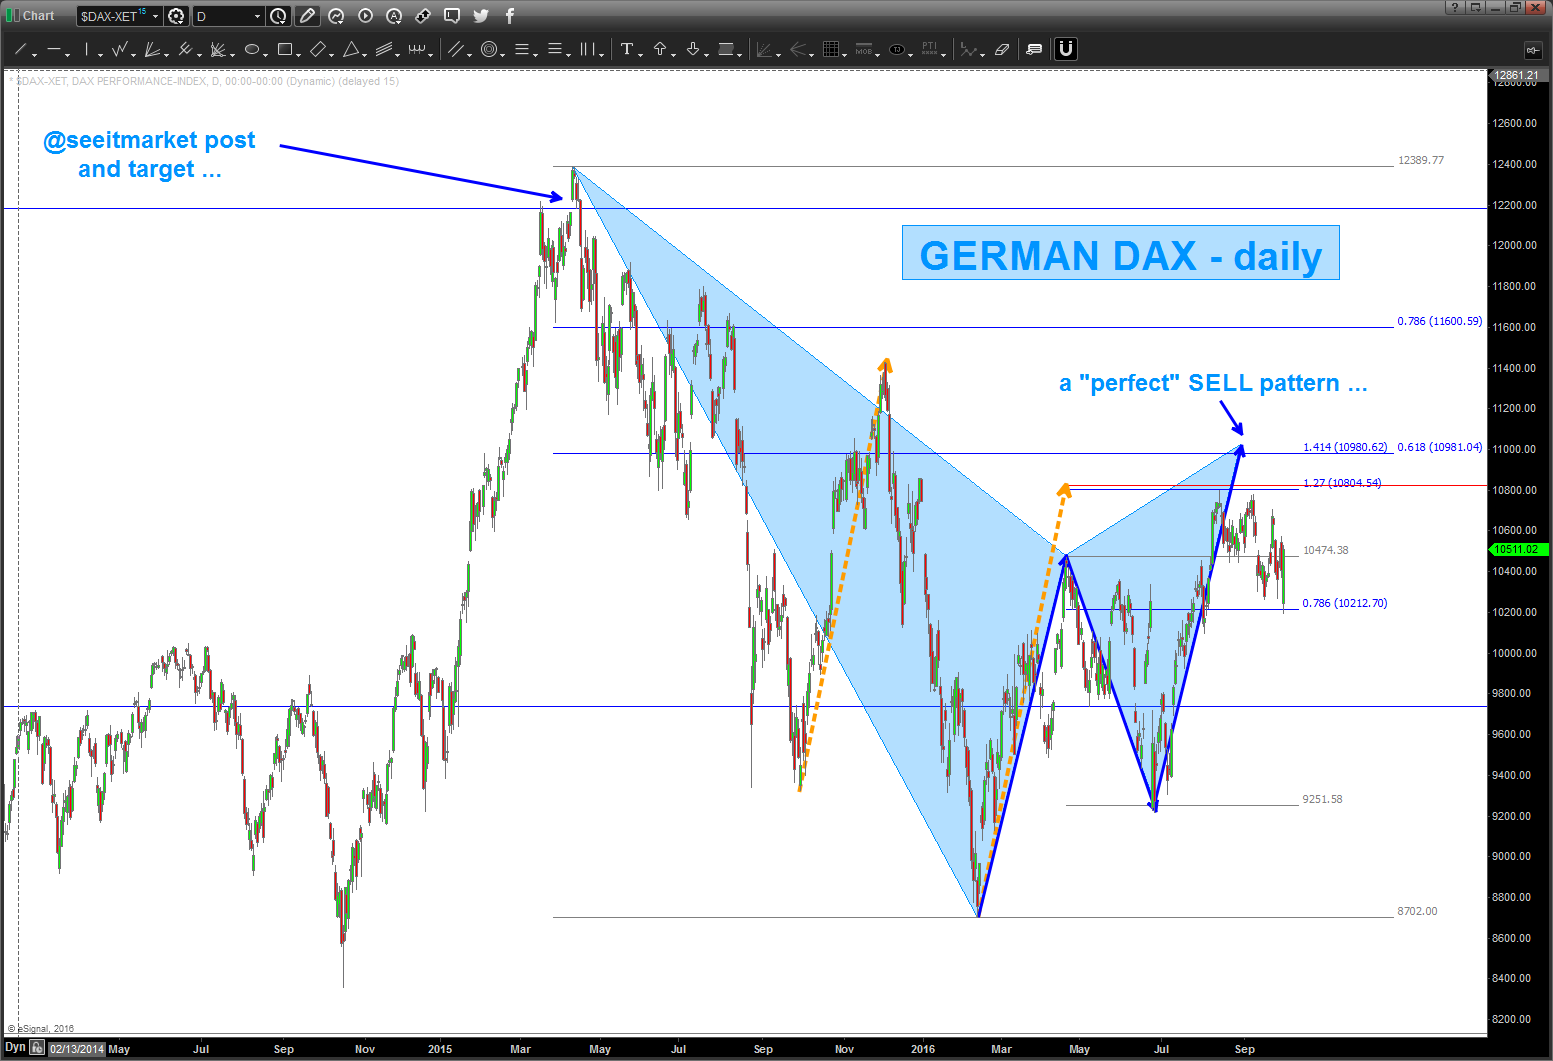
here’s a post I did for the gang over @seeitmarket: http://www.seeitmarket.com/german-dax-chart-says-pullback-then-final-thrust-higher-14248/
the clearest picture I have, right now, is on the GERMAN DAX. Below you’ll find a GARTLEY SELL pattern and it’s a beauty!
so, let’s do the IF THEN game ..
IF this PATTERN works
THEN the
DAX and the EURO and DB should
start another leg down and it could get very ugly.
IF this PATTERN fails
THEN the
count for @seeitmarket is correct and the DAX will go to new highs and, for now, we
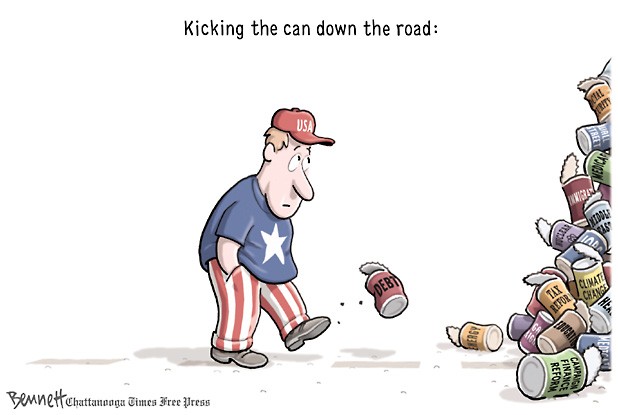
have kicked the can down the road.
the ‘line of death’ so to speak is the area denoted sell pattern OR perhaps a little higher at the .786.
STAY TUNED
Please, come to my help but Merkel said she won’t “bail out DB” …ummmmm, yeah right.
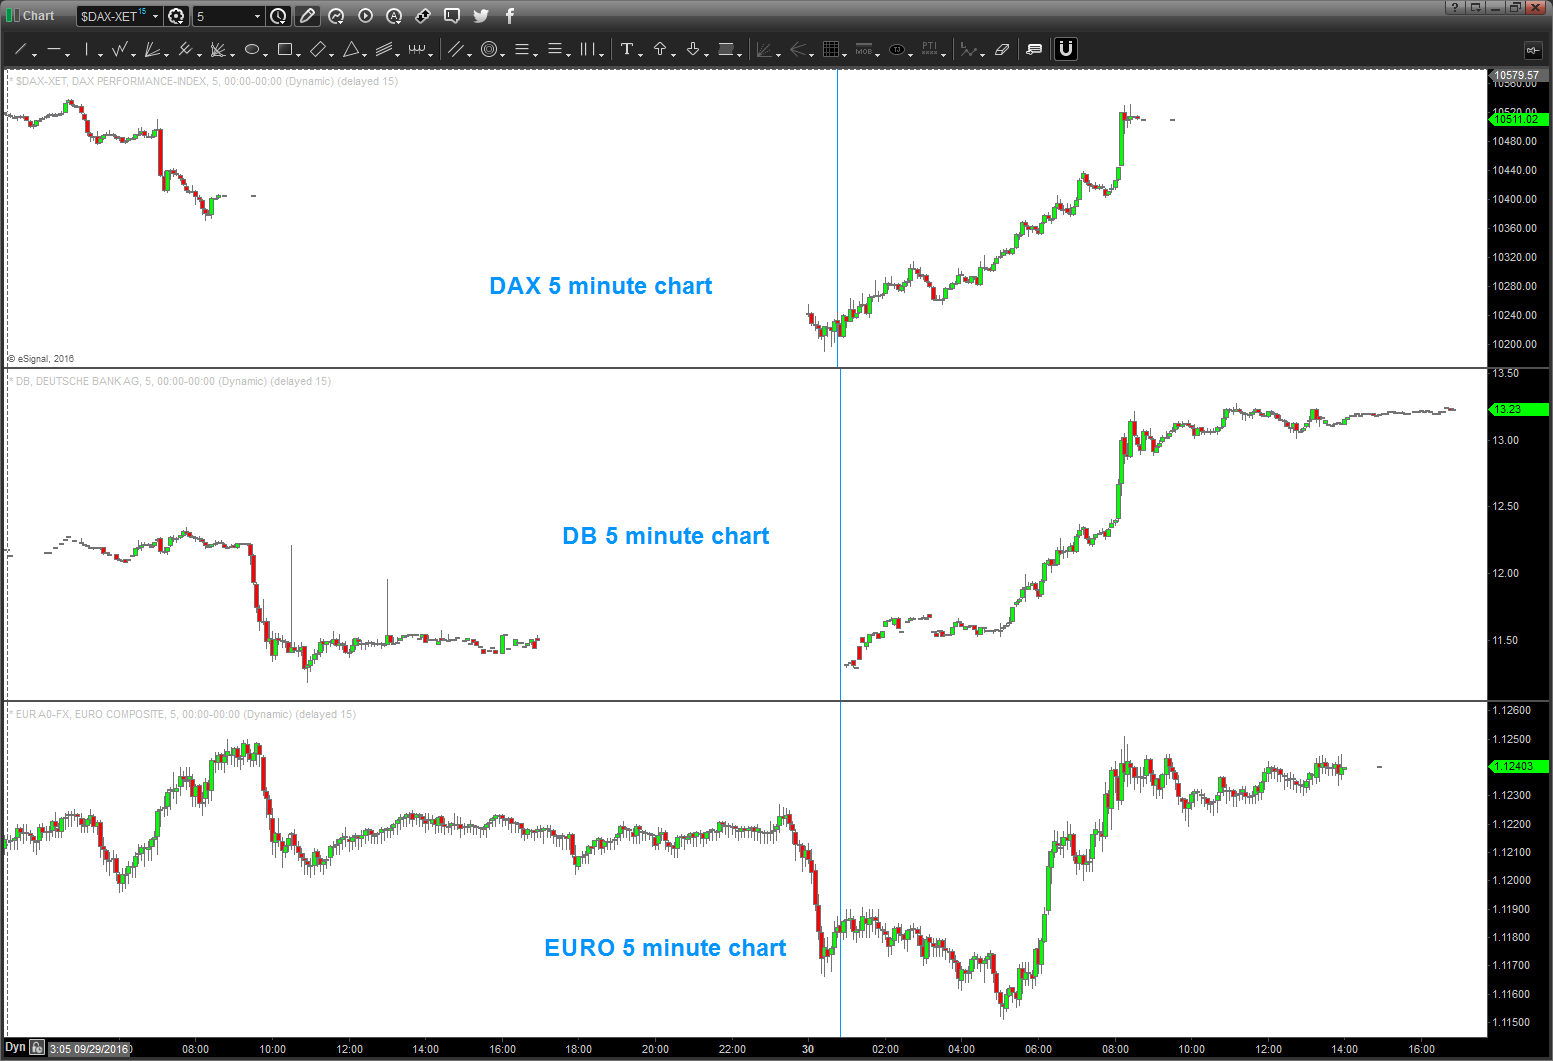
they all bottomed in/around the same time and off they went … go figure, right?
so, the clearest picture is the GERMAN DAX sell PATTERN above – that will tell us a lot of where we are.
have a good weekend and Beat Air Force!
B
One of the things REQUIRED before flying was to check the weather. Makes sense, hugh?
One day, we checked the weather and, well, there was a “Willie Willie” or weather warning for our local area for when we were going to be landing. News flash, don’t go flying…..BUT (always the “but” rebuttal) we HAD TO GET A JET “profile checked” before going to the boat. So, we looked at each other and said the proverbial words –
“doesn’t look like this WW is going to develop as forecasted.”
that was “always” the defense of idiots who launched into bad weather ….
Guess what, it was one hell of storm, we landed w/ a tornado touching down around 8 miles from our location BUT (the proverbial BUT) the jet flew out to the aircraft carrier the next day.
“idiots, party of two your table is ready”
“we’re here and will take our seat”
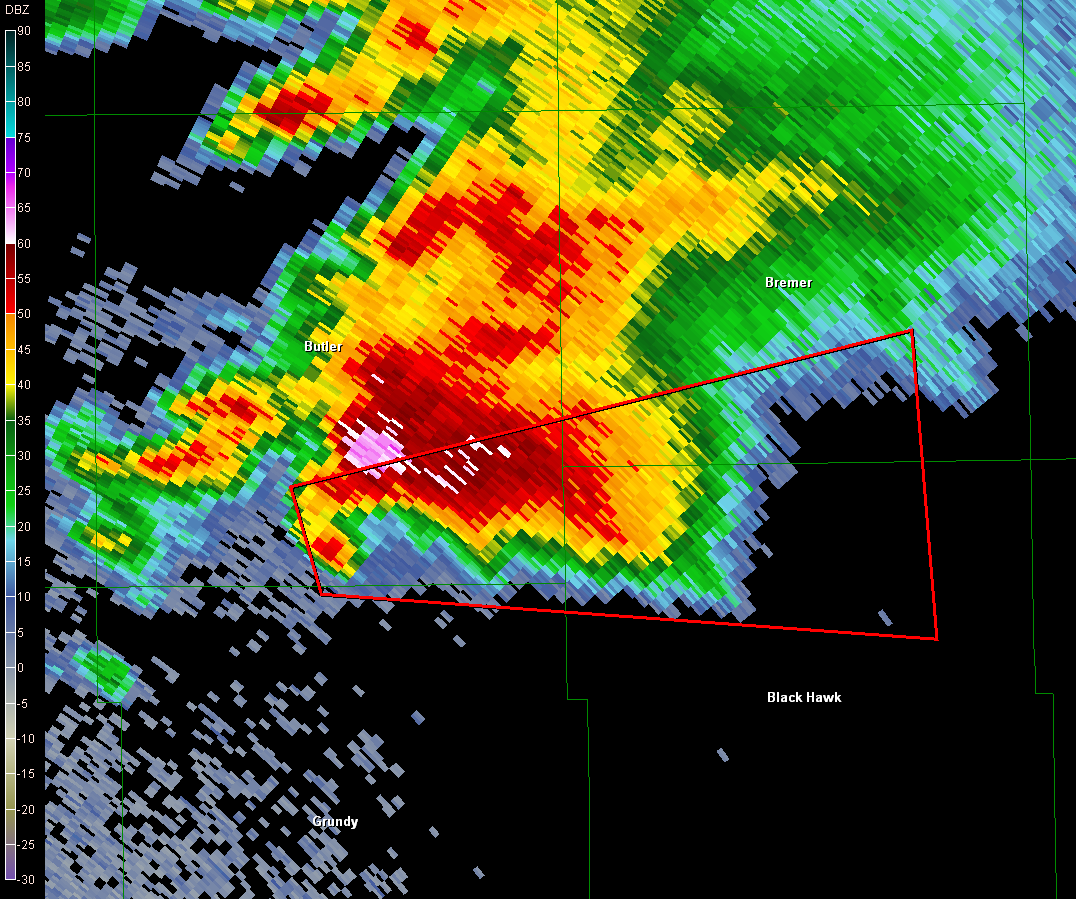
folks, we have another “Willie Willie” on the horizon and it’s financial in nature. Here’s the “weather radar picture” of the storm approaching – Deutsche Bank.
hate to mention the fundamentals, but all of this has happened in the past 6 months:
– Deutsche co-CEOs announce “resignation” nine months before their contracts expire
– CEO Anshu Jain was given more power to reorganise the bank
– Deutsche have been engaged in money laundering, tax evasion, derivative and manipulation scandals
– Deutsche is world’s largest holder of financial weapons of mass destruction (FWMD)
– Deutsche Bank’s derivatives position almost 15 times as large as Germany’s GDP
here’s what the “Oracle of Omaha” thinks about Derivatives:
there are 1.4 QUADRILLION DERIVATIVES OUTSTANDING …..
So, YOU make the FINANCIAL DECISION to go “flying” into a “Willie Willie” or not and YOU can also “play it safe” and NOT go “flying” into something that looks pretty bad …
REMEMBER SINCE 2009 NONE OF THE “DOOM AND GLOOM” FORECASTERS HAVE BEEN CORRECT BUT EVERY ONCE IN A WHILE A “WEATHER MAN/WOMAN” GET’S IT RIGHT AND YOUR SOCKS GET KNOCKED OFF BY ONE HELL OF A STORM!
As for me … the recent 6 months have given us plenty of warning that a storm is definitely brewing and, perhaps, is going to develop as forecasted.
Now, for the “if-then”
IF
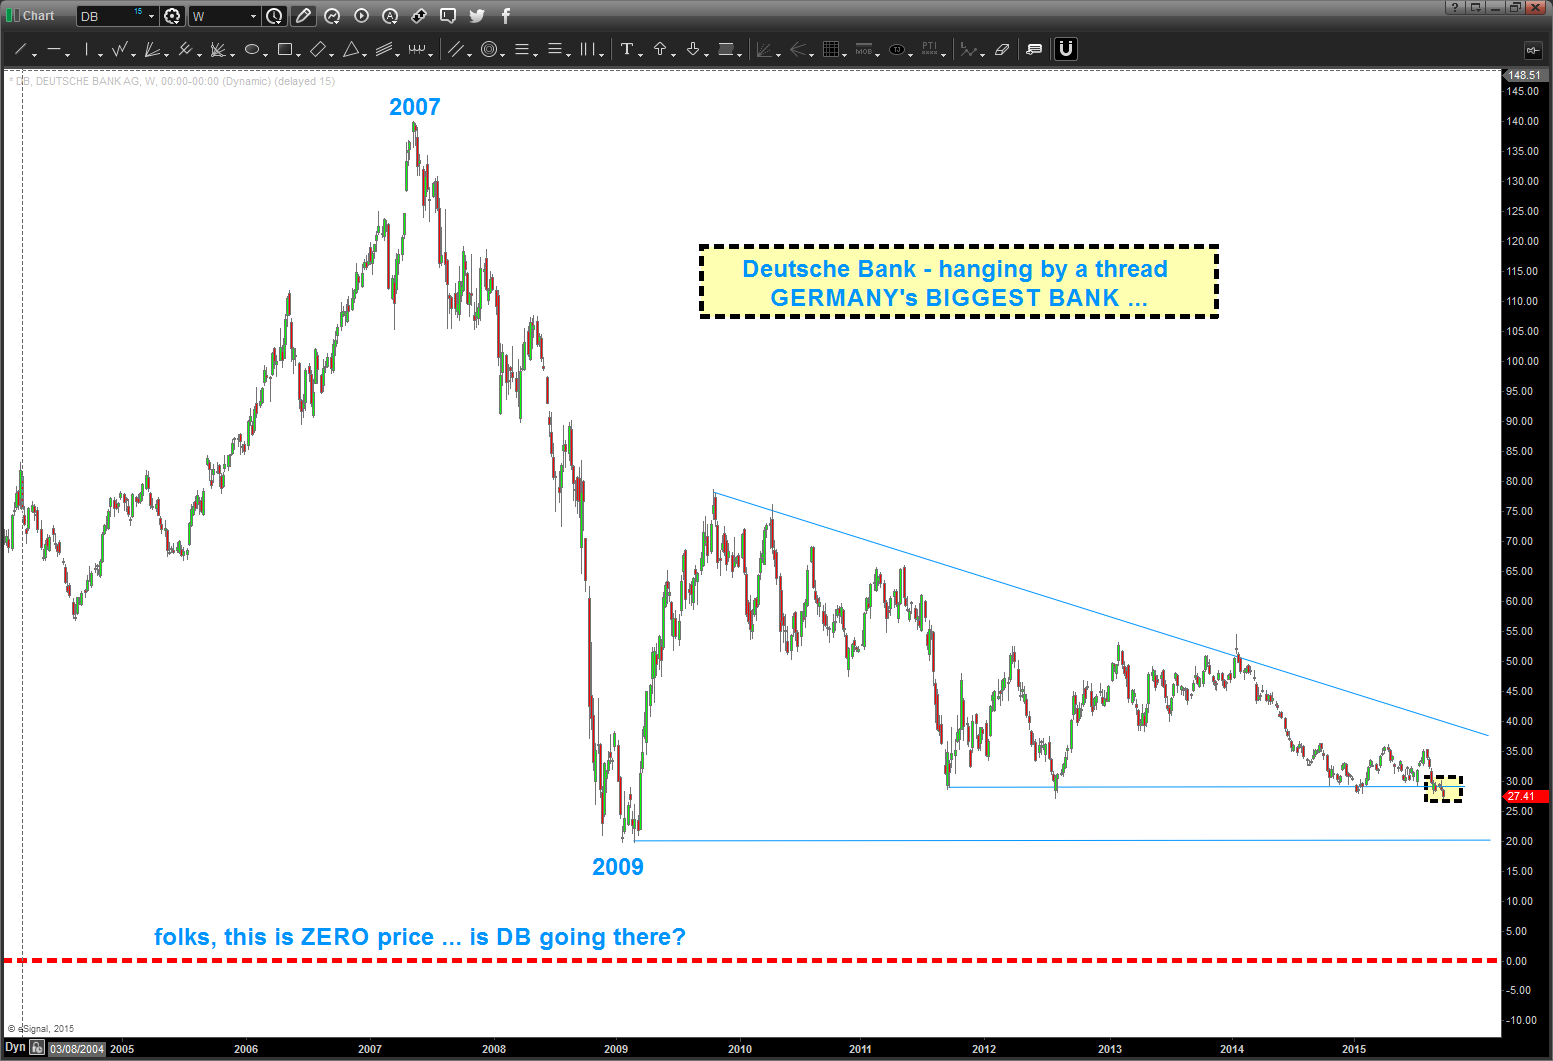
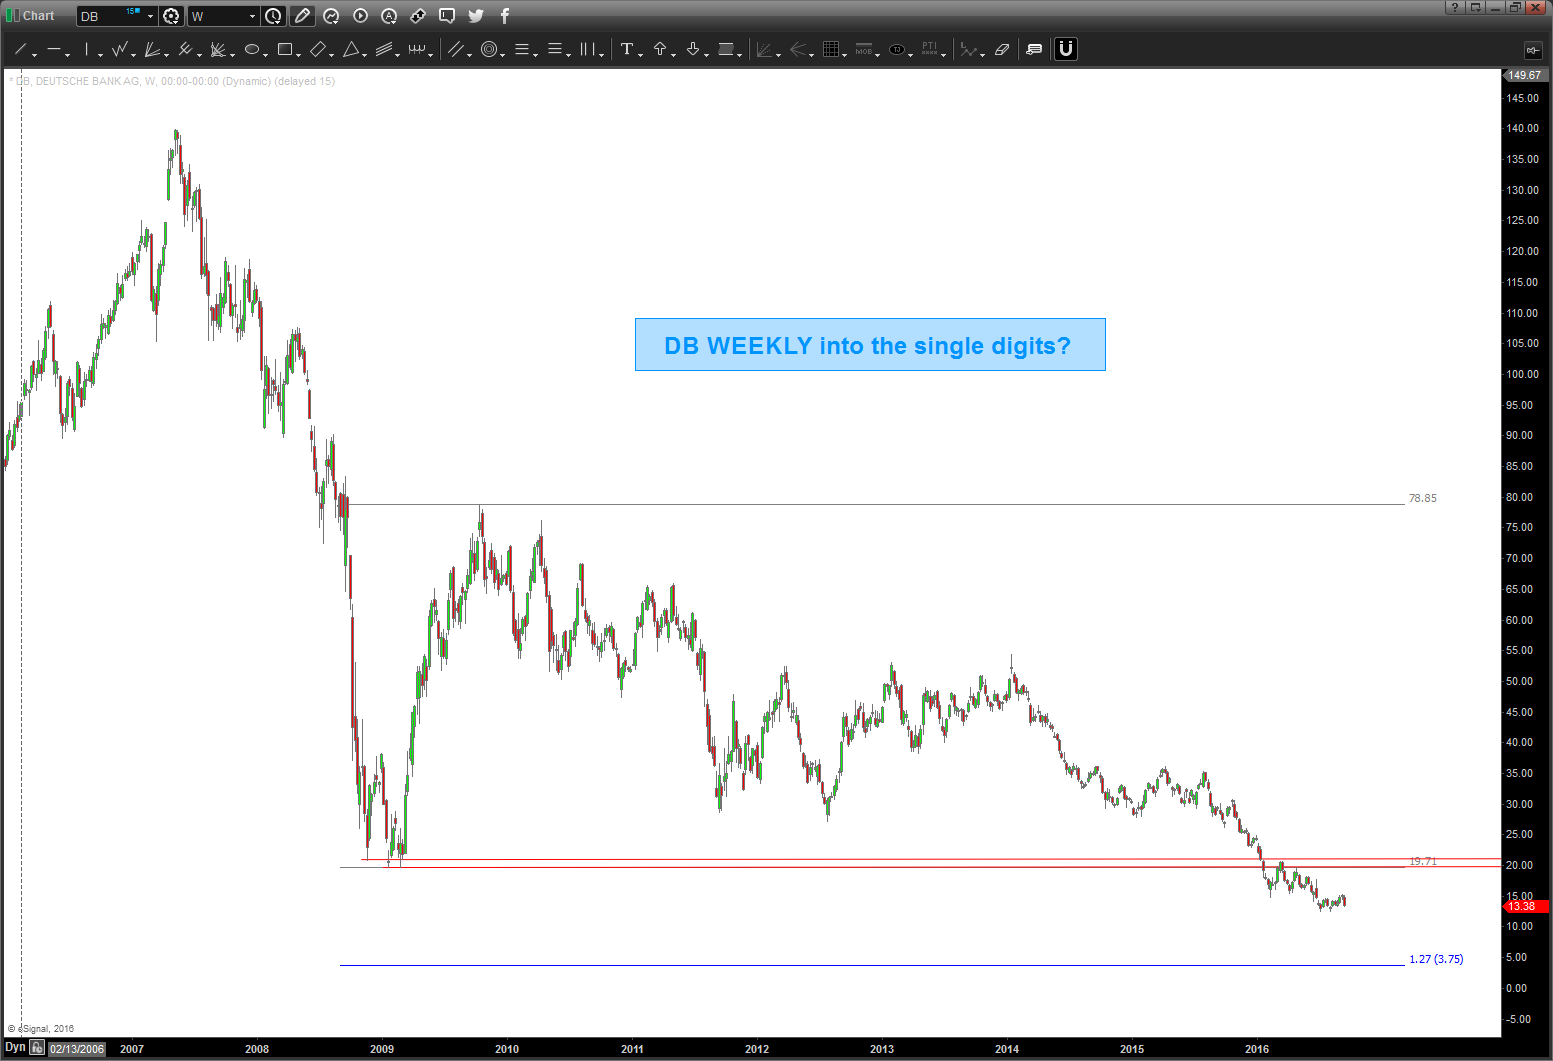
$DB breaks another level of support (20/share)
THEN
IS
the worlds largest derivative holder bankrupt?
IF
this is the case
THEN
things could/will get pretty ugly, pretty fast
SO
keep your powder dry and
PERHAPS
NOT
take off into a forecasted (read probable) storm that is forecasted. the forecasters of “doom-gloom” haven’t gotten it right, yet.
folks, notice that no jets are flying off the deck this night. sometimes they “develop as forecasted” and “sometimes they don’t” …it’s all probability

“Heightened” Emotional States .. TRUST MEASURED MOVES
Posted on September 28, 2016 Leave a Comment
here’s the update and a BUY pattern …
A friend of mine alerted me to $RGSE (Real Goods Solar) today and how it was exploding .. folks, it certainly “was” and all the news feeds, social communities were all talking about it …
Knowing that I was getting into a bee hive of emotional energy the FIRST thing I thought was – MEASURED MOVES.
So, in the past a %227 (yes 227) bounce was the “norm” for this stock. Here’s some charts and note .. today, from the LOW to the HIGH was 227%. Is this stock going higher? I have no idea .. it was an AMAZING run today but look for LOW RISK entries where risk is ID’d. DO NOT GO WITH THE EMOTION – go w/ some sort of objective entry (fundamental or technical) that precisely defines your risk.
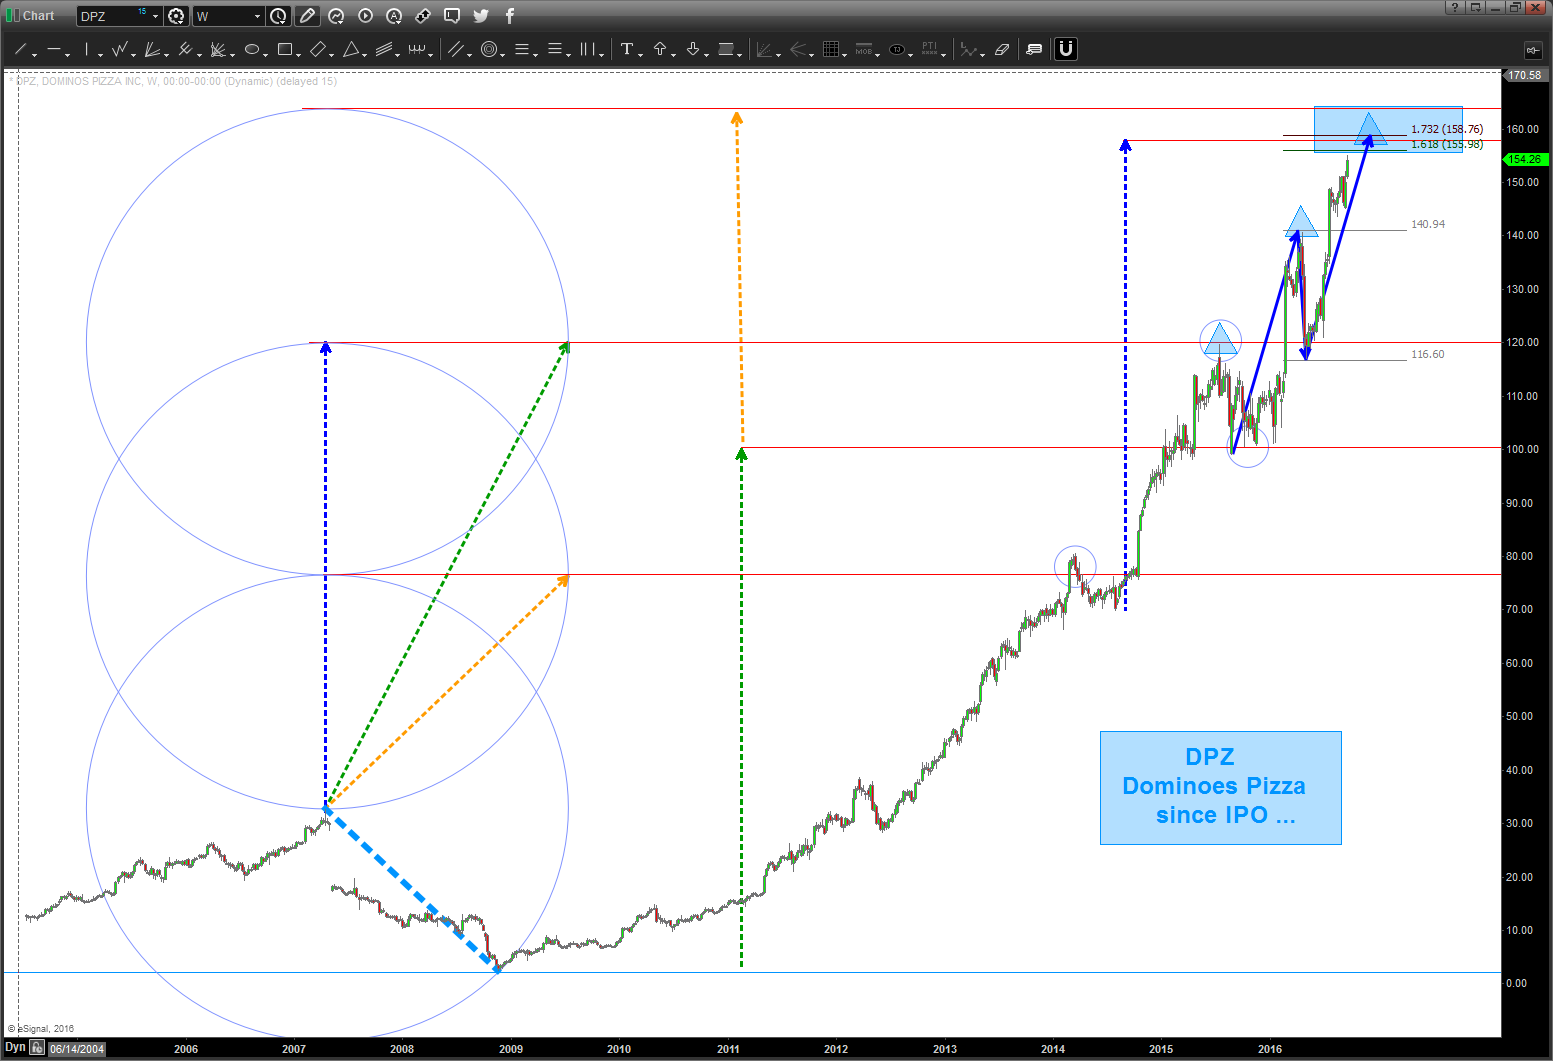
Chart 1: since IPO, note that “normal” corrections have been roughly 227 percent and, also note, it’s take a while for them to bounce that high. But 227% is the normal number …
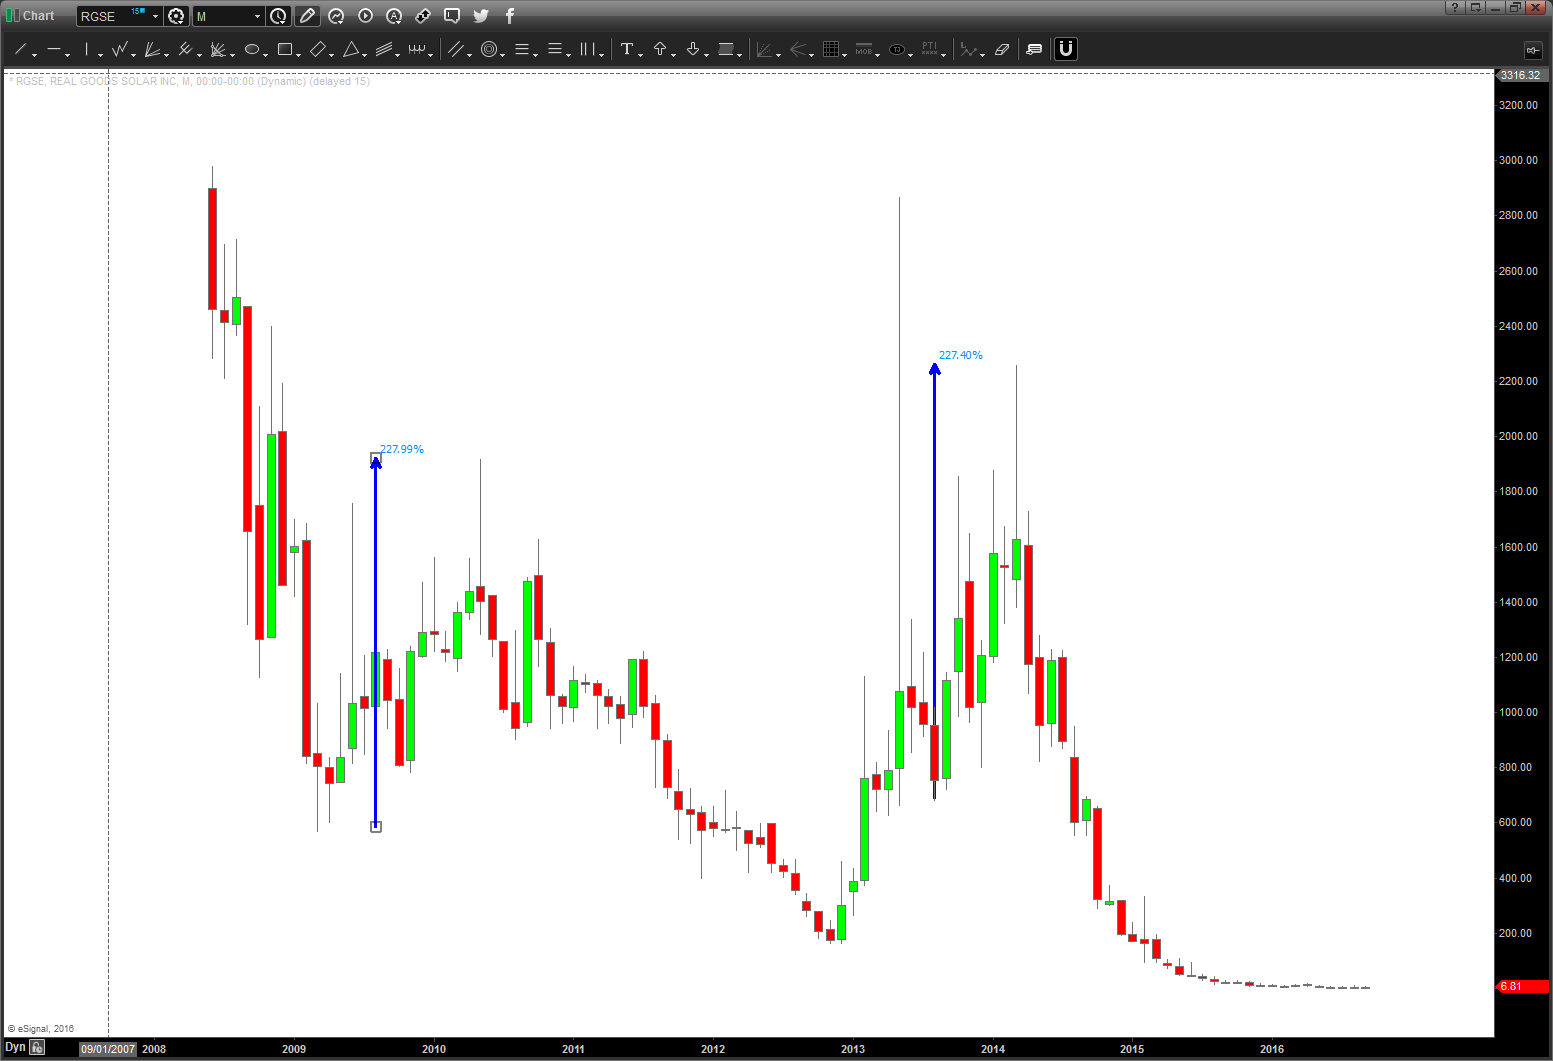
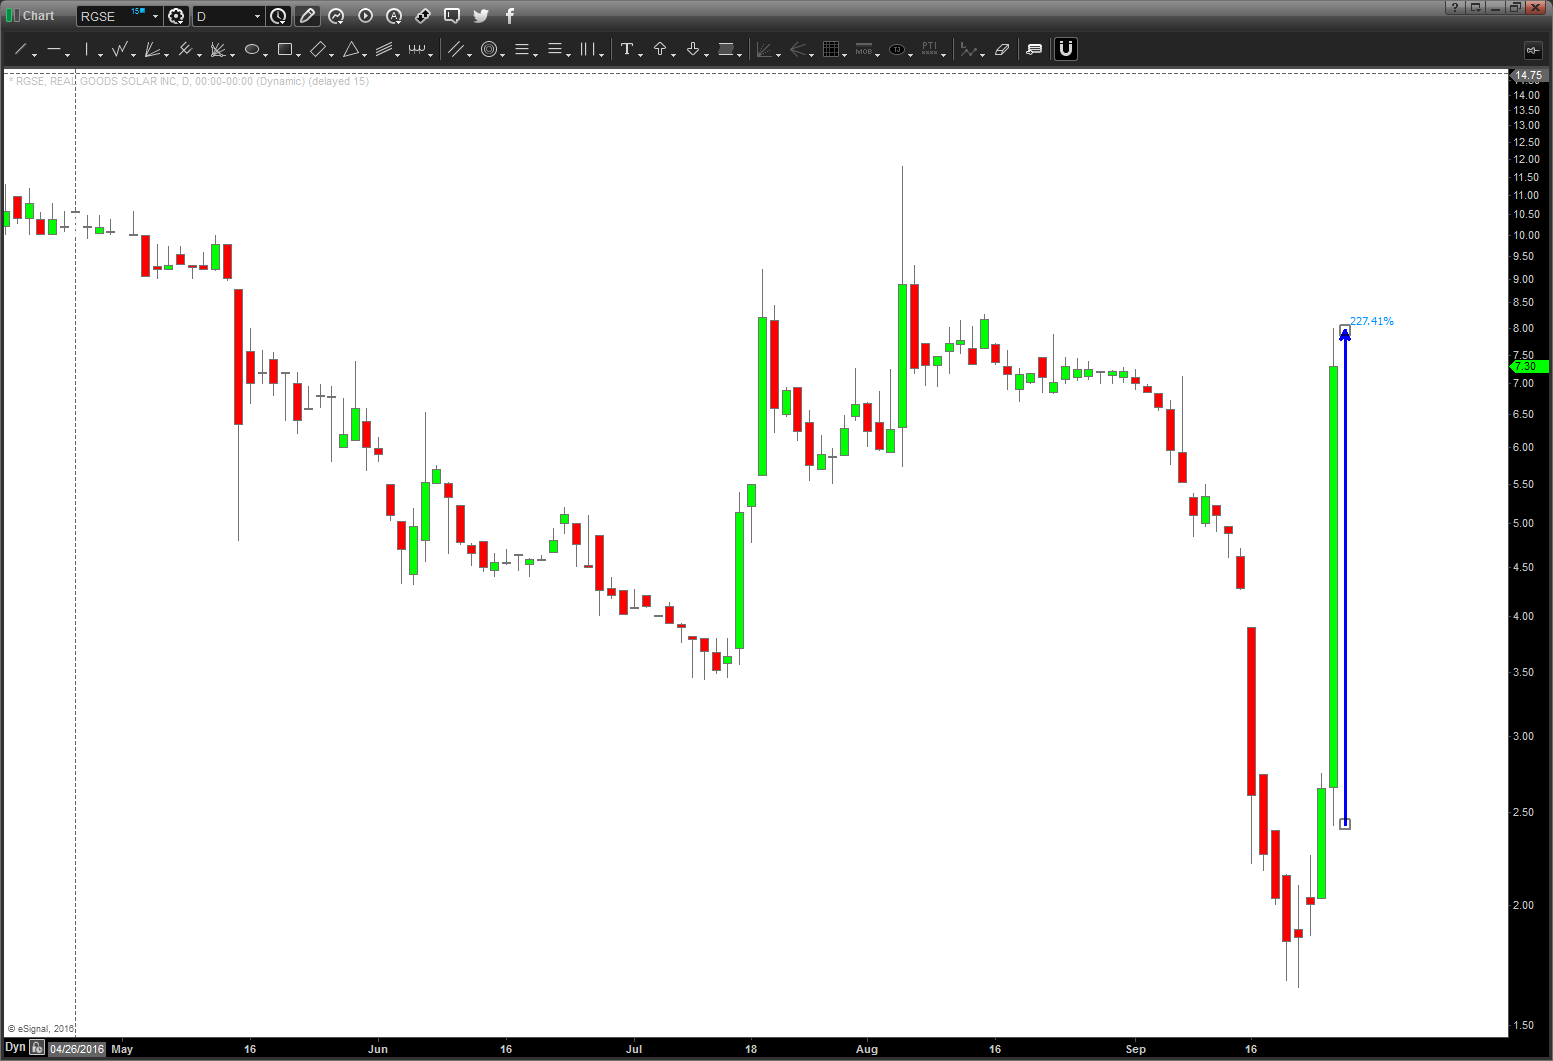
Chart 2: note, today, the chart went from LOW to HIGH exactly 227% and no higher
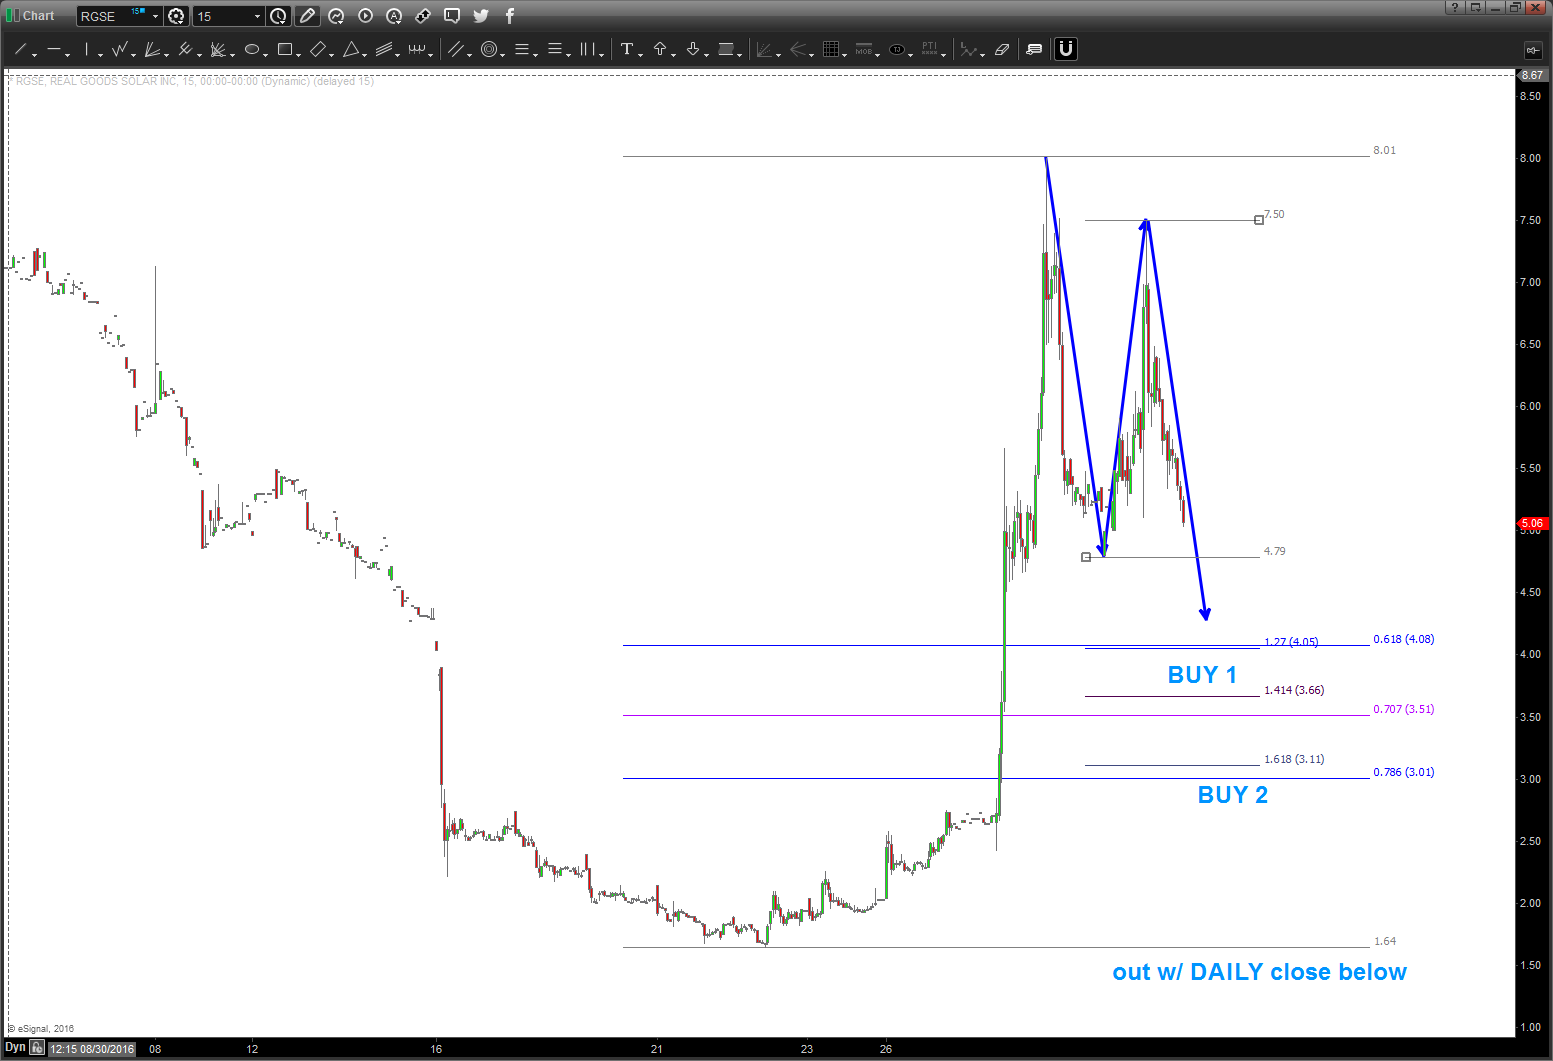
here’s the 5 minute chart:
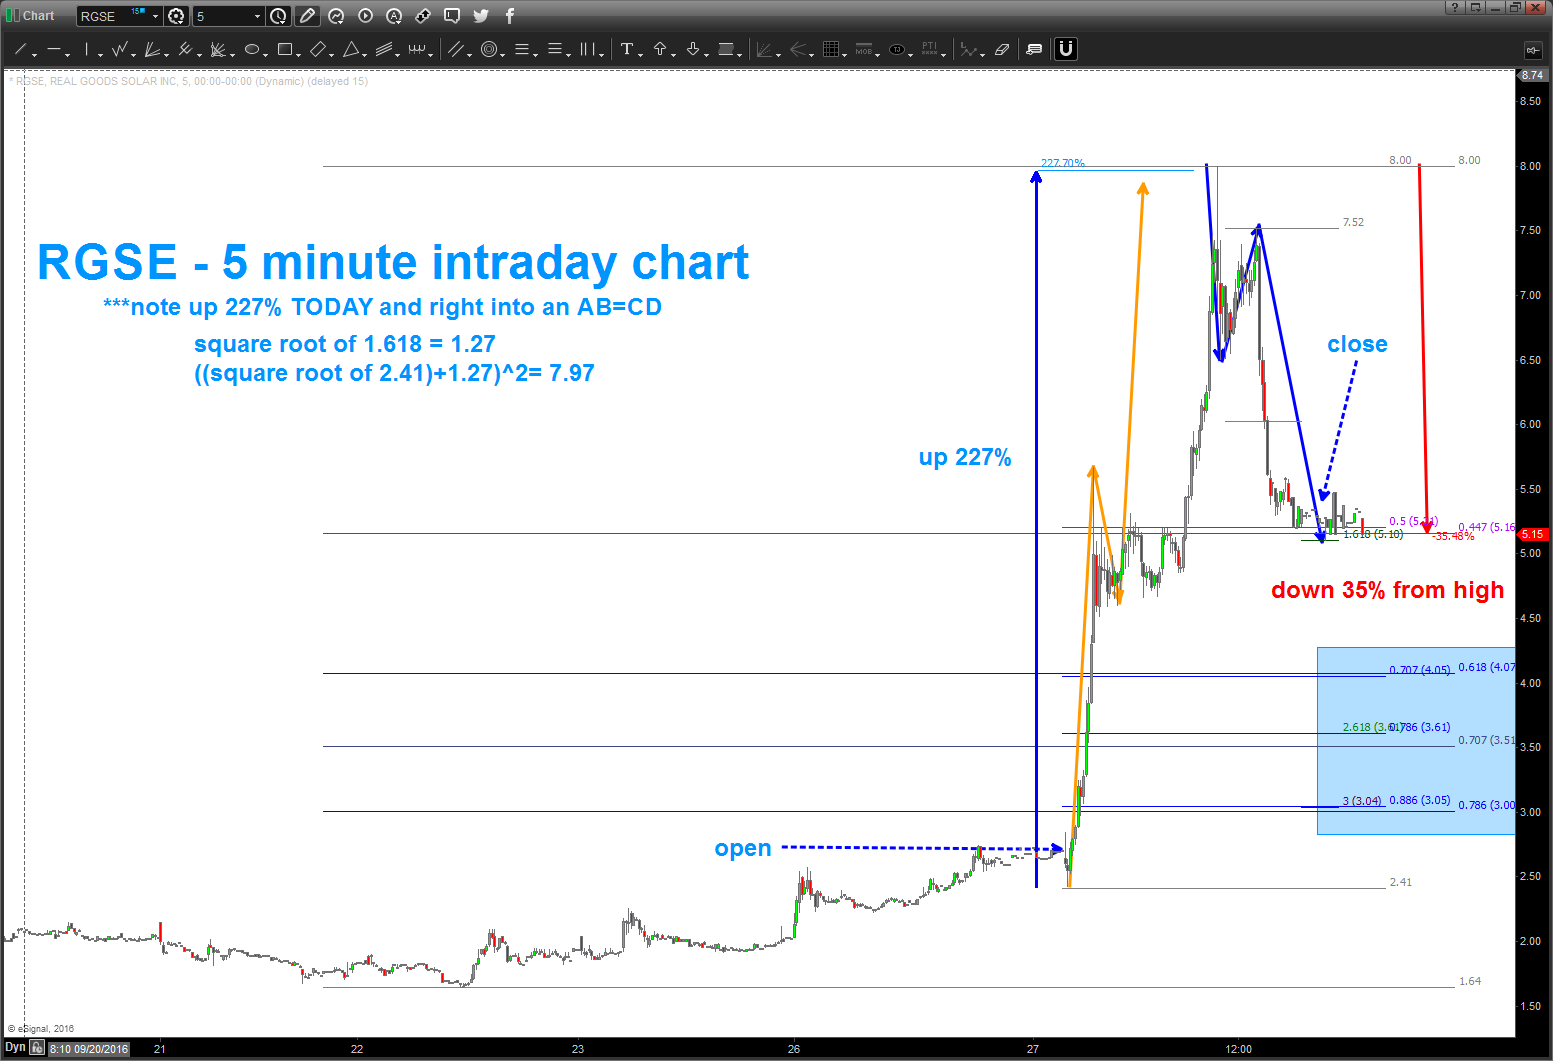
- note the LOW to the HIGH was 227% since that high, well it’s down 35%.
- note the orange AB=CD into the high.
- note the 1.618 price projection into the low at the close.
- note the square root projection using 1.27 from the low of the day. “bingo ..”
- note the blue rectangle area … try to long it there if your going to play w/ fire .. or just be patient. if it’s going to rock and roll a nice and CONTROLLED entry will occur and then you can catch this wave, if it’s real.
so, just showing you that the MATH that comprises the EMOTIONS of the MASSES doesn’t fail … know your measured moves during the heightened emotional time periods. They NEVER LIE.
rock on, ok?
Bart
“Heightened” Emotional States .. TRUST MEASURED MOVES
Posted on September 27, 2016 Leave a Comment
A friend of mine alerted me to $RGSE (Real Goods Solar) today and how it was exploding .. folks, it certainly “was” and all the news feeds, social communities were all talking about it …
Knowing that I was getting into a bee hive of emotional energy the FIRST thing I thought was – MEASURED MOVES.
So, in the past a %227 (yes 227) bounce was the “norm” for this stock. Here’s some charts and note .. today, from the LOW to the HIGH was 227%. Is this stock going higher? I have no idea .. it was an AMAZING run today but look for LOW RISK entries where risk is ID’d. DO NOT GO WITH THE EMOTION – go w/ some sort of objective entry (fundamental or technical) that precisely defines your risk.
Chart 1: since IPO, note that “normal” corrections have been roughly 227 percent and, also note, it’s take a while for them to bounce that high. But 227% is the normal number …
Chart 2: note, today, the chart went from LOW to HIGH exactly 227% and no higher
here’s the 5 minute chart:
- note the LOW to the HIGH was 227% since that high, well it’s down 35%.
- note the orange AB=CD into the high.
- note the 1.618 price projection into the low at the close.
- note the square root projection using 1.27 from the low of the day. “bingo ..”
- note the blue rectangle area … try to long it there if your going to play w/ fire .. or just be patient. if it’s going to rock and roll a nice and CONTROLLED entry will occur and then you can catch this wave, if it’s real.
so, just showing you that the MATH that comprises the EMOTIONS of the MASSES doesn’t fail … know your measured moves during the heightened emotional time periods. They NEVER LIE.
rock on, ok?
Bart
lot’s of cool math, music and square roots – the NASDAQ getting ready to run?
Posted on September 24, 2016 Leave a Comment
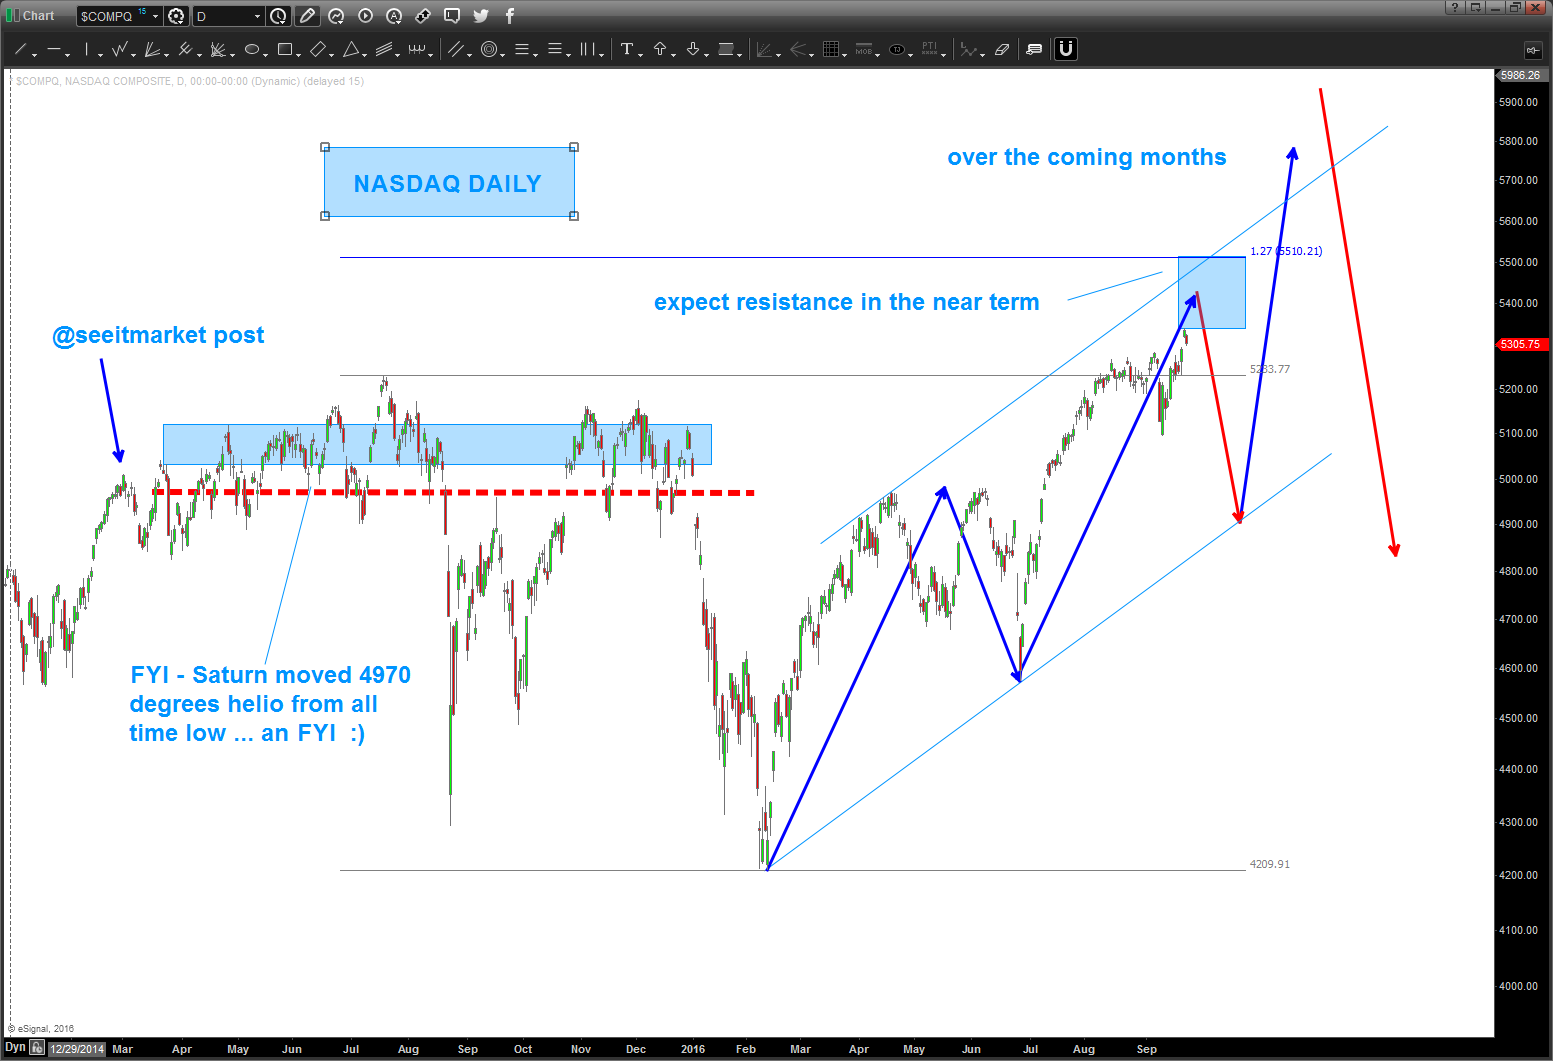
it was ALL THE WAY back in Feb 2015 that I did a post on the upcoming resistance of the NASDAQ and then the breakout to new highs … did it for Andy @seeitmarket here: http://www.seeitmarket.com/nasdaq-trend-line-converging-with-2000-high-breakout-14142/
in that post I wrote:
“let’s remember that this is a 40+ year chart, so setting up that move could take some time.”
one could argue it took almost 20 months …sheesh. anyway, let’s take a look at some “stuff”
how “strong” is the NASDAQ? Do a ratio analysis quick look:
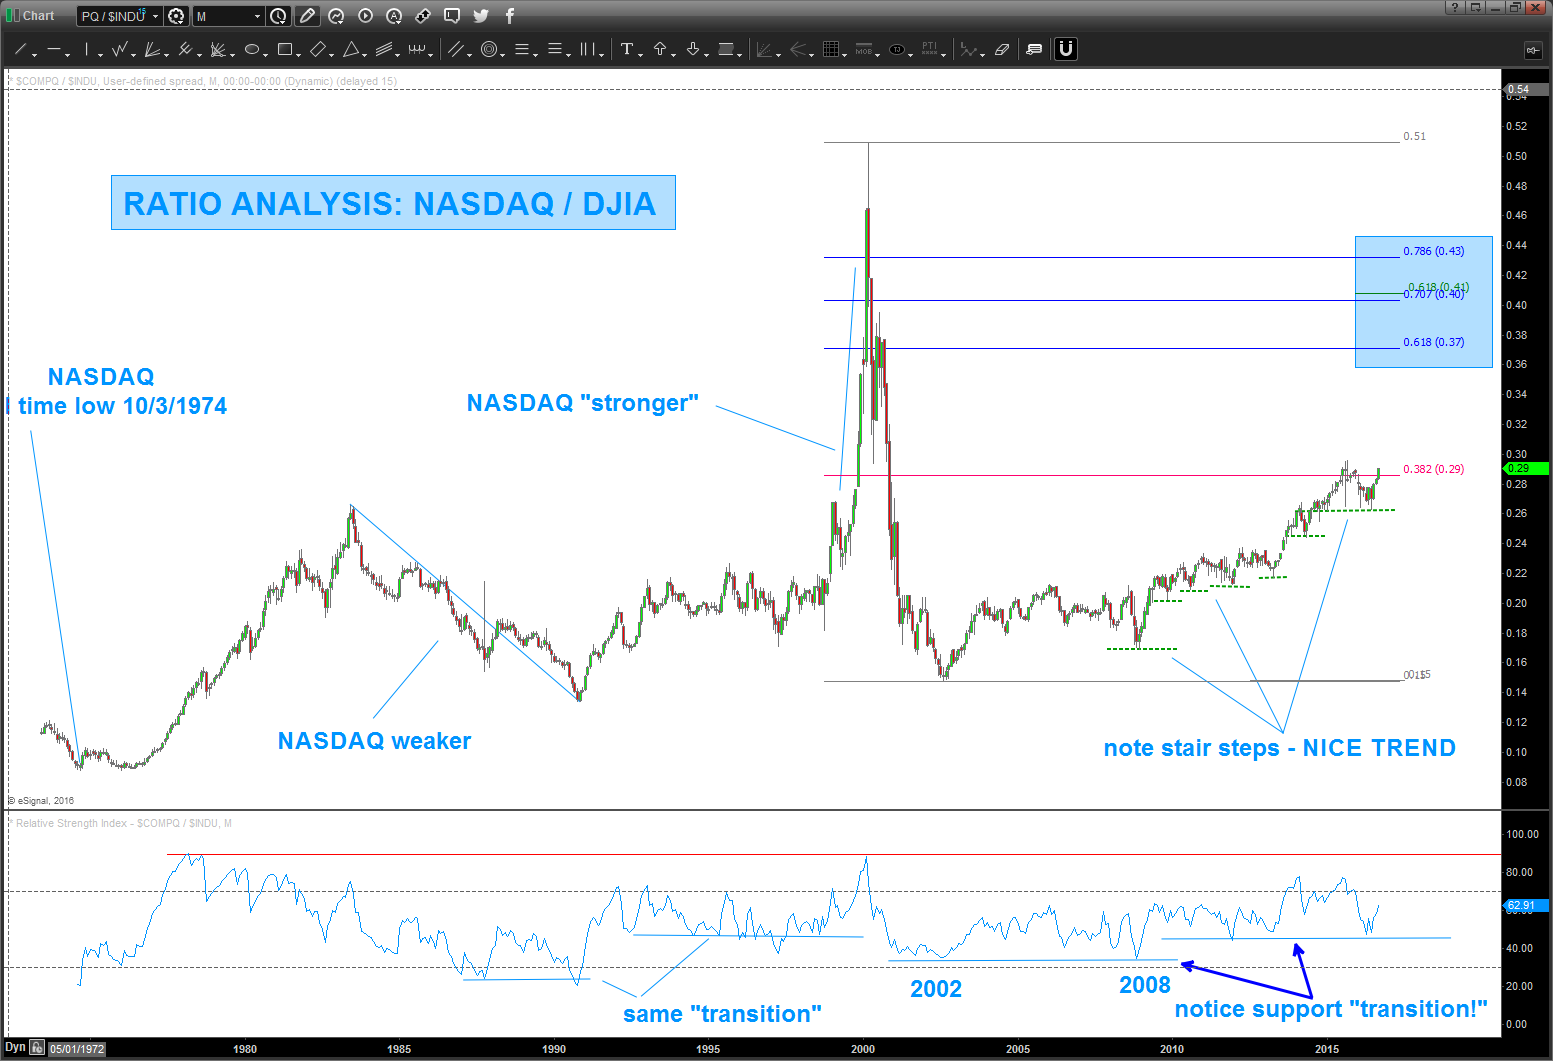
what are we doing here:
- make a ratio: NASDAQ / DJIA
- IF chart going HIGHER THEN the NASDAQ is stronger than the DJIA
- IF chart going LOWER THEN the NASDAQ is weaker than the DJIA
- NOTE, we’ve been slowly and steadily stronger than the DJIA (chart doesn’t lie) but NOTE there has been no BIG move, yet.
- Stair Steps UP (where no swing low is broken) are powerful indicators of an underlying trend ….this trend is strong in a relative strength sense…
- folks, again, IT TOOK 14 YEARS for the NASDAQ relative strength to retrace .382 percent of the 2000 blow off tech top. Slow and steady move higher …
- HERE’S the KEY …note the RSI. the support transition that has occurred tells you that the market has possibly shifted into a much more bullish mode and is one that should be noted and taken seriously! frankly, we might be on the verge of a big parabolic move like 2000 … g
- PATTERNS work ….note the blue shaded areas, those are “likely” targets for this move … could it go to new all time highs? Yes, the RATIO could do that but, for now, let’s pay attention to the breakout about to occur at the .382 (red line)
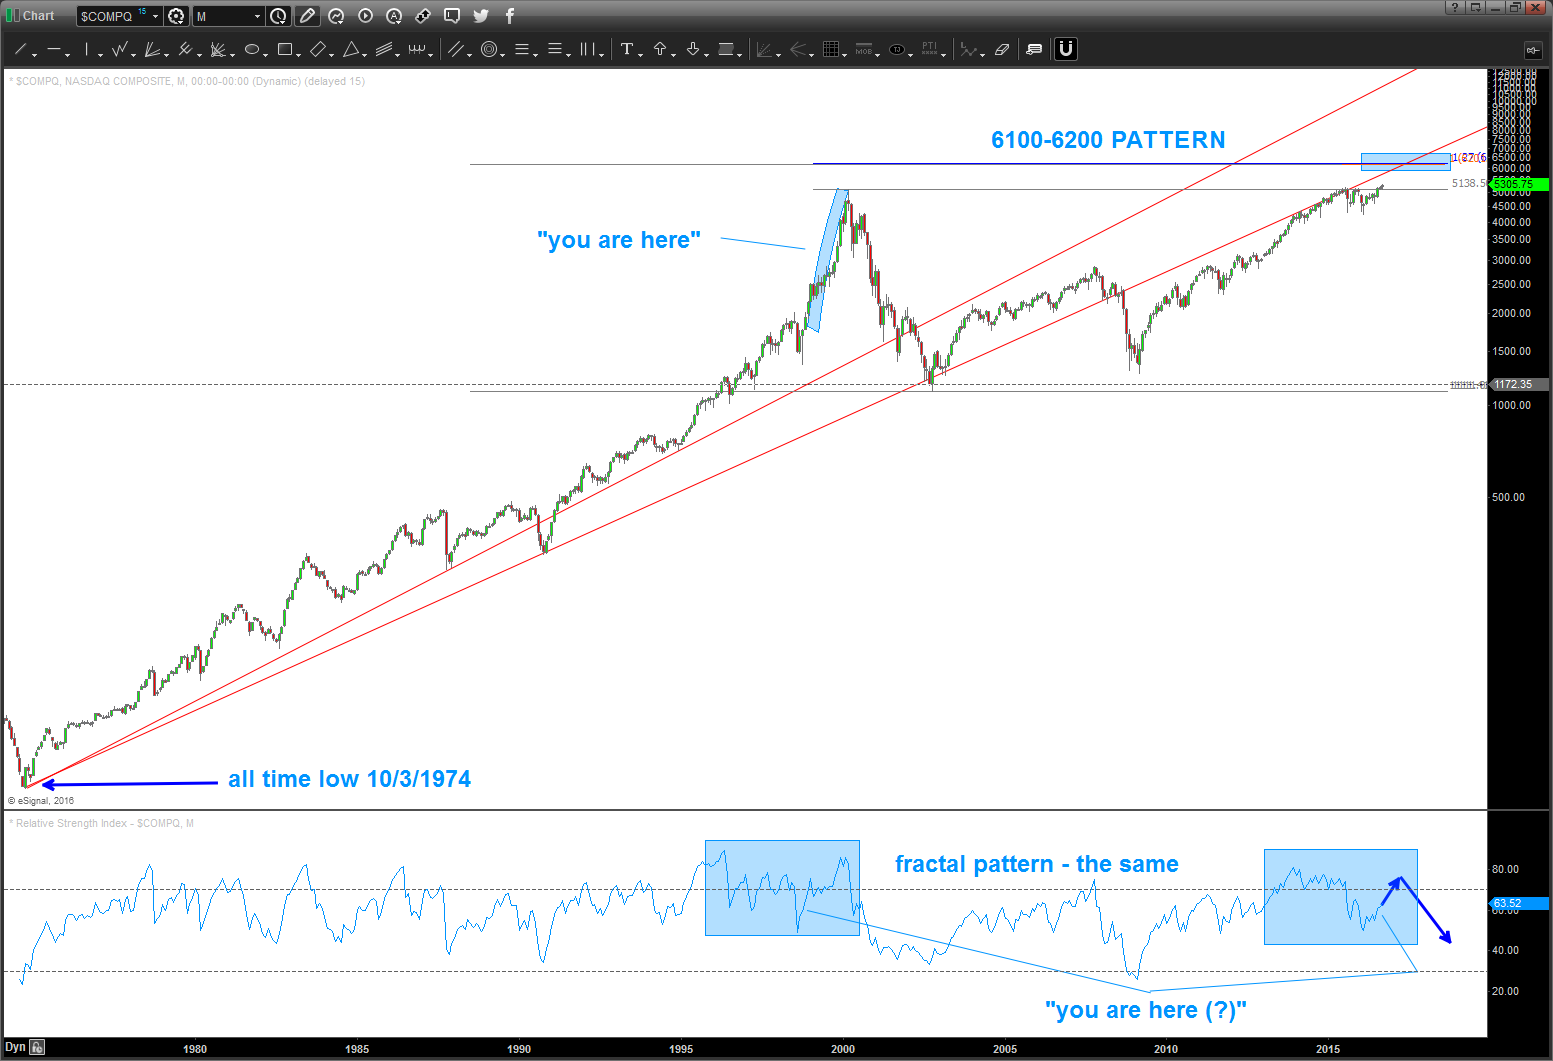
the chart above is a “long term” LOG chart of the NASDAQ from it’s all time low …
- note the two red trend lines. the lower trend line is pretty powerful and price is just clinging to it …with this breakout to a new high I believe the NASDAQ has, at a minimum 10% move coming into the 6100-6200 level.
- also – NOTE the FRACTAL on the RSI. It certainly appears to be doing the “exact” same move ..
- a high, a couple bumps and then a dump into a low and then a move higher to build negative divergence.
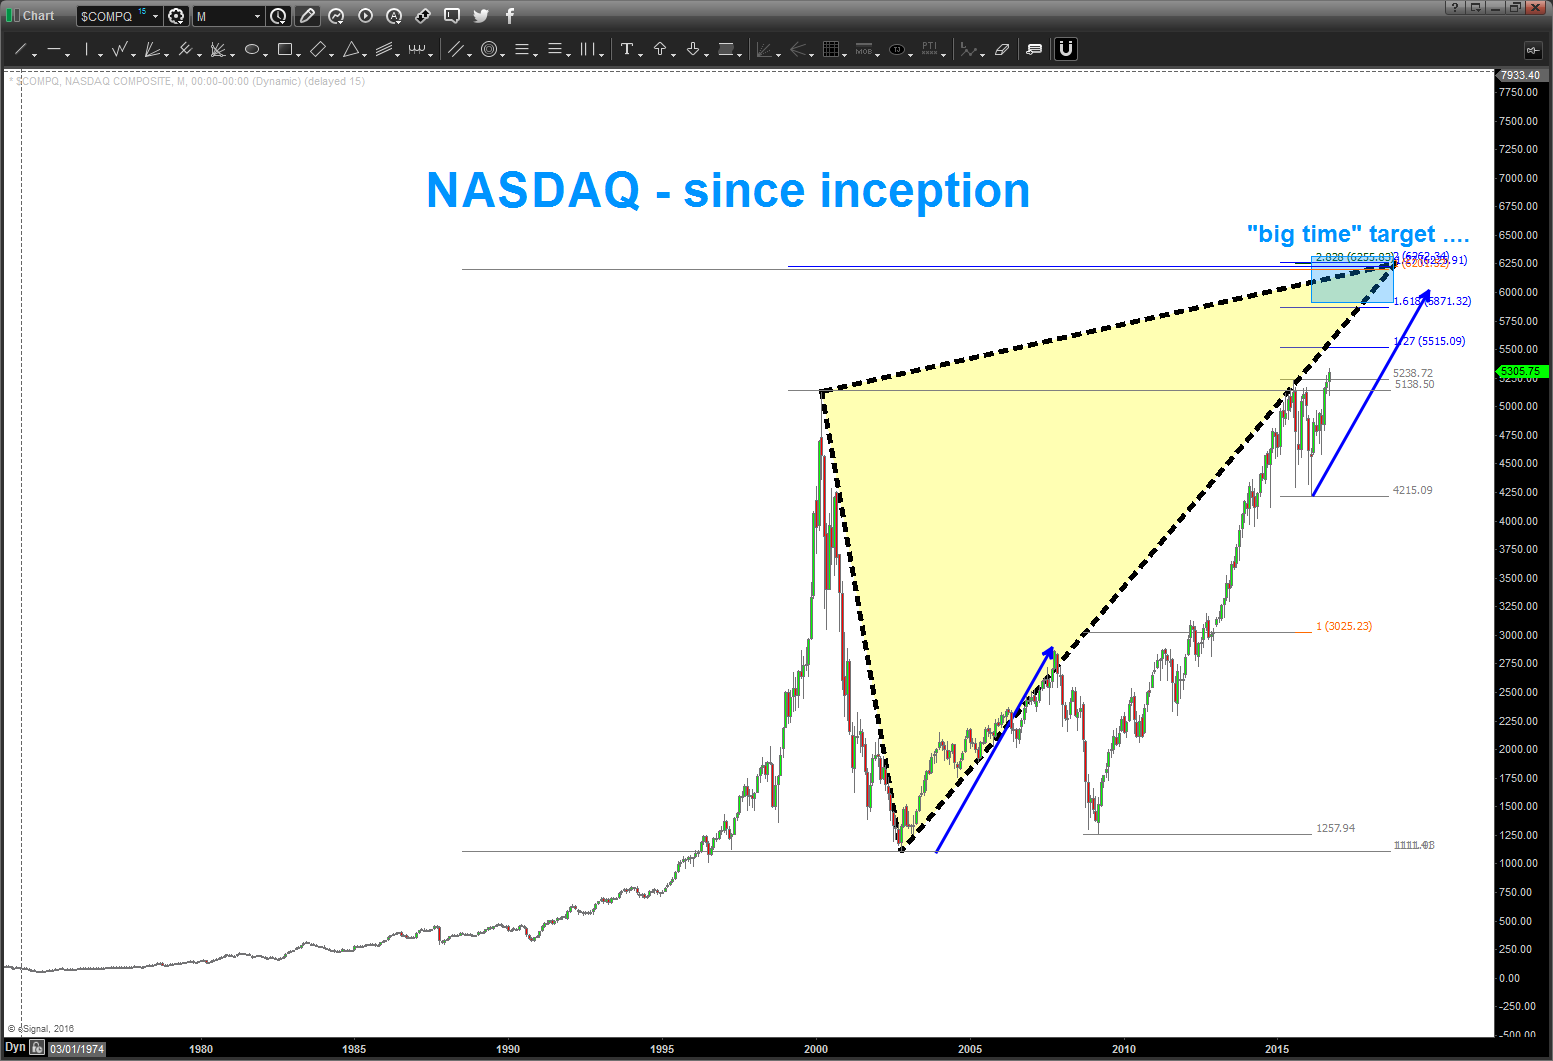
6100-6200 represents THE AB=CD from the all time low and a 1.27 extension from the 2000 high … as a pattern recognition expert – this SHOULD BE SIGNIFICANT RESISTANCE.
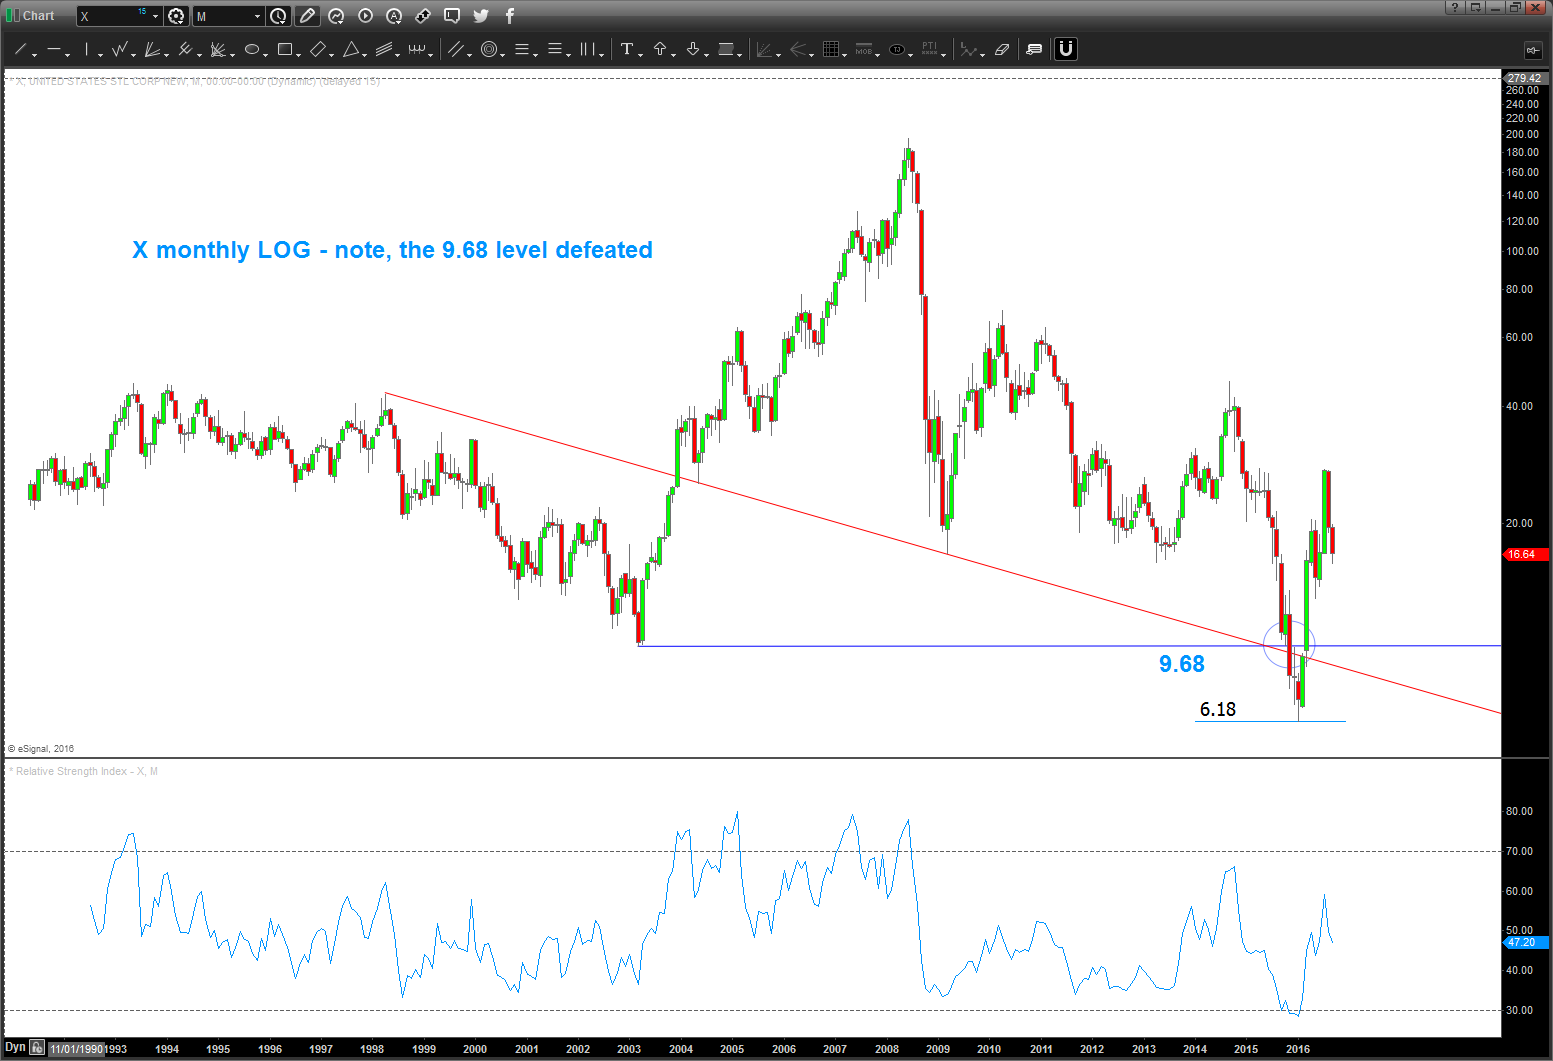
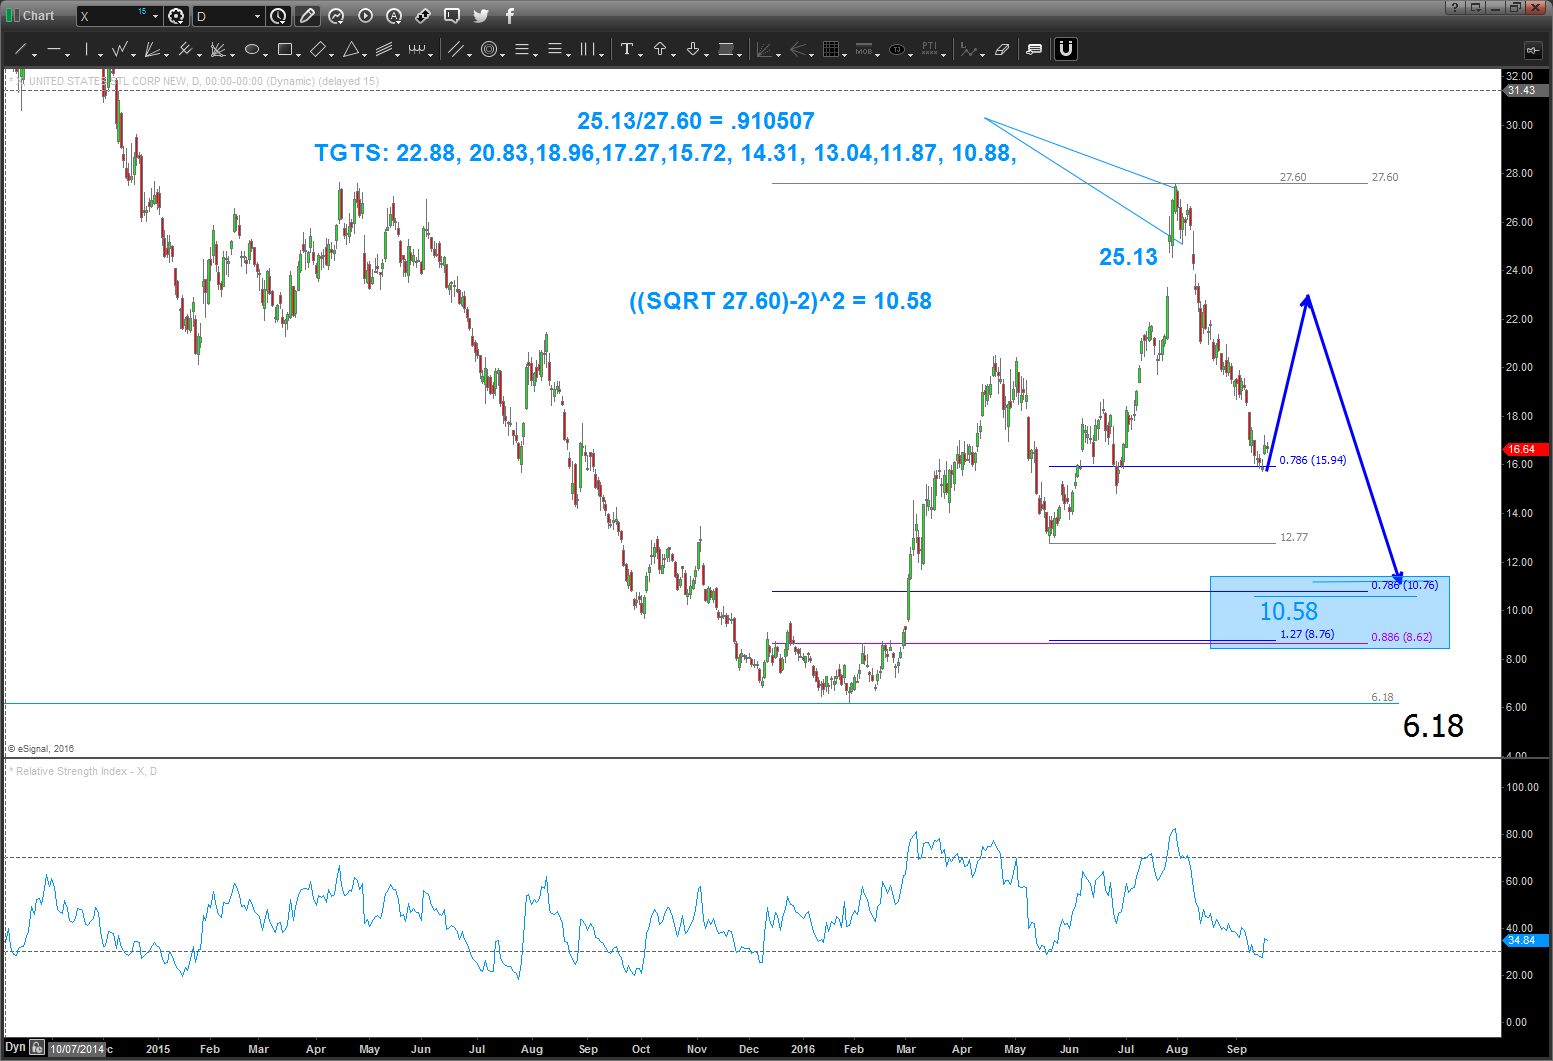
X … OBTW the LOW was 6.18. by chance, of course
Posted on September 20, 2016 Leave a Comment
Jerry – my good friend – hope the books are vibrating for you brotha!
Here’s what I would do … WAIT for this to work itself out. My only “issue” is I want to see a 3 wave corrective move. We’ve only done one for now …
rock on my friend, rock on …
Bart
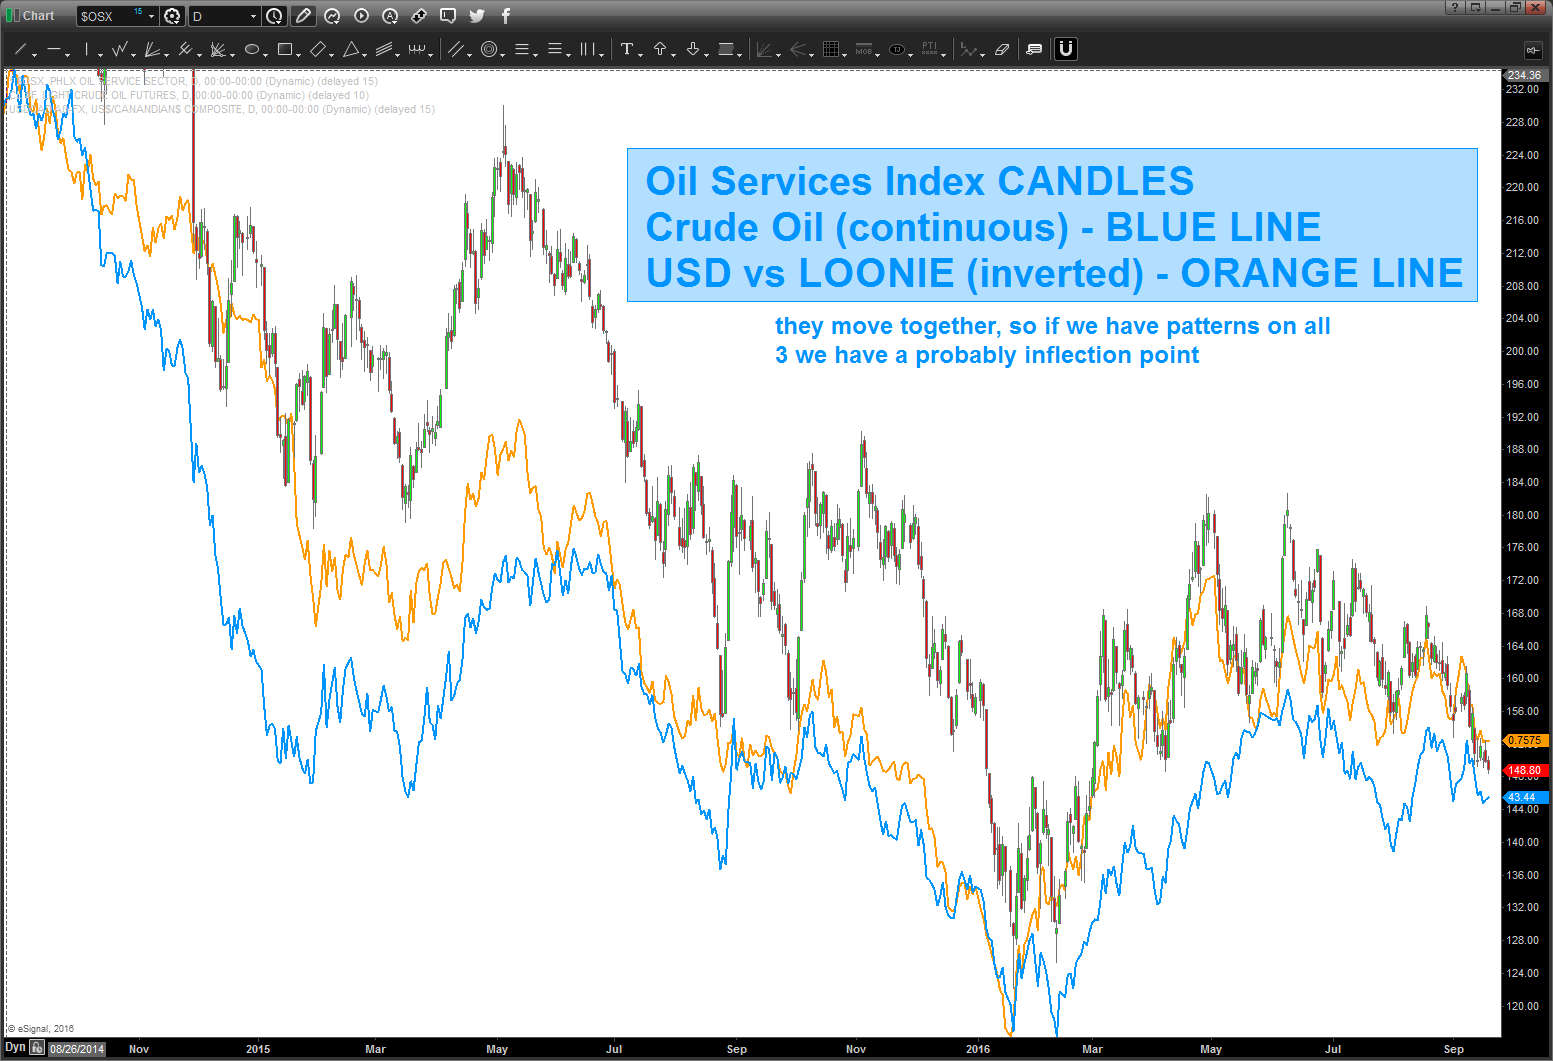
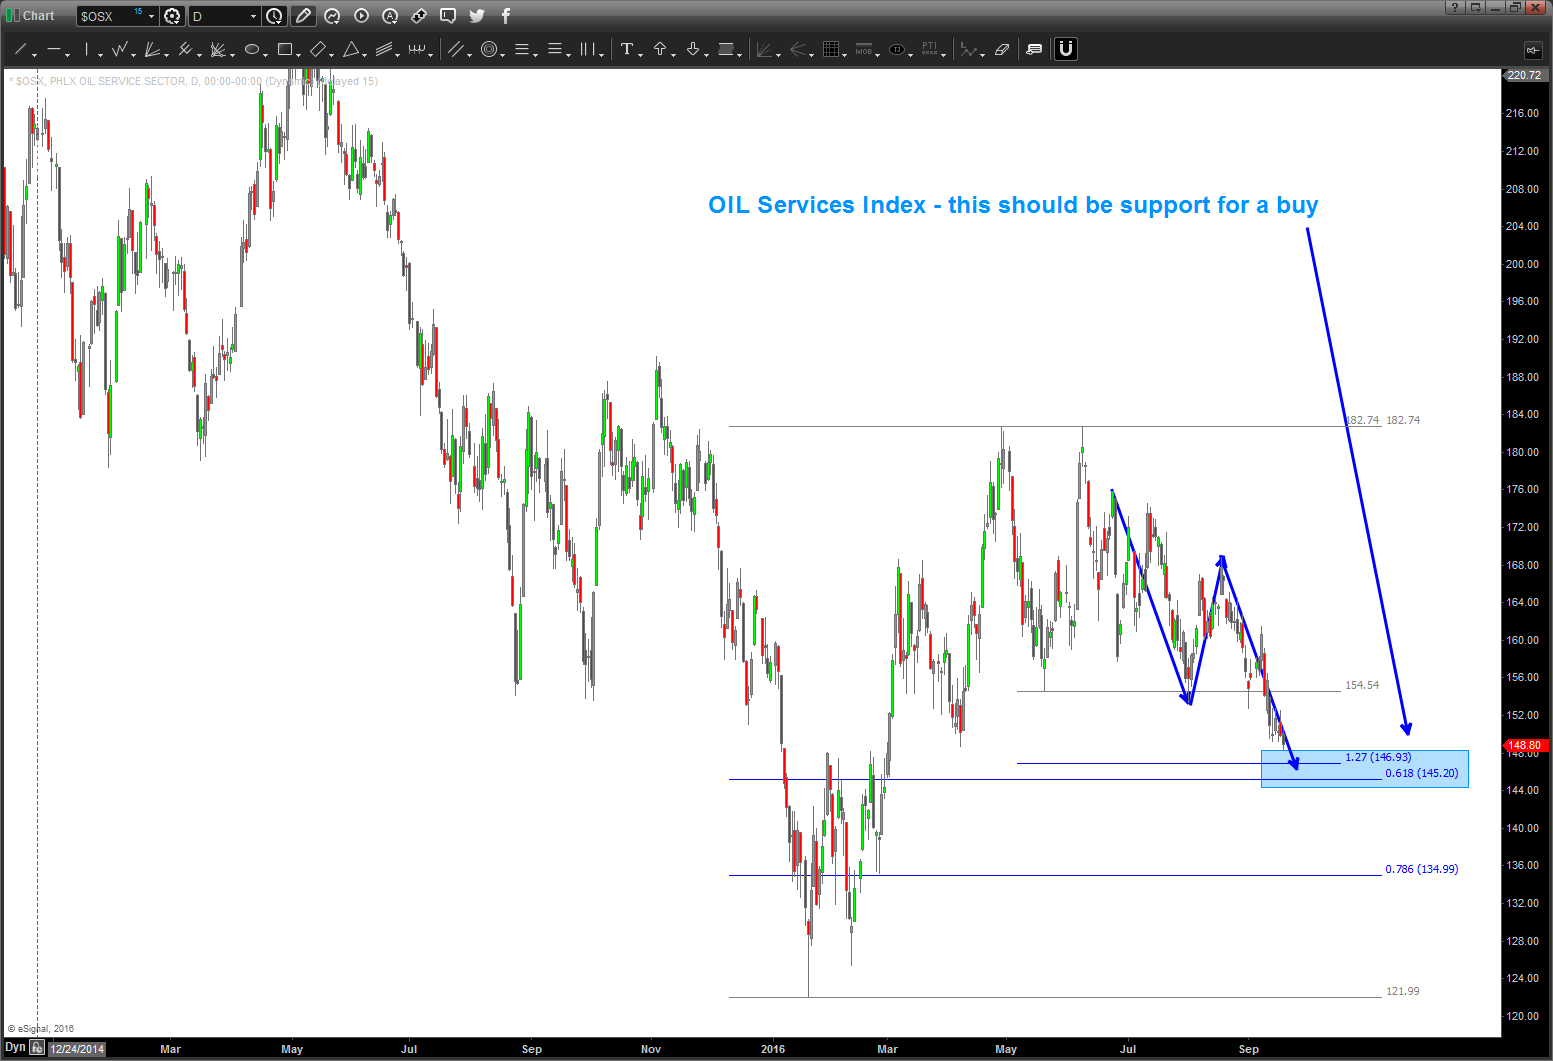
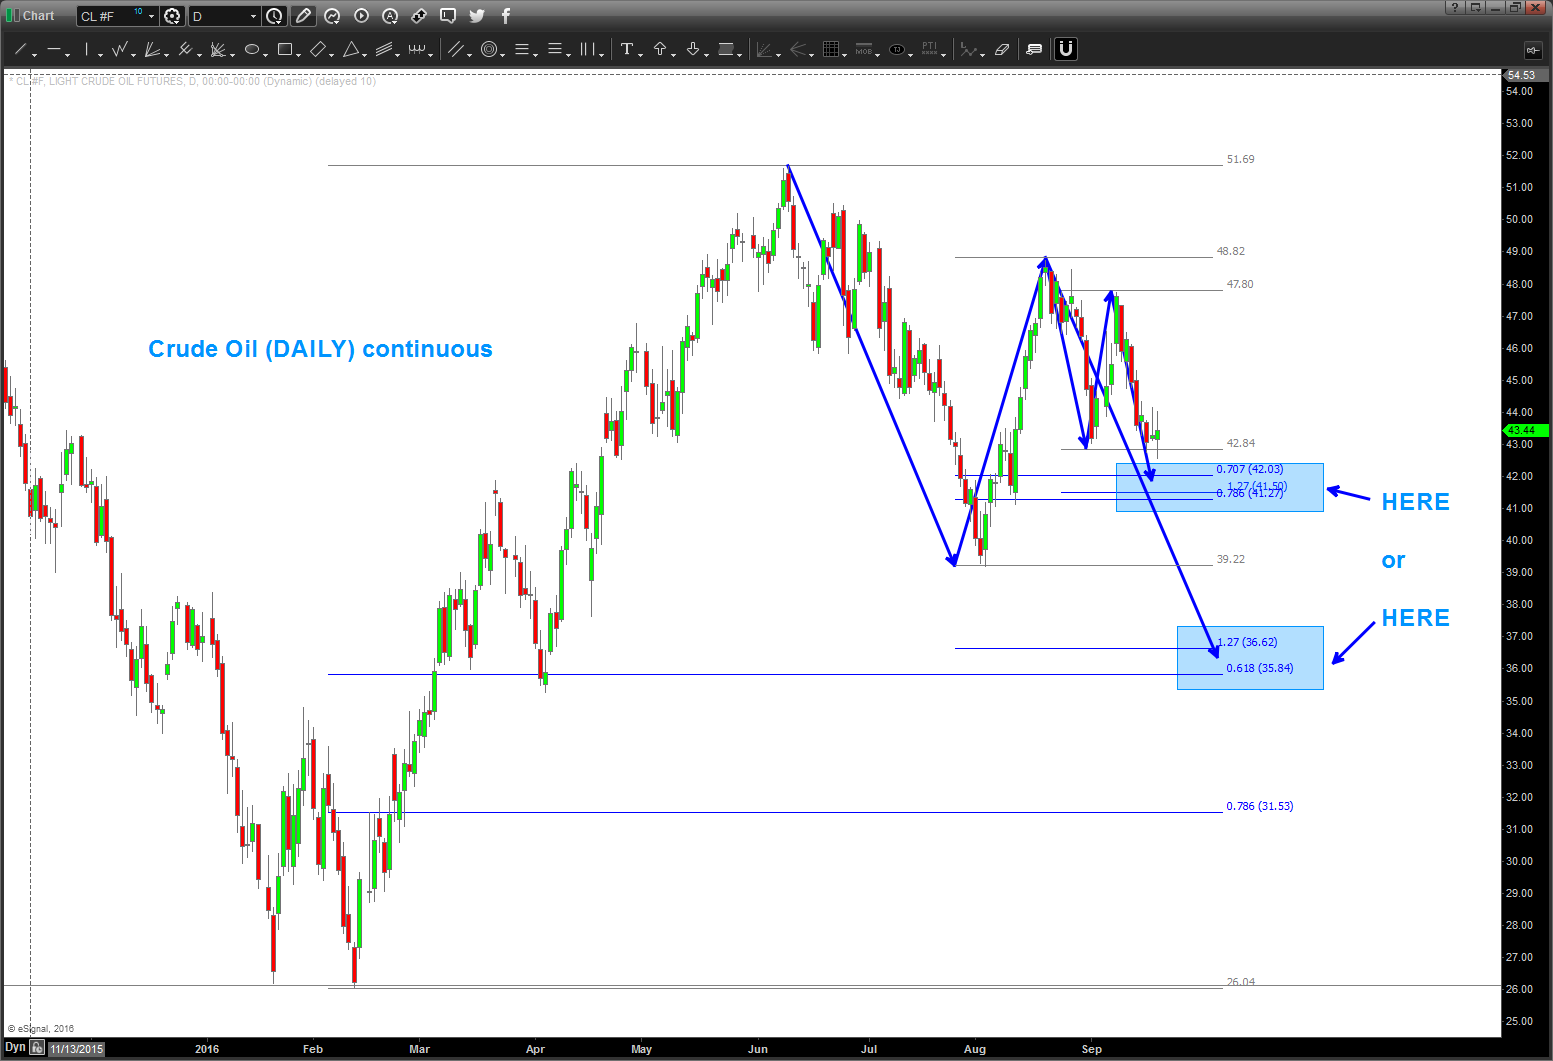
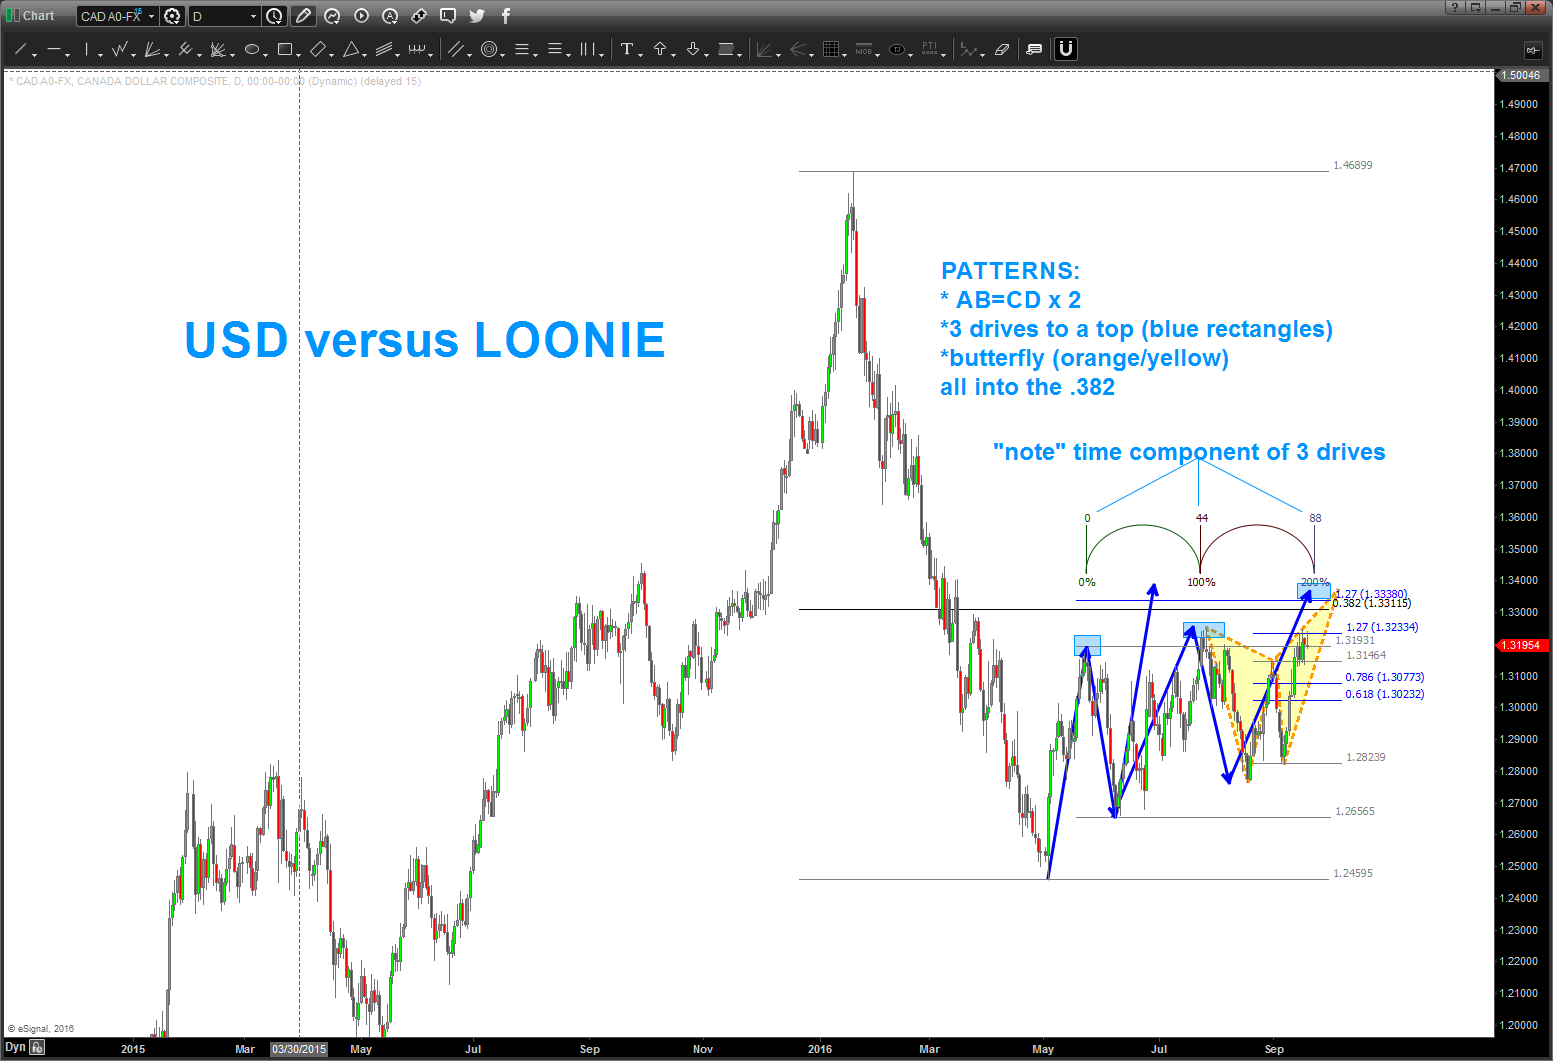
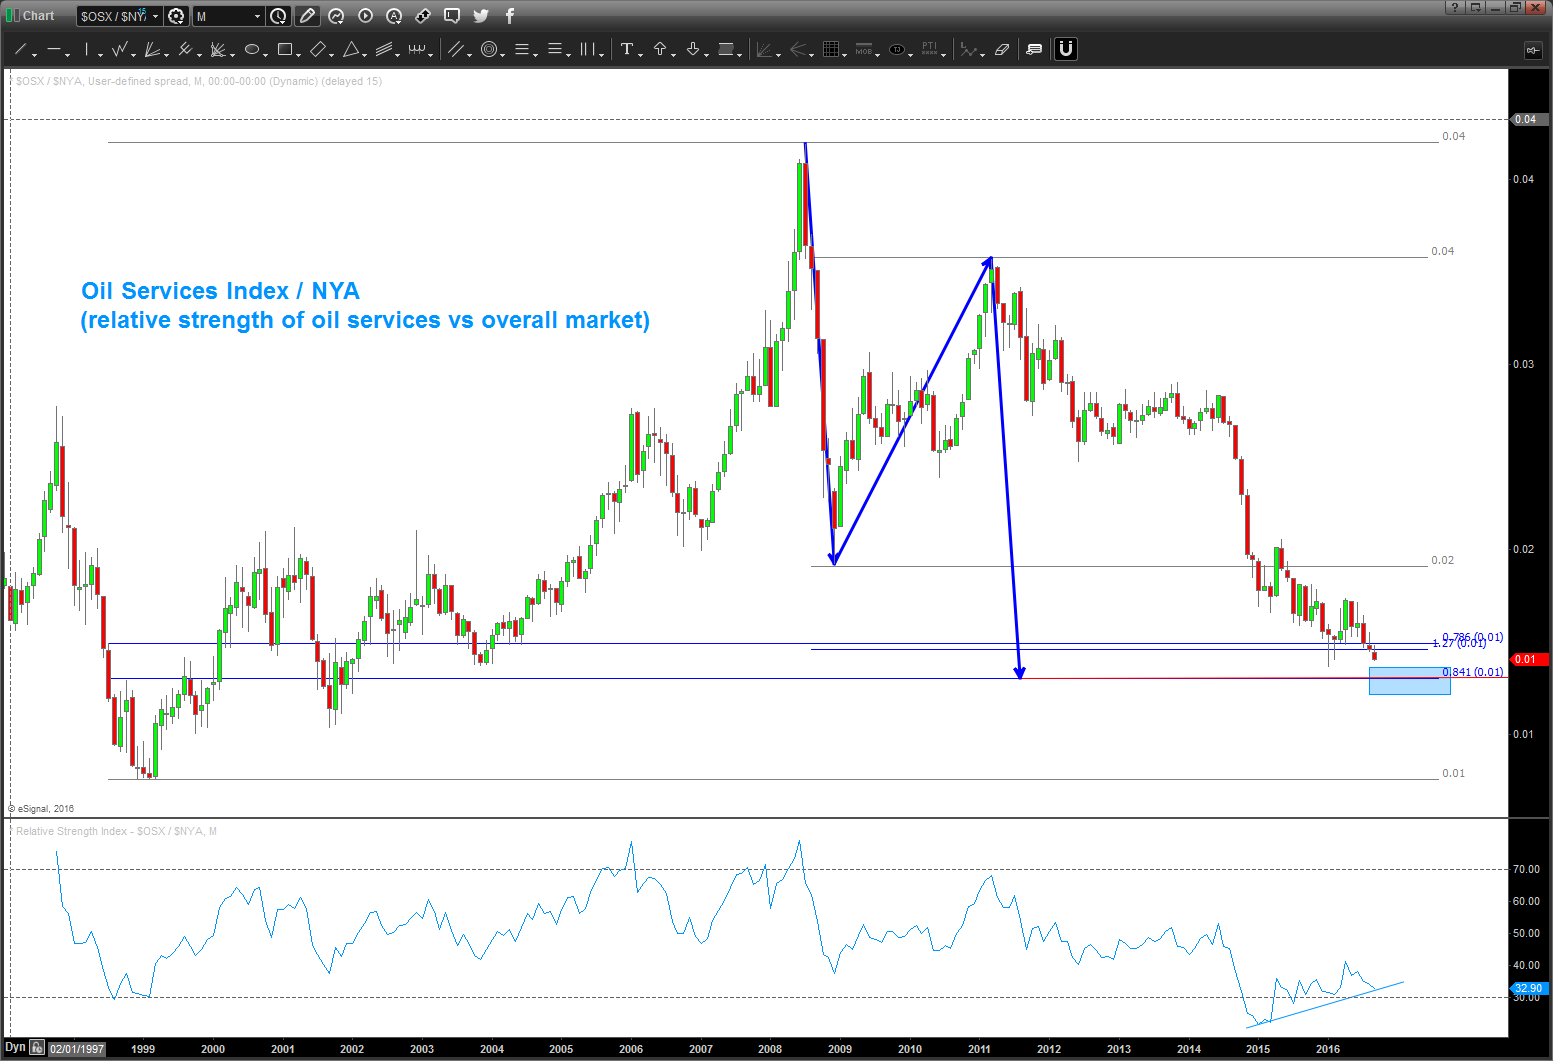
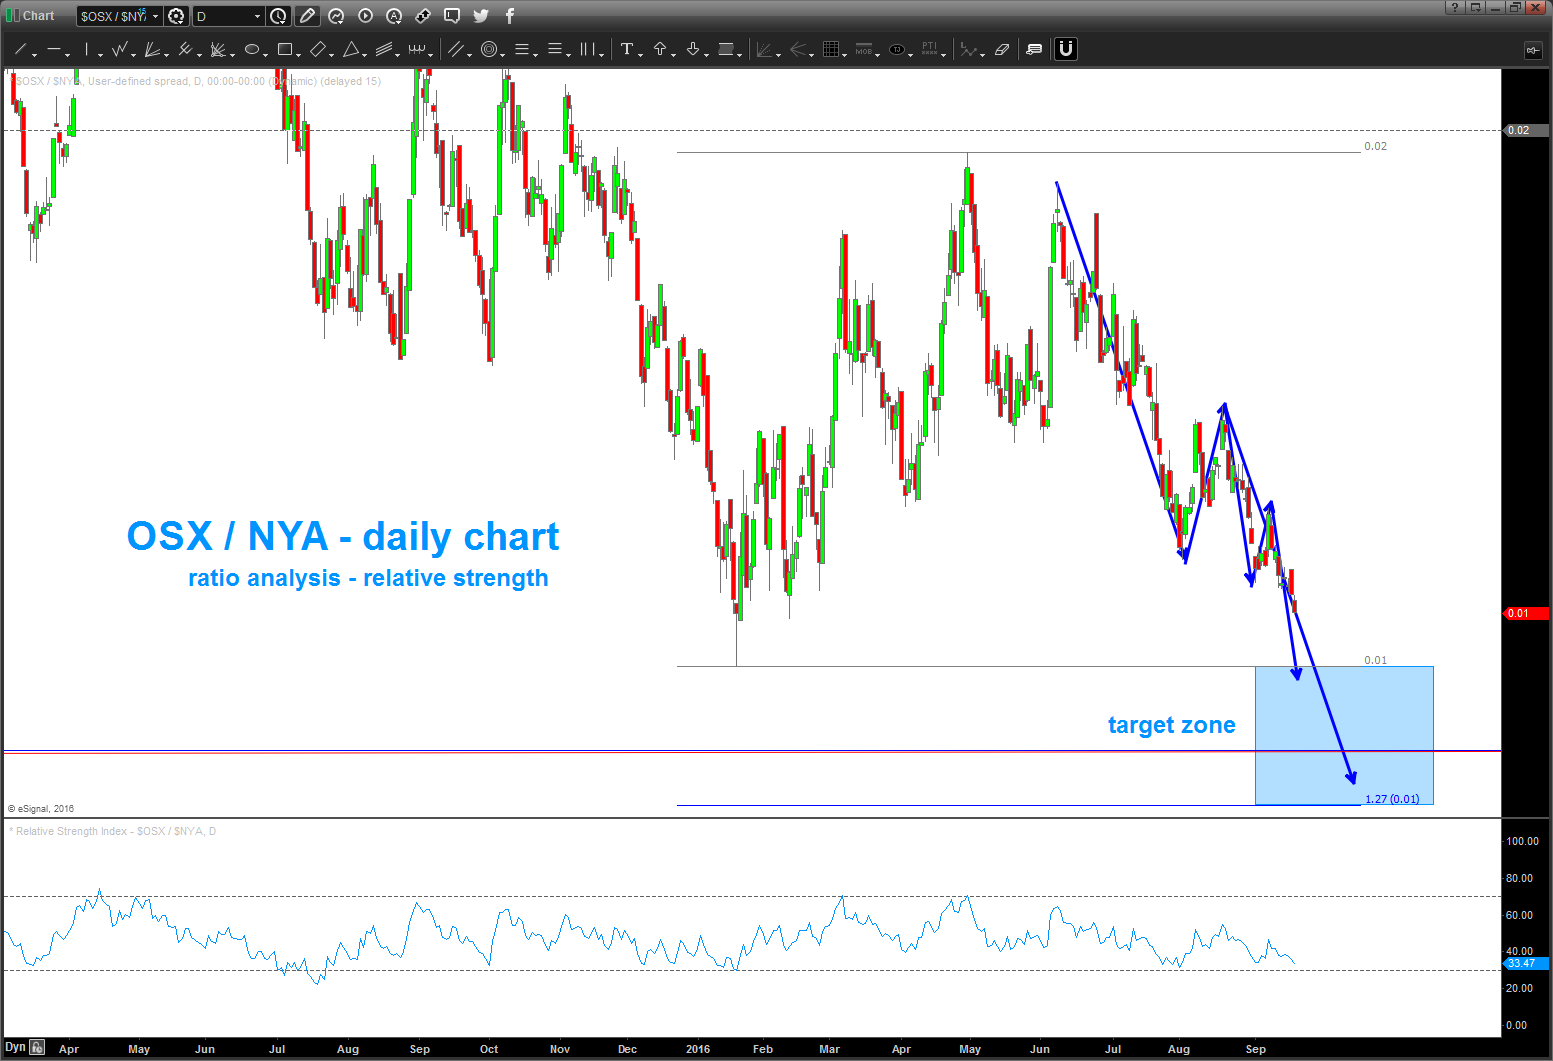
Loonie, OSX, Crude – time for another inflection?
Posted on September 20, 2016 Leave a Comment
go ahead and follow this link if you want to follow some real time PATTERNS w/ technical analysis and the correlation between the 3 items in the subject line: https://bartscharts.com//?s=LOONIE
appears we are at another critical juncture:
- Crude – 2 buy patterns present.
- OSX – buy level indicated
- USD vs LOONIE – multiple patterns present for another move in LOONIE strength.
again, these are just patterns folks … but we have a very clearly defined demarcation line for the next move to begin.
stay tuned
Bart
charts below, let me know if you have any questions.
$FB for @seeitmarket
Posted on September 19, 2016 Leave a Comment
pay attention to the converging LOG trend lines
B
don’t worry DB – Shake Shak, TWTR, FB, Chipotle will save you … ugh.
Posted on September 18, 2016 2 Comments
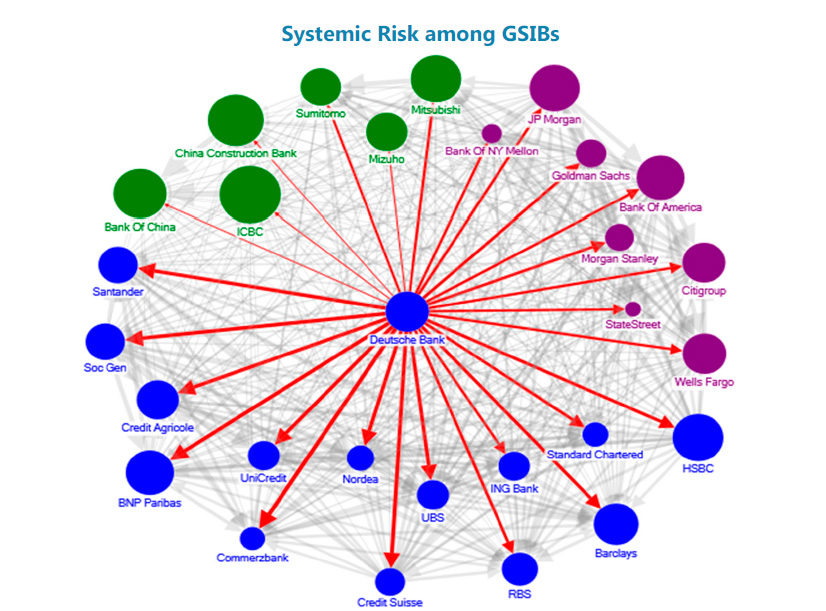
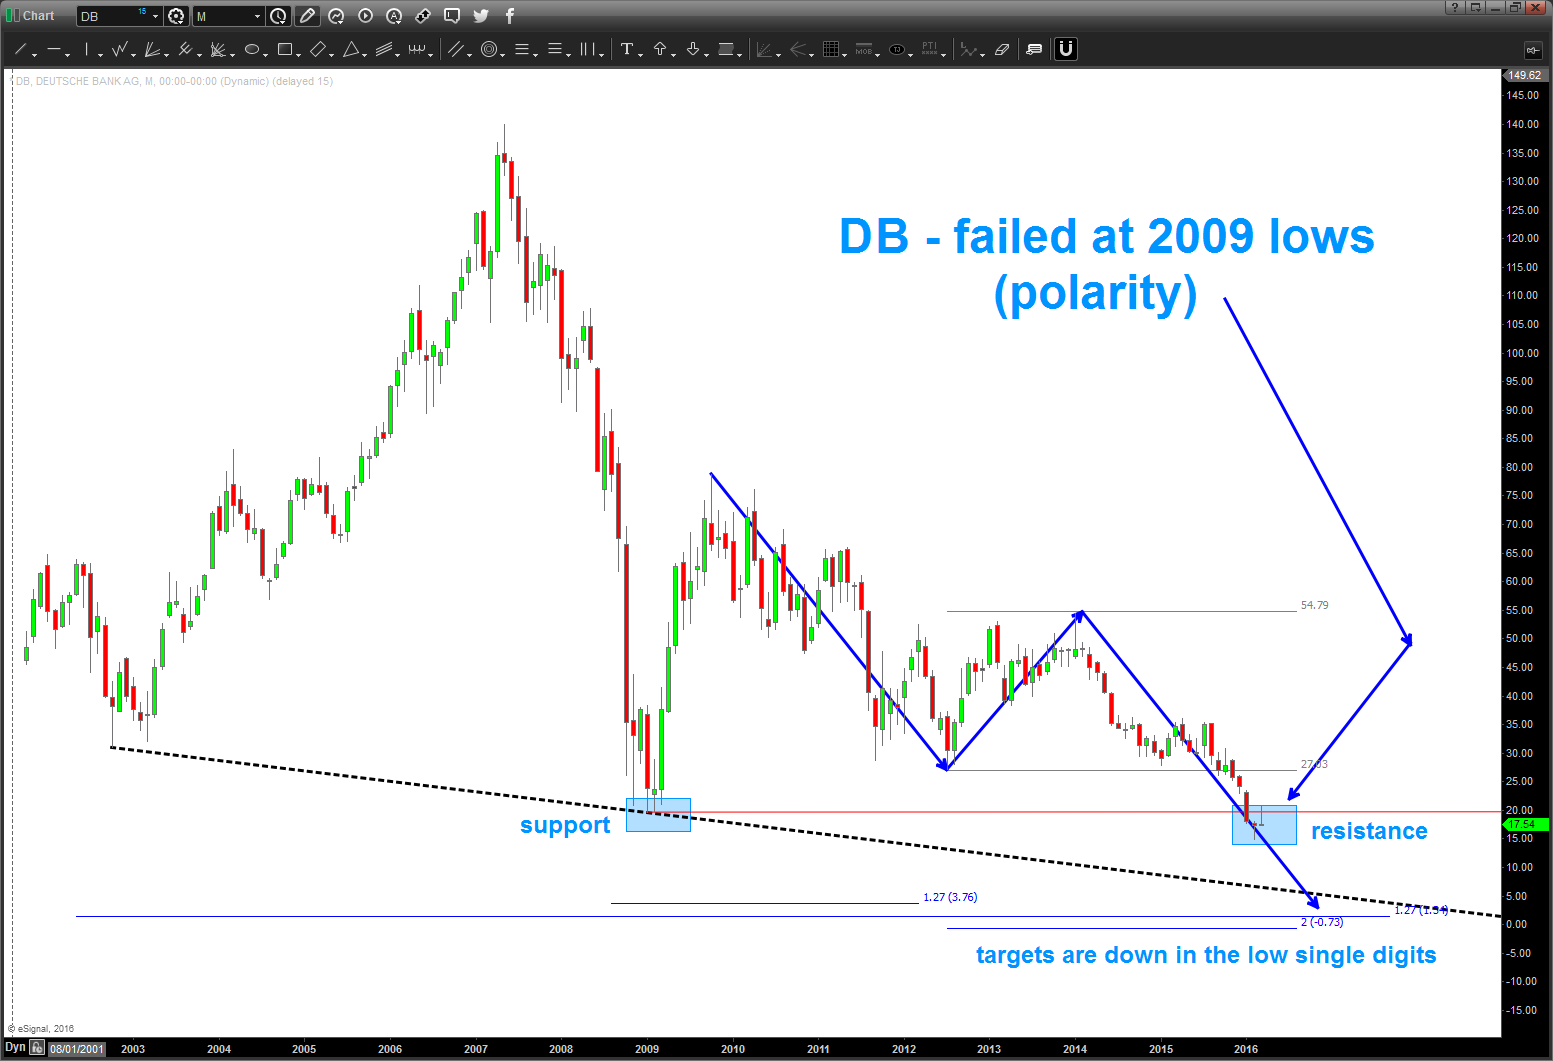
09/15/2016 – does anyone care that 1) DB is below the 2009 lows AND 2) it’s the largest holder of Derivatives (the financial time bombs) in the WORLD and 3) it’s the largest bank over in Europe which is tattering on financial collapste?
Nope, nobody really cares … TWTR, FB, TSLA, AMZN will save the world. If you look at the picture below, imagine WHAT HAPPENS IF DB implodes. See all those red arrows ….? Well, they will affect these banks.
GSIB – Global Systematic INTERCONNECTED banks.
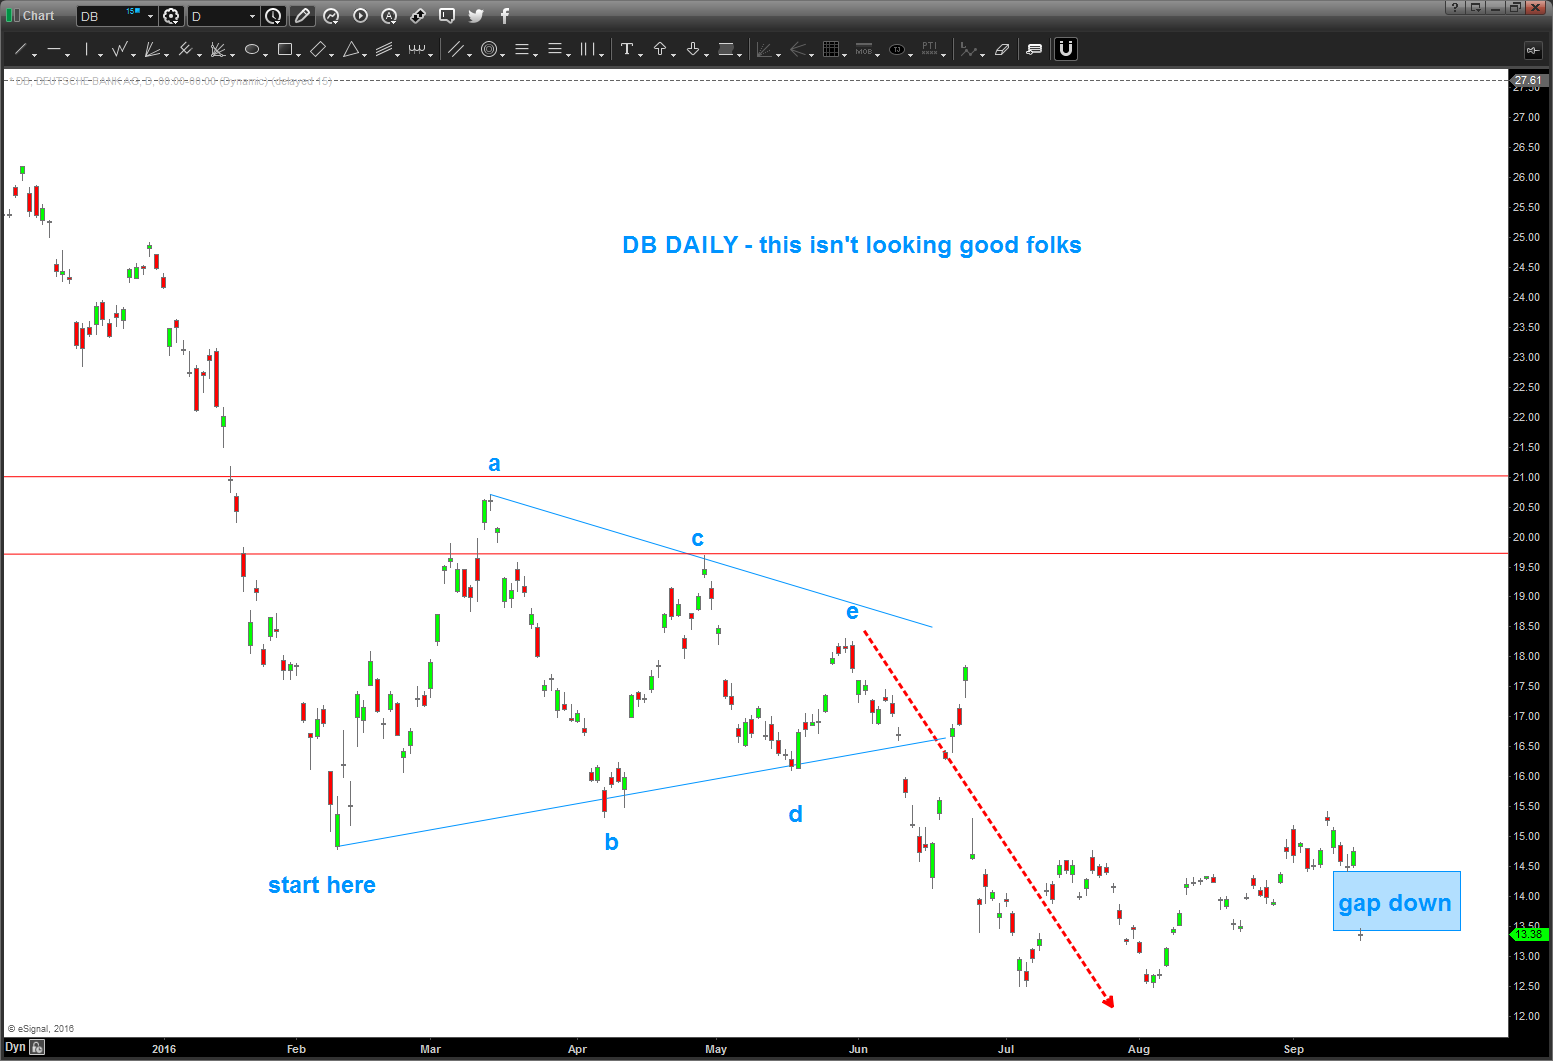
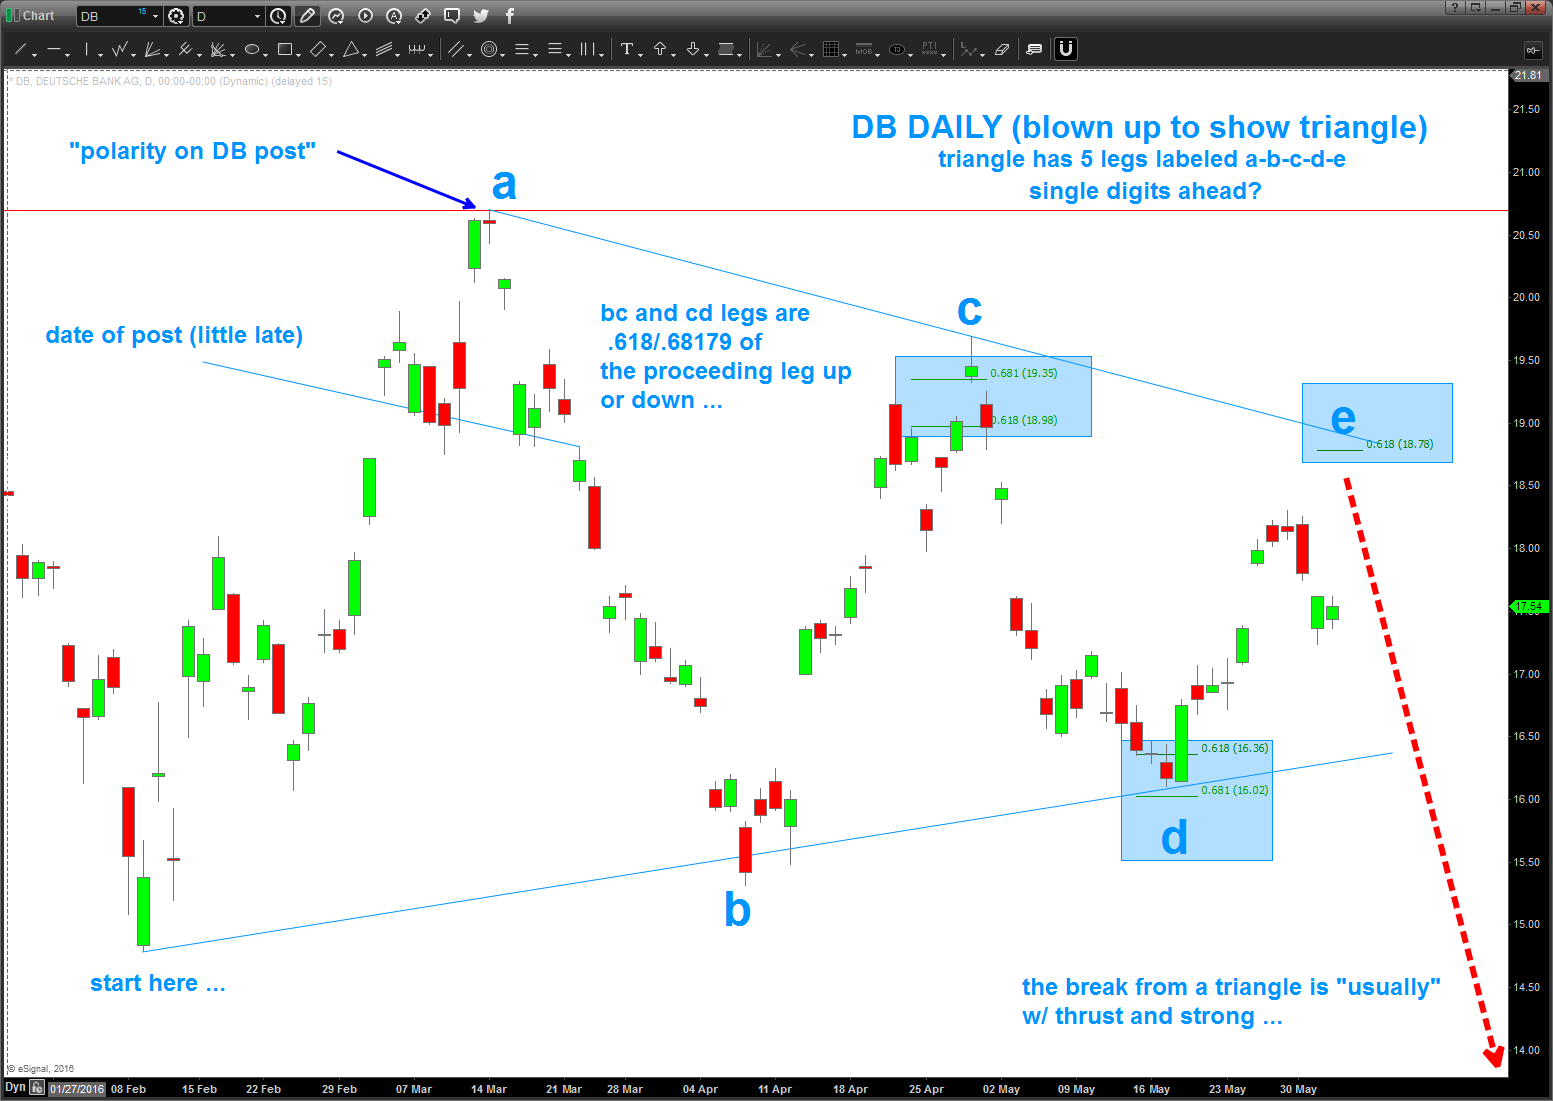
06/02/2016 – Triangles – look SO GREAT after they complete. when your in the middle of one (reference daily/weekly EURO vs USD) you get chopped up and frustrated till you erase your chart and then the c-d-e legs appear. then it’s simply so hard to wait for “e” to complete but you have to …the move out of “e” is “usually” swift and strong … so, this triangle is so perfect in so many ways
- trend line definition
- the length of bc and cd are “usually” .618/.68179 (think music) of the proceeding wave
- none of the moves are showing any major momentum or thrust ….
CONCLUSION: very near a daily triangle completing and then another dump on DB. What the f&^% does this mean for the Euro-Zone and, well, let me just throw it out there .. the derivatives that DB is backing? People lot smarter than me probably know.
Stand by ….
Bart
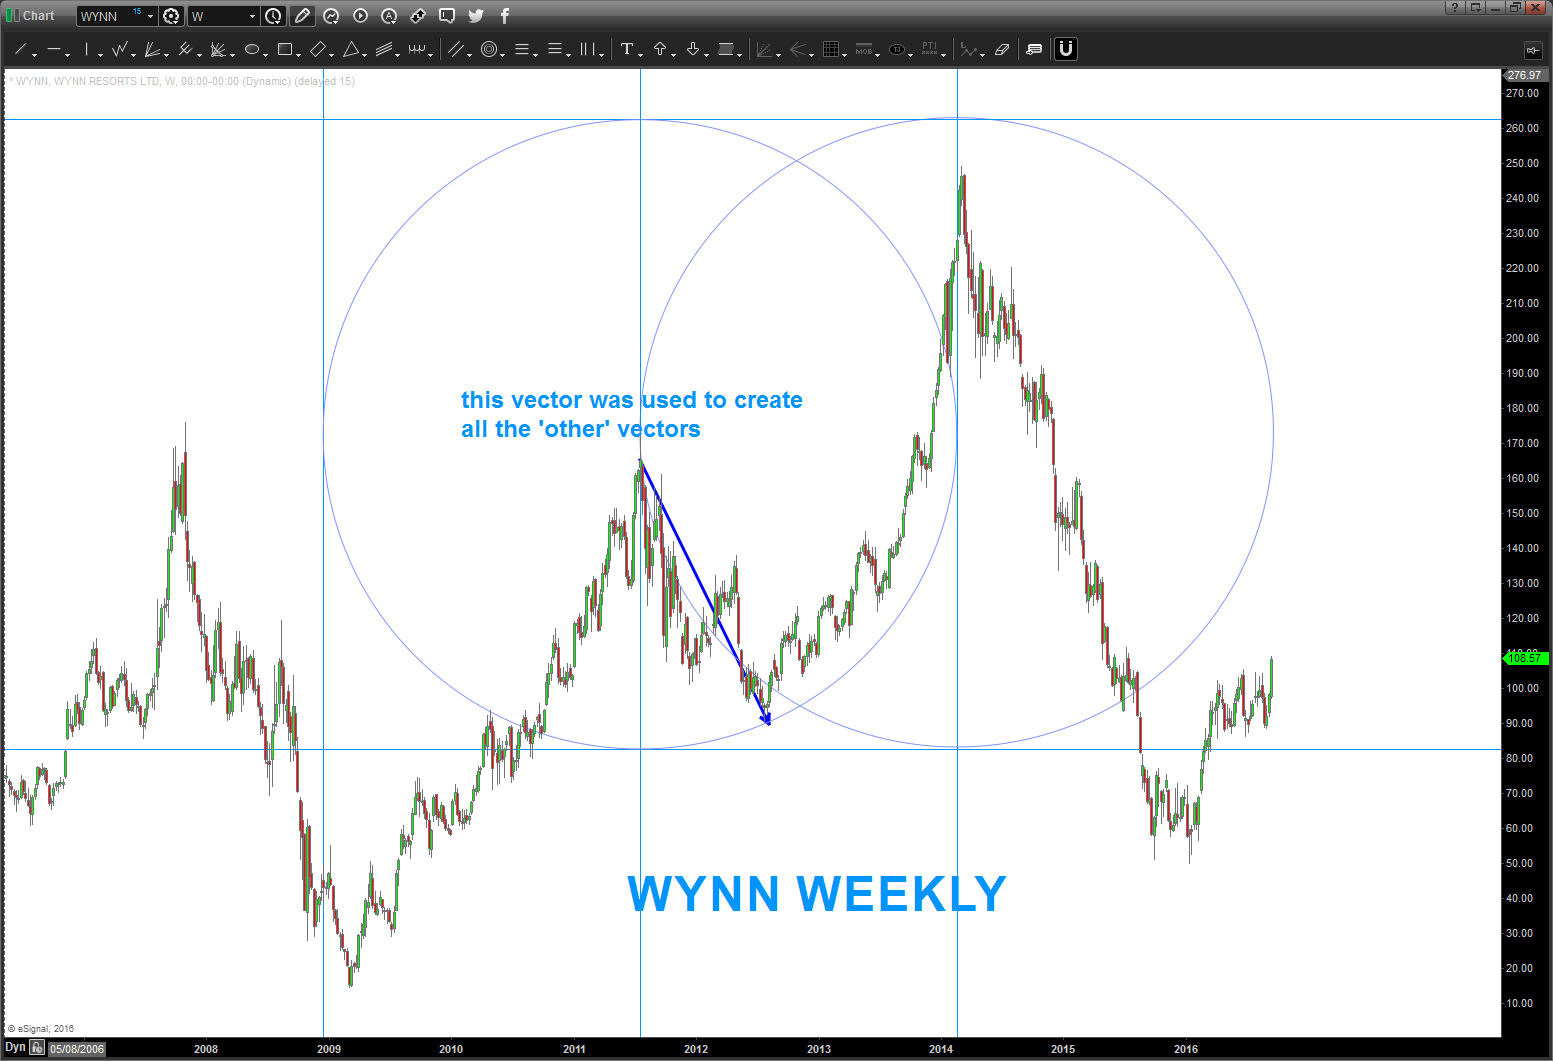
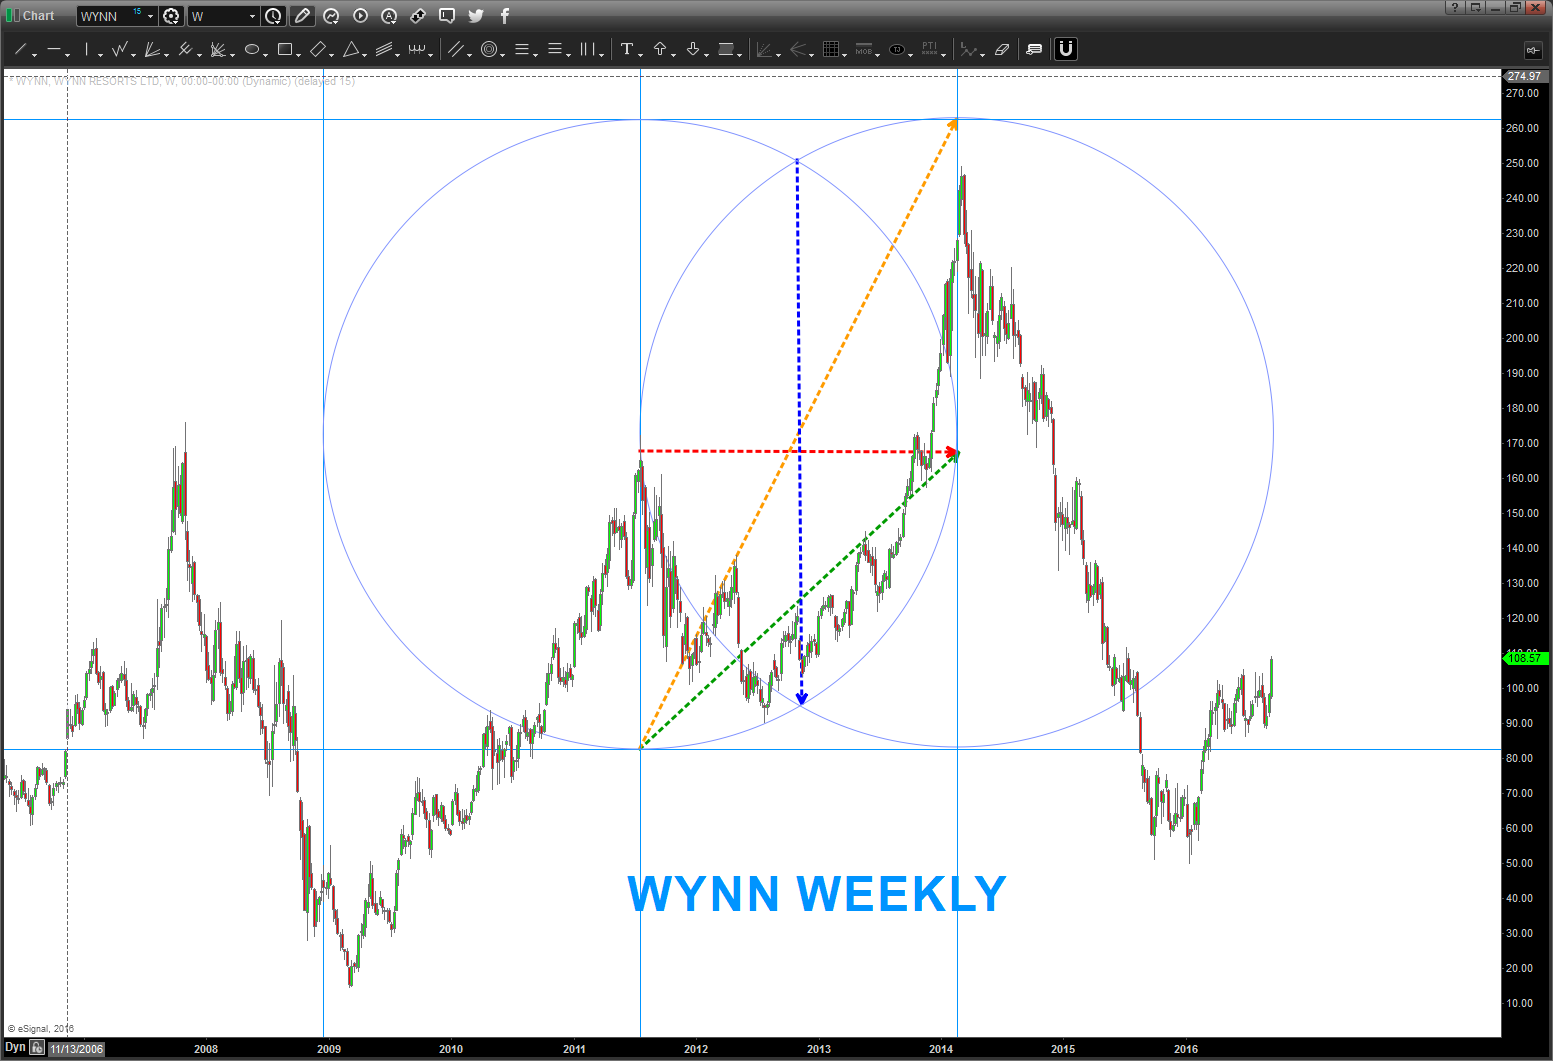
Vesica Pisces and WYNN
Posted on September 18, 2016 Leave a Comment
Chargers are doing really really well and the marine layer is a butt kicker this afternoon so the family is just staying put and relaxing …I enjoy coming up to the computer and drawing w/ my crayons. it’s relaxing .. sometimes, just to prove to myself I’m NOT crazy in the truest sense of the word (I can promise you, I still am) I’ll just pick a stock and “draw” – circles, squares, angles and just “prove” to myself that YES This stuff does work.
so I took WYNN … no reason, trust me.
OBTW – here’s some work on the WYNN top and the fall from grace so to speak: https://bartscharts.com//?s=wynn
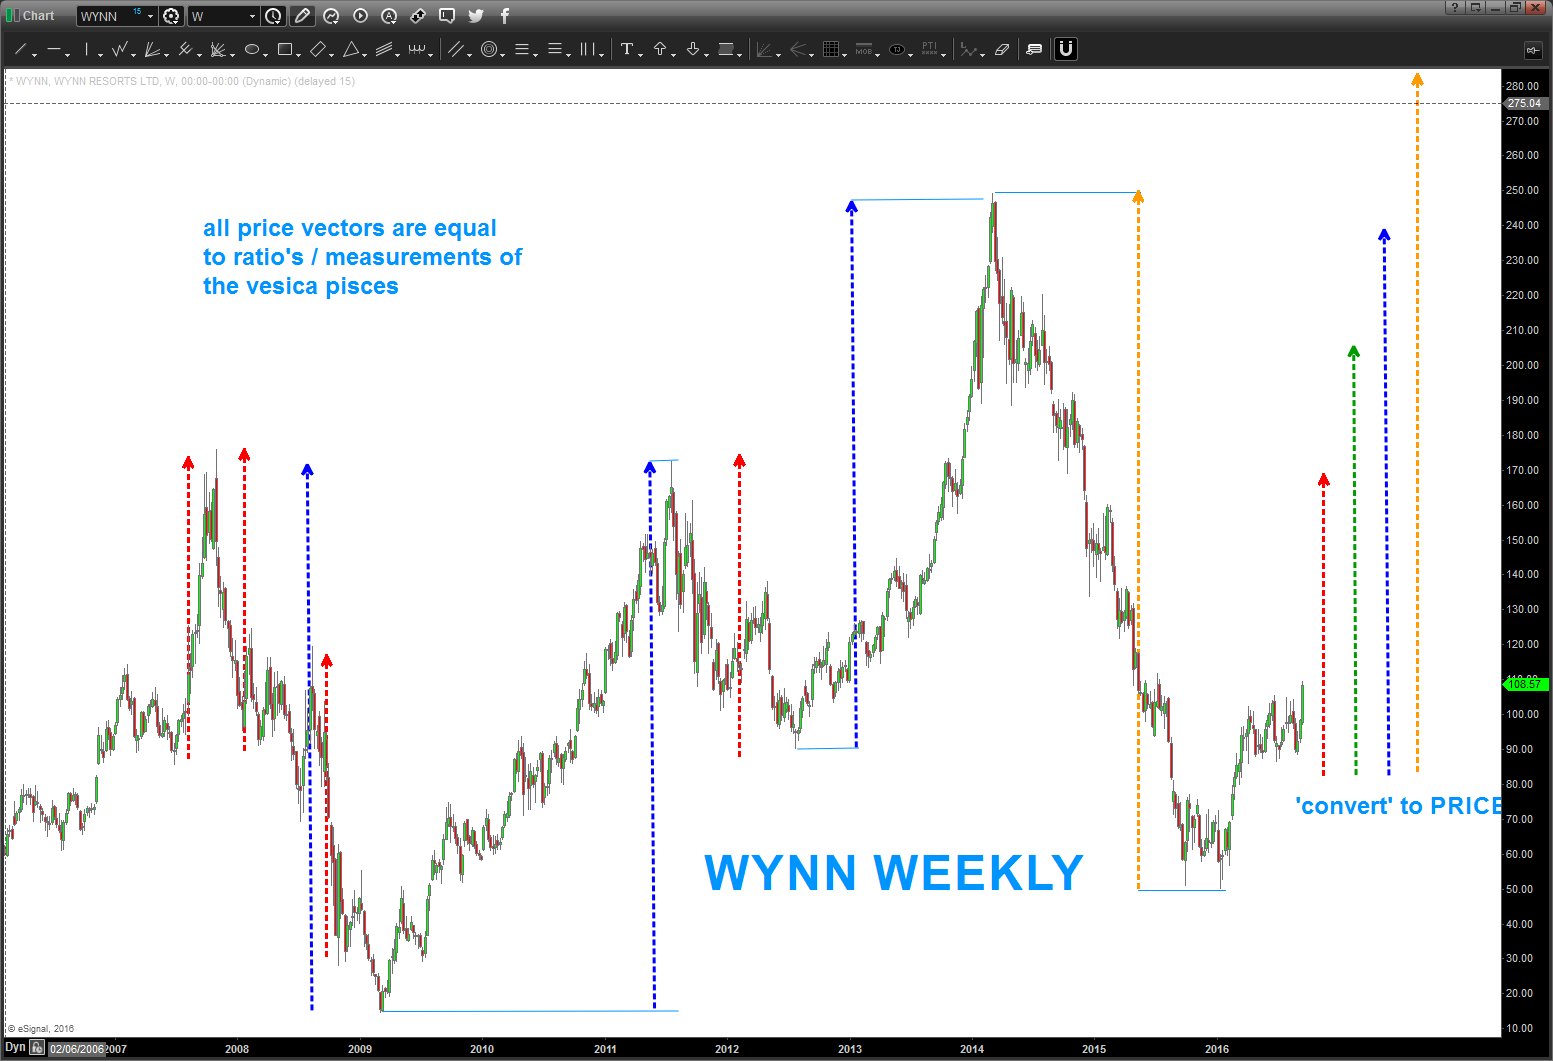
Anyway … look at the chart on a LONG TERM basis and just pick a vector .. draw that vector as the radius of the circle and then draw the remaining vectors which compromise the remaining aspects of the Vesica Pisces. (OBTW and note – they are all square roots of the numbers 1-5. :))
Here’s the charts … I didn’t make this up, I picked WYNN and did the Vesica Pisces.
I’m pretty sure I know why it works (it ONLY works to help you manage risk) but on another note … I know why this “stuff” works … 😉