Pound Foldback Updated
Posted on November 12, 2013 1 Comment
last post on the Pound:
https://bartscharts.com/2013/11/05/jec-silver-past-fractals-and-the-pound/
updated charts to the pound .. notice the Head and Shoulders that has formed:
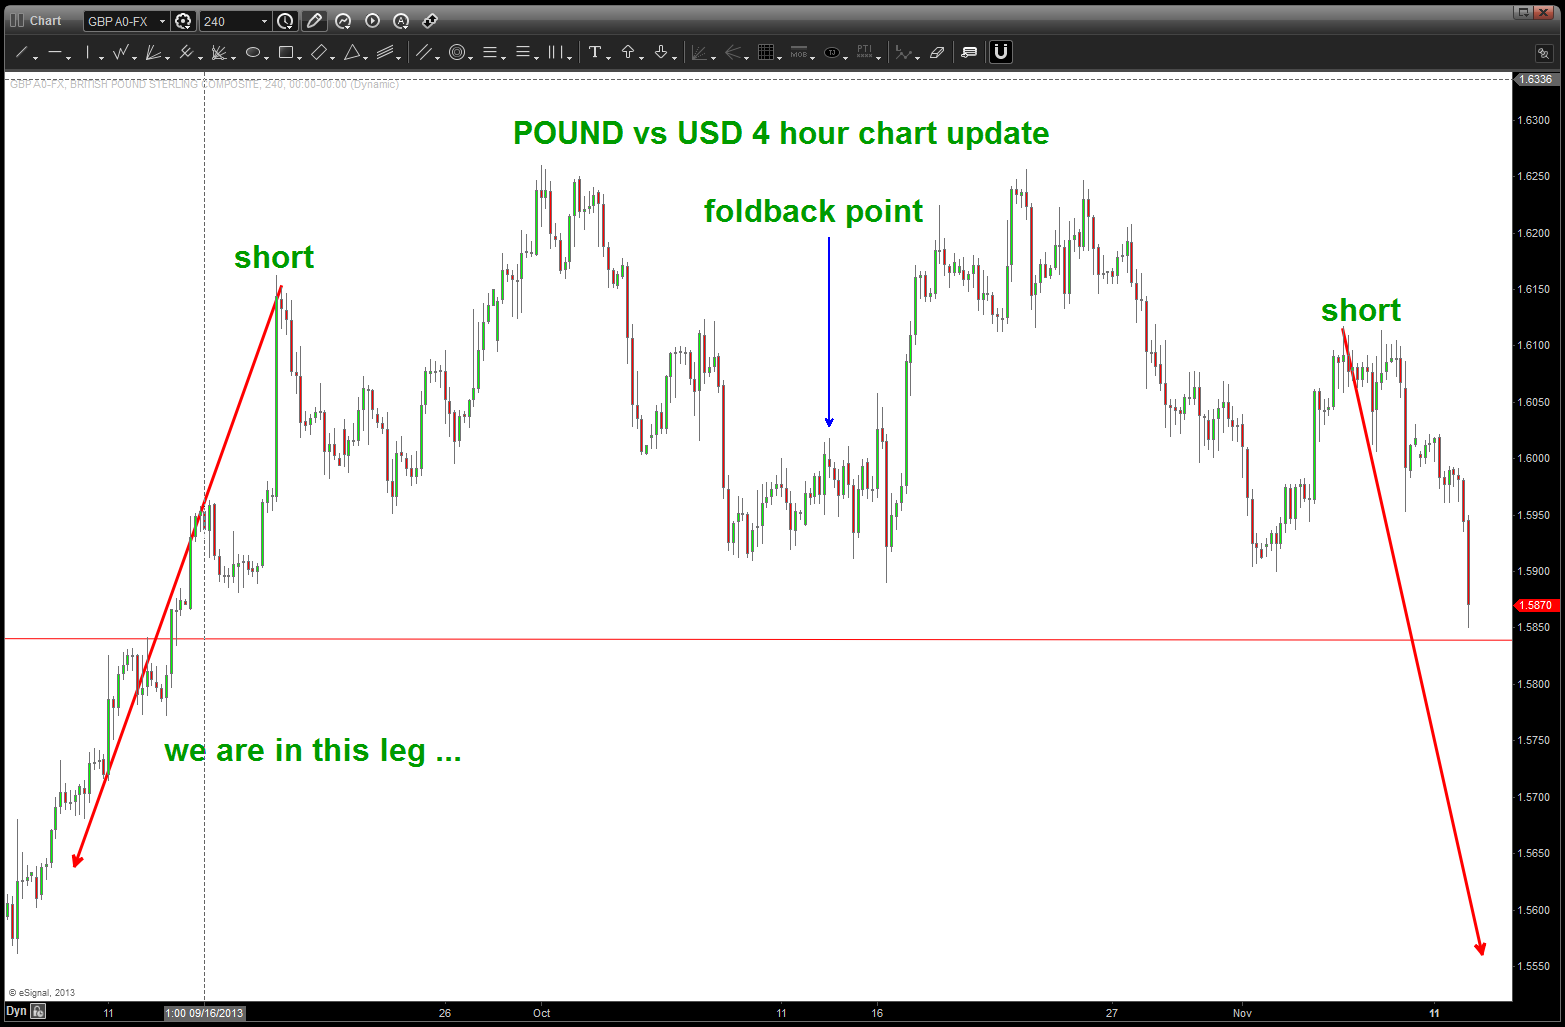
Pound Foldback in action
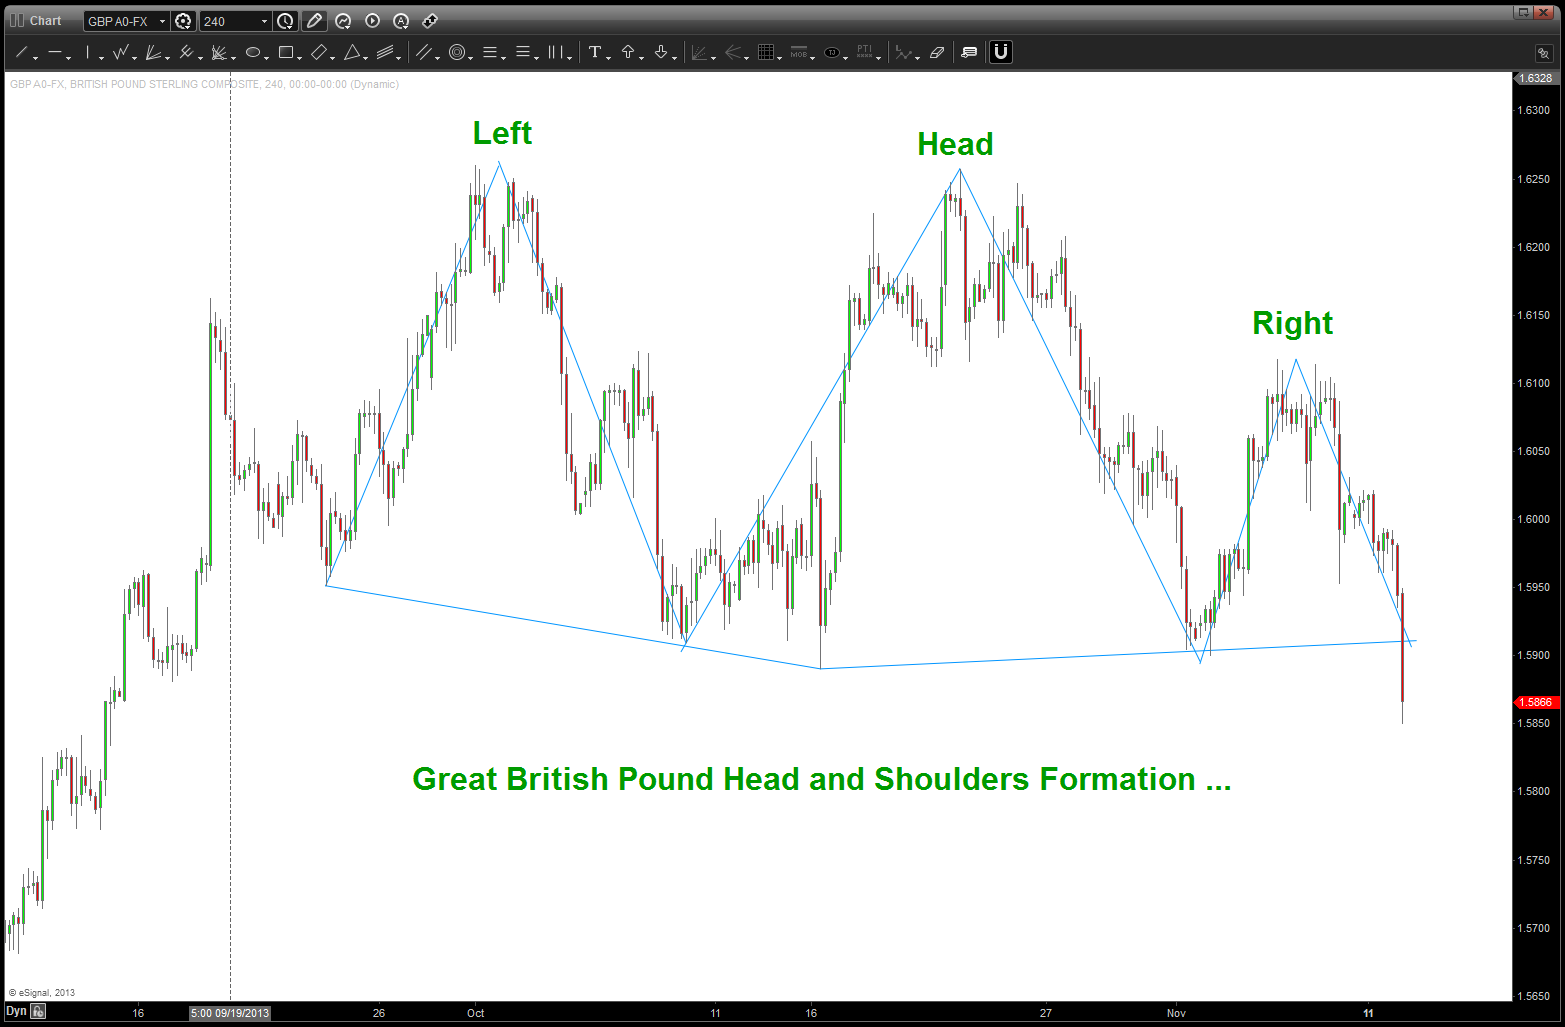
Potential Neckline Break and Head and Shoulders Top
New York Stock Exchange … PATTERN COMPLETE in Price and Time. CAVEAT EMPTOR
Posted on November 11, 2013 Leave a Comment
Personally, I like this index – why? as far as I know, they no longer have a futures market for it so “what you see is what you get.”
From Wikipedia: The NYSE Composite is a stock market index covering all common stock listed on the New York Stock Exchange, including American depositary receipts, real estate investment trusts, tracking stocks, and foreign listings. Over 2,000 stocks are covered in the index, of which over 1,600 are from United States corporations and over 360 are foreign listings; however foreign companies are very prevalent among the largest companies in the index: of the 100 companies in the index having the largest market capitalization (and thus the largest impact on the index), more than half (55) are non-U.S. issues.[1] This includes corporations in each of the ten industries listed in the Industry Classification Benchmark. It uses free-float market cap weighting.
Funny, it hasn’t made a new high has it? if you have been following our work of late, we have rolled 6 major thesis points in the intermarket world that shows a top is at hand or in place. We have also looked at ratio’s of staples/spx and wallmart/spx and have shown PATTERNS that have completed. we also have used extremely long term points to look for resistance areas (see DOW post) and now we are using the all time low on the NYSE Index to show how in October 1974 at 347.7 and showing how that is a key node for projections and retracements ..
so what do we have now … we have a major pattern completing on this “pure index” on a monthly basis. also, and I think most importantly, we have the purple triangles equal to each other in PRICE and TIME.
but, I’m going to be objective here — PATTERNS do fail. I am an intermarket musician and I try to weave patterns across multiple aspects of the circle of life and look for key inflection points. I am NOT a TIMER or a BOTTOM/TOP picker. I’m a pattern recognition trader and if that is a top or bottom, I really don’t care …
I’ll leave you w/ one final thought … a fellow trader, mentor and dear friend has lived and breathed and still trades the market after 60 years of being in the game… his quote today was “I have never seen anything like this in my trading life. SOMETHING is not right in camelot.”
And the band played on … a chart for your viewing pleasure:

New York Stock Exchange Index
so, TSLA did like that i drove in one .. but i didn’t buy
Posted on November 11, 2013 Leave a Comment
post from Friday:
update …notice the blue trend line that held as support — that is the reason (polarity) that we came back and touched it and now it’s support. that could do it for the bounce but after such a strong sell move, believe we ‘ll pop up and do another measured move UP into the low 160’s or even 170 before more selling …we still have a lot of emotional/parabolic “feelings” to work off …I expect another wave down after this bounce completes.
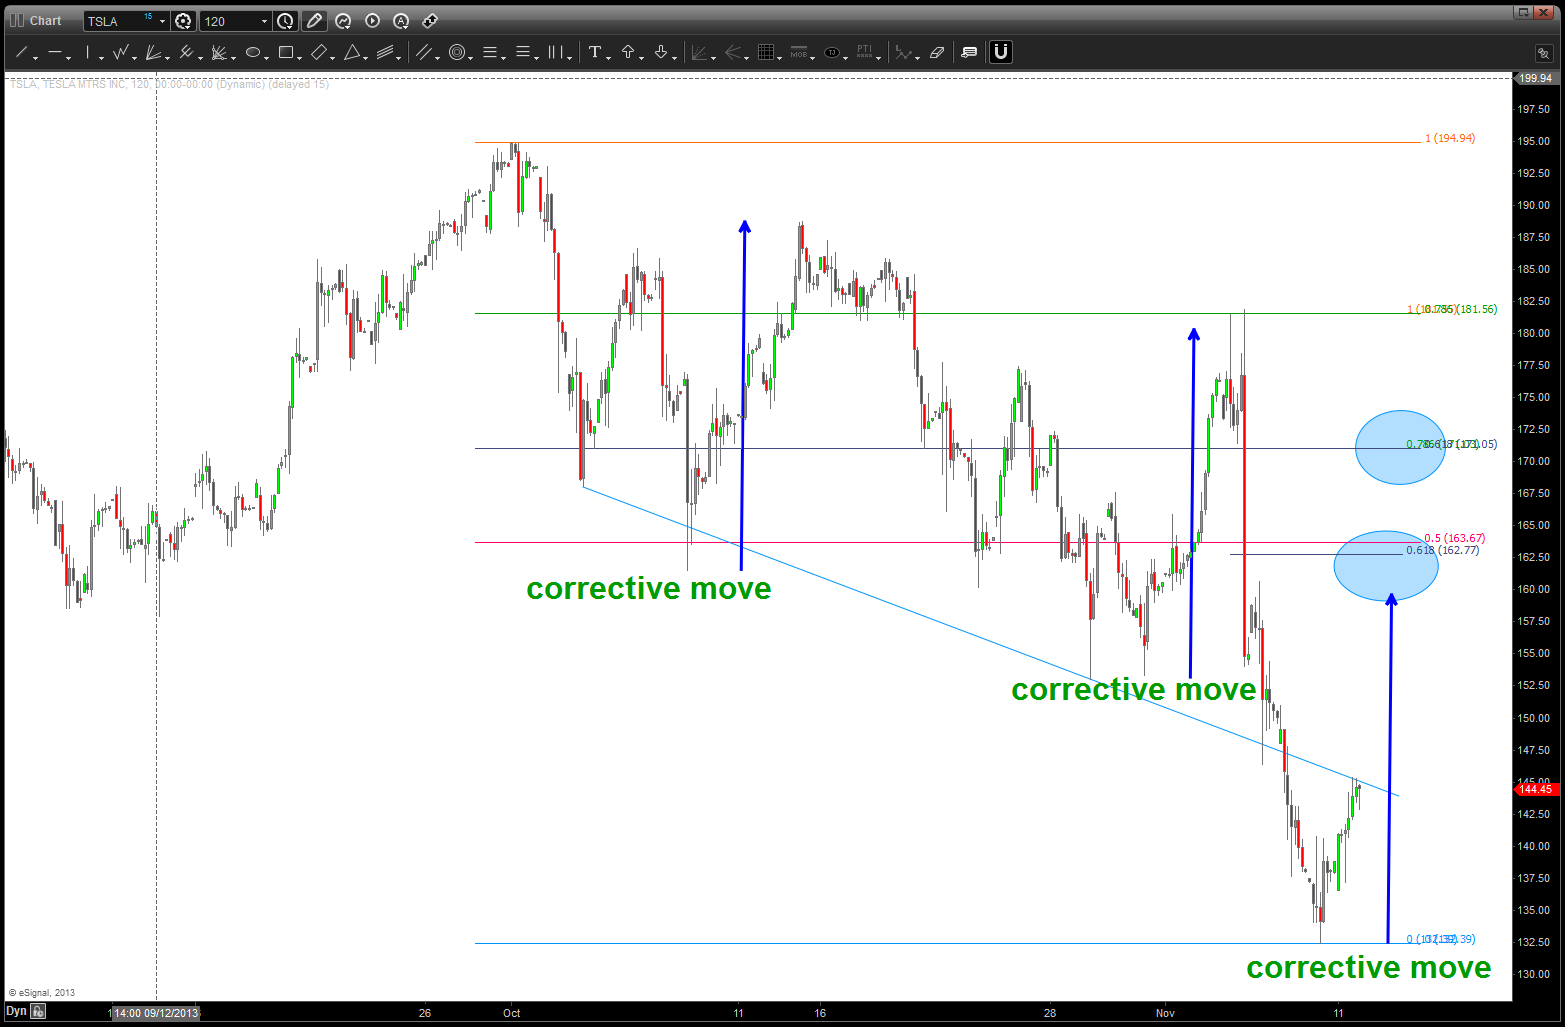
TSLA bounce
can’t beat a good cotton shirt …they might be getting more expensive, soon
Posted on November 11, 2013 Leave a Comment
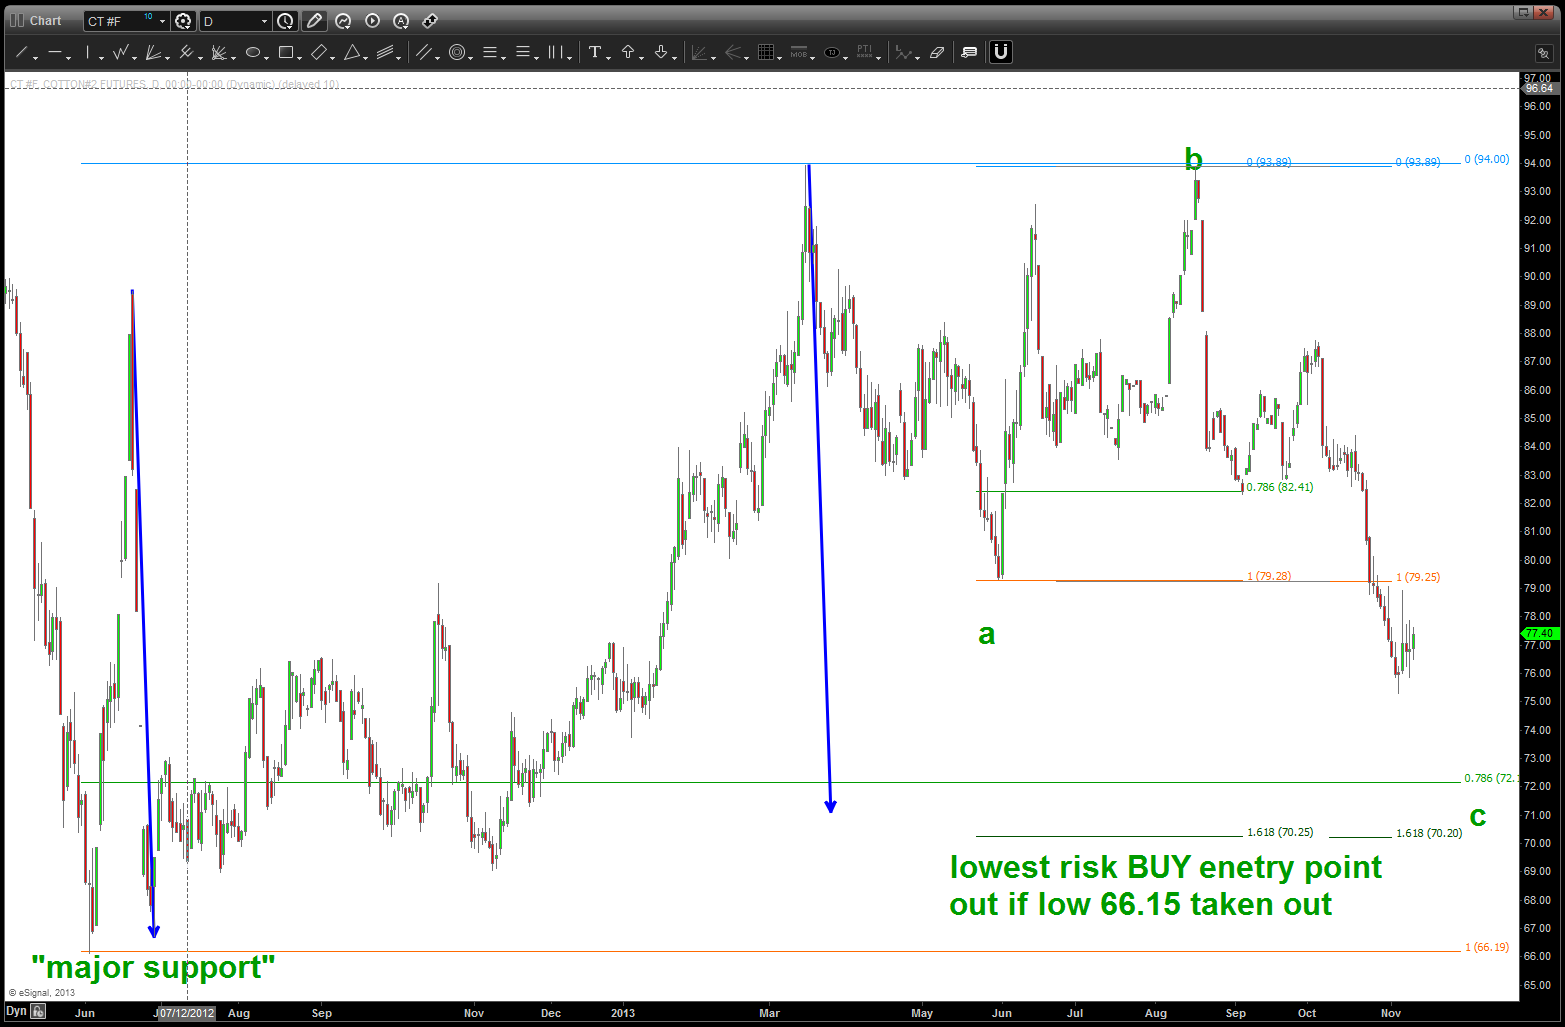
Cotton came down and bounced off a major level (.786 retrace) that had it’s “node” from 1971. it’s been correcting since March in a very nice 3 wave down (a), 3 wave up (b) and now finishing, what I believe to be a C wave. Can make the case for 76 being the low but would wait to in/around 70-72 as many more confirmations are present (blue arrow measured move correction, 1.618a = c, .786, 1.618 extension and, it just looks like there is one more wave down)
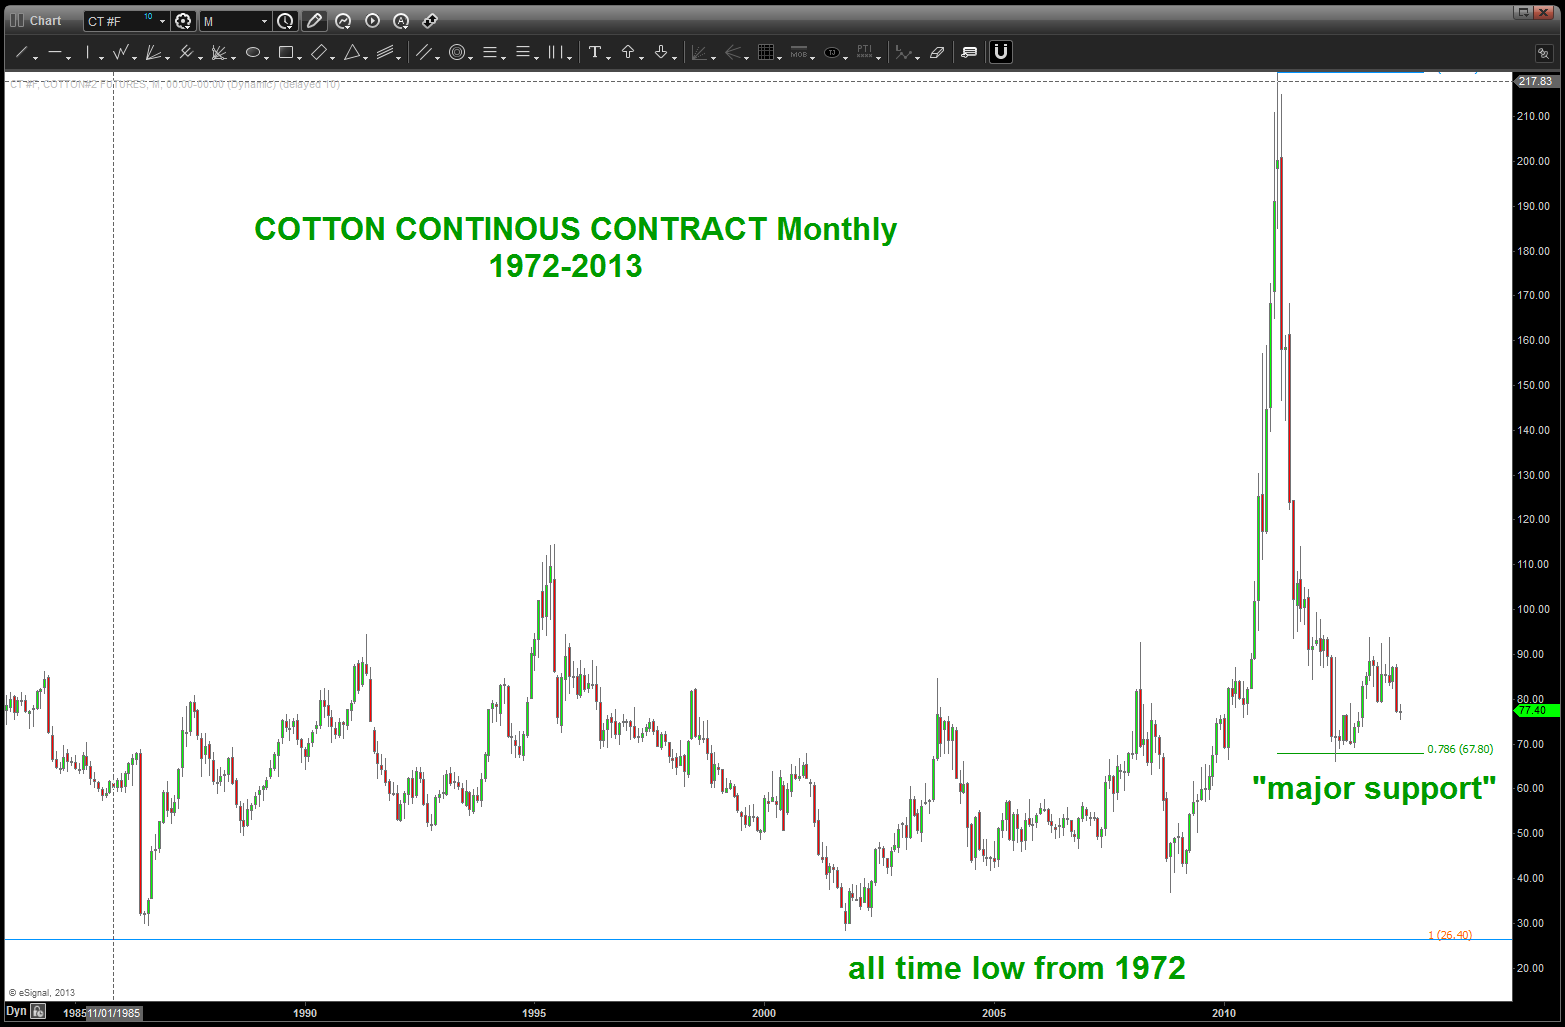
cotton support from 1972 node
where is the negotiator? final stages of PCLN run
Posted on November 11, 2013 Leave a Comment
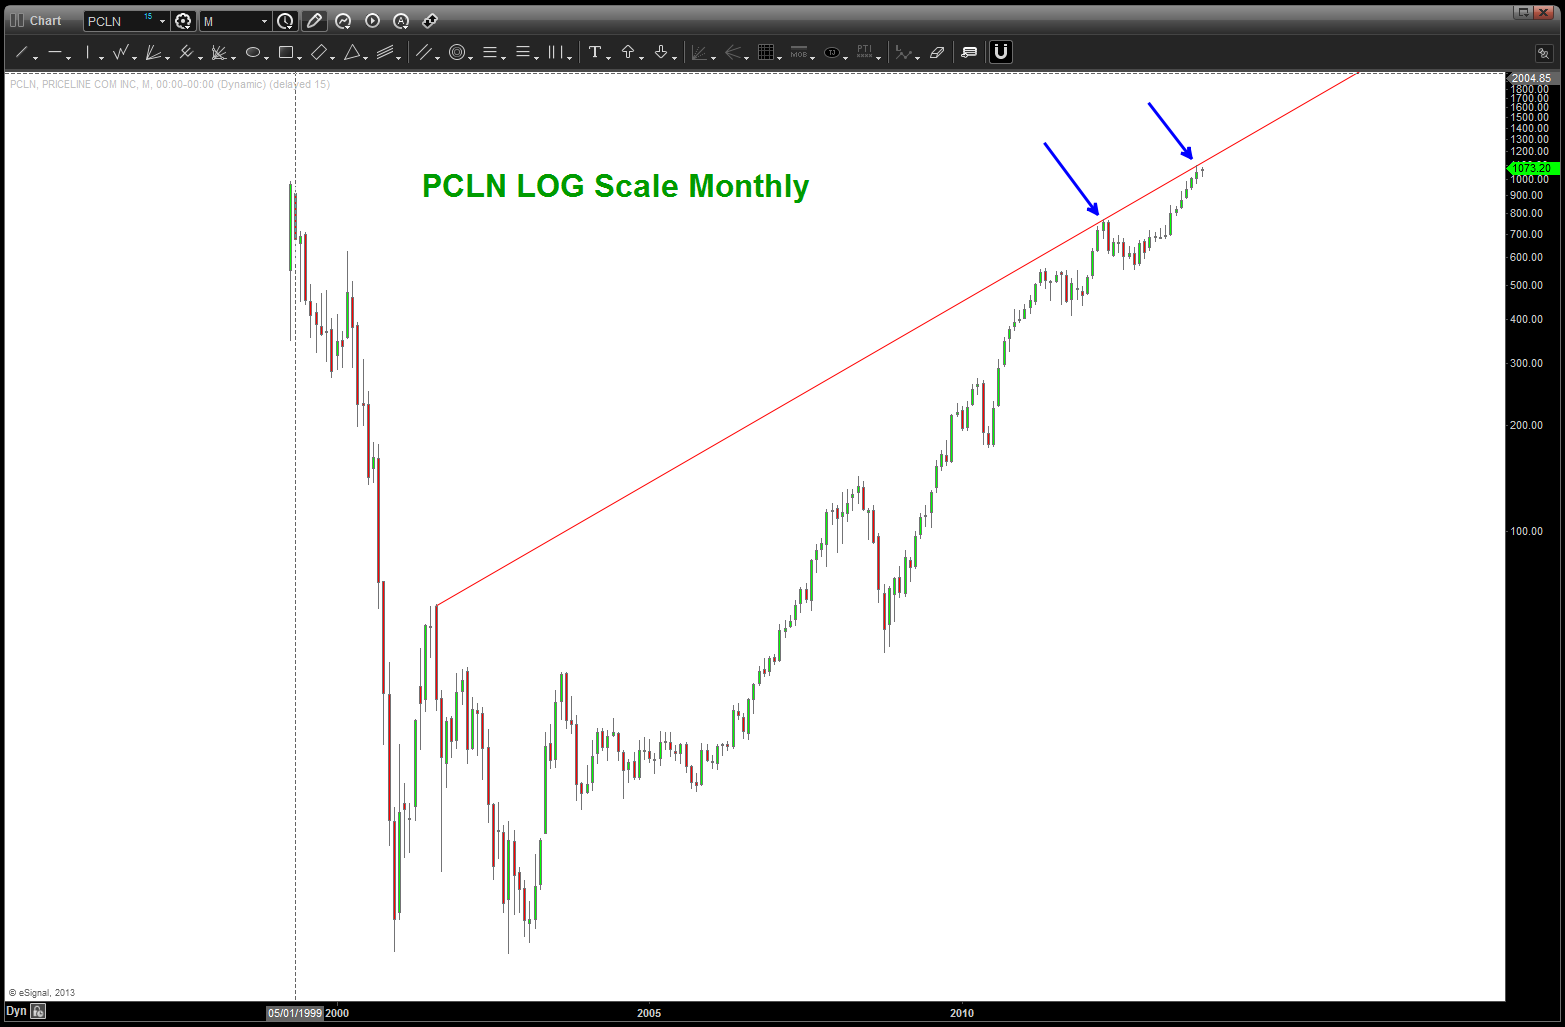
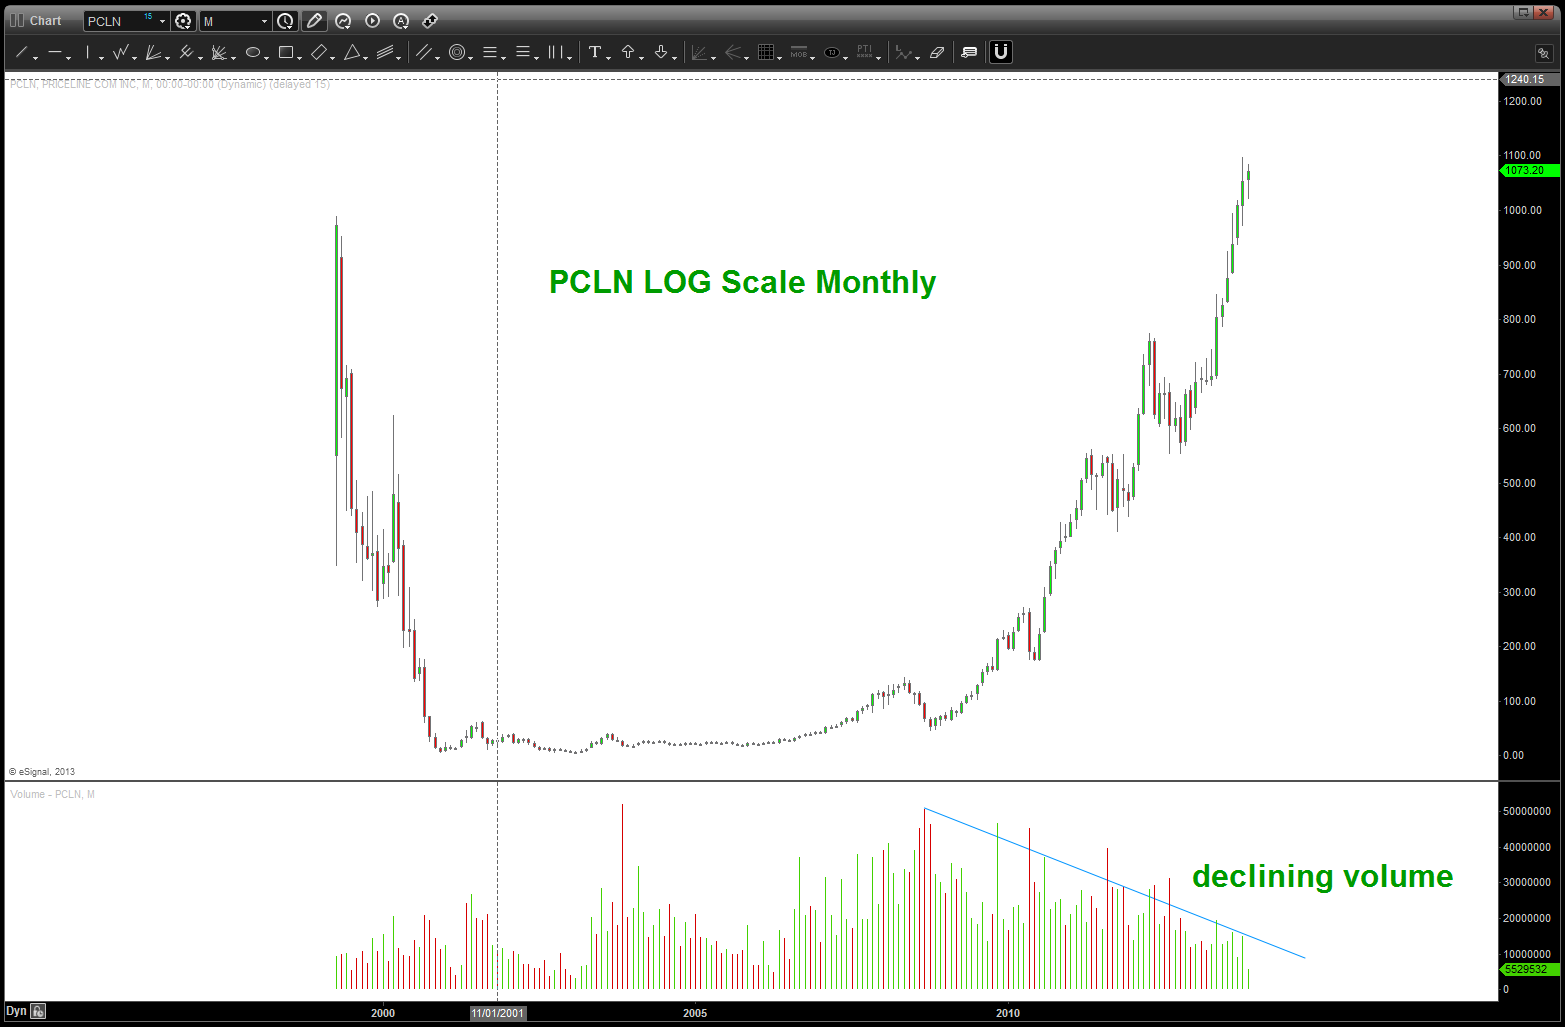
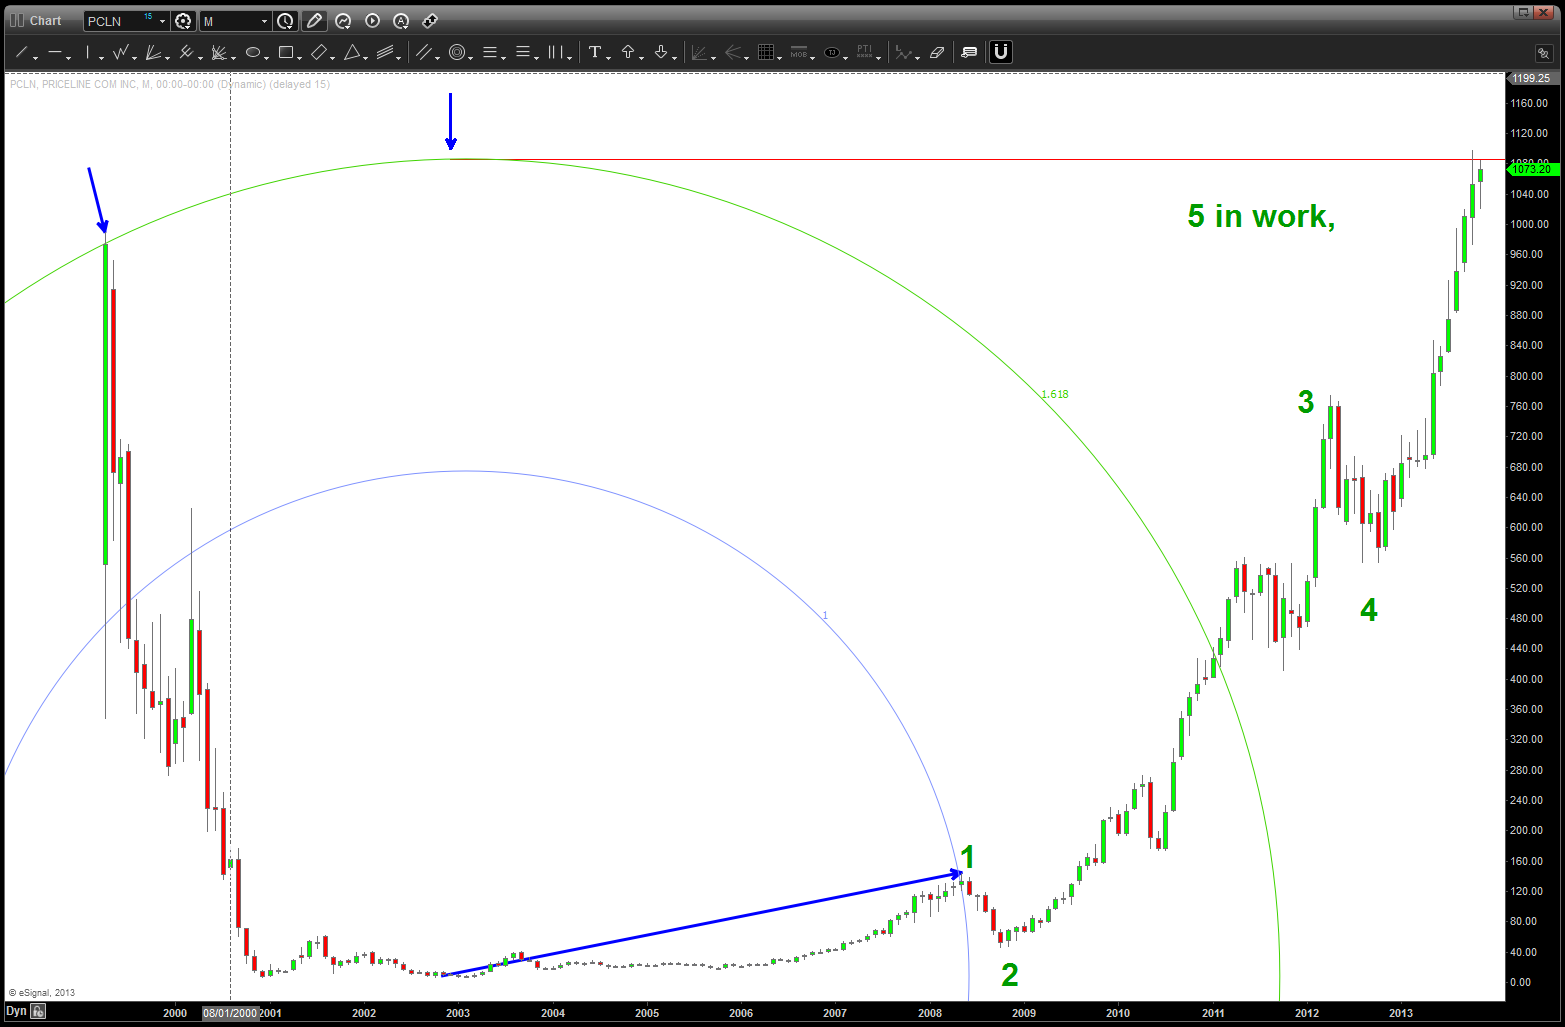
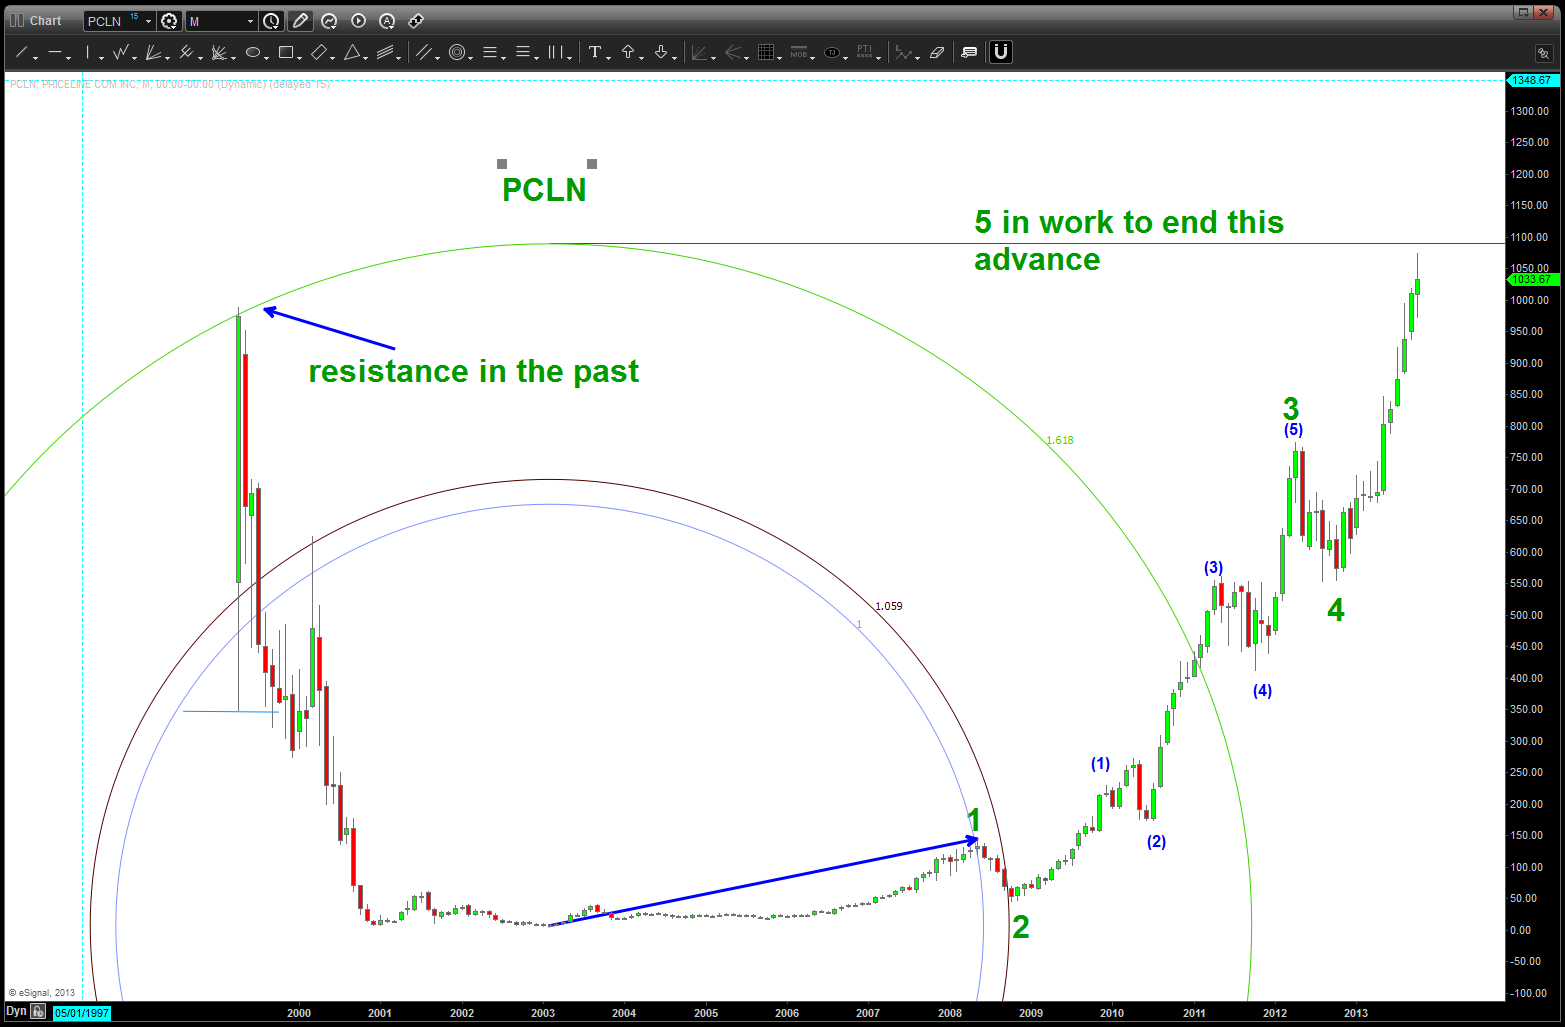
PCLN … amazing advance but one that is at/nearing an end for now.
a clear wave structure is in place that makes this current move up equal to a 5 on declining volume. also, it’s parabolic so don’t get to overzealous and short up in here – however – take not of my TSLA post, AAPL posts, etc to see how amazing parabolic moves are to the UPSIDE and how they get balanced by moves to the downsides that are equal and opposite w/ intensity. In my lifetime, I have never seen a parabolic move that rock and rolls to extreme highs and then digests/distributes and pauses and then takes off again…they all crack, hard.
fixed income … the one more high or final high in place quick looks
Posted on November 10, 2013 1 Comment
take the time to catch up on by reading/viewing charts from the below links…
last post:
post that warned of a very important top – before I was blogging:
http://allstarcharts.com/are-interest-rates-at-a-key-inflection-point/
bonds sold off hard on Friday and what could be the start of another leg down.
let me digress for a bit .. I LOVE Elliot Wave – when it’s easy to count. LOL – no kidding if you can pay attention to corrections and their form (flats, zig zags, triangles, expanded flats, double threes, etc) and live by the rules (3 can’t be shortest, 2 can’t go above/below the beginning of 1, 4 can’t go past the end of 1) you can get kind of dangerous at it. when I try to force a count it’s probably correcting or “the grid is shifting” and the count will, ultimately come to me. so, am I on a 5 minute chart counting every squiggle? nope … however, I do look for counts on monthly and weekly charts.
back to fixed income … if we look at the low in the summer of 2009 we’ll see the next leg up on bonds (the last?) start in earnest. Wave 1 peaks out and, as you can see, I have labeled to areas where 1 might have finished. then we go down into 2 and then this is where it gets interesting … if we make (1) = 3 then the correction BLOWS THRU 1 and we have broke our rule so we have to sub-divide and then NICELY count (1), (2), (3), (4),(5) into the all time high and that high becomes 3. for me, it’s the only way that I can count it and NOT break rules.
w/ that in mind, we see a 3 wave move down (a) and then a 3 wave movement up (b) and now we are rolling in a pretty devastating C wave…the “internals” of this C wave are very nice in that 3 was exactly 1.618 of 1 and IF 5=1 we land right on the top of the wave 1 that began the move in 2009 and it also equals the MAX/EXTREME corrective move that has ever occurred in this 30+ year move…IF that level holds and we start going up then, we might be up to another high. Sounds crazy but that is what the chart is telling us w/ regard to “one more high”
the chart:
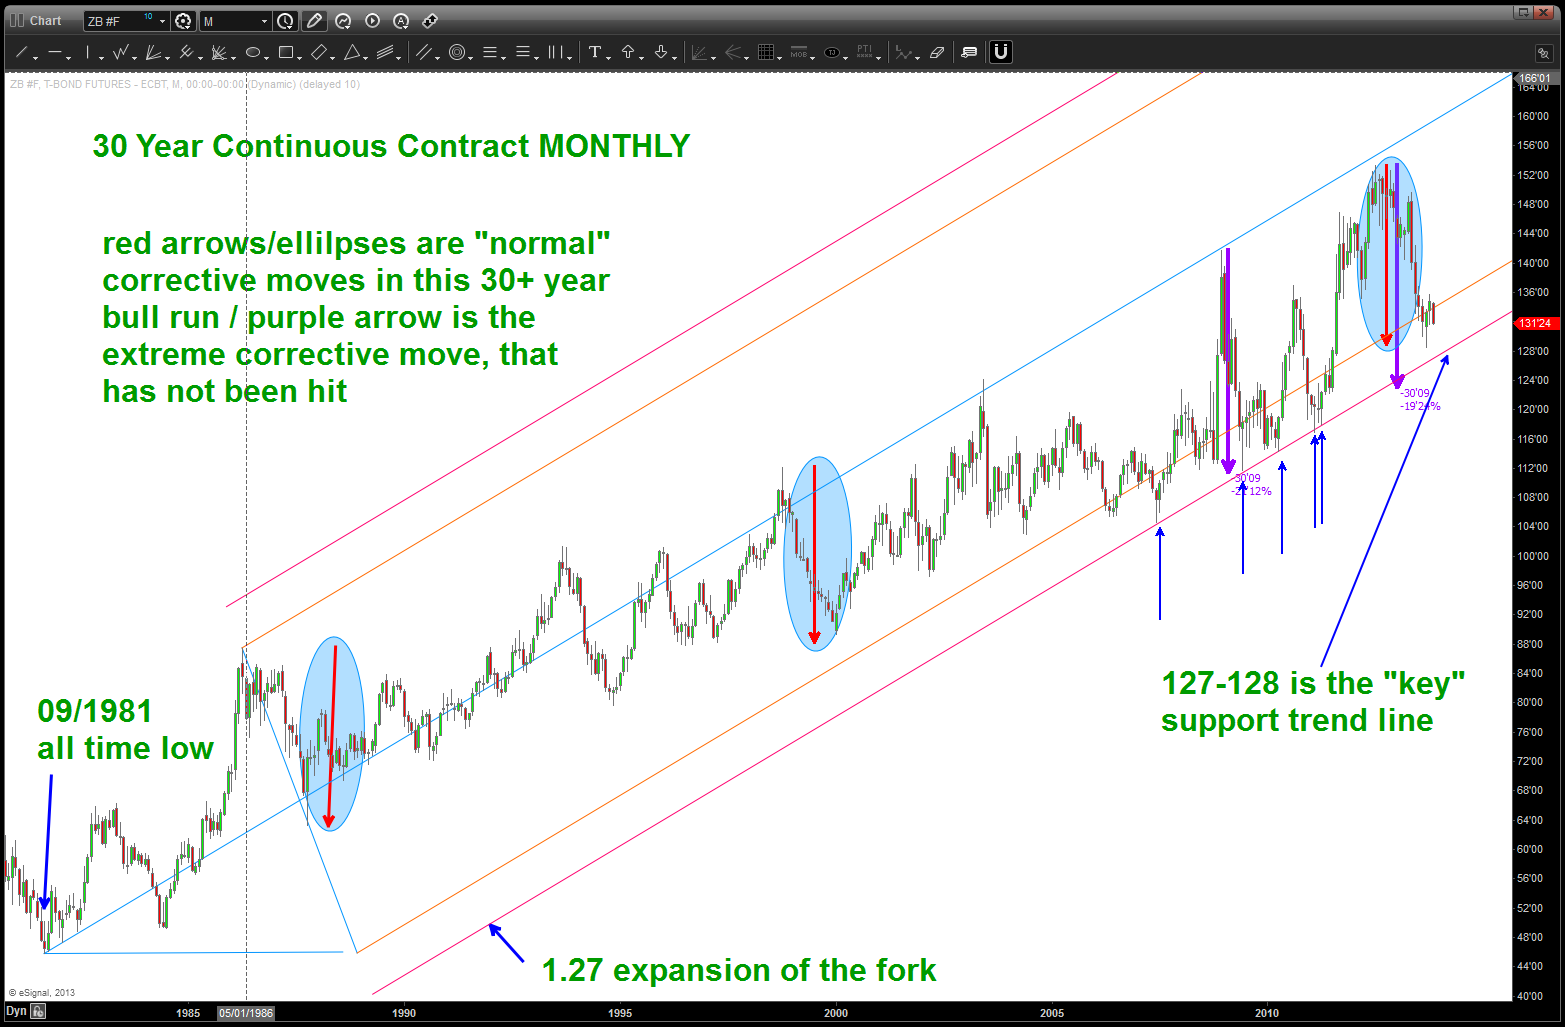
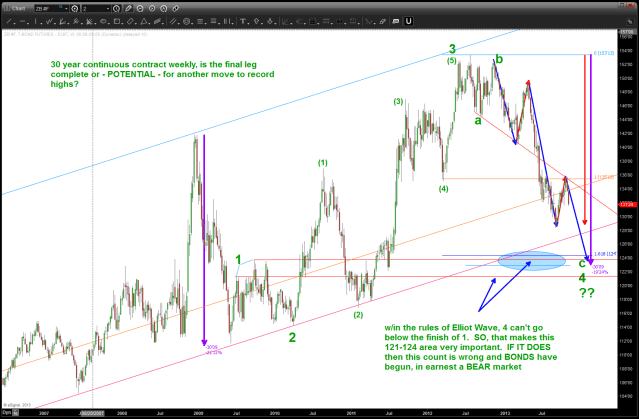 here is the bearish count – note the entire 2 was a flat type of correction and therefore, you “could” fit this one into the picture….either way, we are on the right side of the market and I feel pretty certain that we’ll target that long standing trend line at 127-128 (red line) and/or the 124 level. I expect rates to rise accordingly as this target area is attacked. Stay tuned …
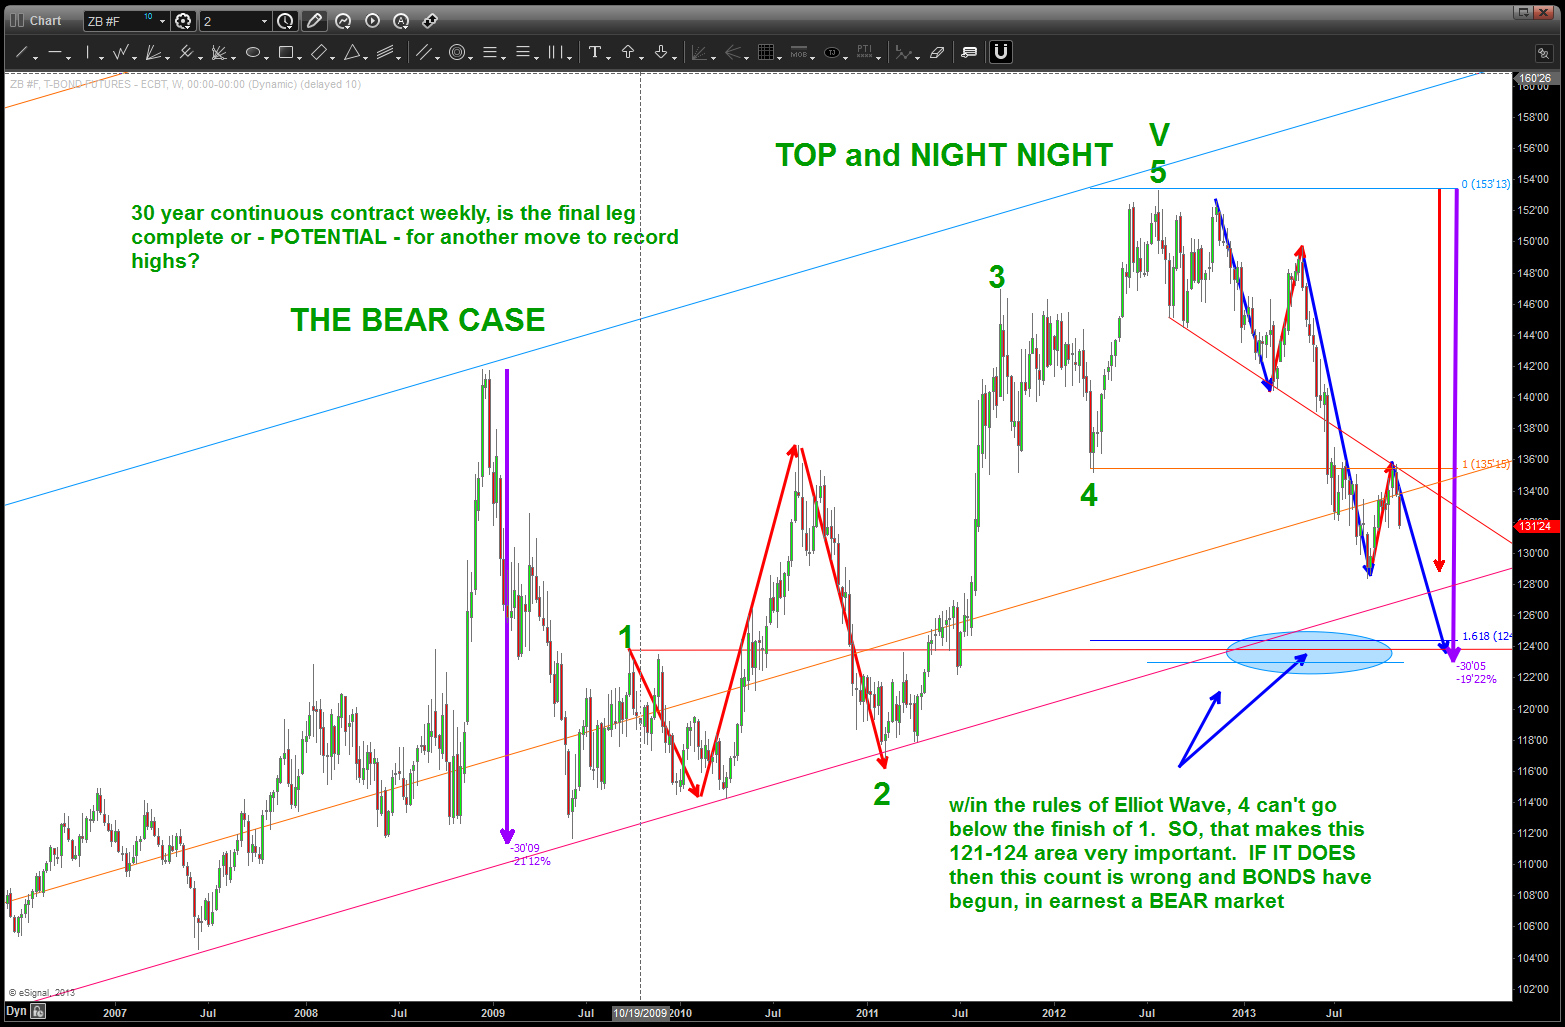
Long Bond w/ a modified count to show the all time high
“What is and What Should Never Be” Part VI Conclusion
Posted on November 10, 2013 2 Comments
here’s the conclusion from 2 months ago:
https://bartscharts.com/2013/09/16/part-vi-the-sp-500-conclusion/
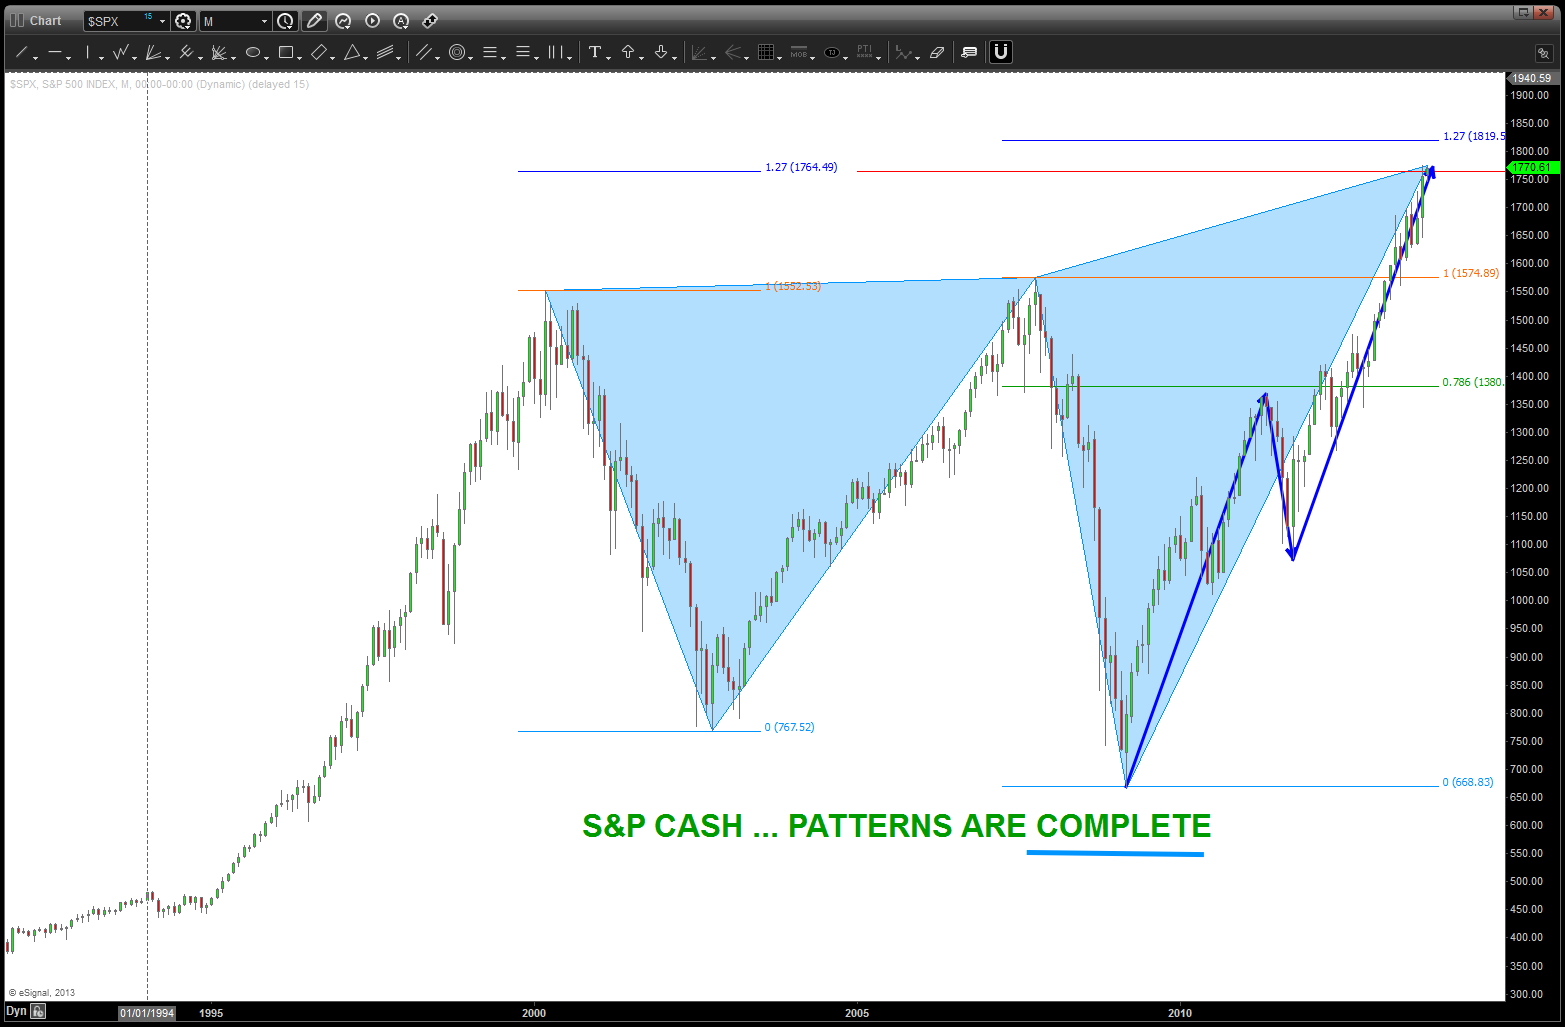
a quick review of the Part 1-5 has shown that most if not all of our playbook has been playing itself out. NOTHING has changed my view that we are due for a very large correction, or dare I say, a very surprising THUMP of gargantuan proportions. the stage is set …
the manipulation of this market is of epic proportions … it should be correcting or be going down but the FED has made sure it never will be …they can keep printing but one day it will end…
Part V and “I Can’t Quit You Baby”
Posted on November 10, 2013 Leave a Comment
this was Part IV a couple months ago:
https://bartscharts.com/2013/09/16/part-v-sp-and-sector-rotation/
http://www.youtube.com/watch?v=5g5Ypz74jQw
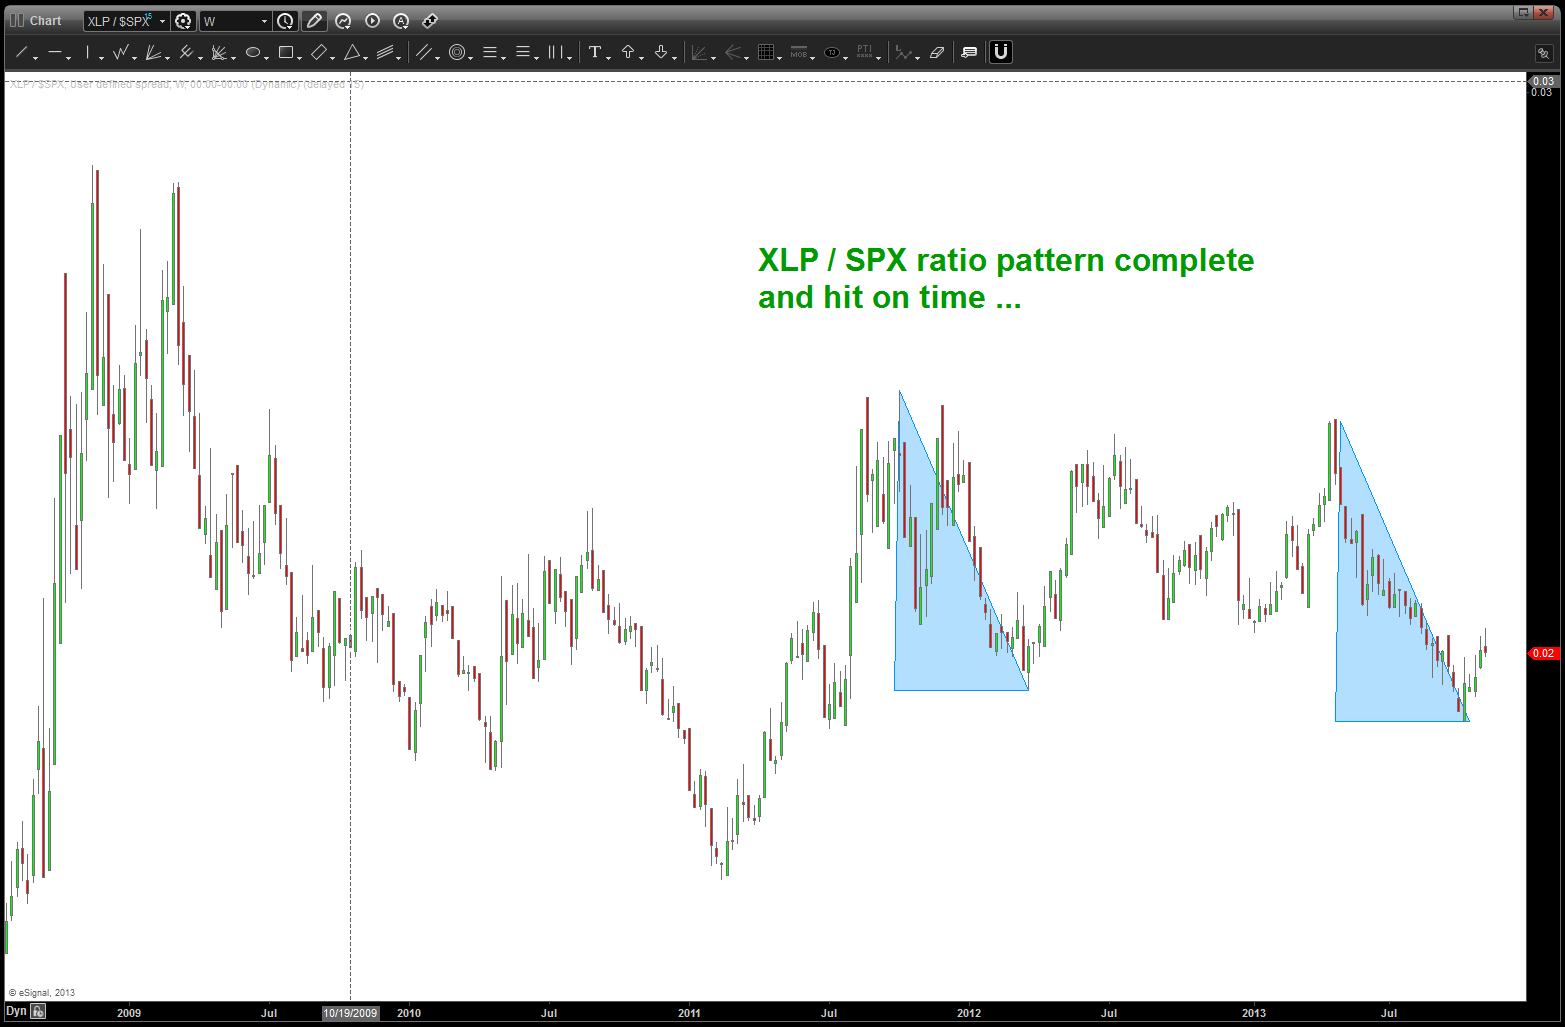
I think this ratio is one of the most important out there as it shows the rotation into the staples of life, so to speak. additionally, at EVERY major inflection point since 2000 when this ratio bottoms or tops the market does the opposite. this pattern is complete, it held and I think it will prove to be very bearish for the market.
I can’t quit you XLP/SPX ratio …
Part IV and “your time is gonna come”
Posted on November 10, 2013 1 Comment
this is the Part IV post from a couple months ago:
https://bartscharts.com/2013/09/15/part-iv-sp-and-energy/
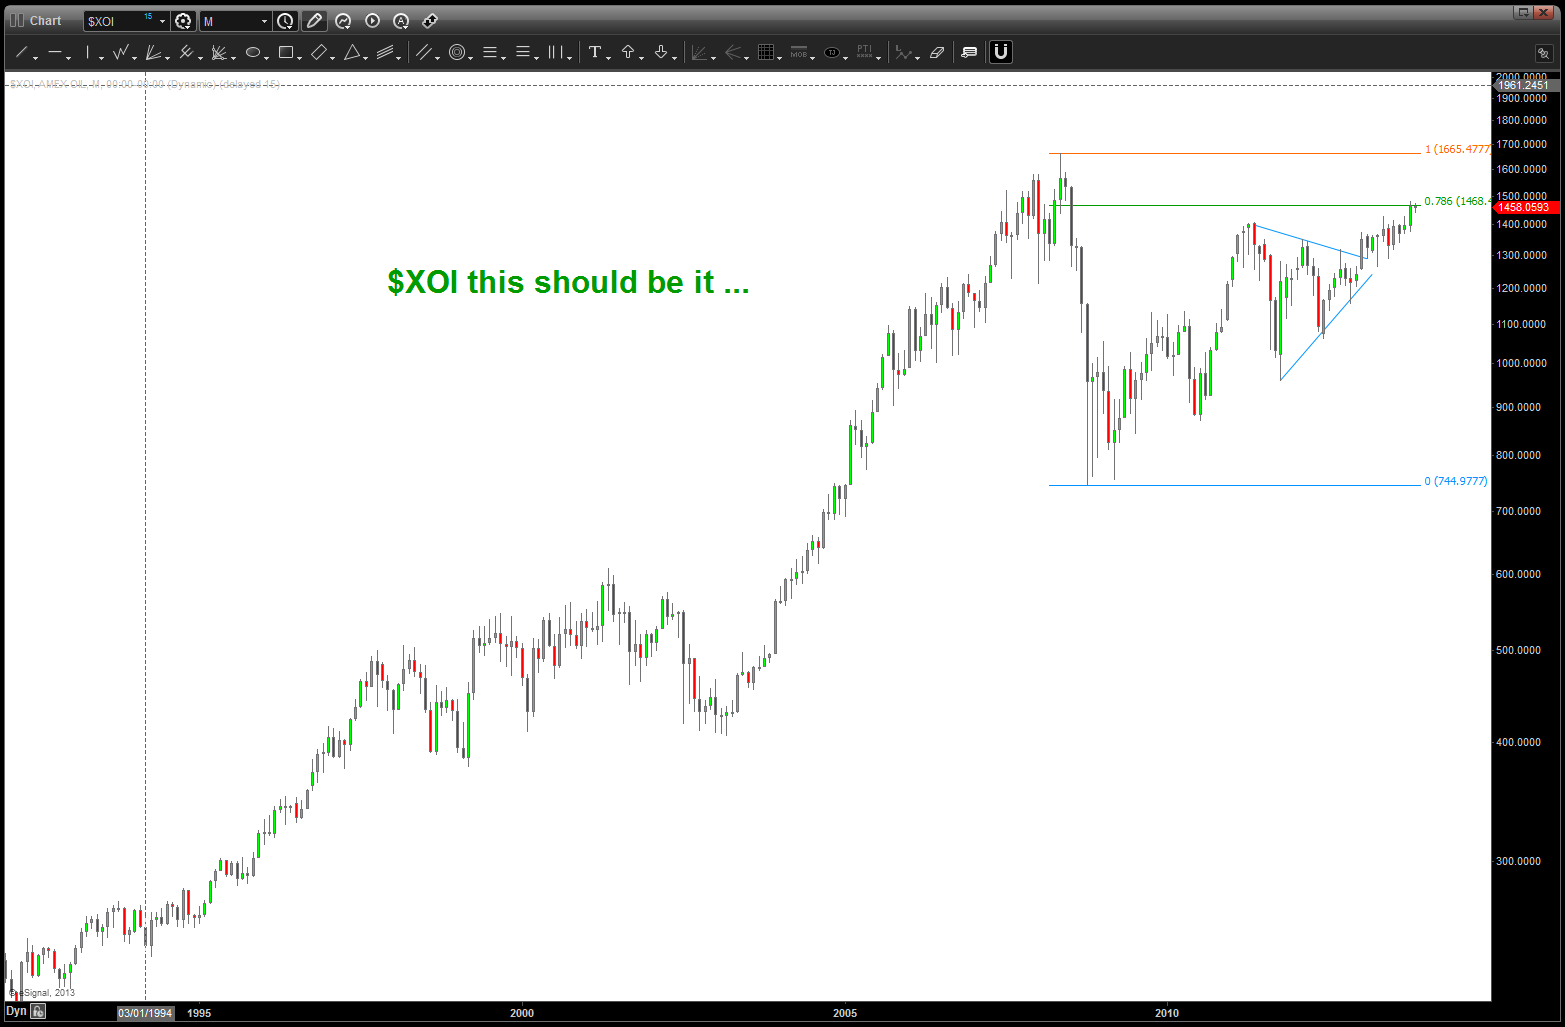
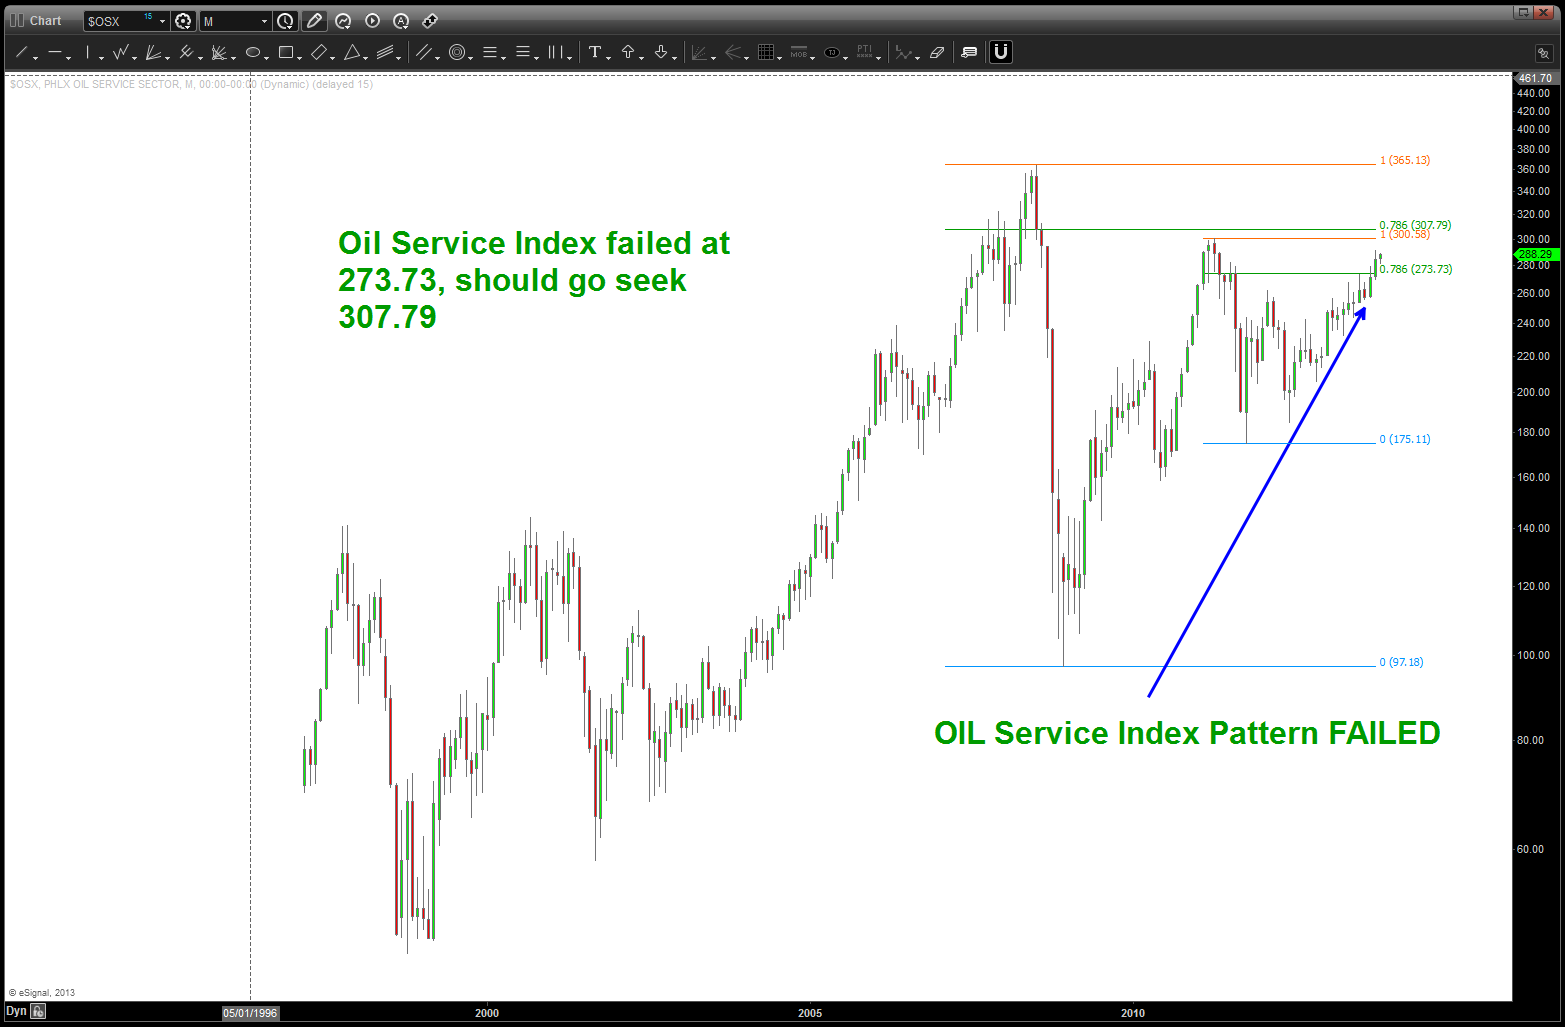
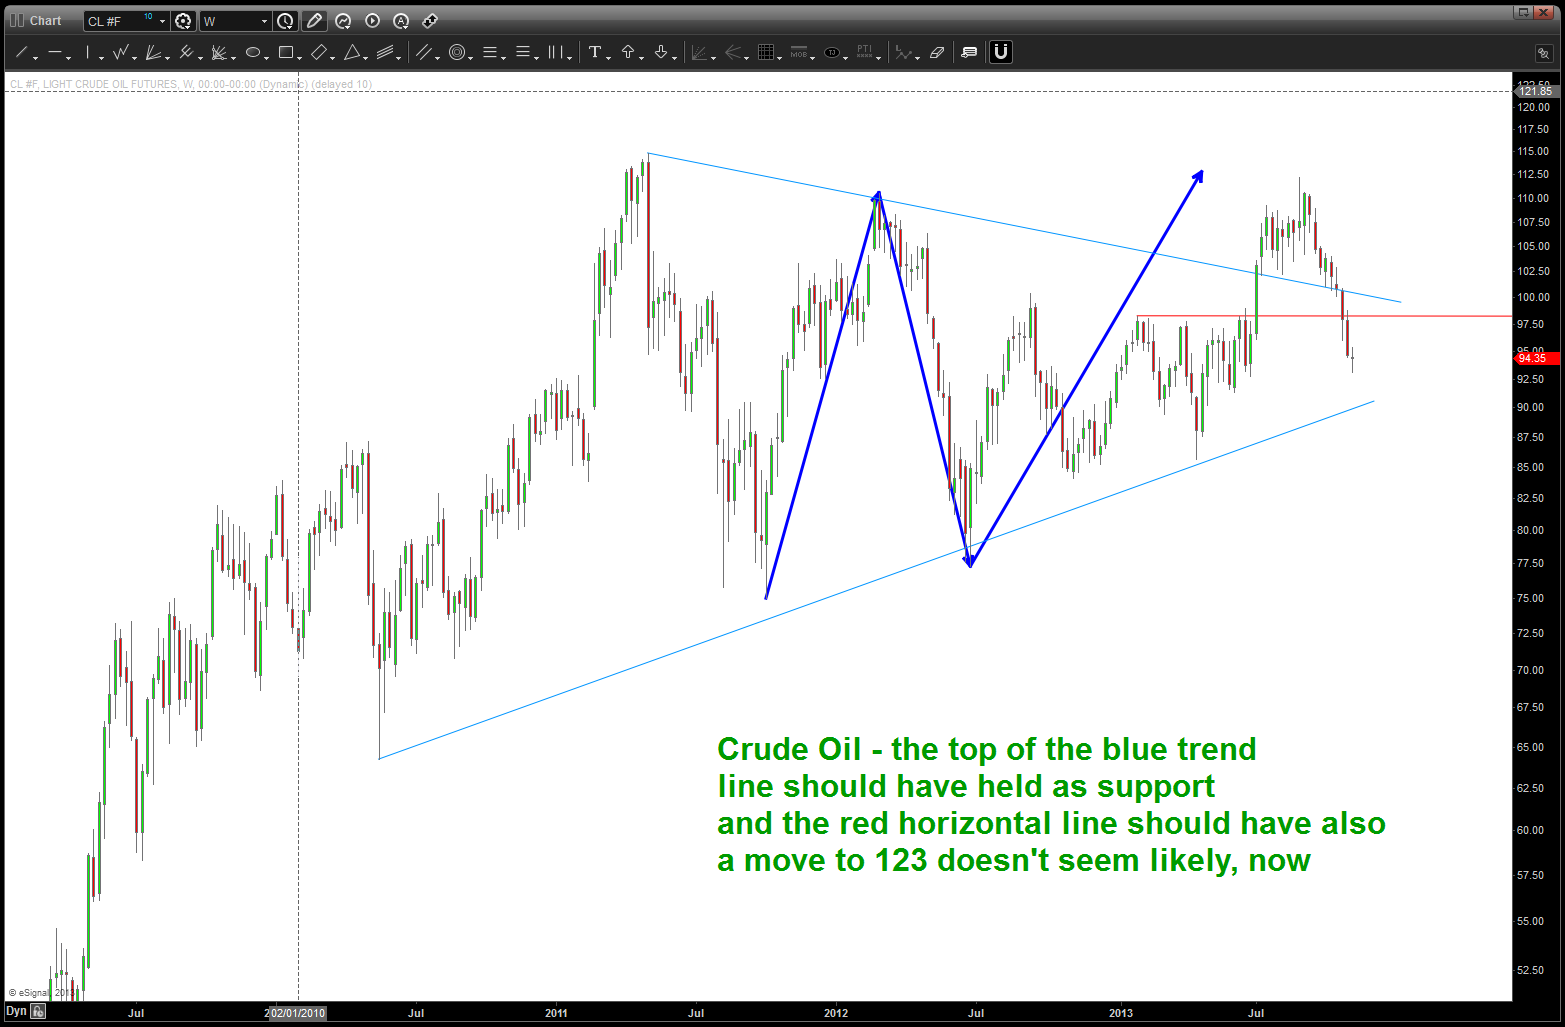
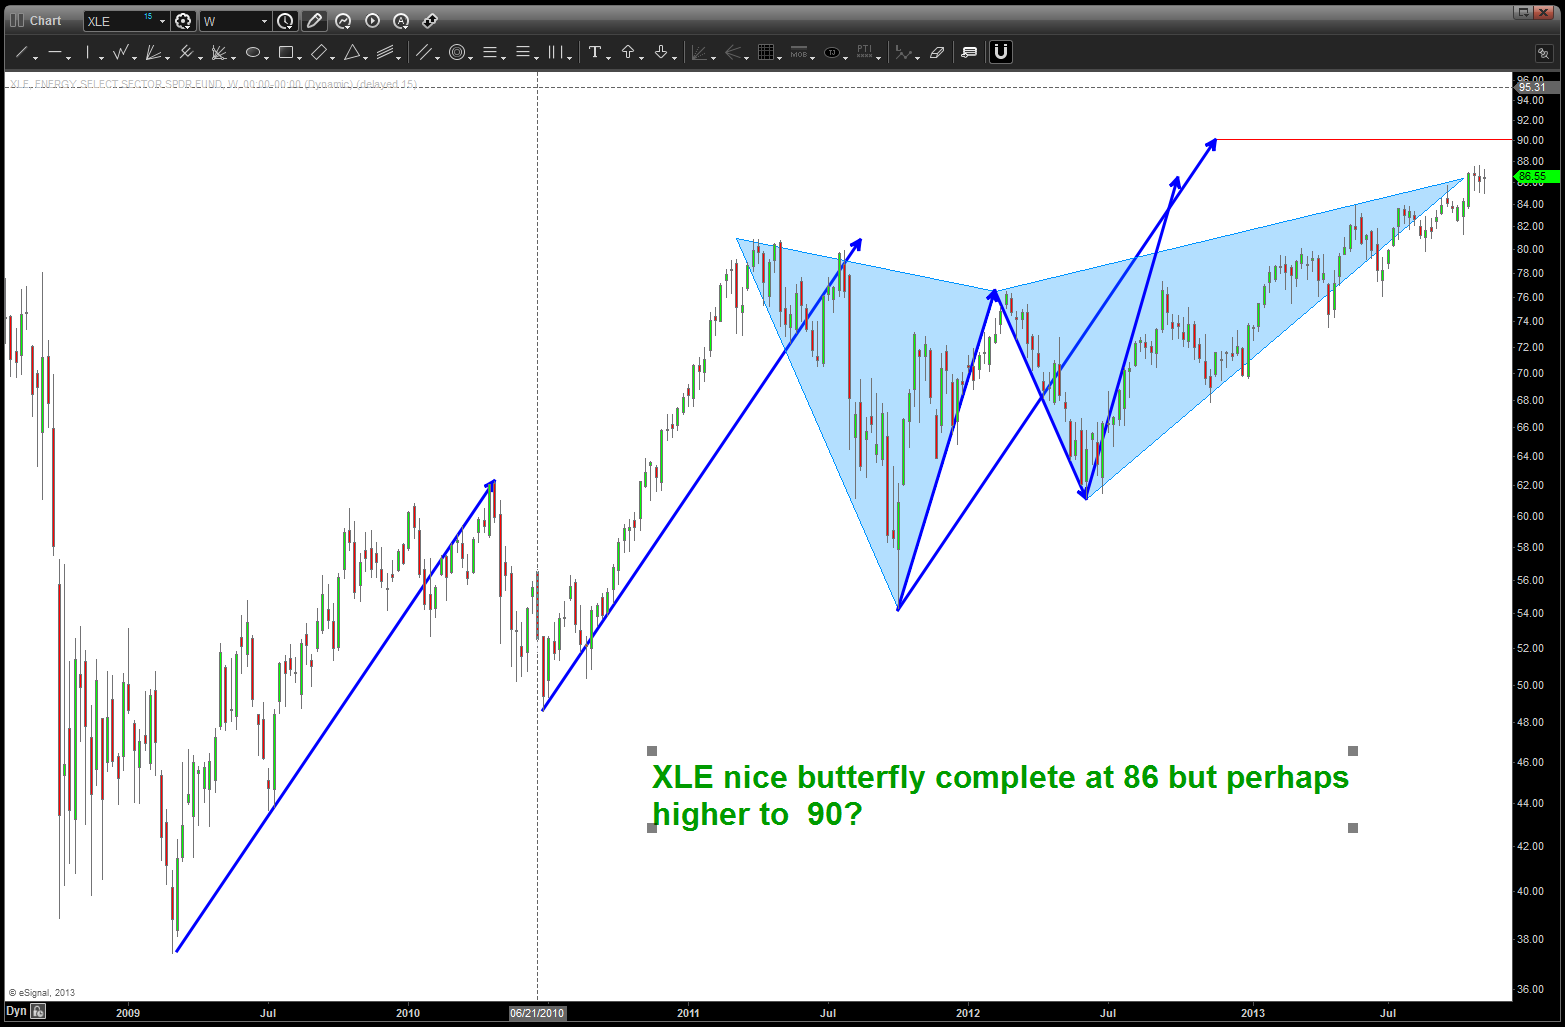
this energy sector needs to be watched … the OSX, XOI, XLE are painting the same picture as they have gone up in the context of targets that have now been hit or are completing just a little higher. Crude, however, has been pretty weak … not widely reported is the fact that the Administration basically lifted economic sanctions on Iran so perhaps they are flooding the markets w/ their oil…who knows and that’s not for me to conjecture.
however, in the context of the S&P energy does make up roughly 10% of the index so, in order for the index to start moving lower we will need to see these patterns complete and start down. they HAVE NOT yet …but they are basically in the zone
Follow up to Part III and “When the Levee Breaks”
Posted on November 10, 2013 Leave a Comment
Part III post:
https://bartscharts.com/2013/09/14/part-iii-the-sp-500-and-the-influence-of-technology/
when the levee breaks:
http://www.youtube.com/watch?v=fOEQTJV_3-w
NAZZIE has hit our targets … is the levee going to break?