US Dollar Index
Posted on March 14, 2015 Leave a Comment
Folks, this one has been tough and has exceeded any of my previous projections for a pull back. Is it parabolic? Maybe? Kind of? But it is very overbought – ok I’m going to say it – EXTREMELY OVERBOUGHT and NEVER in the history of the index has there been this level of BULLISH SENTIMENT. You can’t go wrong BUYING DOLLARS. So, for me that means to watch out …
Here’s my latest attempt at finding a pattern to stop this in it’s tracks … I have NOT gone long the EURO but have gone w/ my gut each time a level has held for a bit but the thrust and “feel” and YES “feel” has a lot to do w/ it just haven’t been there …
So, we’ll keep trying but I STILL BELIEVE that being LONG DOLLARS is the wrong side of this trade for now … a nice multimonth pullback and it will take off again. But for now – well – I’ll stand aside ..
PARABOLIC MOVES ALWAYS END IN A VERY SWIFT AND DEVASTATING MOVE OPPOSITE HOW IT GOT THERE …
Make it a great weekend and happy PI day!

Picture Paints a Thousand Words ..
Posted on March 7, 2015 Leave a Comment
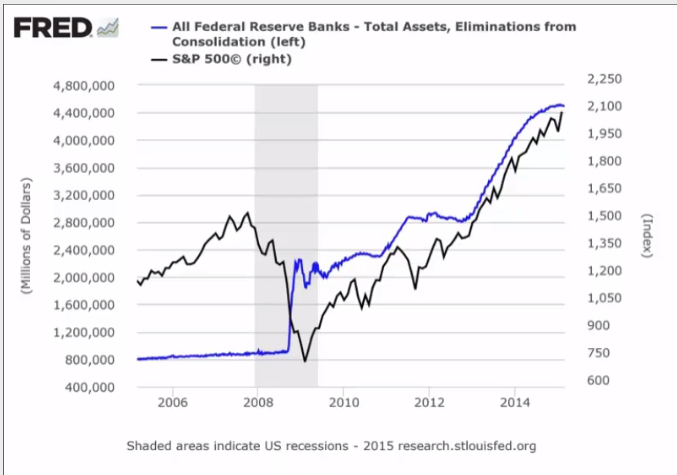
My mentor and friend Larry Pesavento (www.tradingtutor.com) sent this out on Friday night. Please, take a look.
For me to comment on this would inject a bias. So I’m not. I’m just going to post the picture and allow you to evaluate this as you see fit.
Enjoy.
Silver Roadmap Continued – getting tricky
Posted on March 7, 2015 Leave a Comment
if you go to @seeitmarket and also “search” Silver on this site you’ll see we have been watching inflections at 8/0z and then 48 oz and, most recently, the low that came into 14/oz.
conversation has been around a “big low” at 14 and potential new highs OR a corrective bounce. at this point in the game, it’s still an uncertain aspect of the Silver move BUT the odds are leaning to the side of the “correction” fence.
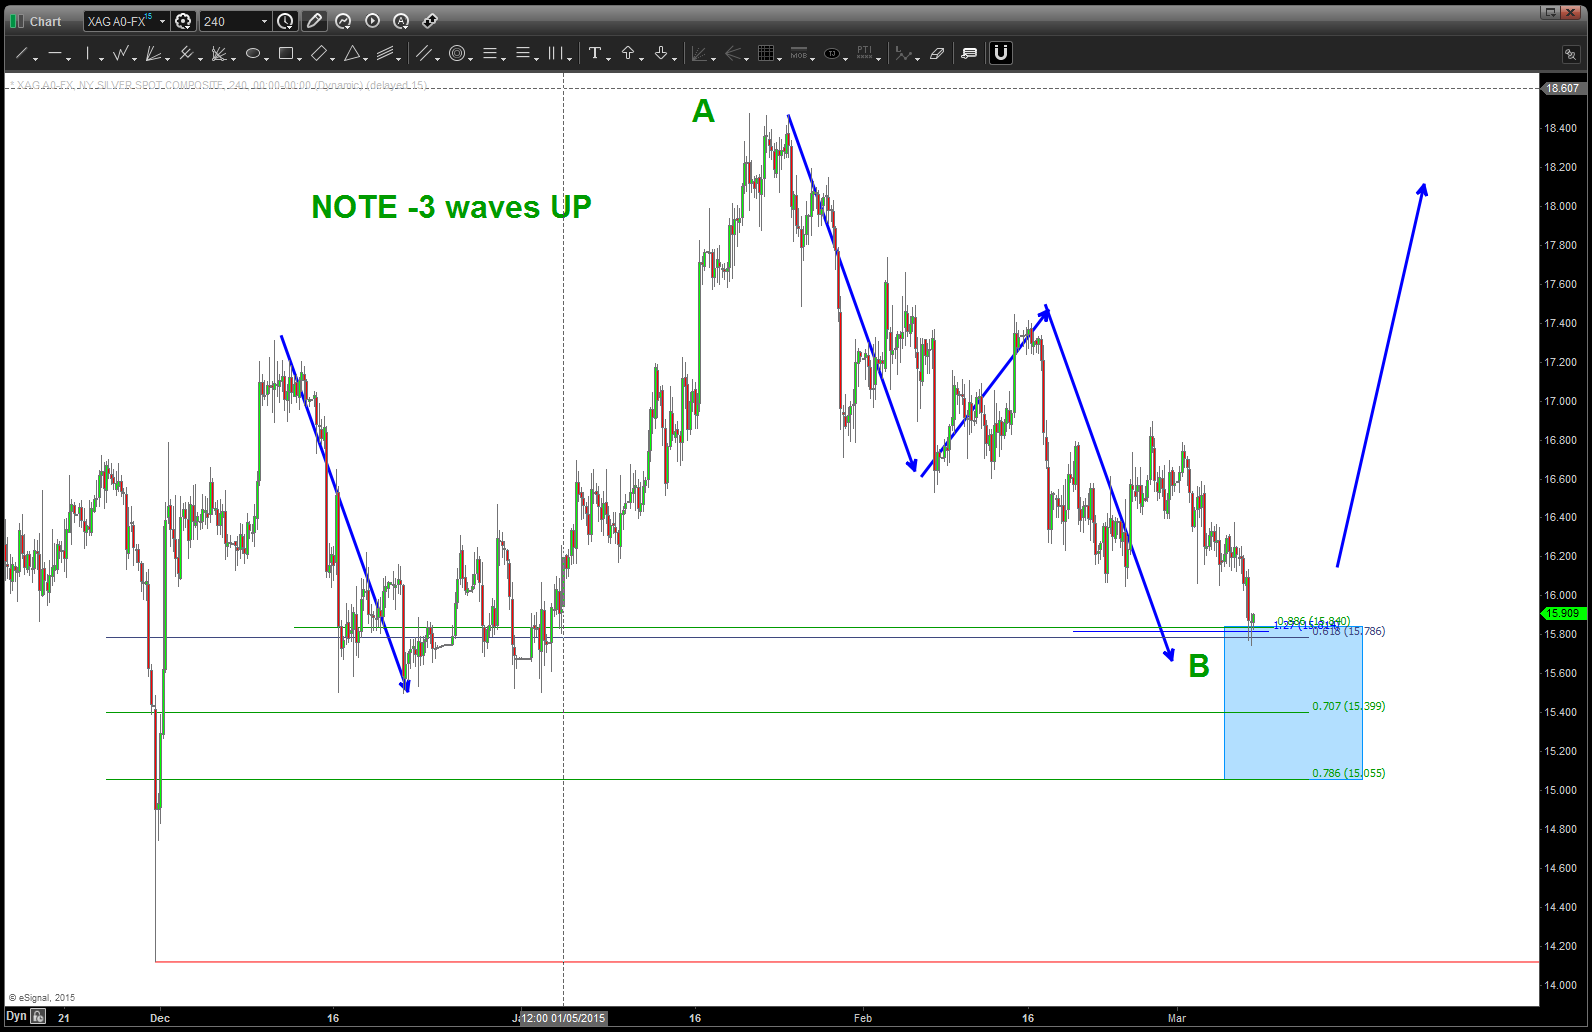
I’ll present three scenario’s for Silver. Right now, it appears the A-B-C correction is the most favorable to monitor …
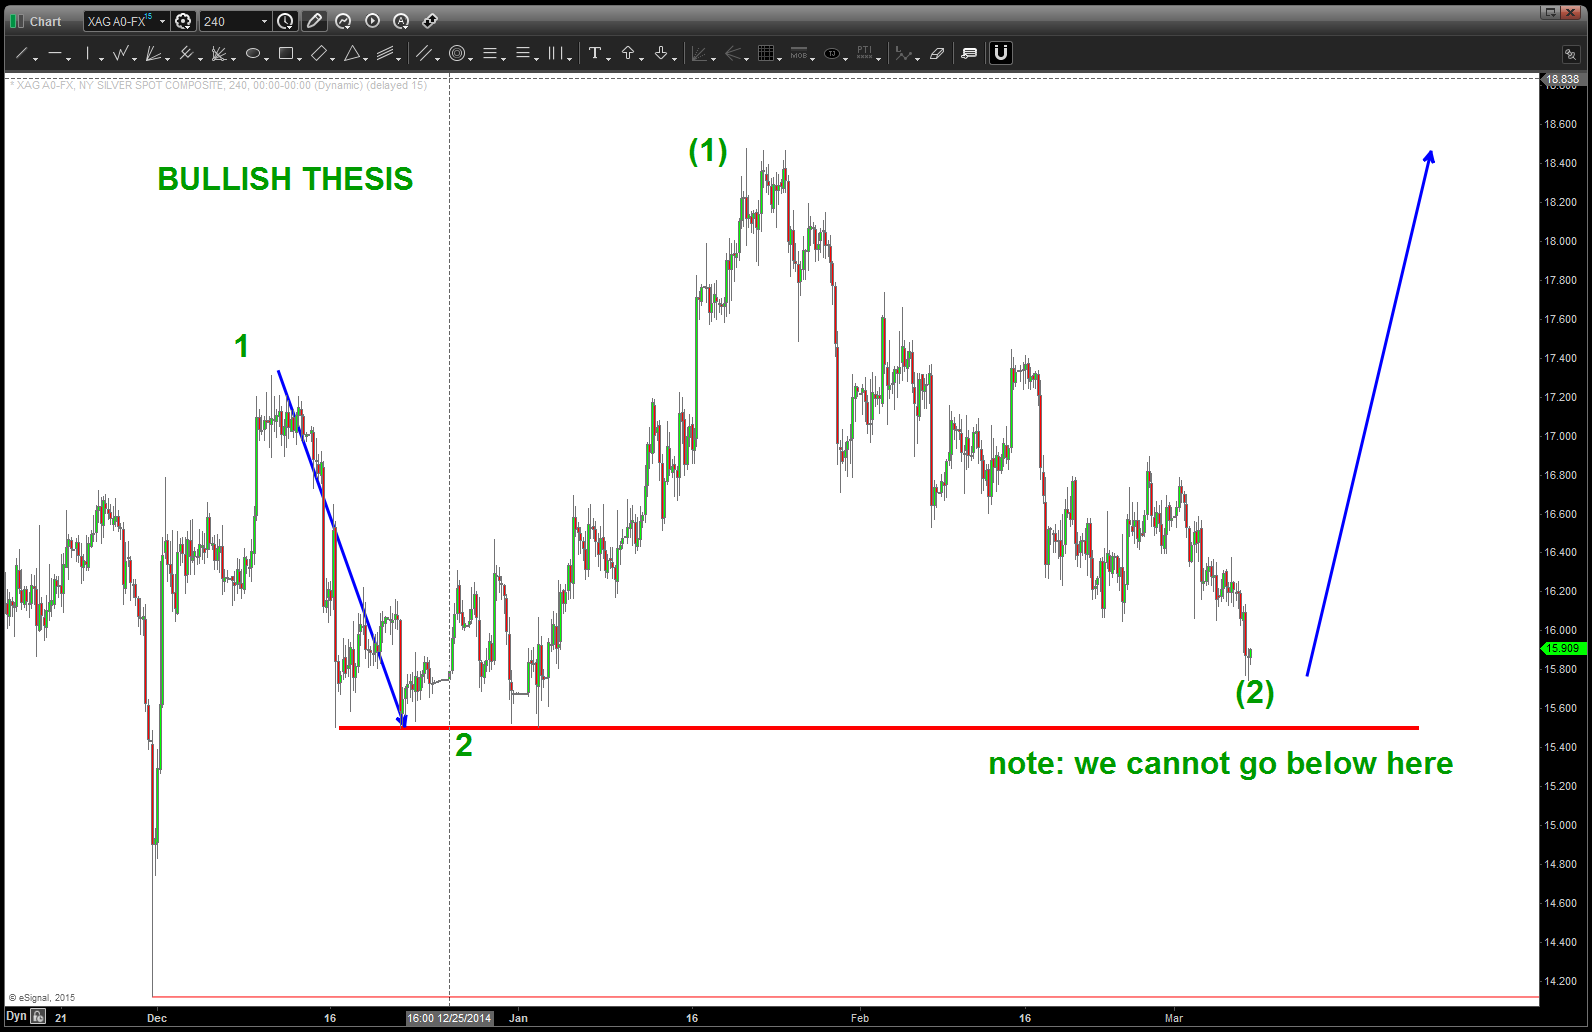
#1: CORRECTION: If you look at the most recent high of 18.40 you’ll see it made that high from 14 in a corrective 3 wave bounce. In “counting waves” the correction that is occurring from 18.40 high is not ALLOWED (it’s a rule) to go below wave 1. (It has done that as the HIGH for wave 1 would have been 17.20.) So the current move can be counted as B w/ 5 wave C to begin here or a little lower. If we are in a flat type of correction prices could go all the way back down to the low or a little lower BUT ultimately we should feel confident that a 5 wave move UP will be occurring.
#2: BULLISH MOVE: in this case, note the slight change in the count. What we can safely say is that for this count to be valid prices can NOT go below the red line. IF they do THEN it’s apparent we are in the A-B-C correction. the count below is EXTREMELY BULLISH in that we’re making the case that this wave is subdividing and is going to be very strong. Prices basically need to hold right here and go up w/ a vengeance. Odds are not favorable for that right now. We will see ….
#3: BEARISH BEARISH BEARISH: I don’t like this, but I have to show it simply because the COUNT coming into the 14/oz low was pretty spot -on so the TIME of the correction is, simply, not in line w/ that count. Additionally, note the THRUST up out of the 14/oz level. But, alas, I need to show it.
First off – note on the daily w/ do away w/ the thesis that it was a triangle that proceeded the 14/oz low. (Editors comment (me): folks that triangle was a PERFECT a-b-c-d-e so it’s hard for me to show “no triangle” but need to show to be objective) Now, note the wave structure which subdivides and doesn’t break any RULES. This forecasts another “new” low before move UP in earnest.

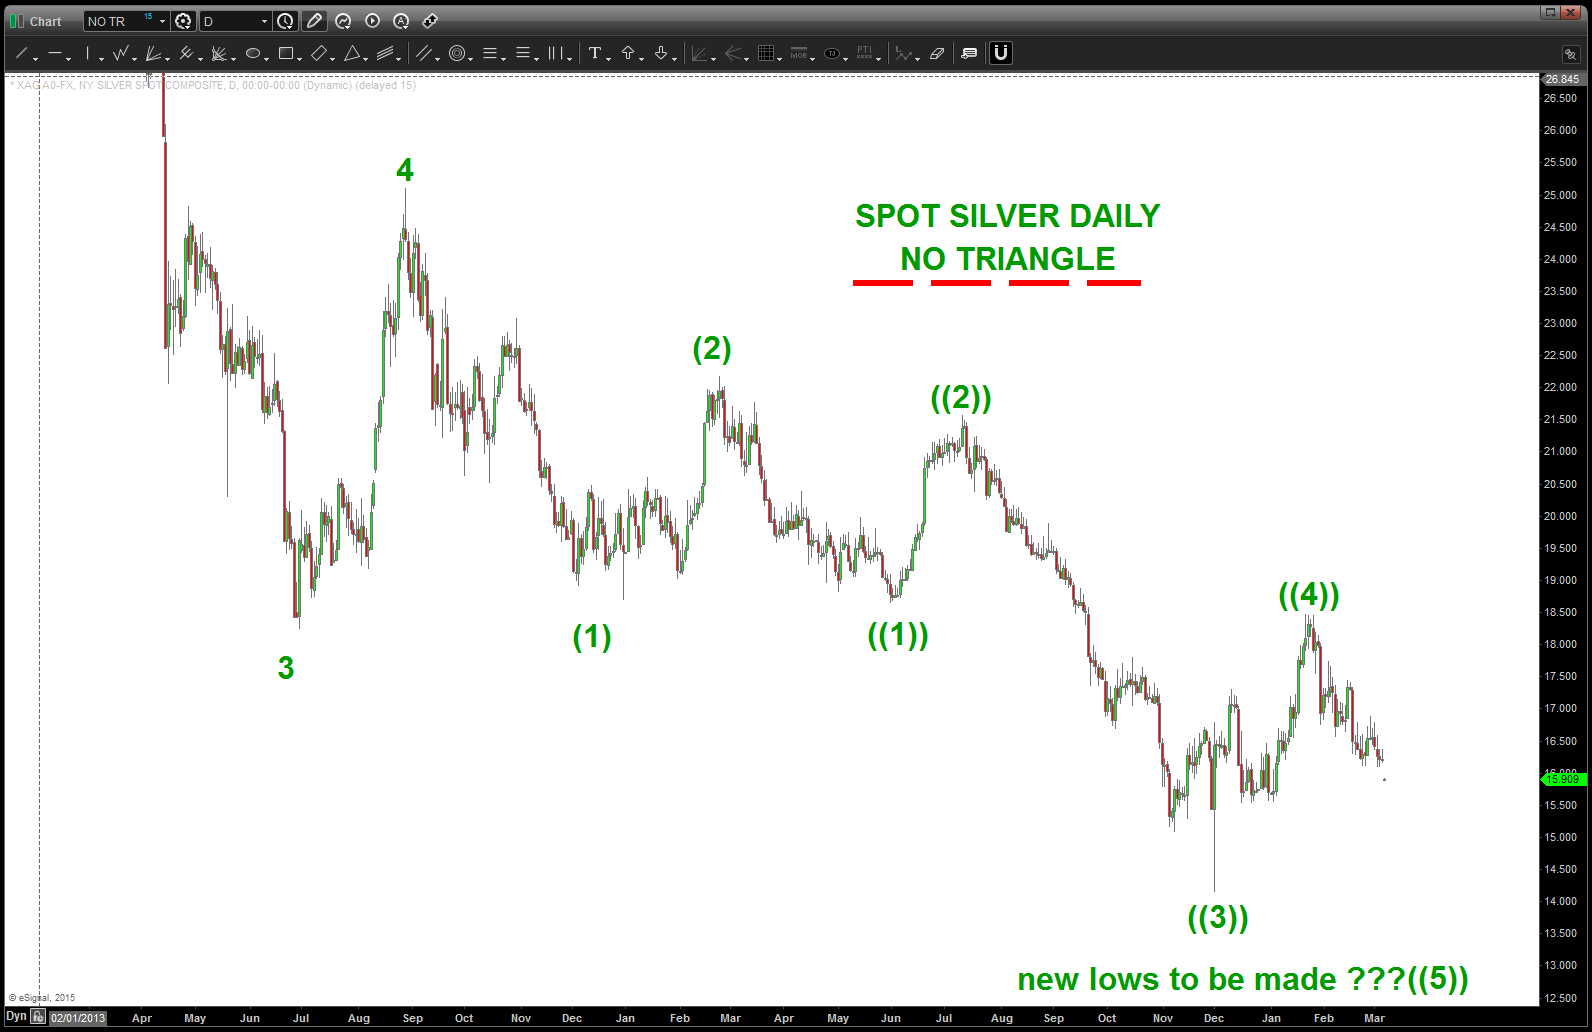
Out of the 3 options present I lean toward #2, then #1 and then, finally, #3.
Let me know if you have any questions.
Make it a GREAT weekend.
Bart
Square Roots and $BABA
Posted on March 4, 2015 Leave a Comment
I had the chance to “chat” w/ JC today and was really watching the EUR vs AUD set up and he mentioned – $BABA. Full disclosure – I am not long this security as it really hasn’t been on my radar screen. I have been monitoring it w/ the correlation to YAHOO which had come down into my target zone after this post: http://www.seeitmarket.com/yahoo-stock-pullback-yhoo-price-targets-watch-14035/ . I did notice the bounce in YHOO around my target level.
But this is simply about square roots and, as a technician, one must seriously pay attention to them … period.
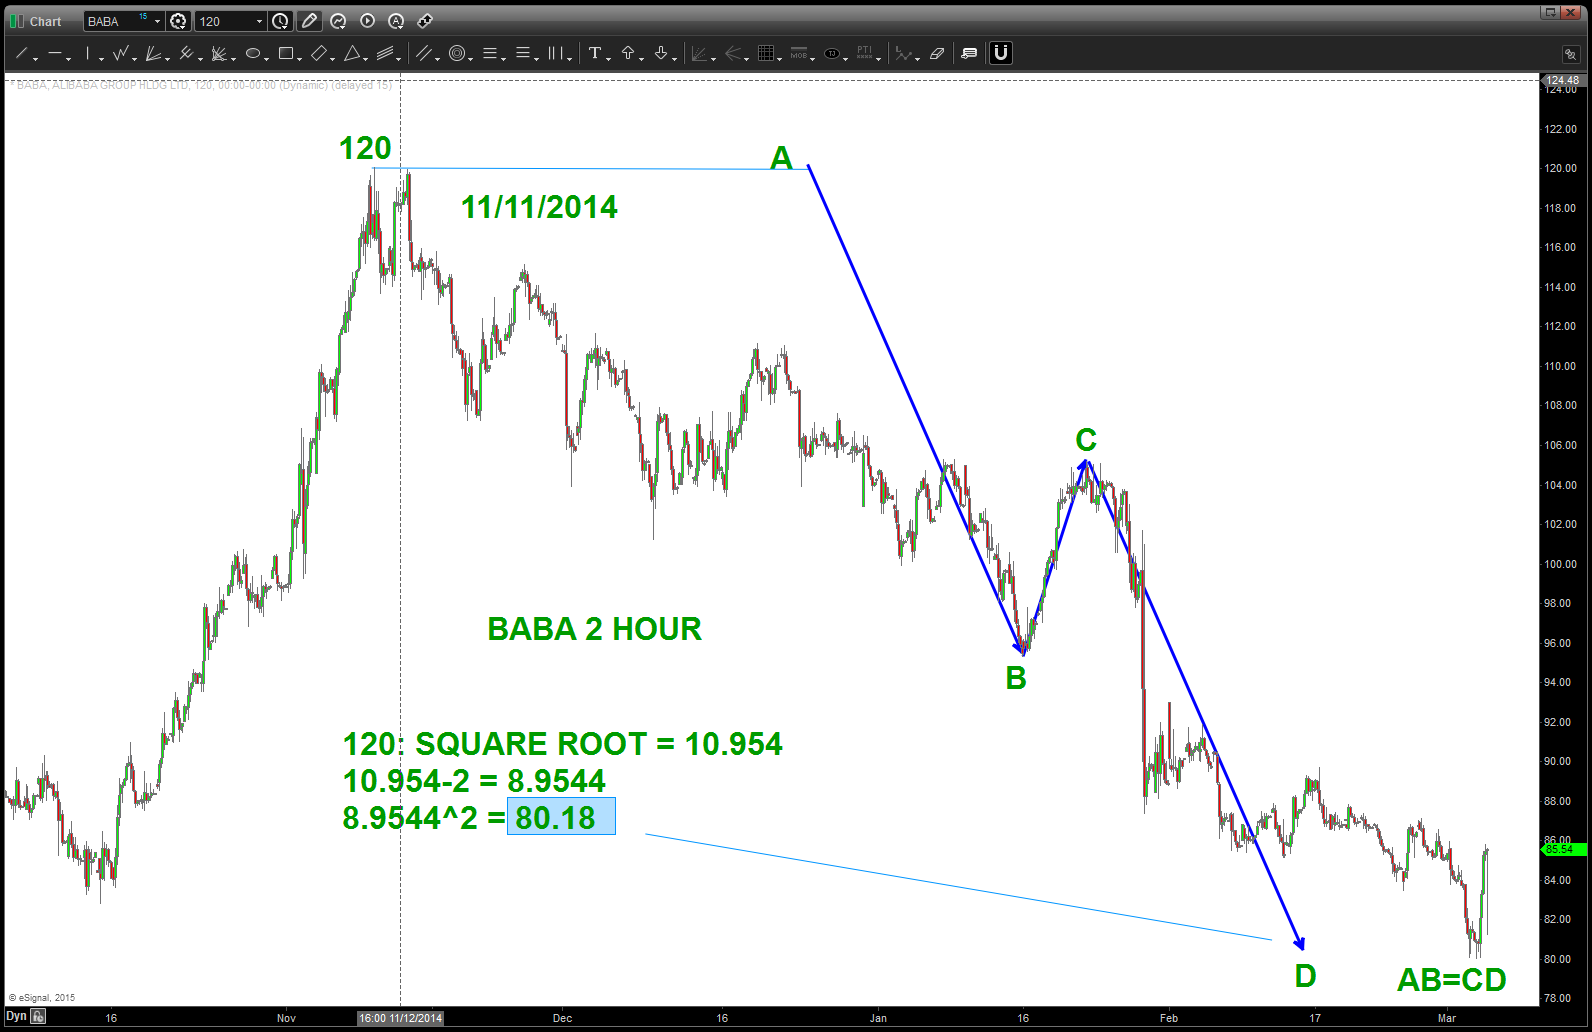
I took a quick look at $BABA and my “eye” is trained to see the classic AB=CD/thunderbolt pattern and I labeled it. Then I ALWAYS check out the square root of the high and … well take a look at the chart.
Square root targets ON TOP OF “normal” projection techniques and/or “typical” Fibonacci retracement levels are “wonders to behold”
Enjoy …
One last … in order to travel one full cycle around the Square of Nine you do the following:
- Take square root of a number
- SUBTRACT or ADD 2 (this pushes you around the wheel)
- Resquare that number .. you have now completed one full rotation around the number.
- If you want you can do Square Root +/- 1.618 …
- And, since you’ve read this far the Square of Nine is a square root calculator but it’s also a planetary projection technique. TILT … well folks that’s what the Great Pyramids did – to a major degree. So, take the square root of a number and then PROJECT a planet that many DEGREES and watch what happens. Just saying …
Anyway – here’s the chart.
- where are the moving averages, oscillators, bollinger bands, clouds and blahh blahh ….?
Latest on @seeitmarket where $GRPO might bounce
Posted on March 3, 2015 Leave a Comment
@seeitmarket for Jan and Feb
Posted on February 27, 2015 Leave a Comment
loyal readers … have been enjoying working w/ Andy at @seeitmarket.
http://www.seeitmarket.com/author/james-bartelloni/
some great stuff going on over there ….
will update the bond picture this weekend.
Bart
Euro vs Great British Pound
Posted on February 21, 2015 Leave a Comment
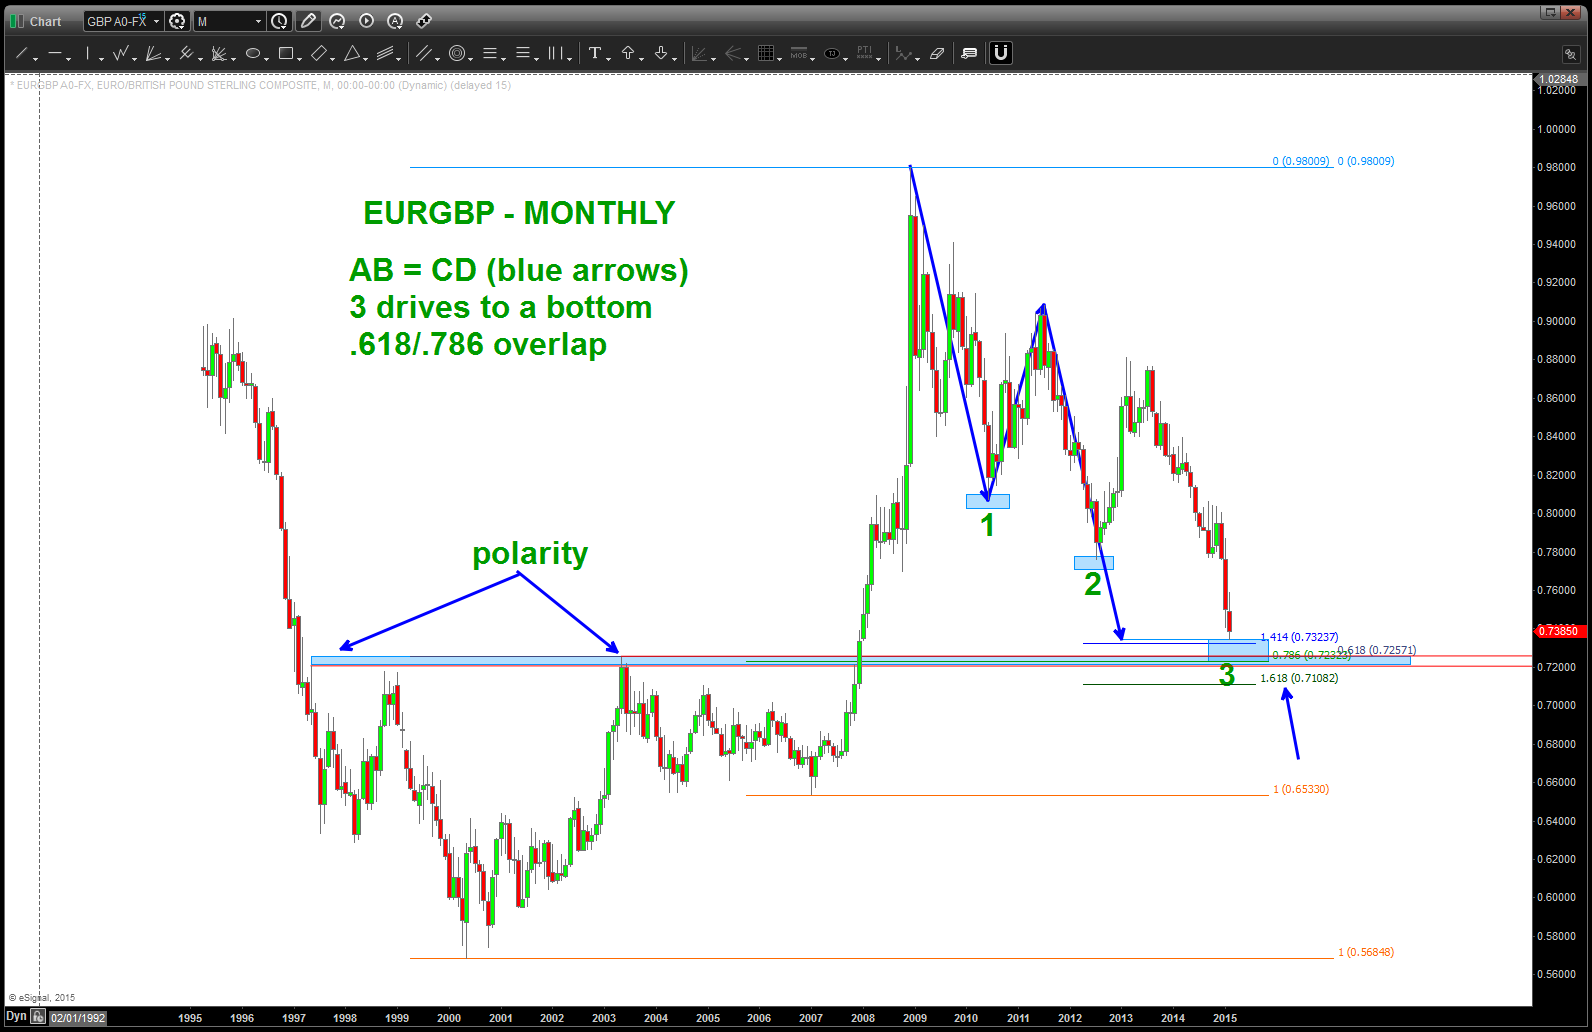
great mathematical and harmonic set up here ….
see the chart.
also, if you like Elliott wave corrective patterns sure looks like a a-b-c — X — a-b-c is finishing.
watch for strength.
the bladder of the fish and, well, Soybeans
Posted on February 13, 2015 Leave a Comment
had a “google hangout” w/ JC today and we zipped thru, easily, 6 different asset classes from stocks, commodities, single stocks and currencies in roughly 10 minutes.
“check this out – boom boom boom” and “blah blah blah” – and we were done.
question .. how long do you think it would take non-chartists? hours …? just saying.
anyway, we took at look at long term soybeans and what we need to focus on is the POWER of a MEASURED MOVE on a long term chart. in the chart below you’ll see blue and orange arrows. they represent the MAXIMUM correction of Soybeans on this 40 year old chart.
folks, when you have a LONG TERM measured move that sits right on a .618 retracement – you have high probability. If you don’t believe me … just look at the chart.
every major correction has either been a blue or orange arrow …
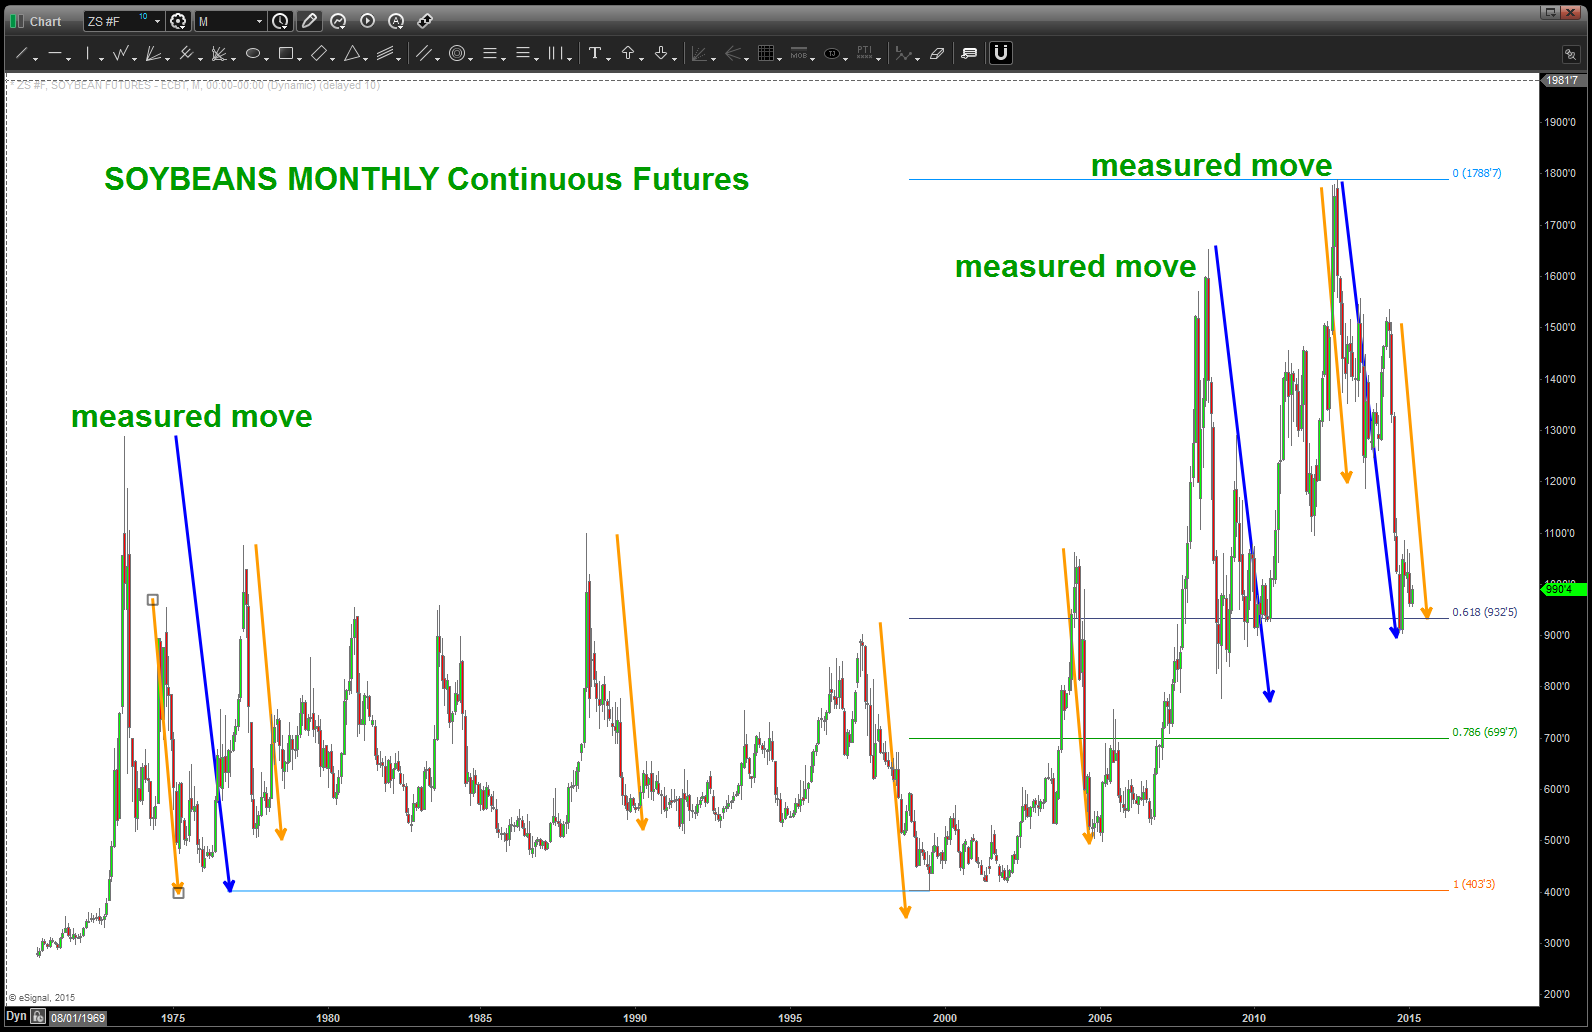
measured moves of Soybeans
W H Y ?
the Vesica Piscis of course (the bladder of the fish)
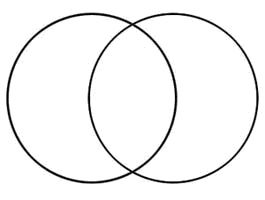
Vesica Pisces
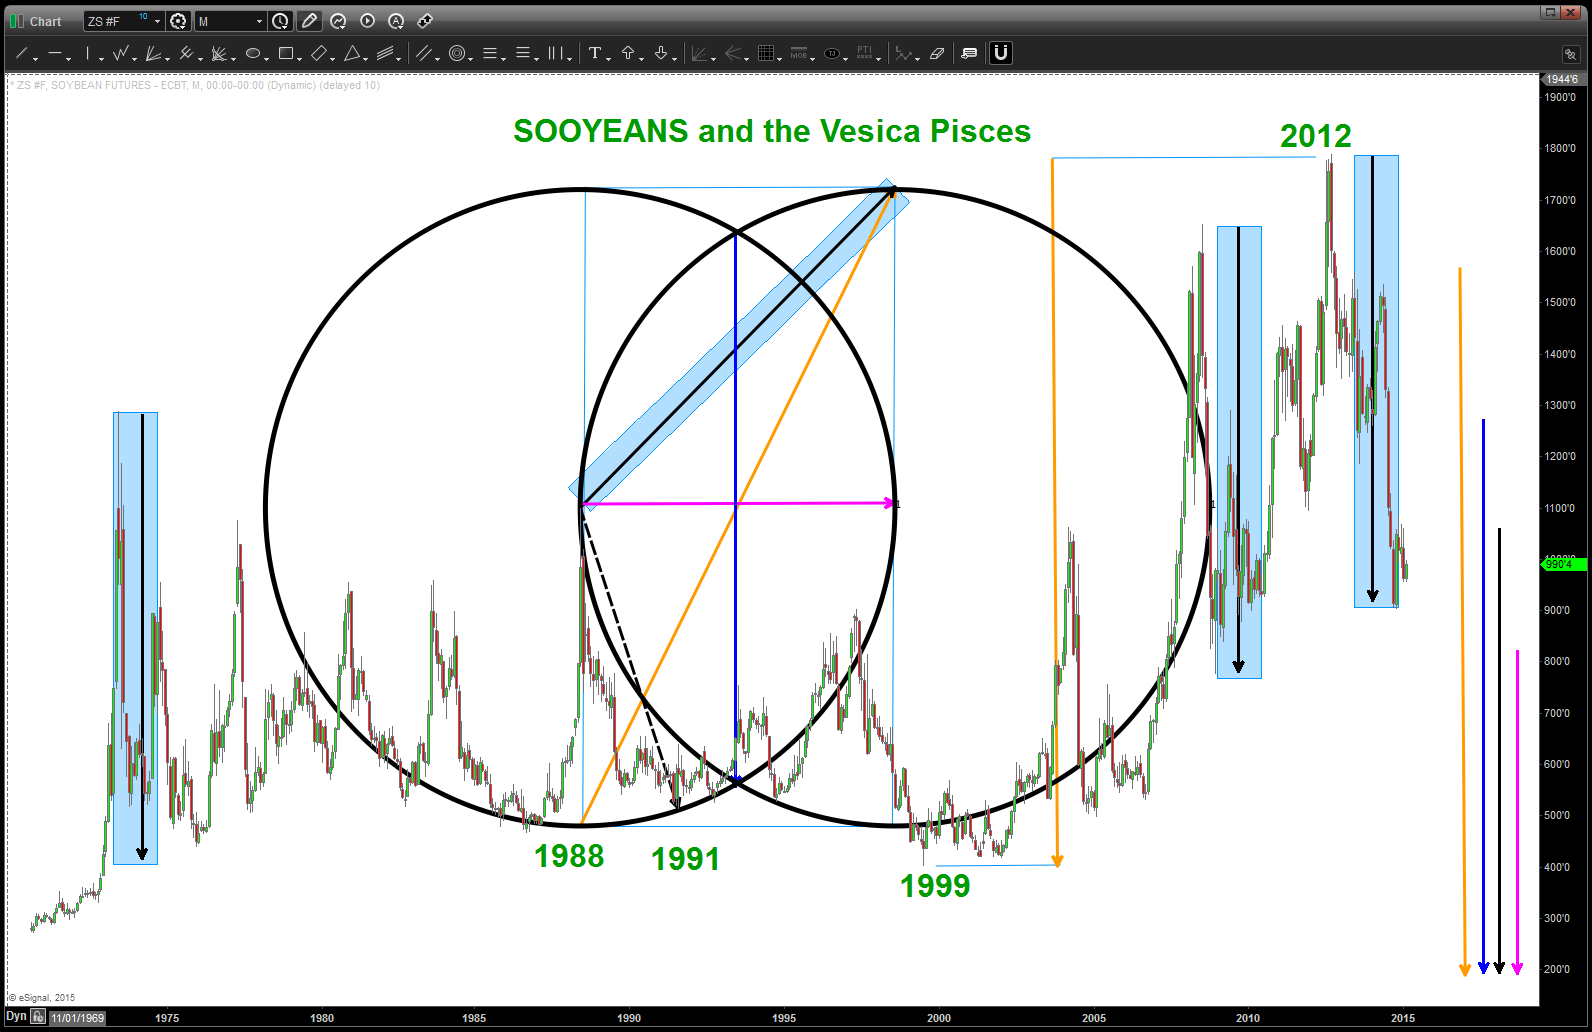
so, look folks, you can believe me or not … but – HONESTLY – I chose the black dashed move to being the construction of the Vesica Pisces for this long term soybean chart. And, because I believe in my edge – and w/ full disclosure I had NEVER done this for Soybeans I constructed the VP from that one corrective move from 1988-1991.
as you can see below I built the picture above and then ….. use sacred geometry to measure the fractals of the square roots of 2,3,4,5 which are represented by pink/black/blue/orange arrows and then transposed them to PRICE in the lower right hand corner.
and, guess what … see that black arrow? THAT is what created the measured moves above … and, additionally, as you can see, I used the orange arrow from the low in 1999 to the EXACT high in 2012.
now, believe it or not, you can use any major swing .. they are all related from a proportions and fractal point of view. I trusted my eye and looked at where this correction was occurring and trusted my “hunch” that this was the right vector to use as the seed.
if you get the chance … use the vectors as time. (hint hint)

the bladder of the fish and the Vesica Pisces
SPOILER ALERT:
The mathematical ratio of the width of the vesica piscis to its height is the square root of 3, or approximately 1.7320508… (since if straight lines are drawn connecting the centers of the two circles with each other and with the two points where the circles intersect, two equilateral triangles join along an edge). The ratios 265:153 = 1.7320261… and 1351:780 = 1.7320513… are two of a series of approximations to this value, each with the property that no better approximation can be obtained with smaller whole numbers.
21:11 Simon Peter went up and drew the net to land, full of large fish, a hundred and fifty-three and although there were so many, the net was not torn.
BIDU follow up
Posted on February 12, 2015 Leave a Comment
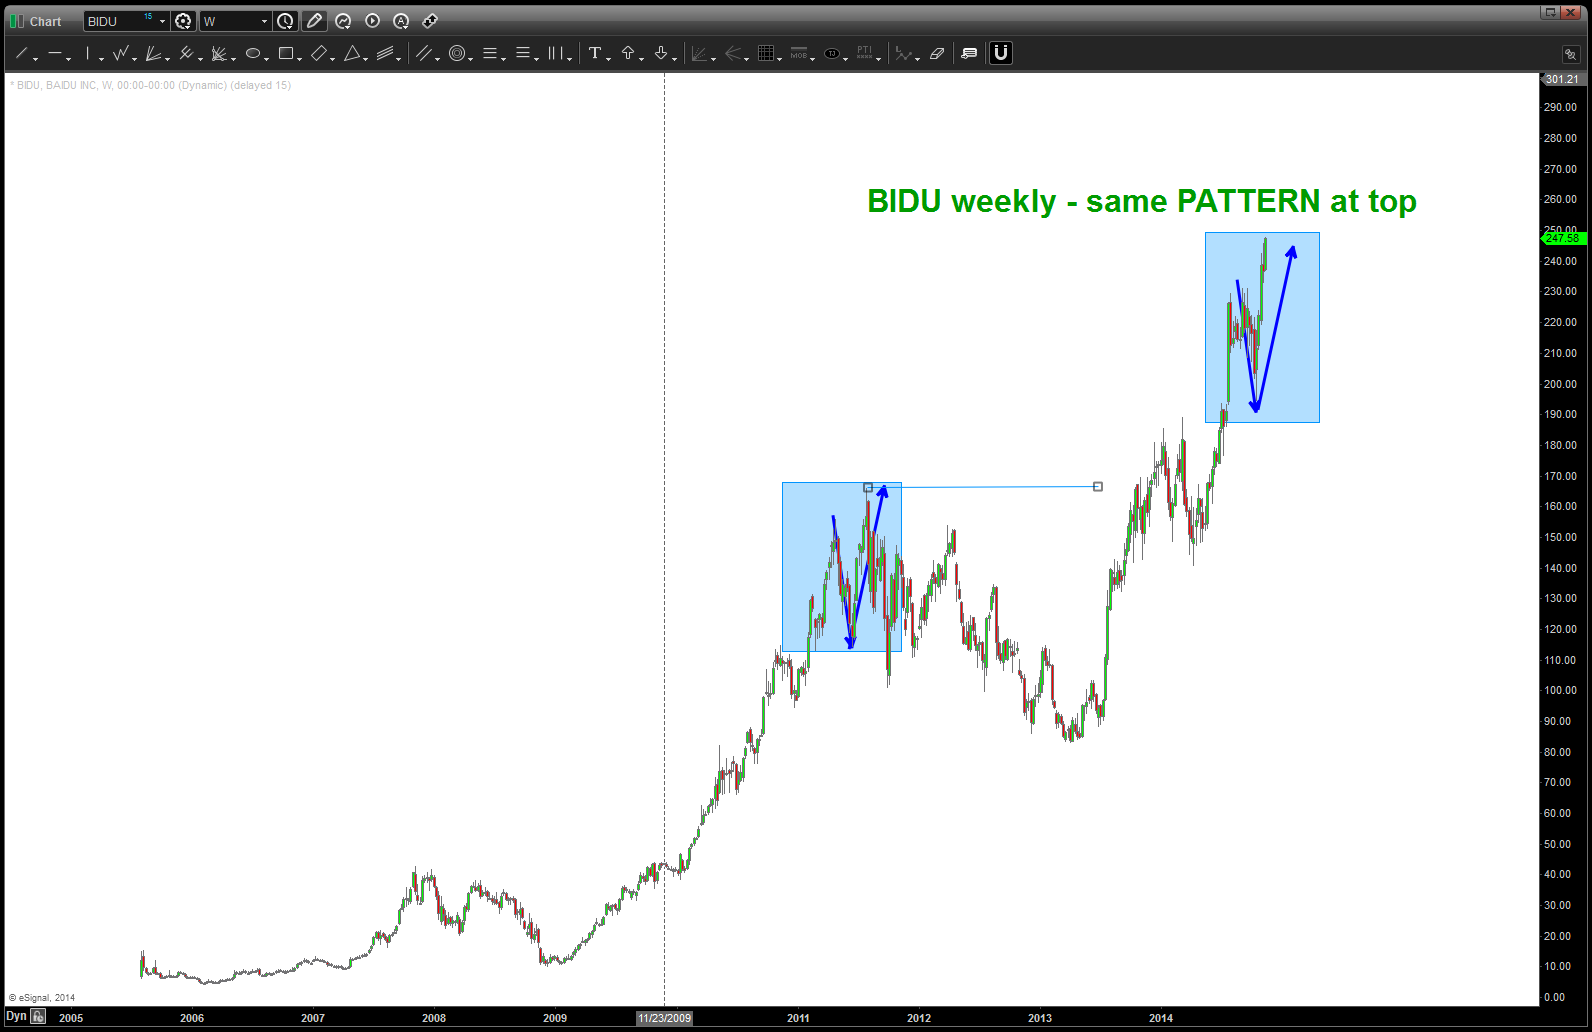
was on some quick travel today and saw the “twitter-verse” (read universe) rocking and rolling about BIDU. I remembered that I had done a post in November 2014 about Twitter and — believe it or not in March 2014 (almost a year ago). In March, as soon as we made the new high from July 2011 I was starting to look for a 5th wave. As you can see below, in March that was too early. Now, it did hit the target and back off roughly 30% but, ultimately, it kept plugging upward.
So, back to the drawing board, and per below came up w/ 250 as the next target. That one has held – for now – and just looked at the “after market” and she sold off roughly 10% and is trading at 195 bucks.
The “targets” that are derived are pretty good … the waves are pretty good but folks, it’s all probability. the face that we are down to 195 a year later doesn’t surprise me and the fact that 250 held (to the cent) per the work below doesn’t surprise me. And, one last, guess what? The fact that 250 got rolled over to the upside wouldn’t have surprise me either …
PICK your edge … fundamentals, basic technical analysis using moving average and oscillator stuff, flip a coin, music … it doesn’t matter. All your edge is going to give you is a higher probability of something happening than not happening … So, if it works, great. If it doesn’t, great.
Just decide how much your going to lose and that’s all that matters …
Rock on dudes and dudettes!
Bart
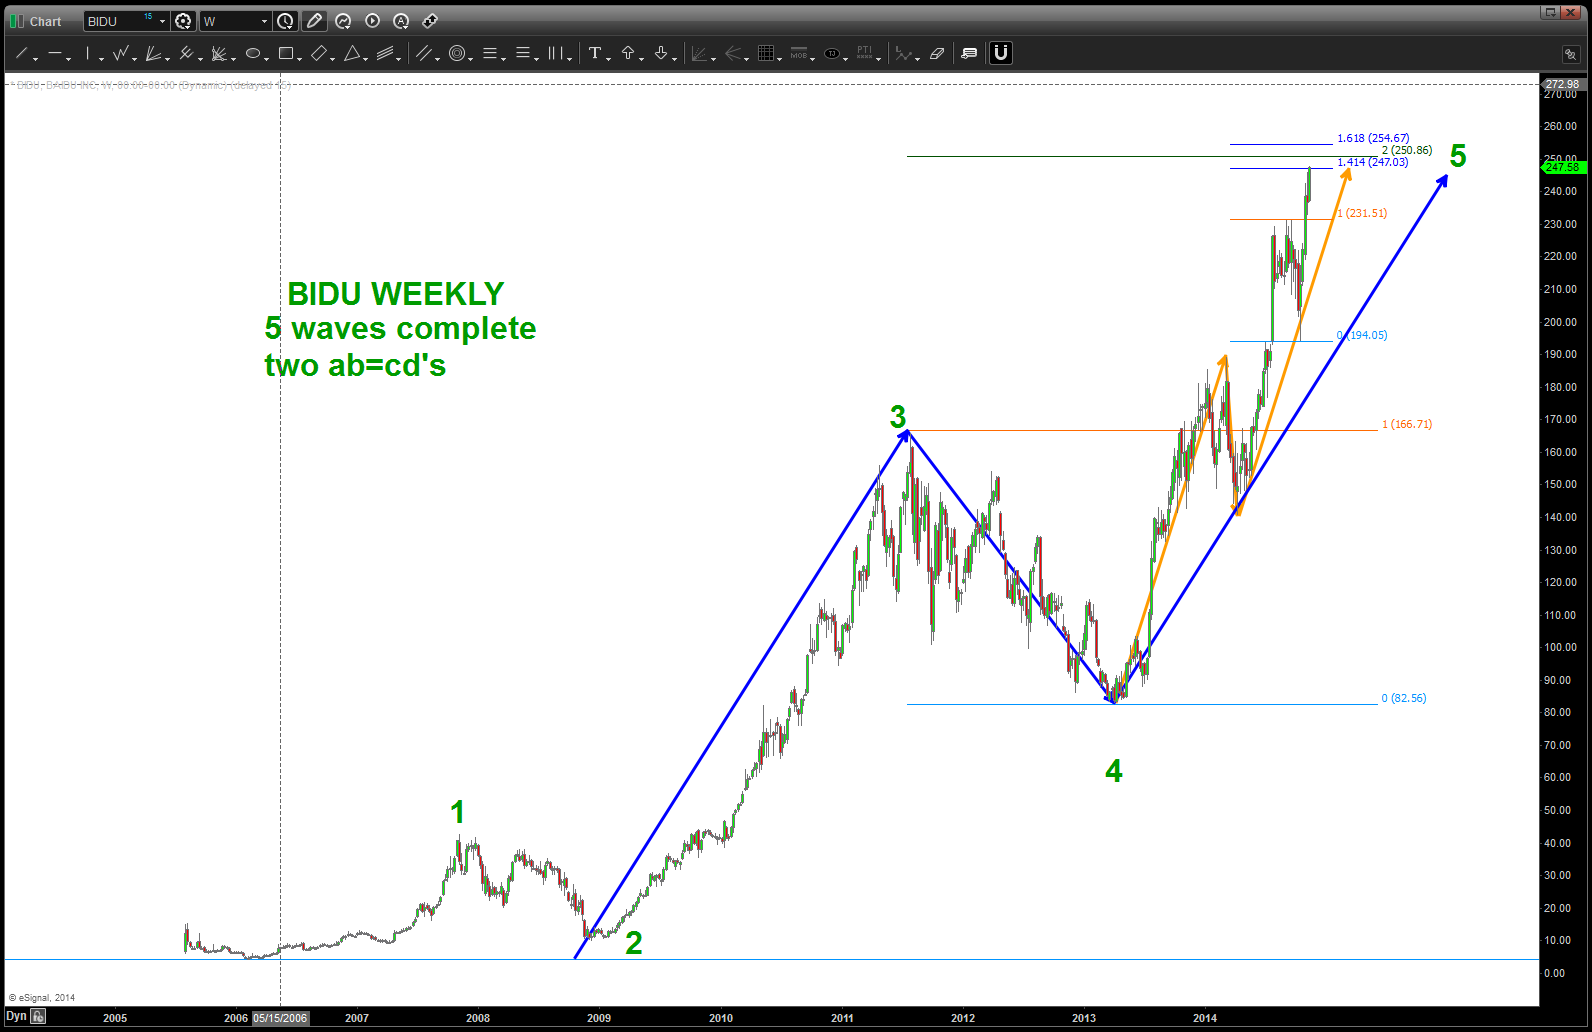
OBTW – check this out.
250 high
Square root: 15.81
Square root – 2 = 13.811
(13.811)^2 = 190.75
please take a look at the chart …you can’t make this shit up.
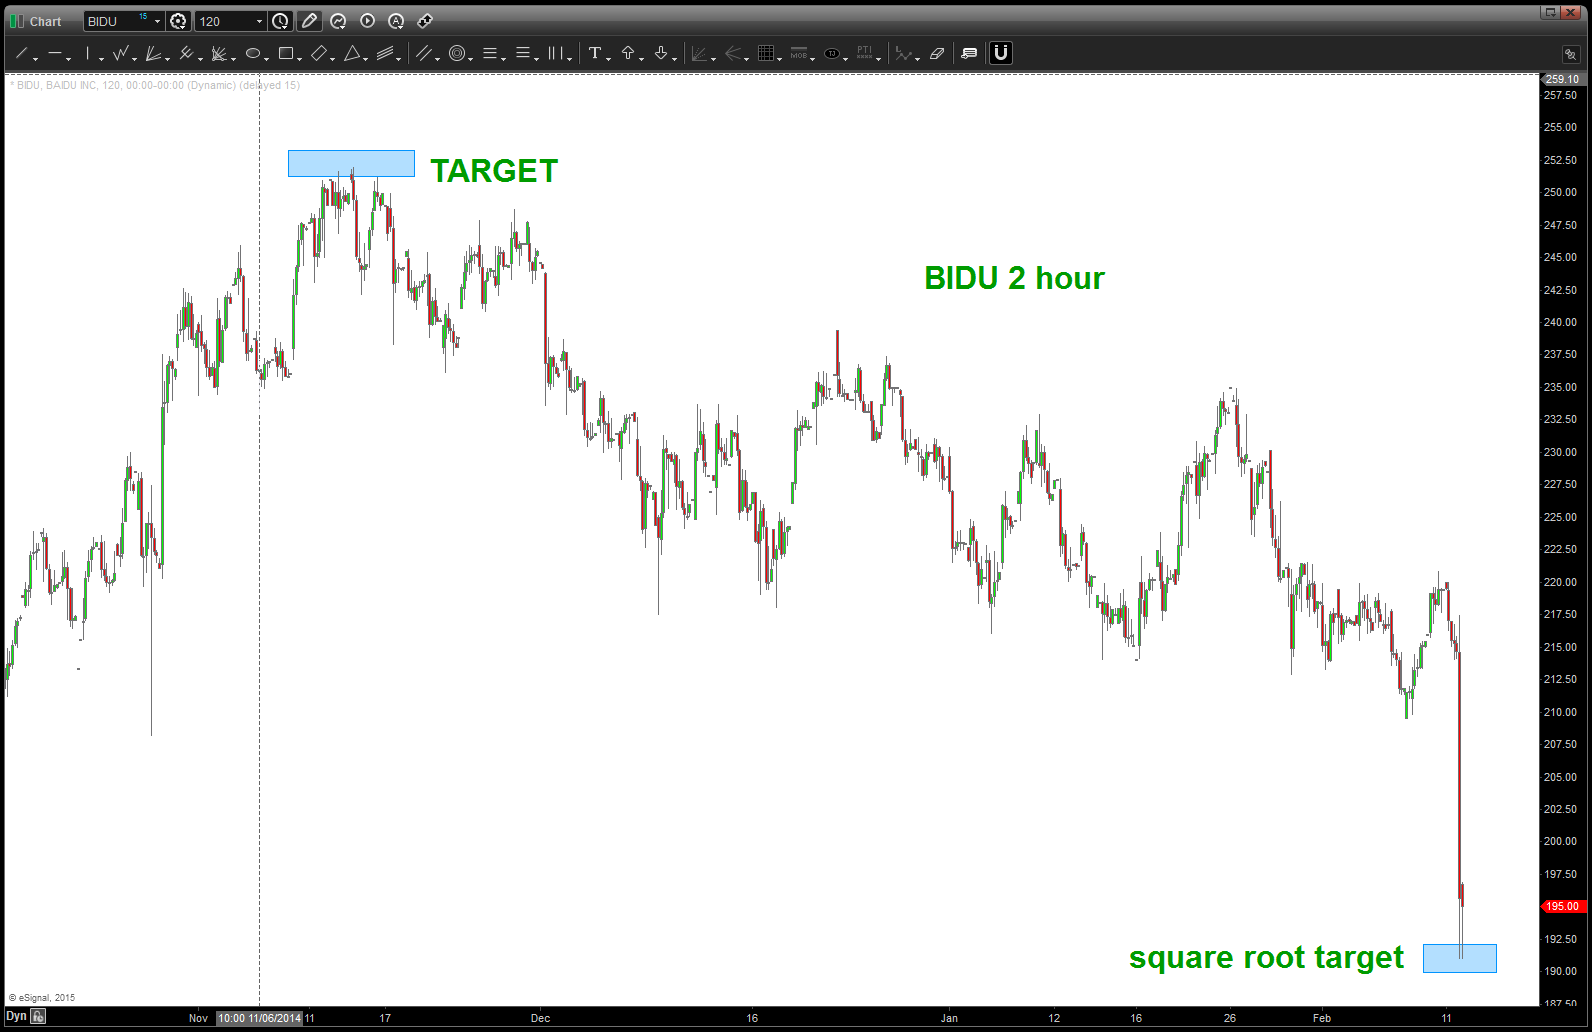
BIDU after hours w/ square root target shown
11/11/2014
was too early on this count, as you can see below. Now, we are approaching some very stiff resistance as shown. another target is 295. all that being said, still believe we are in the 5th wave advance here ….
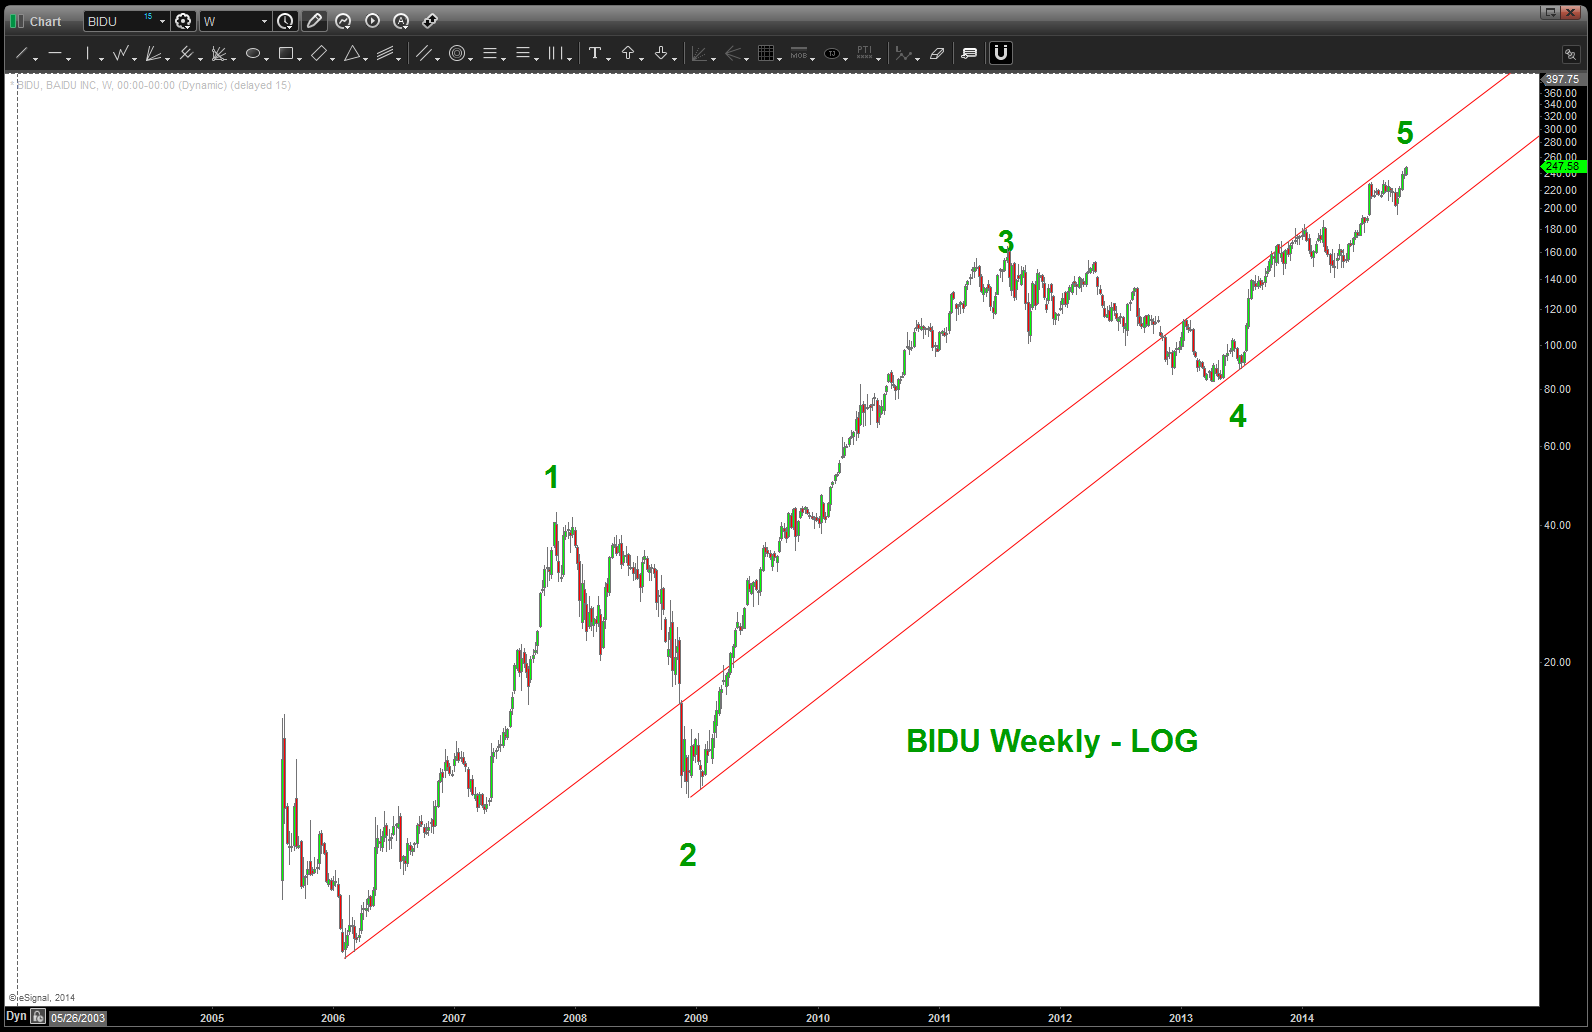
03/31/2014
CLIFF NOTES: very strong probability that a 5 wave advance is complete on BIDU
Here’s the last look at BIDU working on a 188 target for wave 5: https://bartscharts.com/2013/10/21/the-ray-charles-count-on-bidu/
Updated chart:

OK, one more on the 10 year …
Posted on February 9, 2015 Leave a Comment
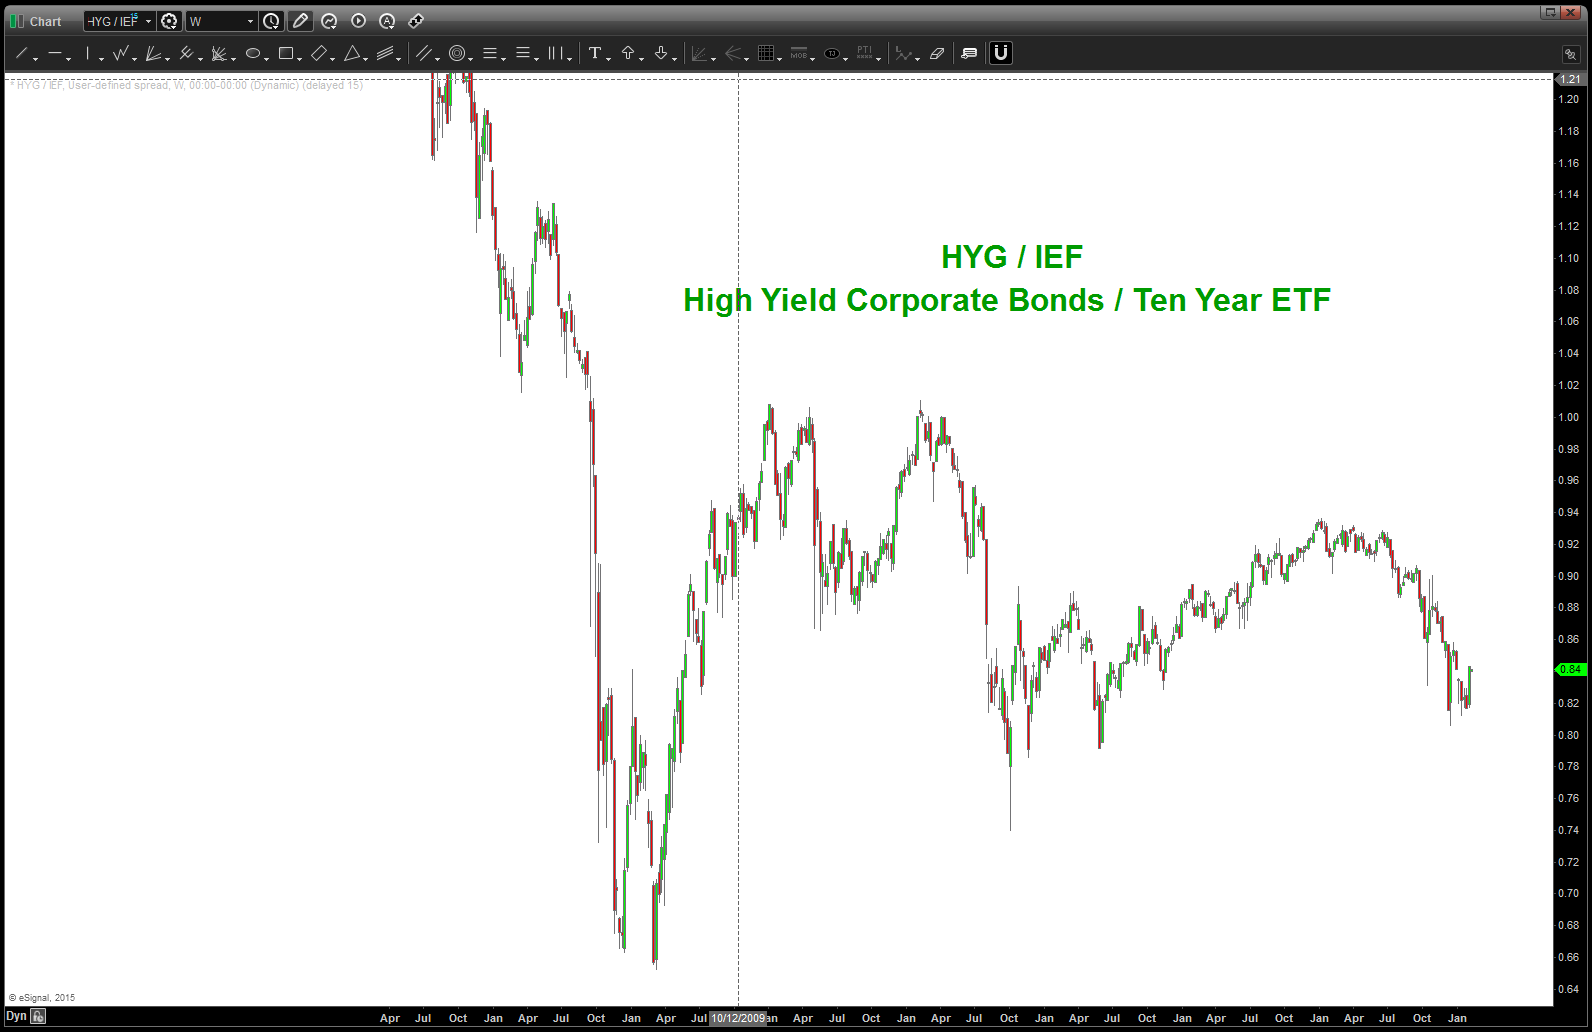
wanted to show you a “quick look” at the ratio of HYG / IEF. HYG is an ETF for Corporate Bonds….when we use ratio analysis we look for one security strengthening over another. In this case, when the ratio goes down the HYG is underperforming the IEF (ten year ETF) and vice versa.
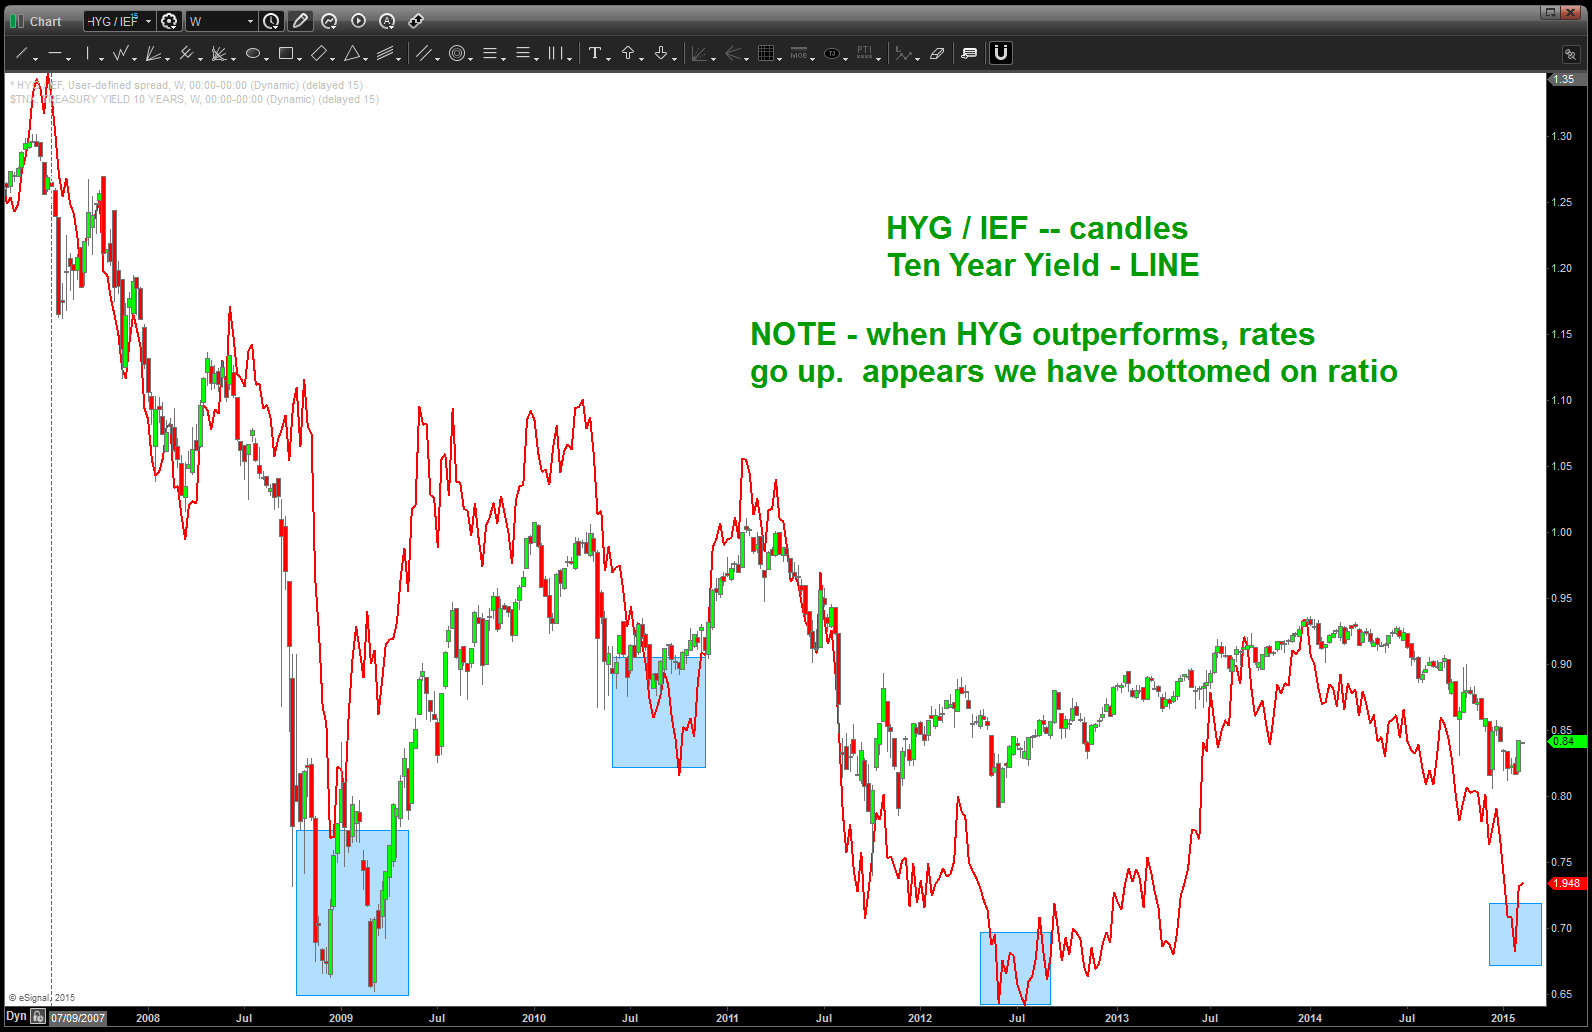
note, the second chart is showing what happens to the 10 year yield when the ratio bottoms … yields go up.
So, if ratio bottomed THEN yields to go higher.
Stay tuned ..