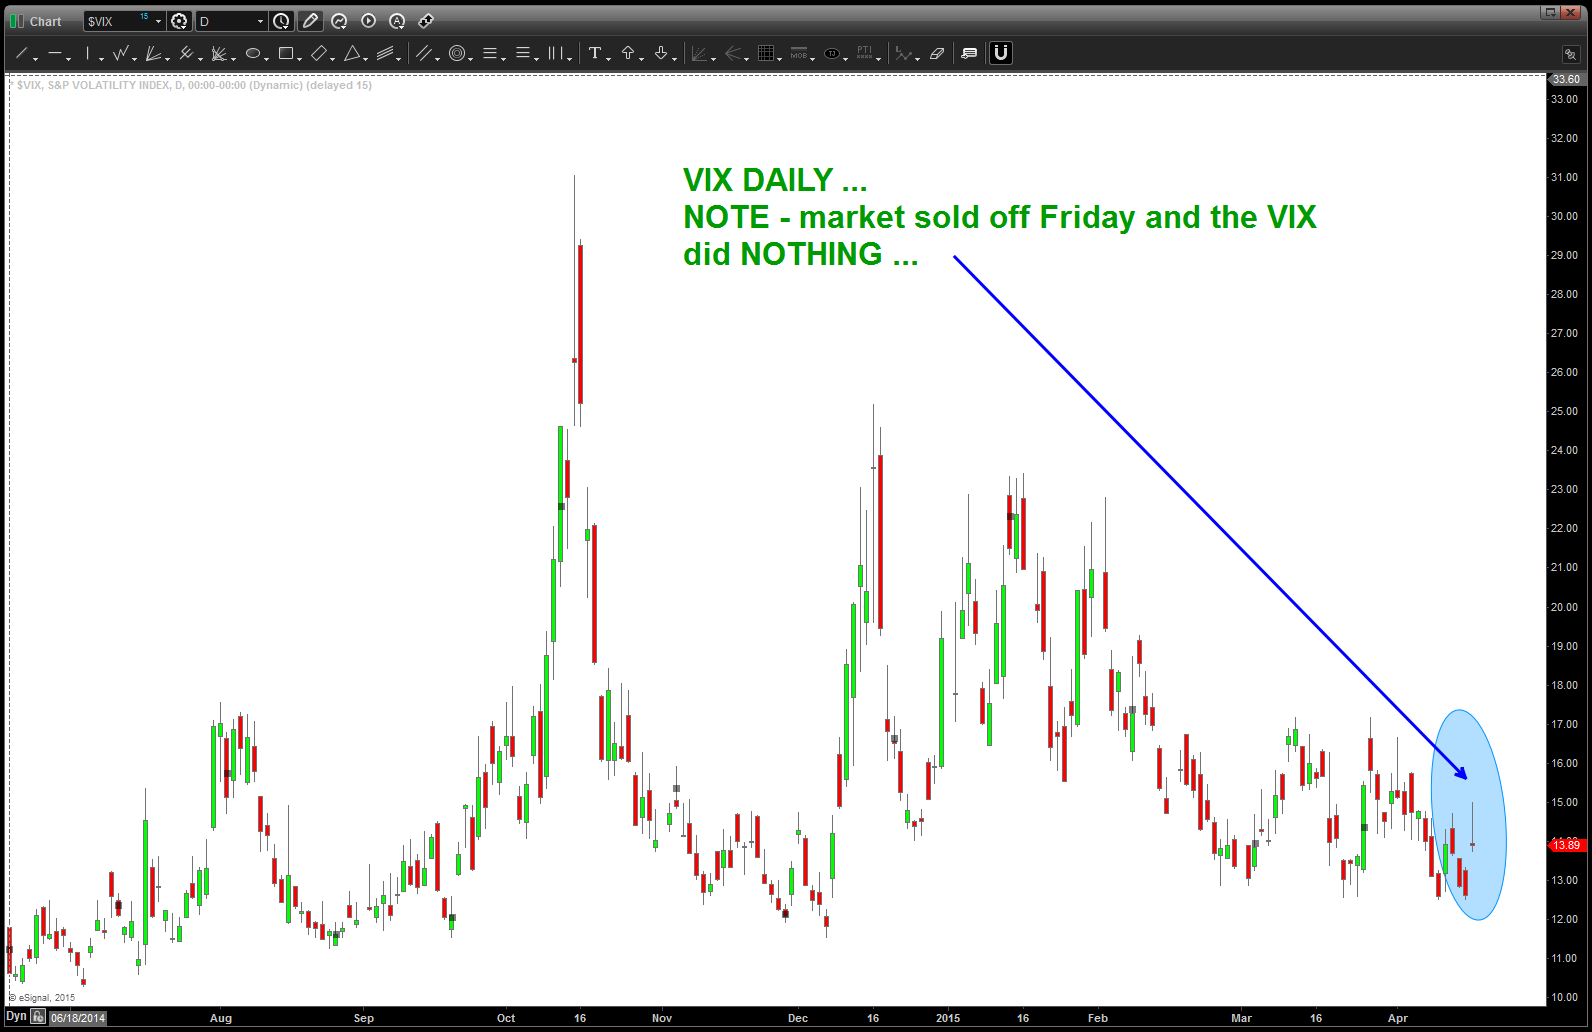
VIX … interesting to say the least
Posted on April 19, 2015 Leave a Comment
Market sold off on Friday and .. the VIX didn’t budge.
Is the market this complacent? Really?
Pound and 30 year trend lines … important? Believe so ….
Posted on April 10, 2015 Leave a Comment
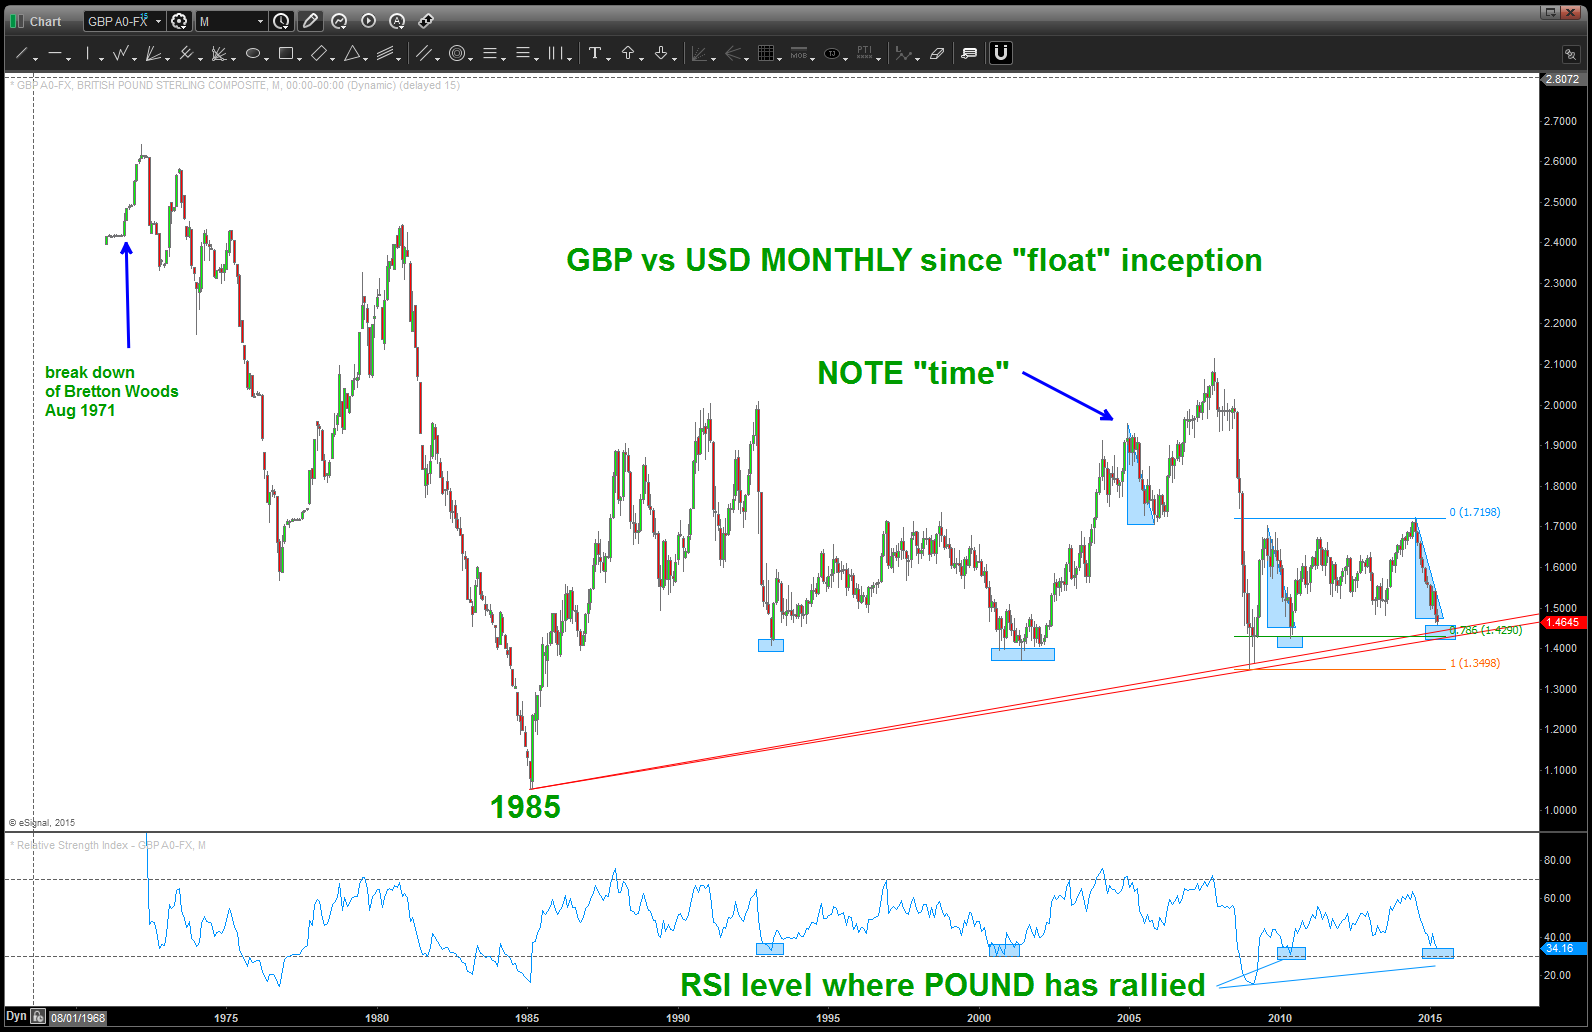
trend line from 30 years ago
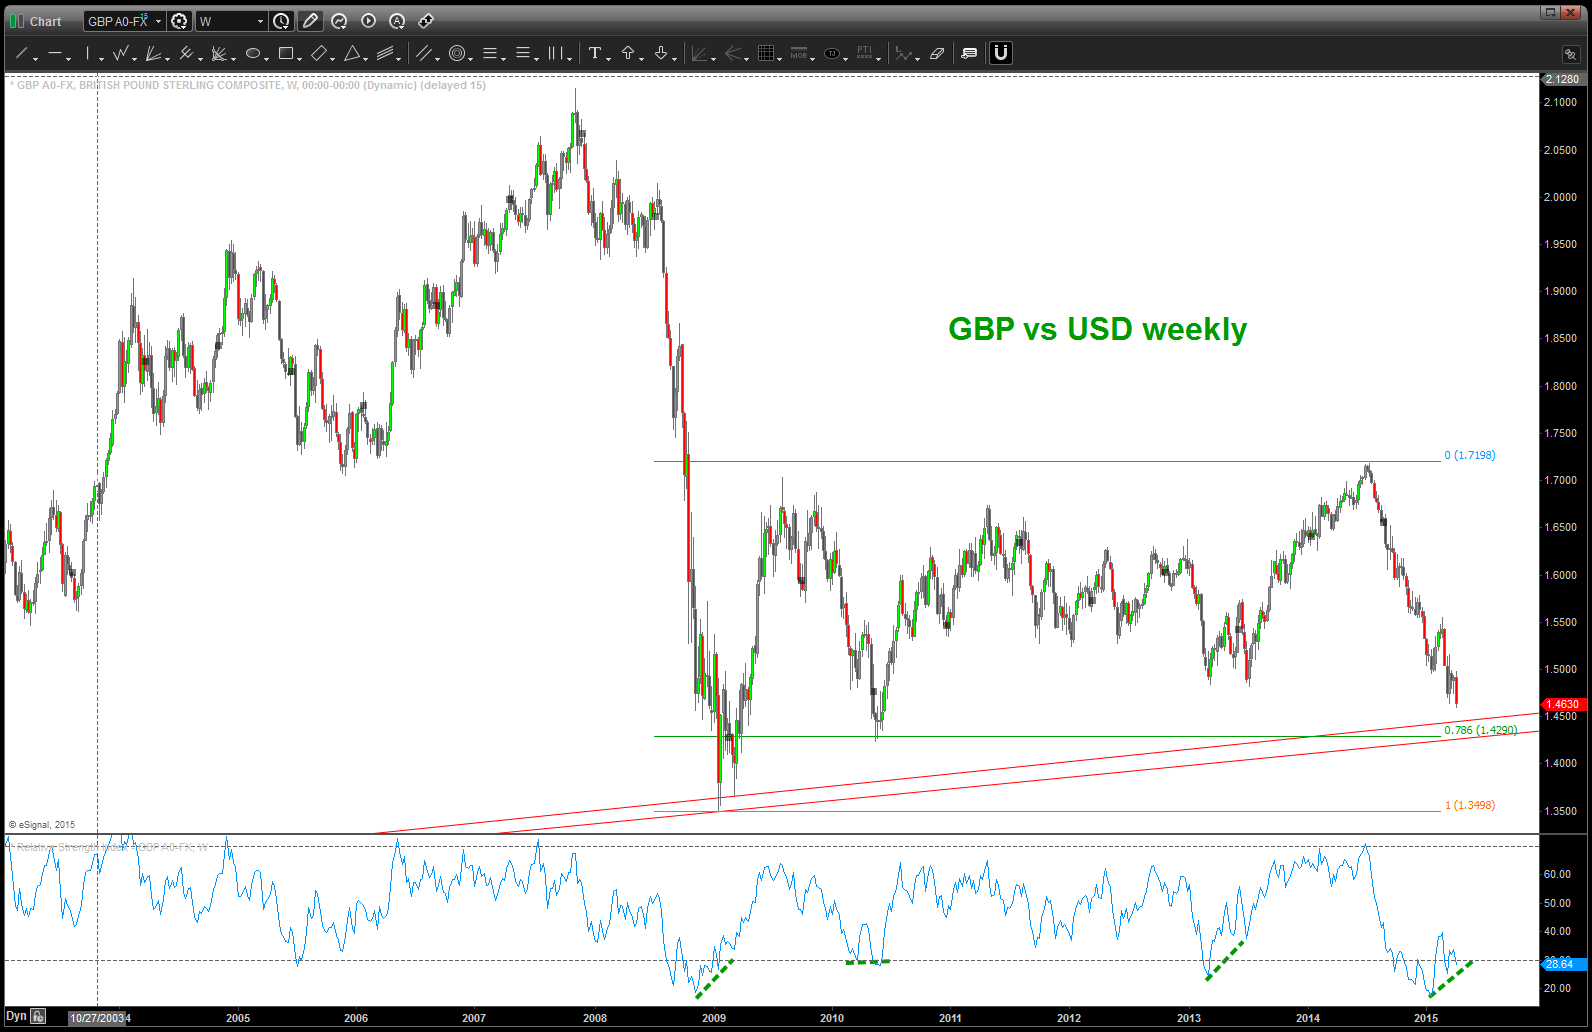
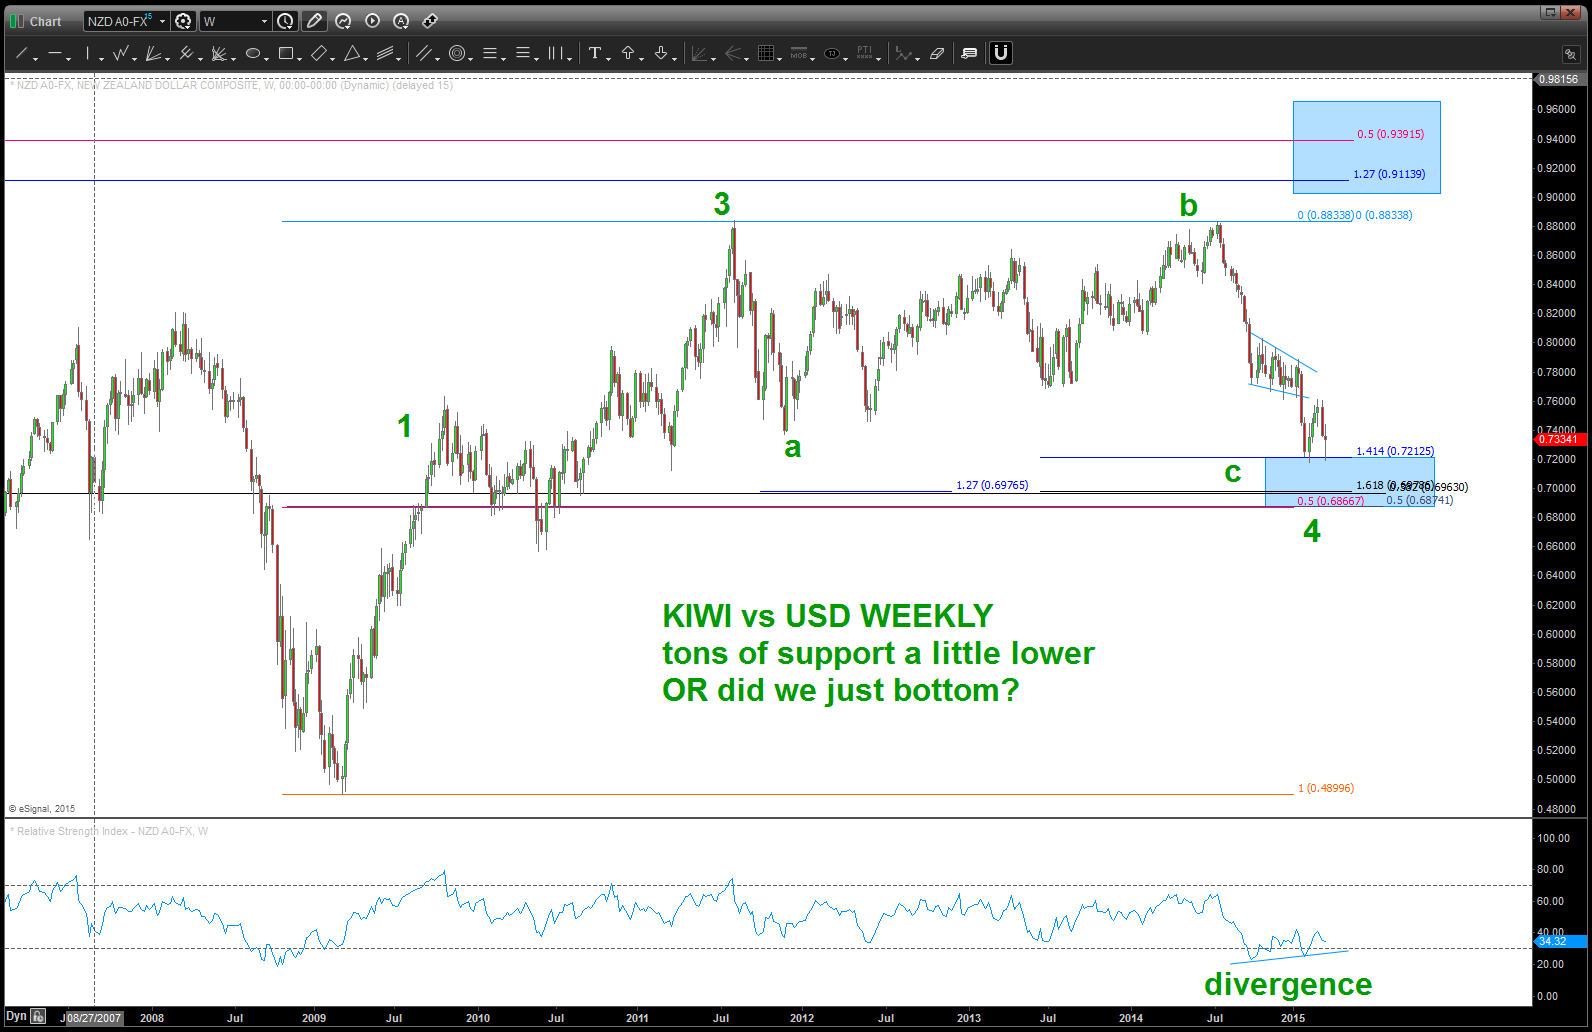
weekly – note the bullish divergence present and the 30 year trend lines coming into play

TIME and PRICE ! Looks like end of April for the PATTERN to complete
FXI .. find the pattern, define the risk, let er’ rip
Posted on April 8, 2015 Leave a Comment
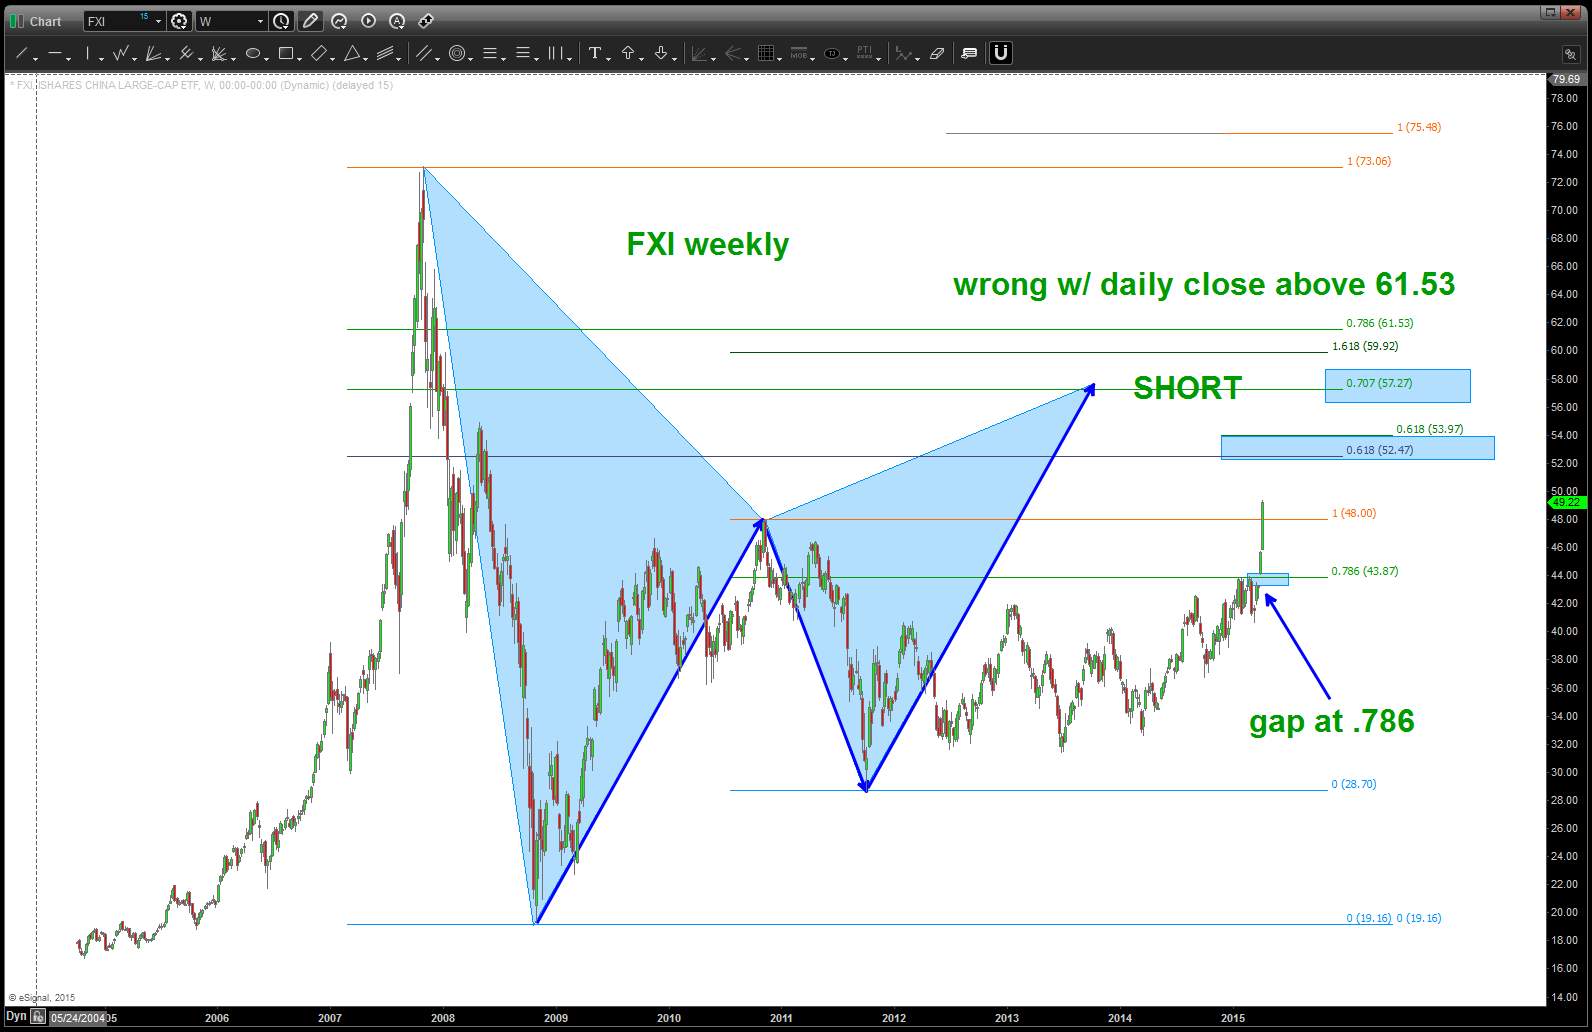
FXI pattern …
Social Media and the Anatomy of a pattern …
Posted on April 8, 2015 Leave a Comment
folks, have been working Social Media (SOCL) here: https://bartscharts.com/2014/08/29/social-media-strategy-socl/
here’s an update to the Social Media landscape and the SELL pattern present.
IF looking to sell, the levels are defined.
IF we blow thru the PATTERN to the upside then we have some running UP to go …
follow the logic in the bottom right to see how the pattern is created.
thanks for reading and let me know if you have any questions.
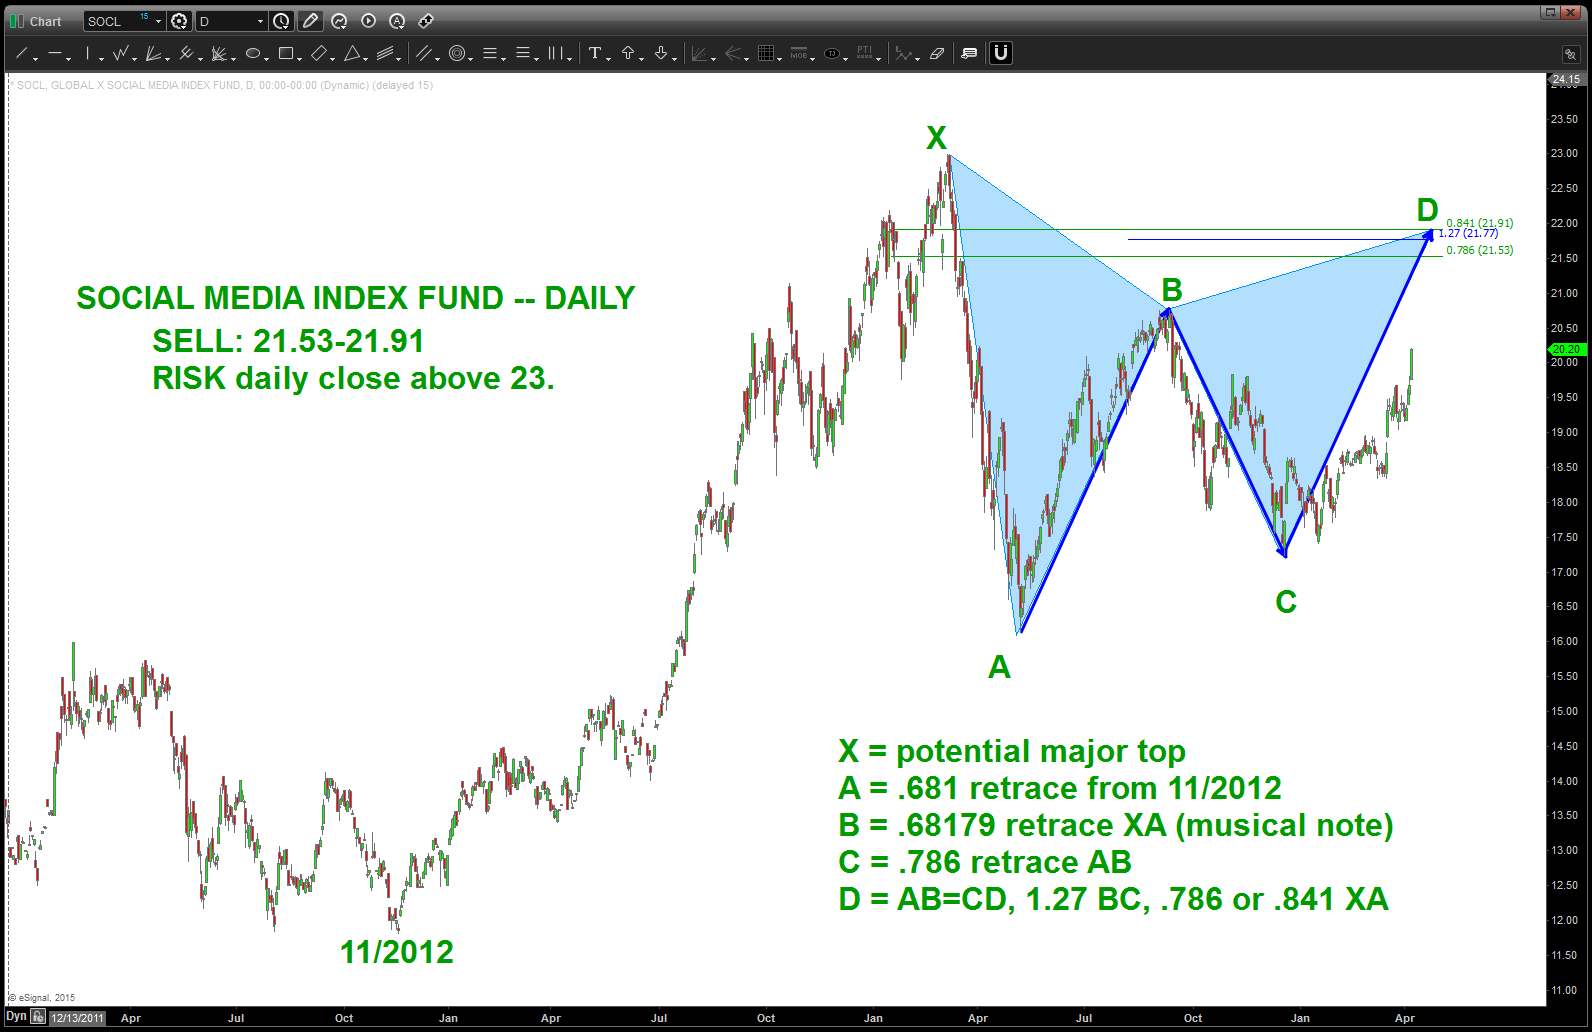
SOCL sell pattern and how it’s formed
My post on @seeitmarket regarding the DAX
Posted on April 6, 2015 Leave a Comment
very interesting developments of late … enjoy.
Bart
Parabolic Moves have NEVER ended well …
Posted on March 30, 2015 1 Comment
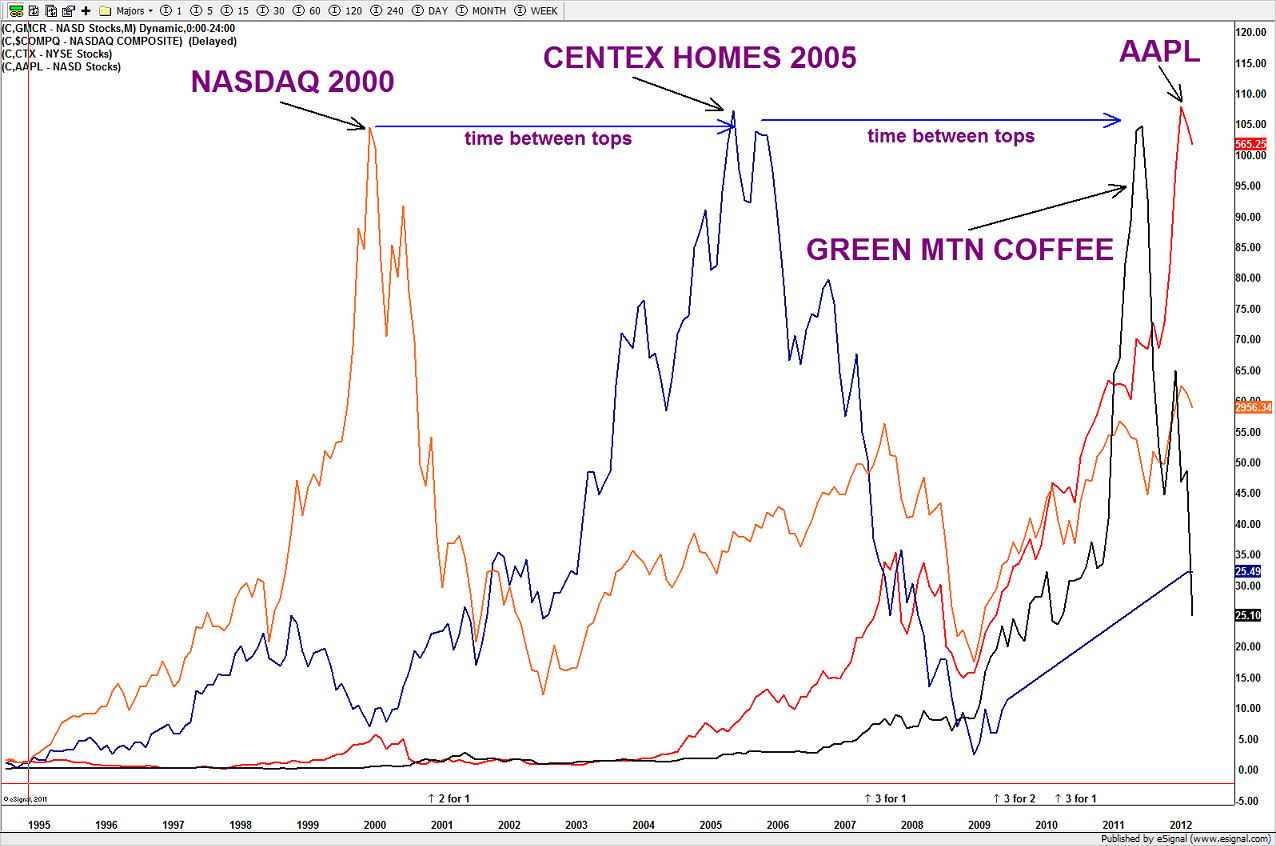
Below you’ll find charts showing the parabolic blow-off of the NASDAQ, CTX (housing), LEH (banking/investments), JEC (oil services), Green Mountain Coffee (GMCR) and Apple (right before it lost 50% of it’s price – remember?)
The reason I post these charts is because when I look at IBB, NKE, XLV, etc I see the SAME PATTERN.
Again, Parabolic Advances have NEVER ended well … 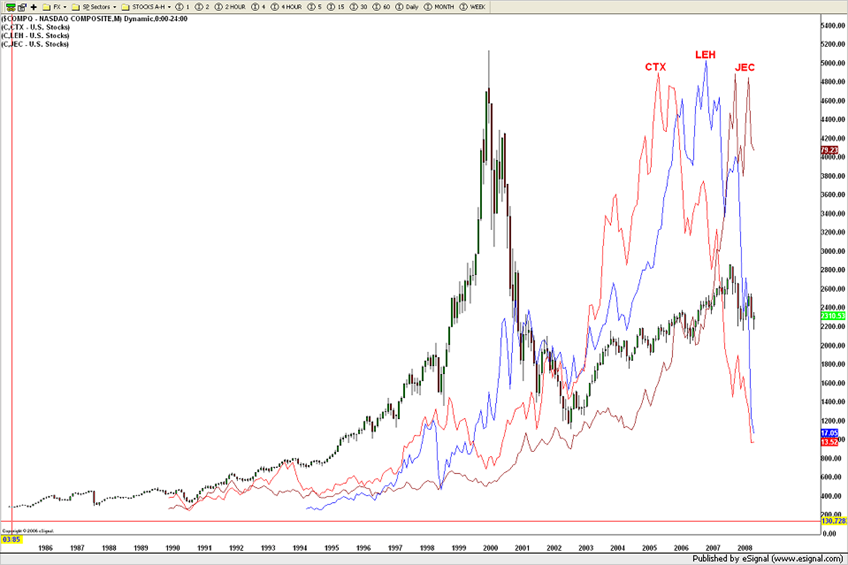
here’s the physics:
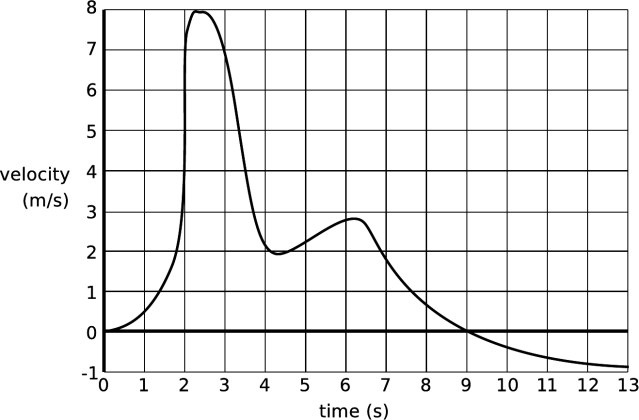
once velocity hit 8 m/s and around 2.5 seconds into it IT COULD NOT GO ANY HIGHER AND THE VELOCITY COLLAPSED. Folks, at a certain point the lack of liquidity and the parabolic nature of anything will prove Sir Isaac Newton correct …
so, perhaps we are at 3-4/ms at time 3 … but soon, in the near future these stocks/indices/interest rates will hit 8 m/s and 2.5 seconds and then the drop will be vicious.
the beauty of charts …
Posted on March 17, 2015 2 Comments
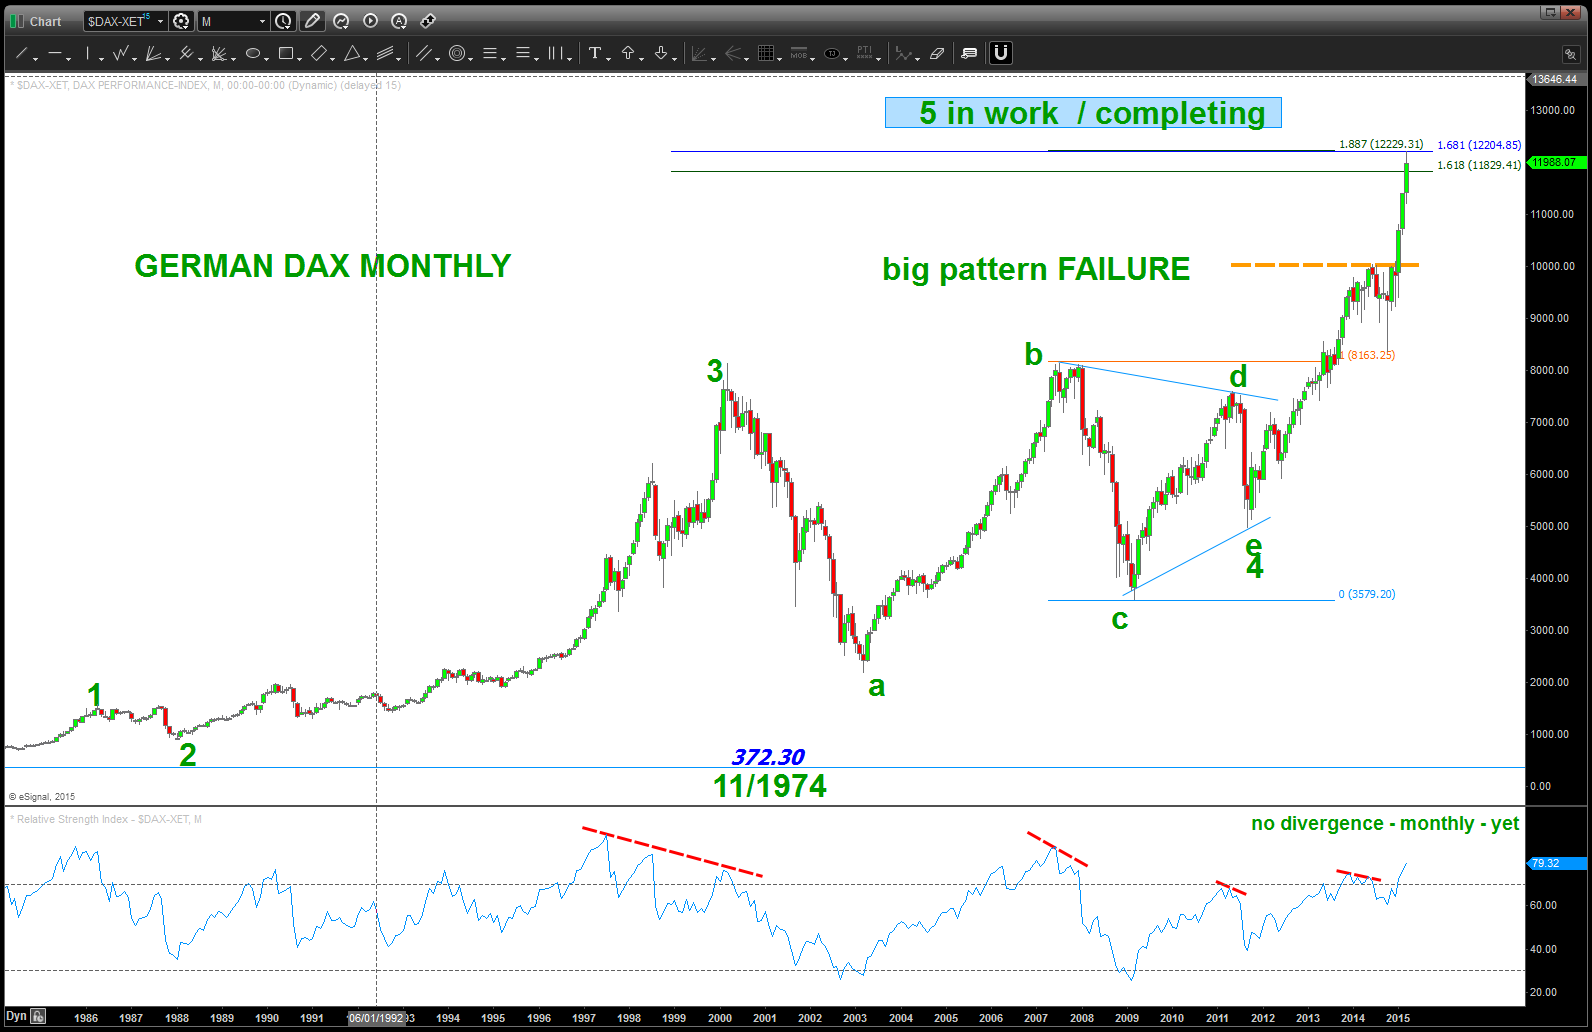
fundamentally, the Eurozone is a mess. We know that but … who cares as the DAX has exploded.
today we hit the 1.68179 and 1.8877 (musical notes based on the equal octave scale of music) extension targets and it’s selling off nicely.
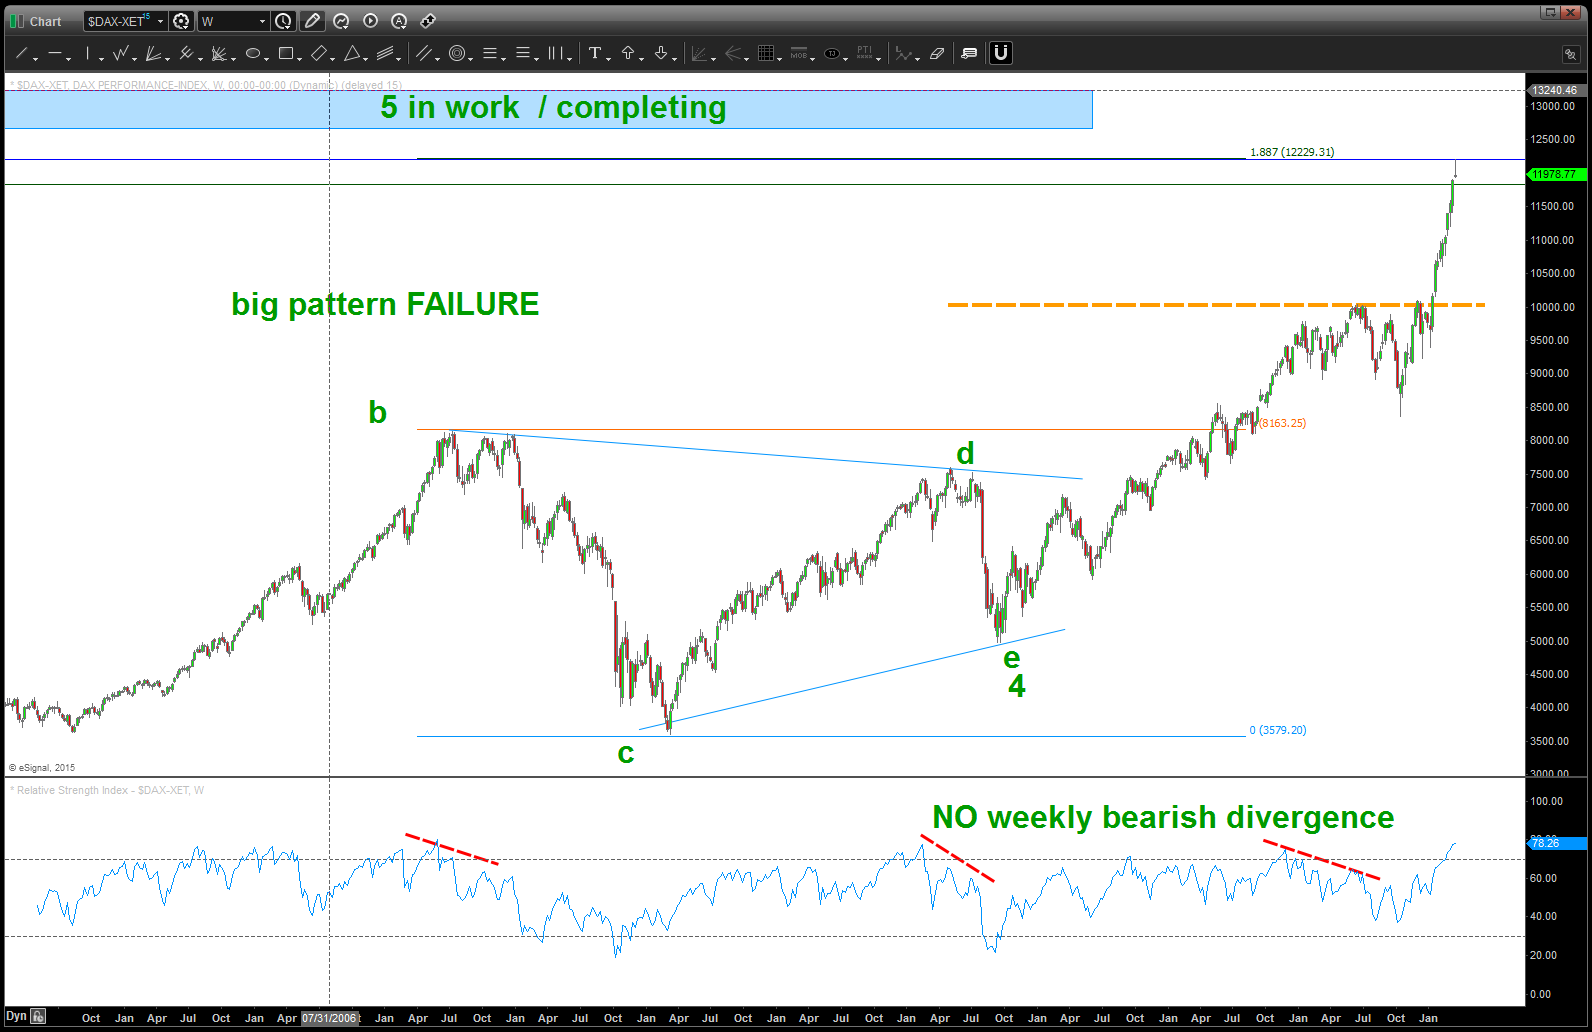
not seeing any bearish divergence on Monthly, Weekly, Daily and…
also want us to look at the ratio analysis of the DAX/SPX and we can see it’s testing – WITH THRUST – a 30 year resistance line of relative strength.
THIS ONE AREA WILL TELL US IF THE BAND PLAYS ON – OR NOT W/ THE GERMAN DAX. When I look at the monthly it looks like it is JUST STARTING to take off parabolically. Be patient w/ this one and enjoy the show ….
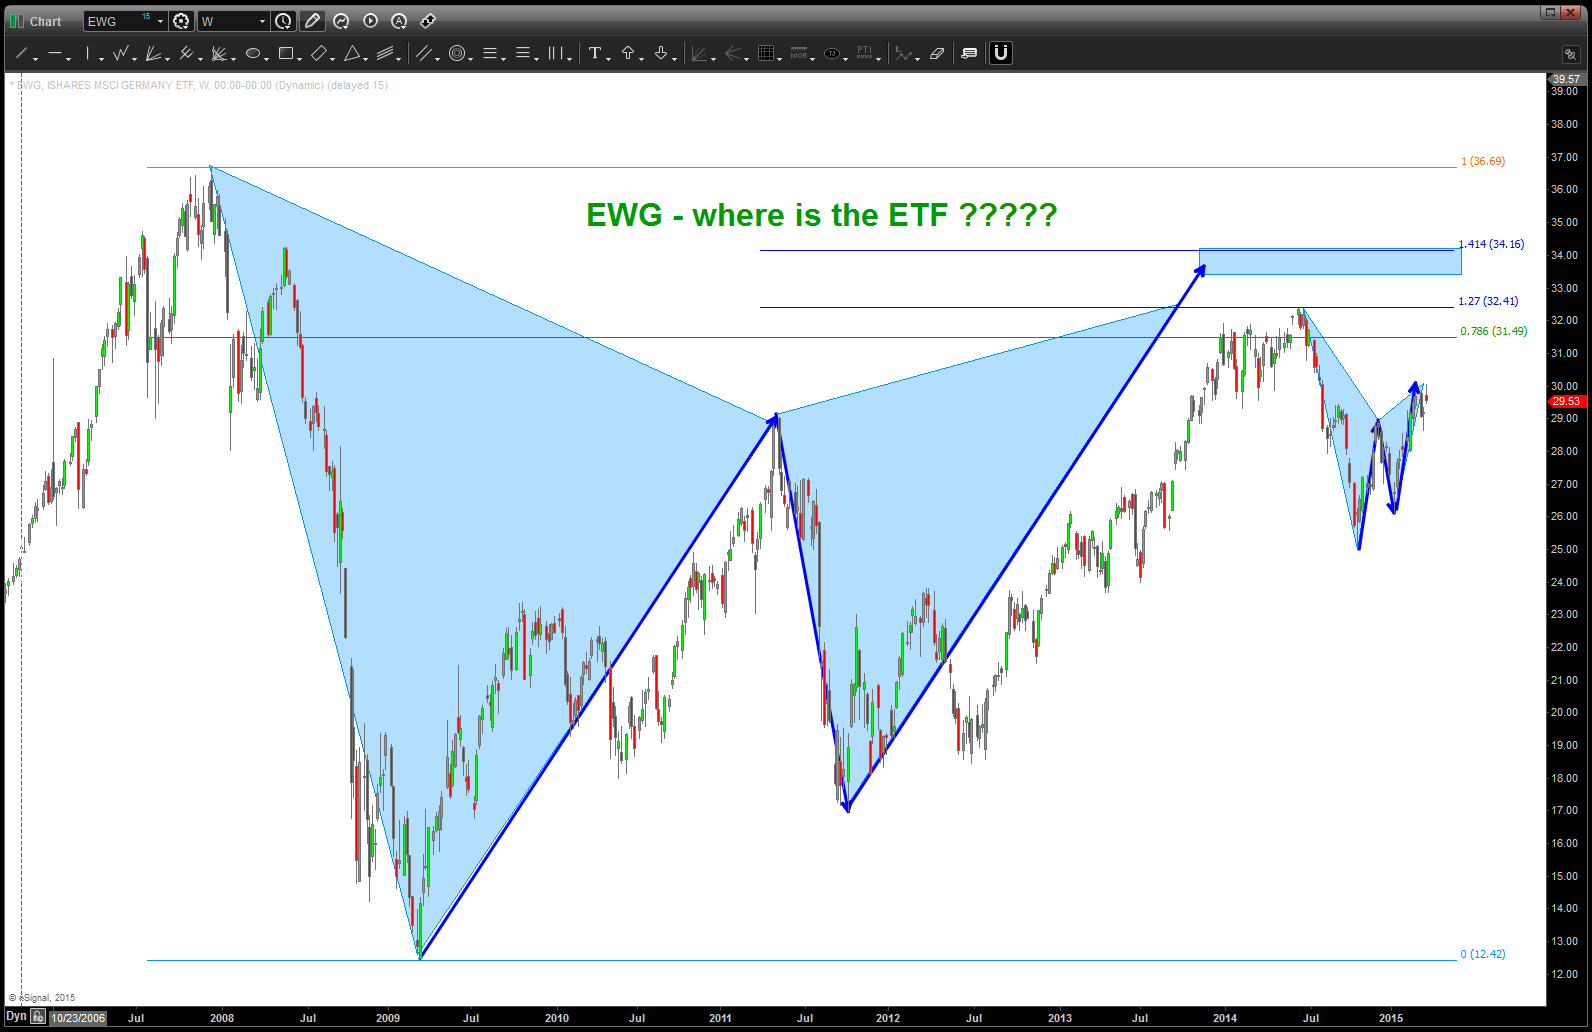
EWG … where’s the ETF? it hasn’t budged w/ this parabolic move in the DAX ….?
It’s held for now so be patient and look/ with “signal reversal candles” to go long or short!
this is going to be quite a show!
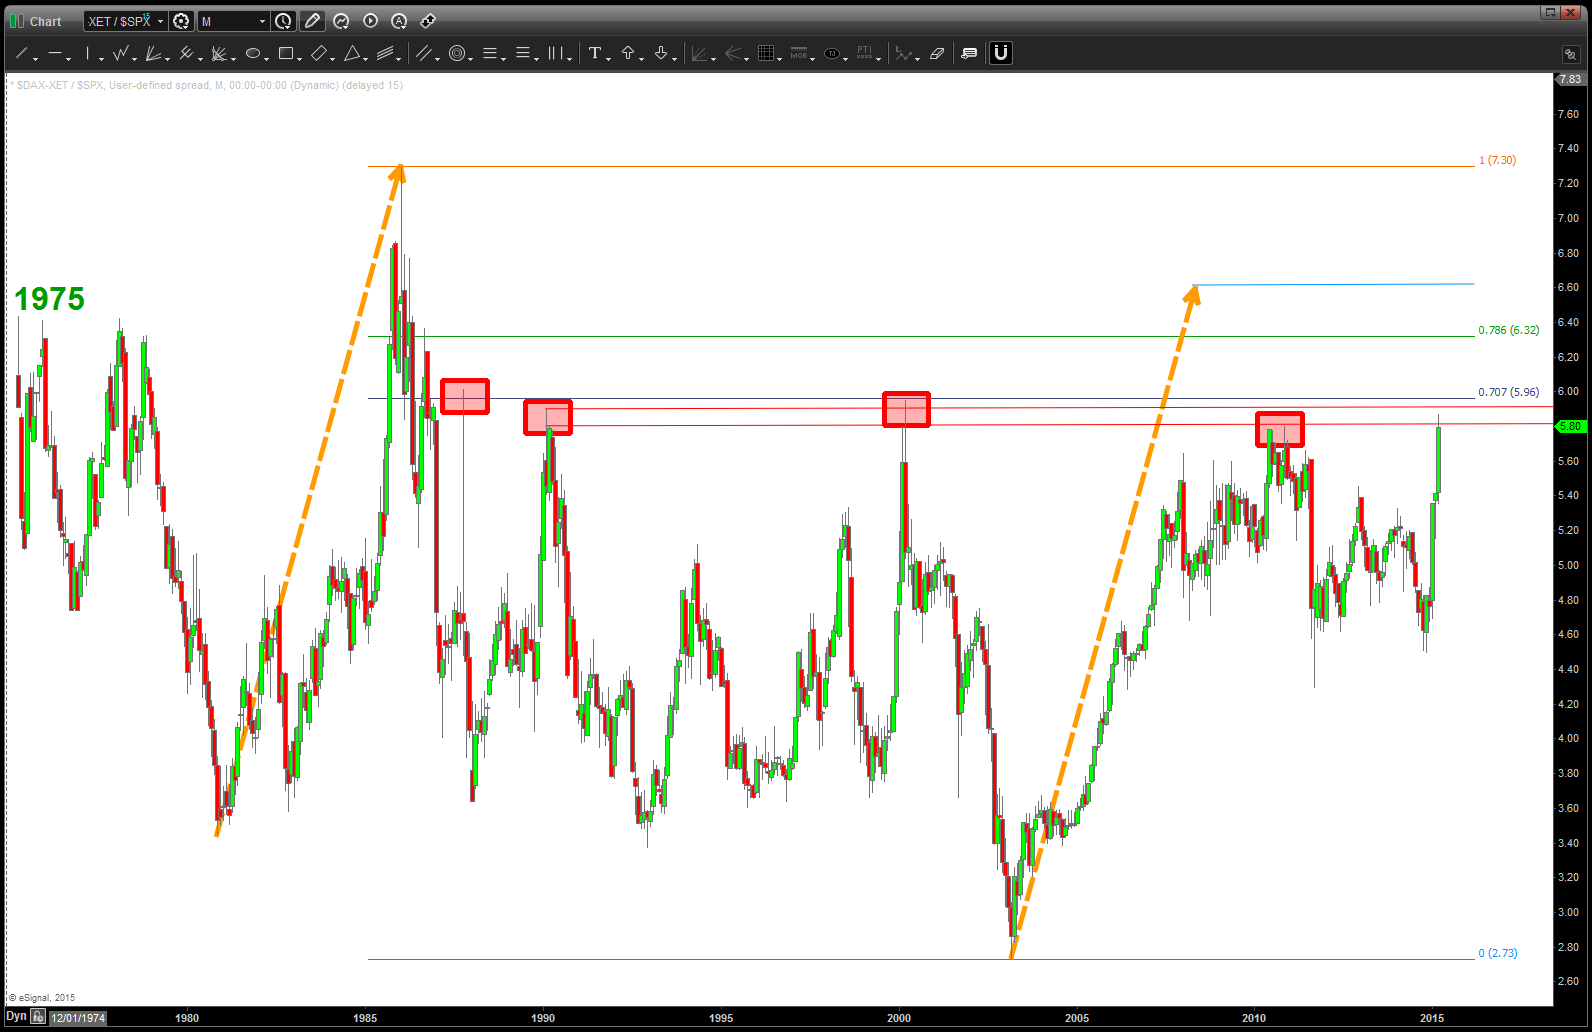
RELATIVE STRENGTH of the DAX vs SPX. NOTE IT’s TESTING a 30 year resistance level …
Great Weekend Reading @seeitmarket – honored to be included
Posted on March 15, 2015 Leave a Comment
http://us4.campaign-archive1.com/?u=2b36d80f2295312b8303ab8ac&id=a78a8c3ee8
folks, bookmark this site … GREAT contributors!
Go CAPS vs BRUINS tonight …
Bart
the KIWI (New Zealand Dollar
Posted on March 14, 2015 Leave a Comment
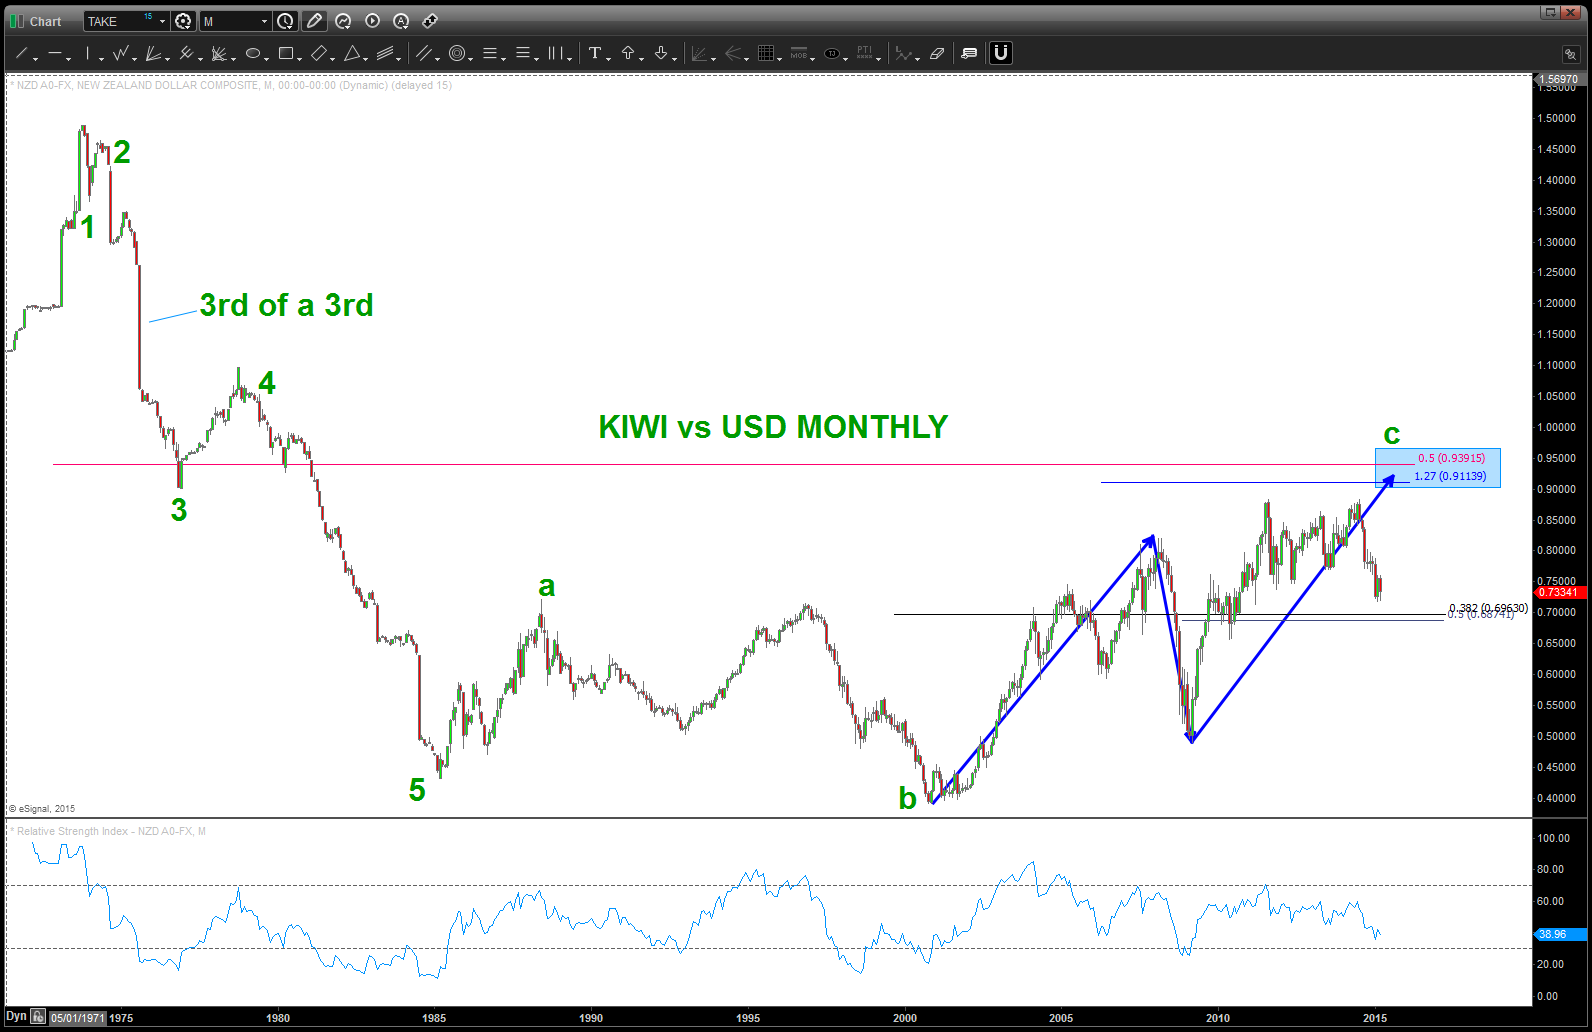
I’ve been watching this set up for a while … if your a currency trader, this has the real potential to be a powerful trade going LONG KIWI vs the “mighty” USD. Some things to consider:
- the KIWI is not part of the US Dollar Index.
- So, while the dollar index explodes …it really doesn’t have anything to do w/ the INDEX of the US Dollar.
- In fact, you’ll see that the KIWI has yet to even retrace .382 of the entire 2000-2011 advance.
- Compare that to the USD vs EURO/Pound/Aussie/Loonie/Yen and you’ll understand that it’s showing remarkable strength.
- Take note, however, a the potential EPIC double top in place. I am very aware of that but right now, w/ the dollar index being so very overbought and at an extreme in sentiment, I expect (over the coming days) for the dollar to be sold on a broad basis. Hence, KIWI to rise against the dollar …
- My take is we have a FLAT correction completing and if I can count 5 clear waves down then we might have bottomed …
- To the charts:
Long Term Monthly KIWI vs USD:
Weekly KIWI vs USD:
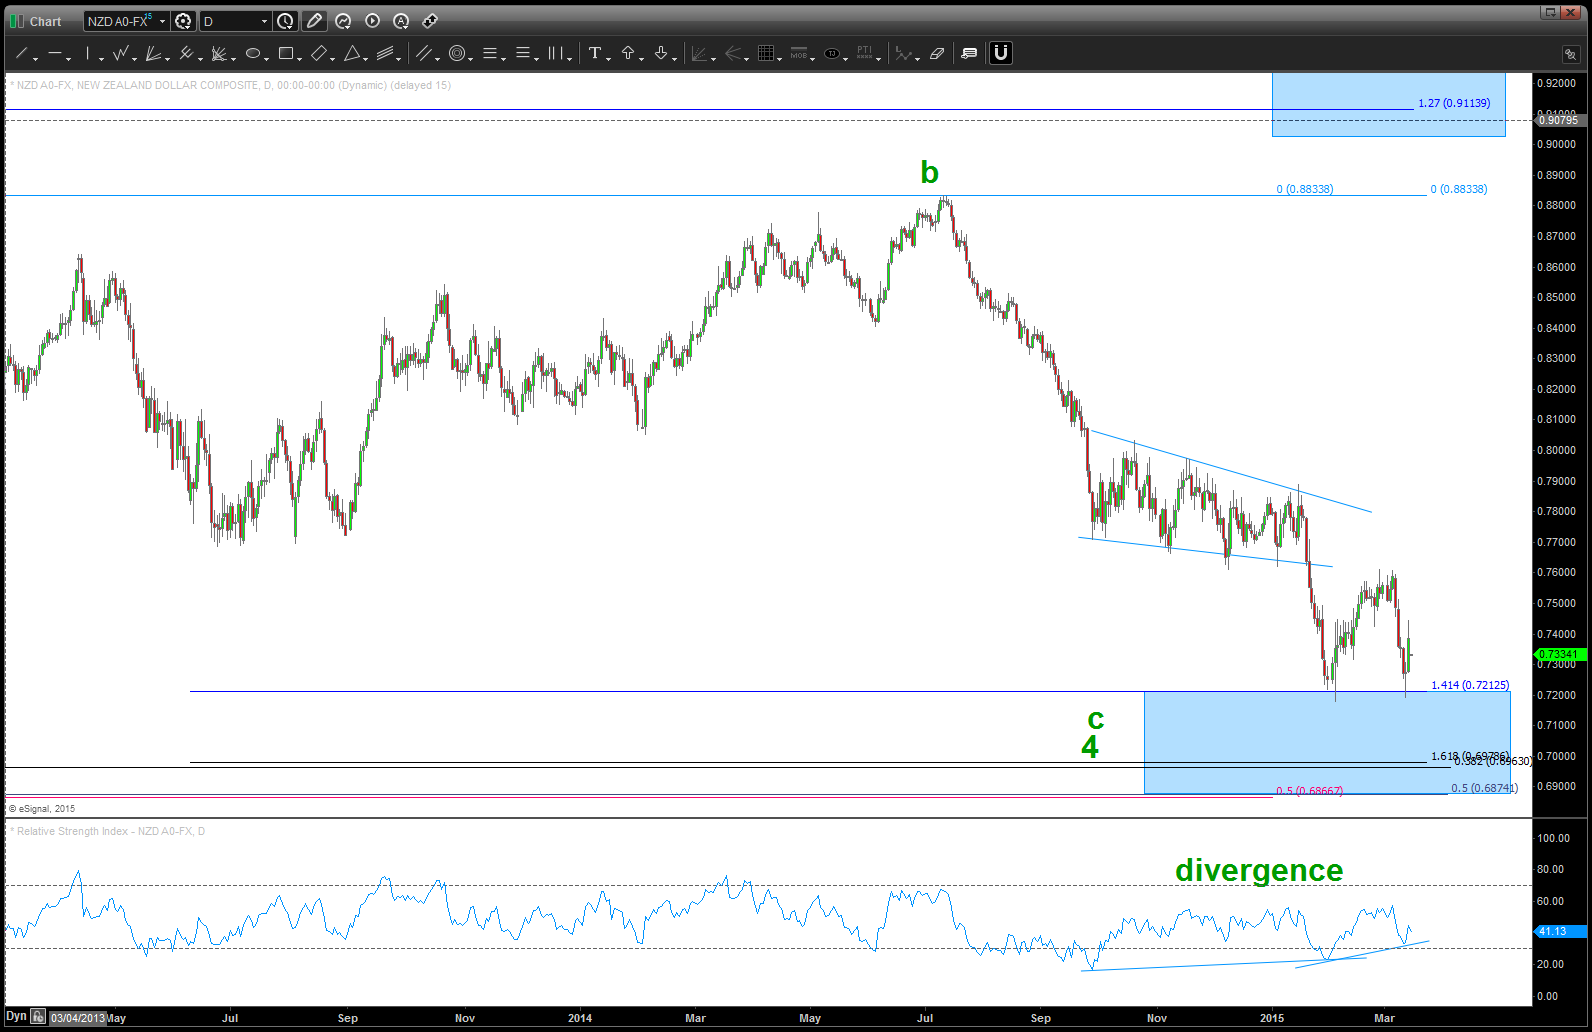
Daily KIWI vs USD
Keep this one on your radar screen ….
Bart
