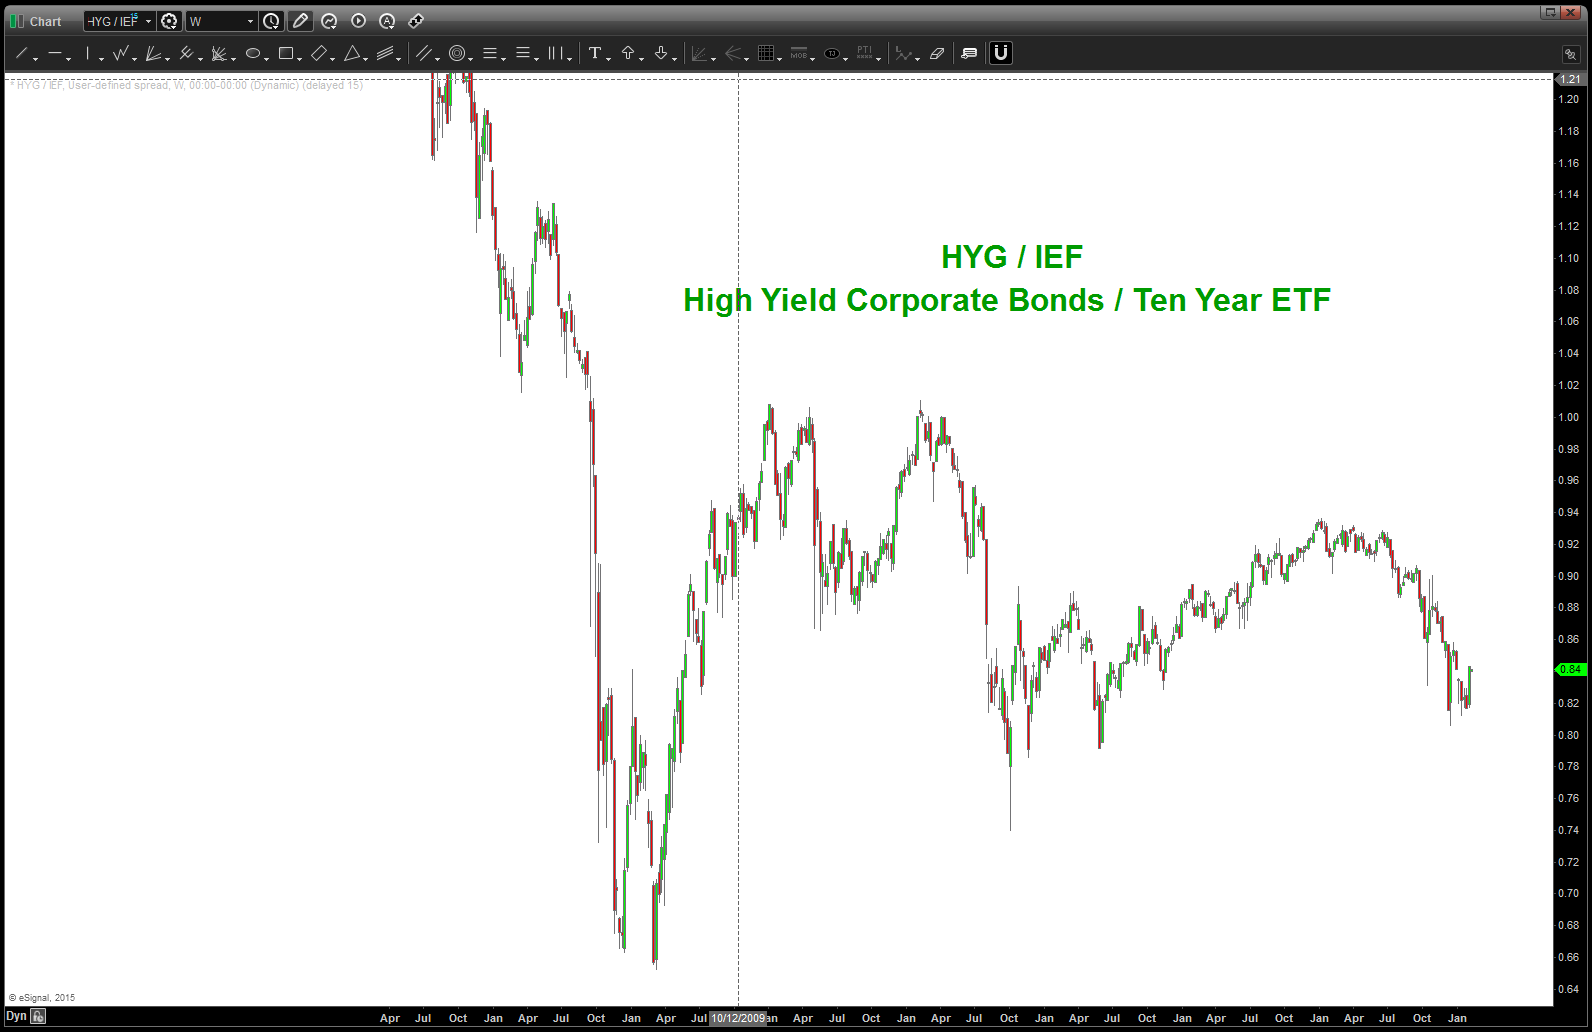
OK, one more on the 10 year …
wanted to show you a “quick look” at the ratio of HYG / IEF. HYG is an ETF for Corporate Bonds….when we use ratio analysis we look for one security strengthening over another. In this case, when the ratio goes down the HYG is underperforming the IEF (ten year ETF) and vice versa.
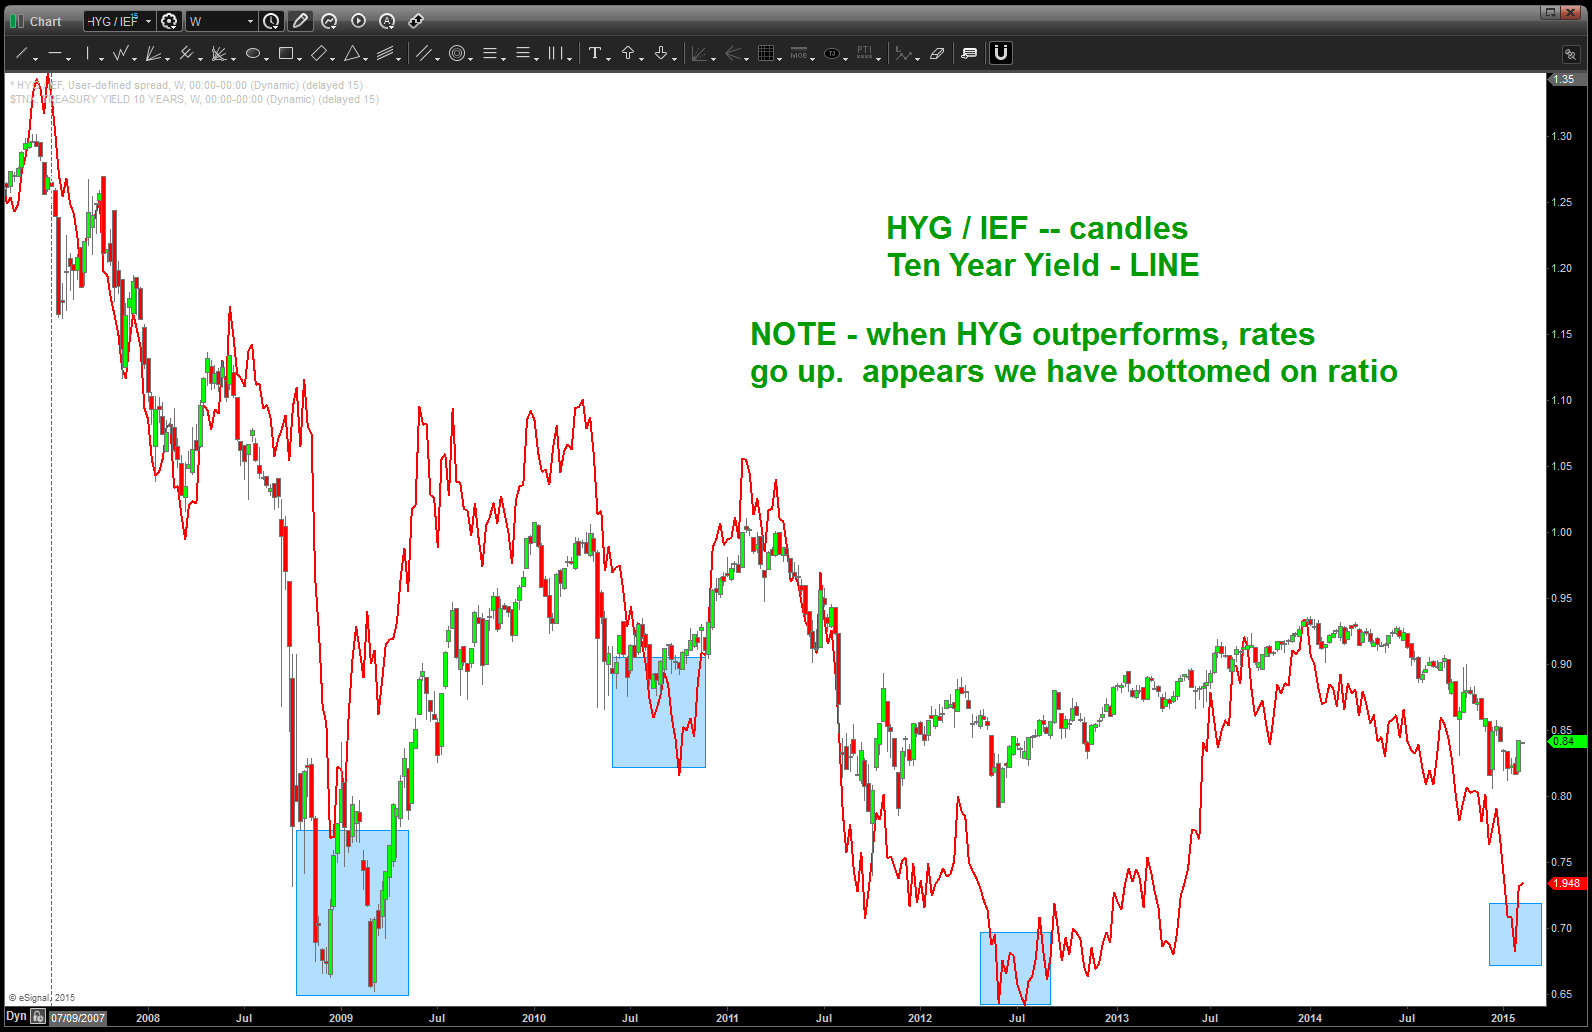
note, the second chart is showing what happens to the 10 year yield when the ratio bottoms … yields go up.
So, if ratio bottomed THEN yields to go higher.
Stay tuned ..