the key to the Ten Year Treasury Yield
Posted on February 9, 2015 1 Comment
I’ve highlighted an area w/ a blue rectangle.
Folks, that’s 5 waves up so – ultimately we need another 5 wave move up to occur.
I think that’s in work as of the close last week and have projected ten year yields to spike to 3.6-4.0 for now.
Going to be interesting to watch …

notice the 5 wave move UP … need another 5 wave move up. Believe that’s happening right now
VIX Triangle Complete? ($vix)
Posted on February 8, 2015 Leave a Comment
in Elliott Wave theory a triangle occurs in 5 waves labeled a-b-c-d-e.
a case can be made that the VIX completed the final (e) wave of a triangle on last Friday.
this week is going to be crucial w/ so many patterns pointing to the downside …
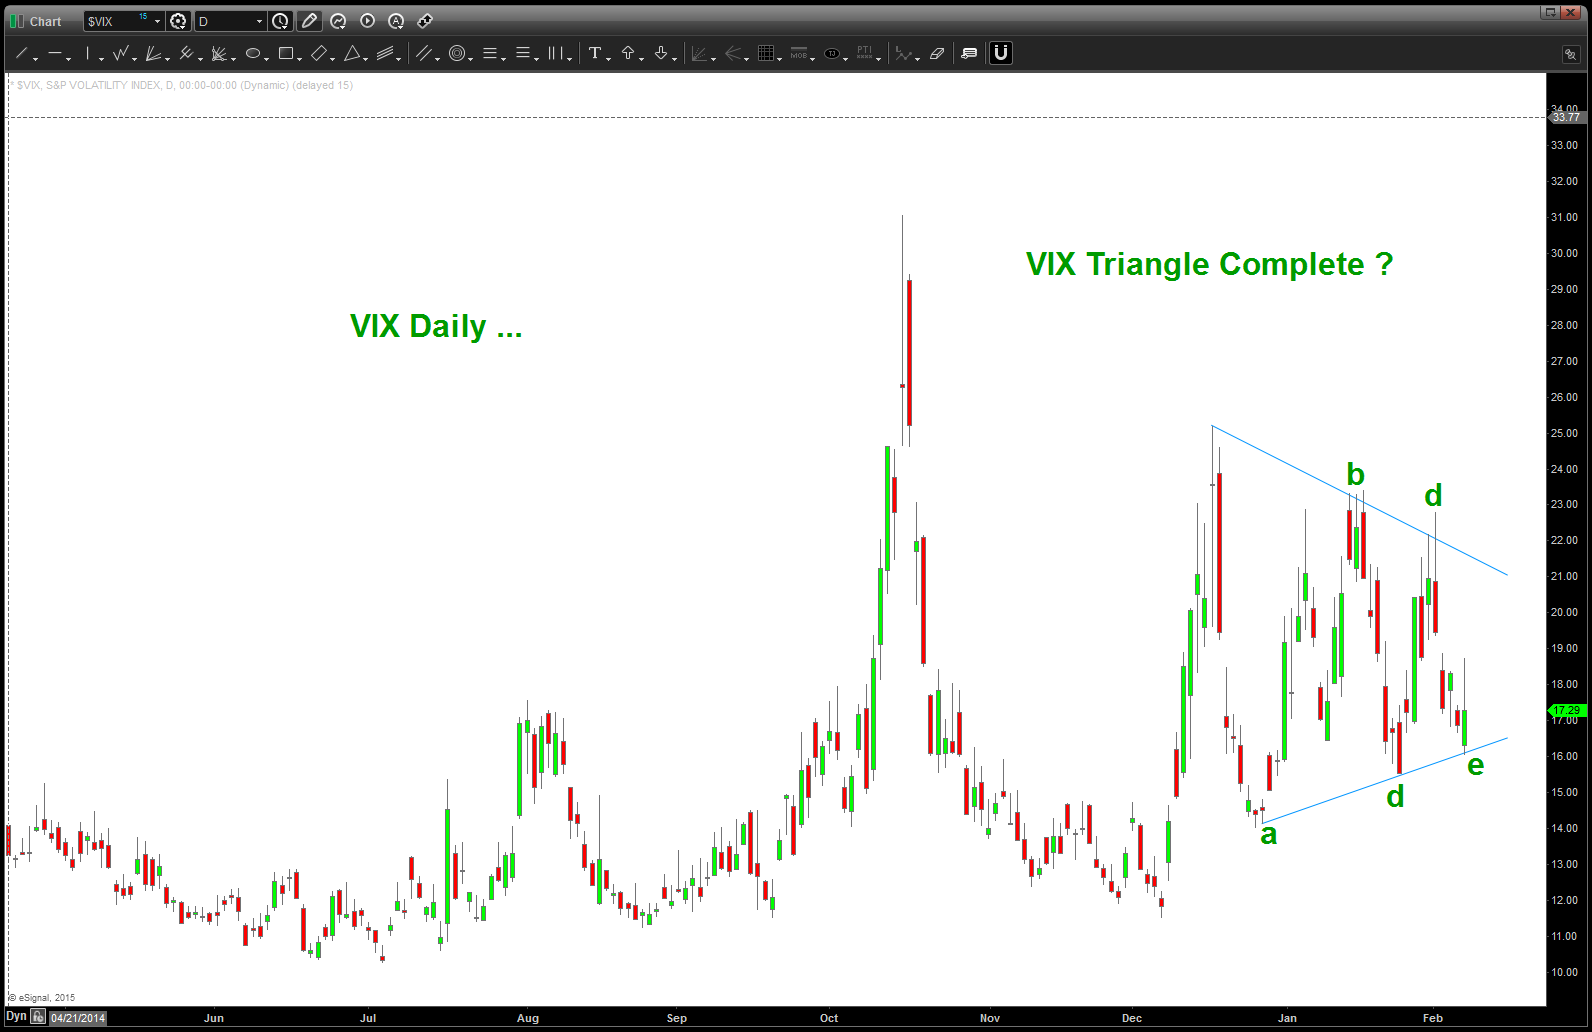
VIX traingle complete a-b-c-d-e
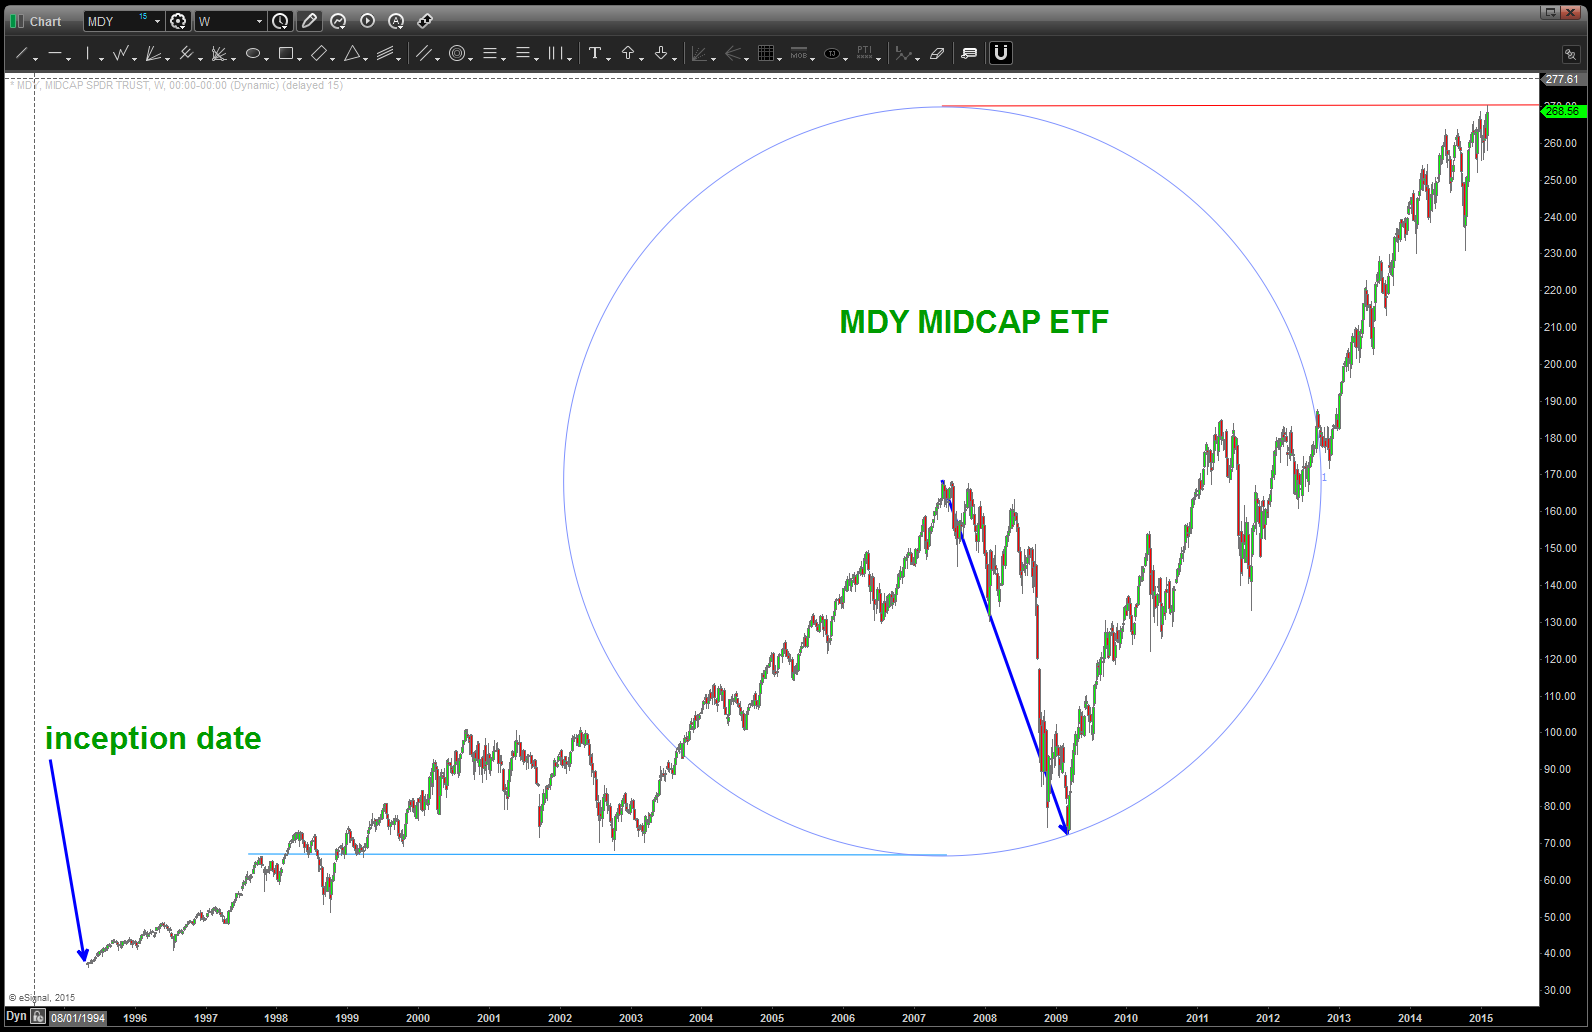
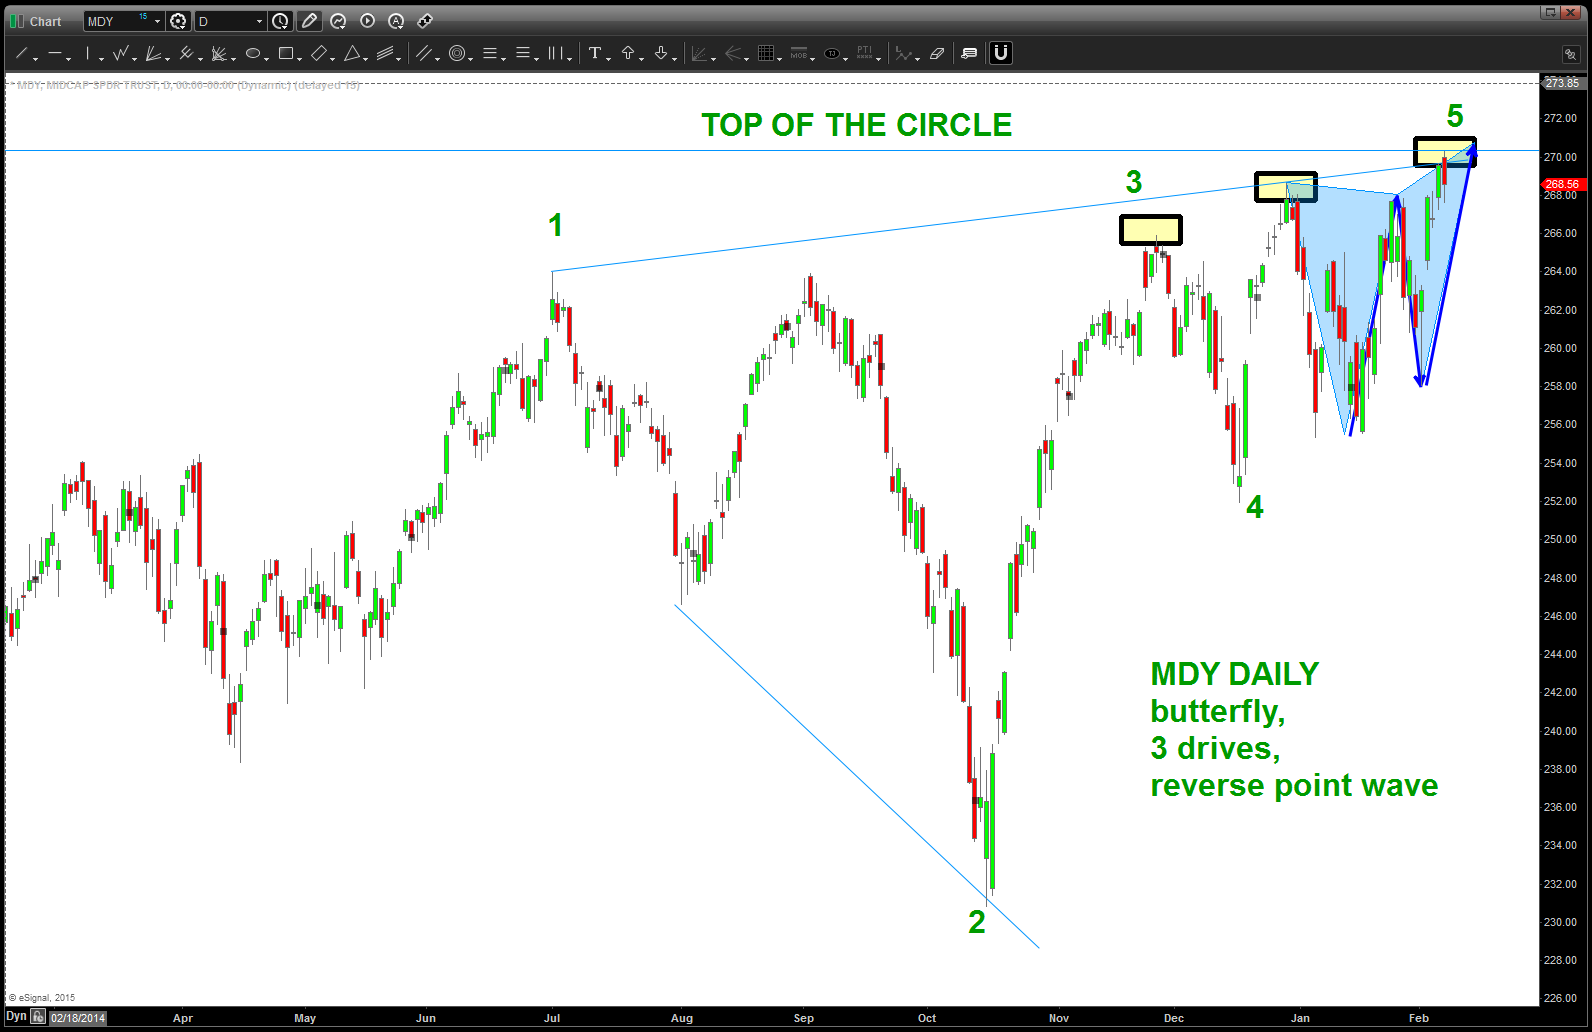
geometry of the midcaps ($MDY)
Posted on February 8, 2015 2 Comments
I like the tops and bottoms of circles … they are pretty powerful and not often used in the technical analysis community. the reason they work is another subject for another time. if you would like to know a little bit about their formation and their cyclical (price and time) characteristics hit me on email.
take a look at the mid-caps … perfect hit on Friday of the “top of a circle” and on a daily chart we had 3 very powerful sell patterns hitting at the same time.
watch this for weakness … if it let’s loose and busts thru the to the other side higher then let it breathe for a while and it will come back to 270 for the opportune time to get long.
in the meantime … let’s see if the top of the circle holds, or not.
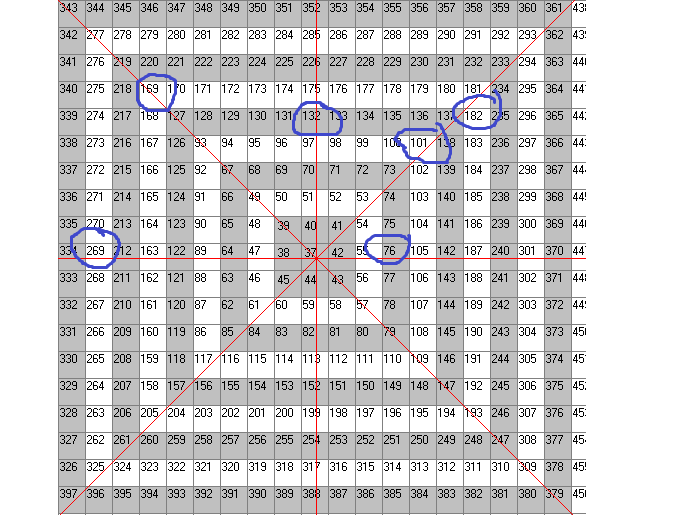
square of 9 targets. note – all on axis for major high and lows
I’m watching 4 things …
Posted on February 6, 2015 Leave a Comment
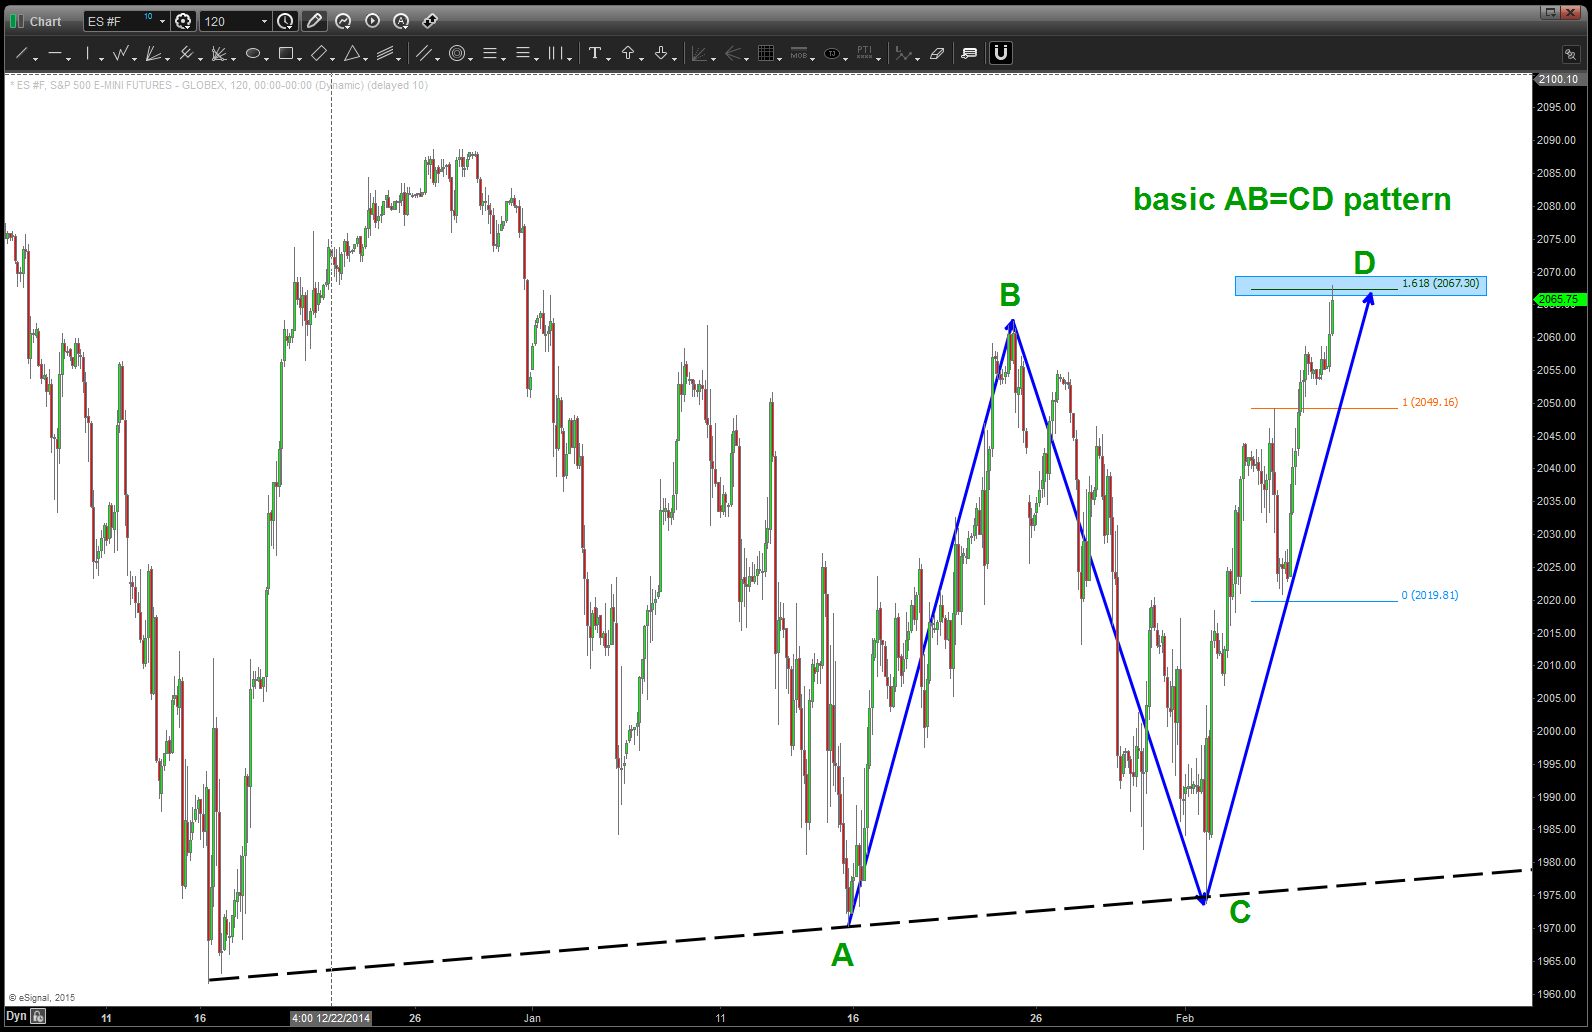
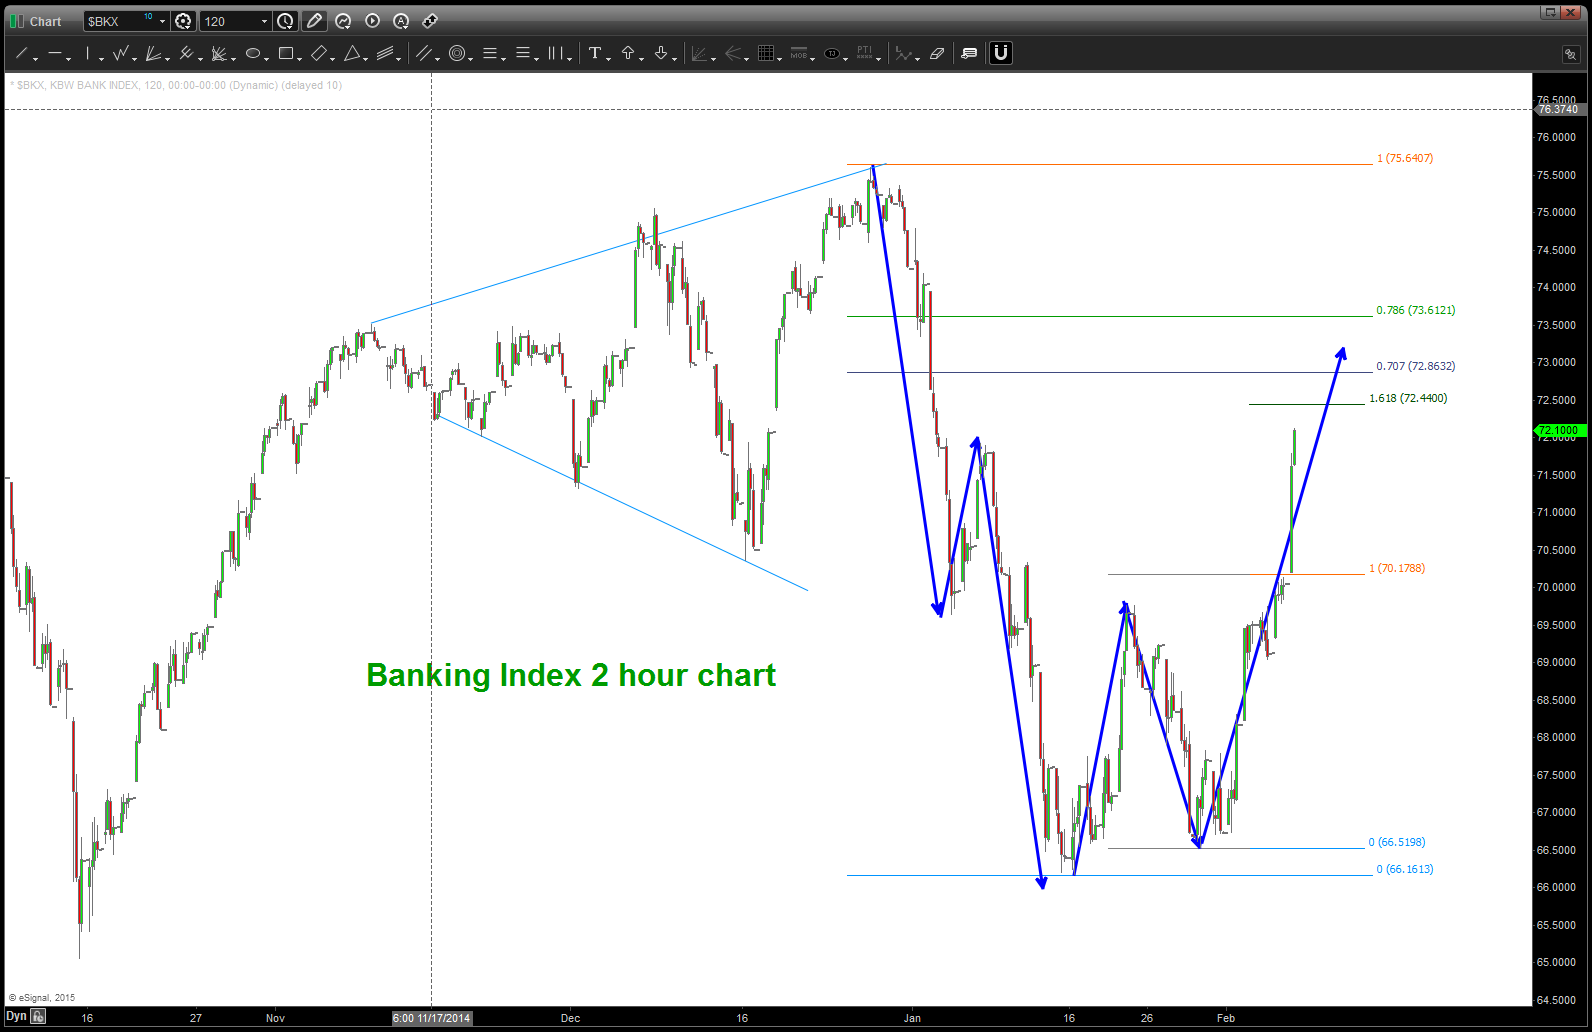
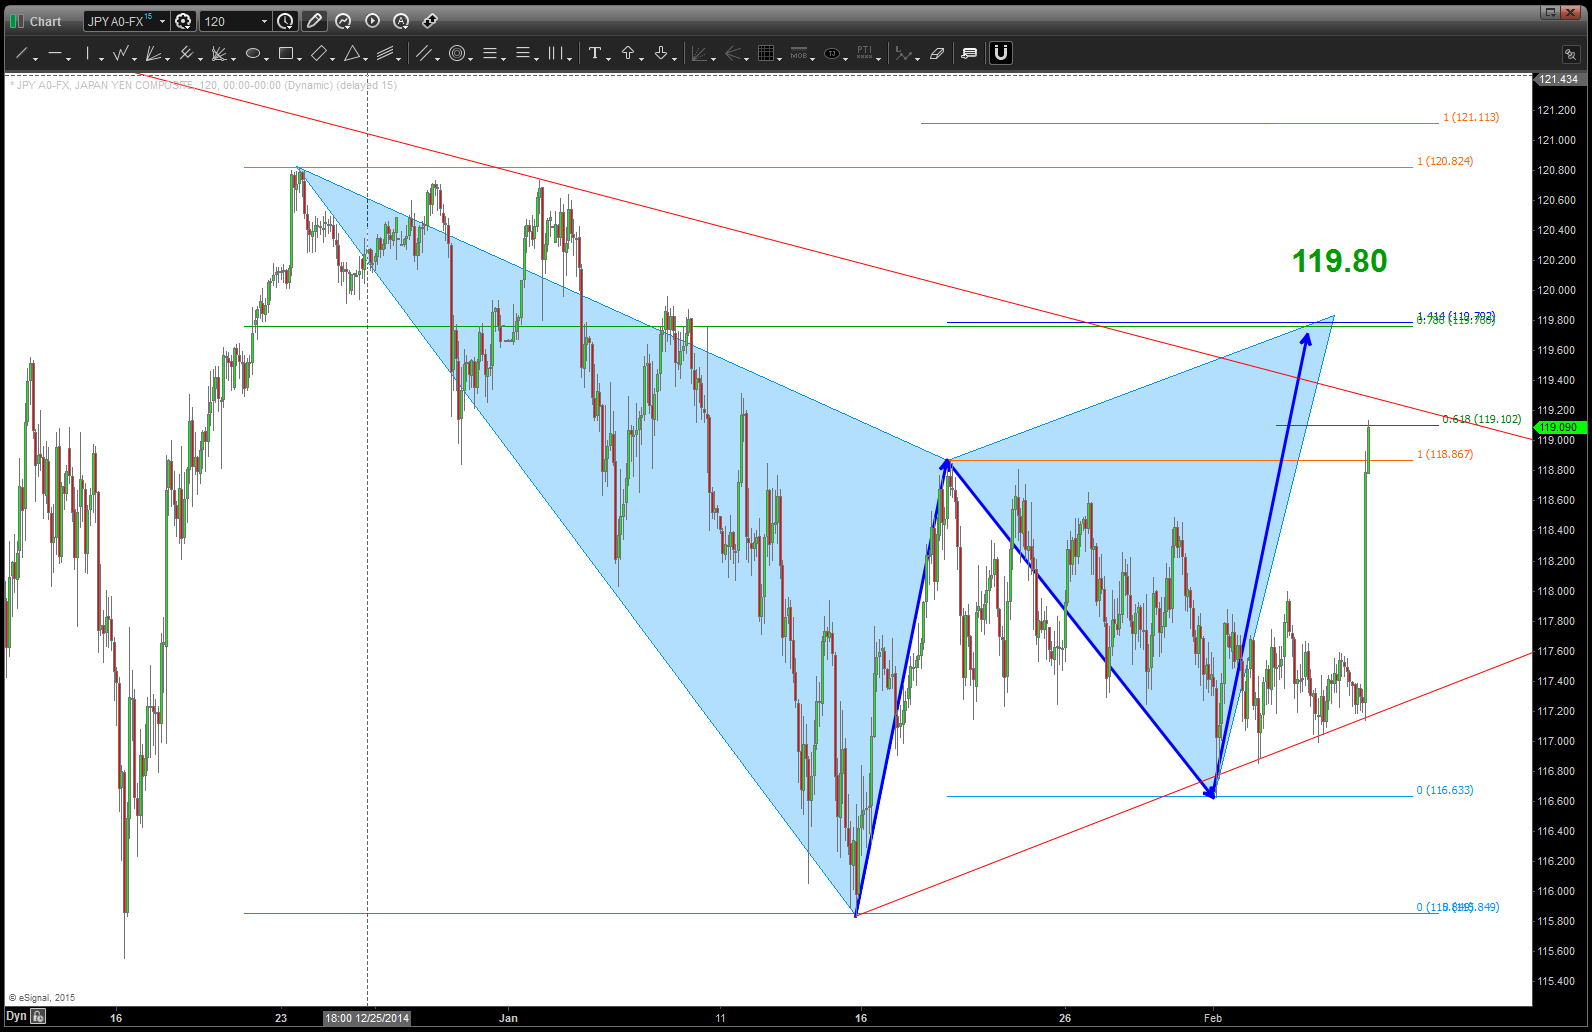
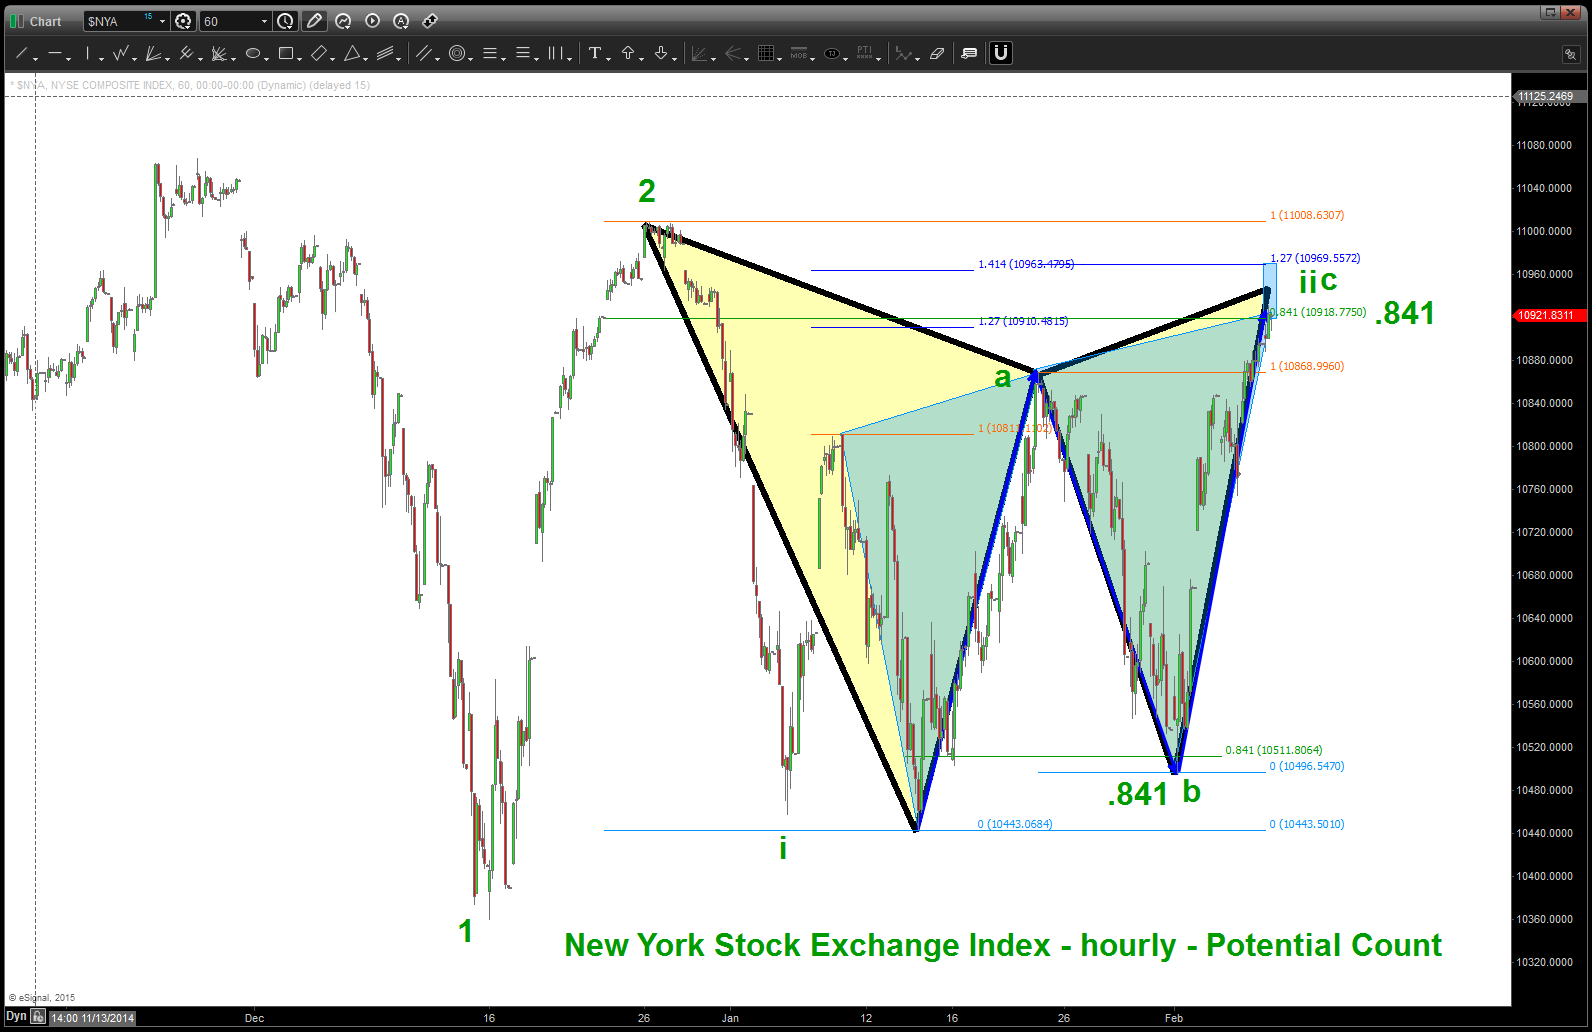
PATTERNS on the ES, $NYA, Banking Index and Yen to tell me if we break out to new highs.
- Banks are rolling. That’s bullish – get thru level shown then we should surge higher
- Yen, after an entire 6 weeks of doing nothing – EXPLODED. 119.80 line in the sand
- ES “basic” AB=CD complete.
- NYA shows a possible count calling for lower
Close today will rank in the “big deal” category in my very humbled opion.
Just a pattern guy … no idea what the jobs report, or rates, or any of that “stuff” means …
IF you do ONE thing please WATCH this video …
Posted on February 2, 2015 1 Comment
Larry Pesavento (www.tradingtutor.com) is not only a mentor but a true friend and guiding example of integrity, passion and truth in the financial markets. He’s 75 (acts like he’s 16) and has made his living trading the markets for 50+ years. It’s an extreme honor to call him a friend.
SPOILER ALERT: over the years he called my family and left a message on the answering machine playing Santa for my kids … he’s that kind of a guy.
He’s worked w/ me around the MENTAL aspects of trading and working thru losses and a drawdown that I had in my CTA which had not occurred after 7 years of positive trading year over year.
Bottom line – when he speaks I listen. We skyped tonight after the football game about the Chinese Yuan, Silver and being above ground and I asked him permission to post a video that he put out this weekend which I think was extremely important. Of course he agreed because I truly believe he cares for all of us.
Here’s the deal – I full admit I went bearish in 2012. Why? Well, it’s in this video – my thinking was not based on patterns but on an emotion of “how could they surpass the debt from 2007 after that chaos?” I “think” it made sense BUT as anyone can see – the market has relentlessly marched upward and onward.
If you read this blog, you know I really don’t know anything about fundamentals. I am proud to say I am a pure play chartist and, quite frankly, pretty darn good at it. (Just ask Larry … :)) So, this video that Larry put out speaks to me … I don’t know “when” we get thumped but I am pretty confident that it’s going to happen sometime in our lifetime and it’s going to be RELENTLESS and BRUTAL and knock the teeth out of the financial landscape as we know it.
So … use a stop.
ENJOY and to Larry – my mentor and friend – thanks.
Bart
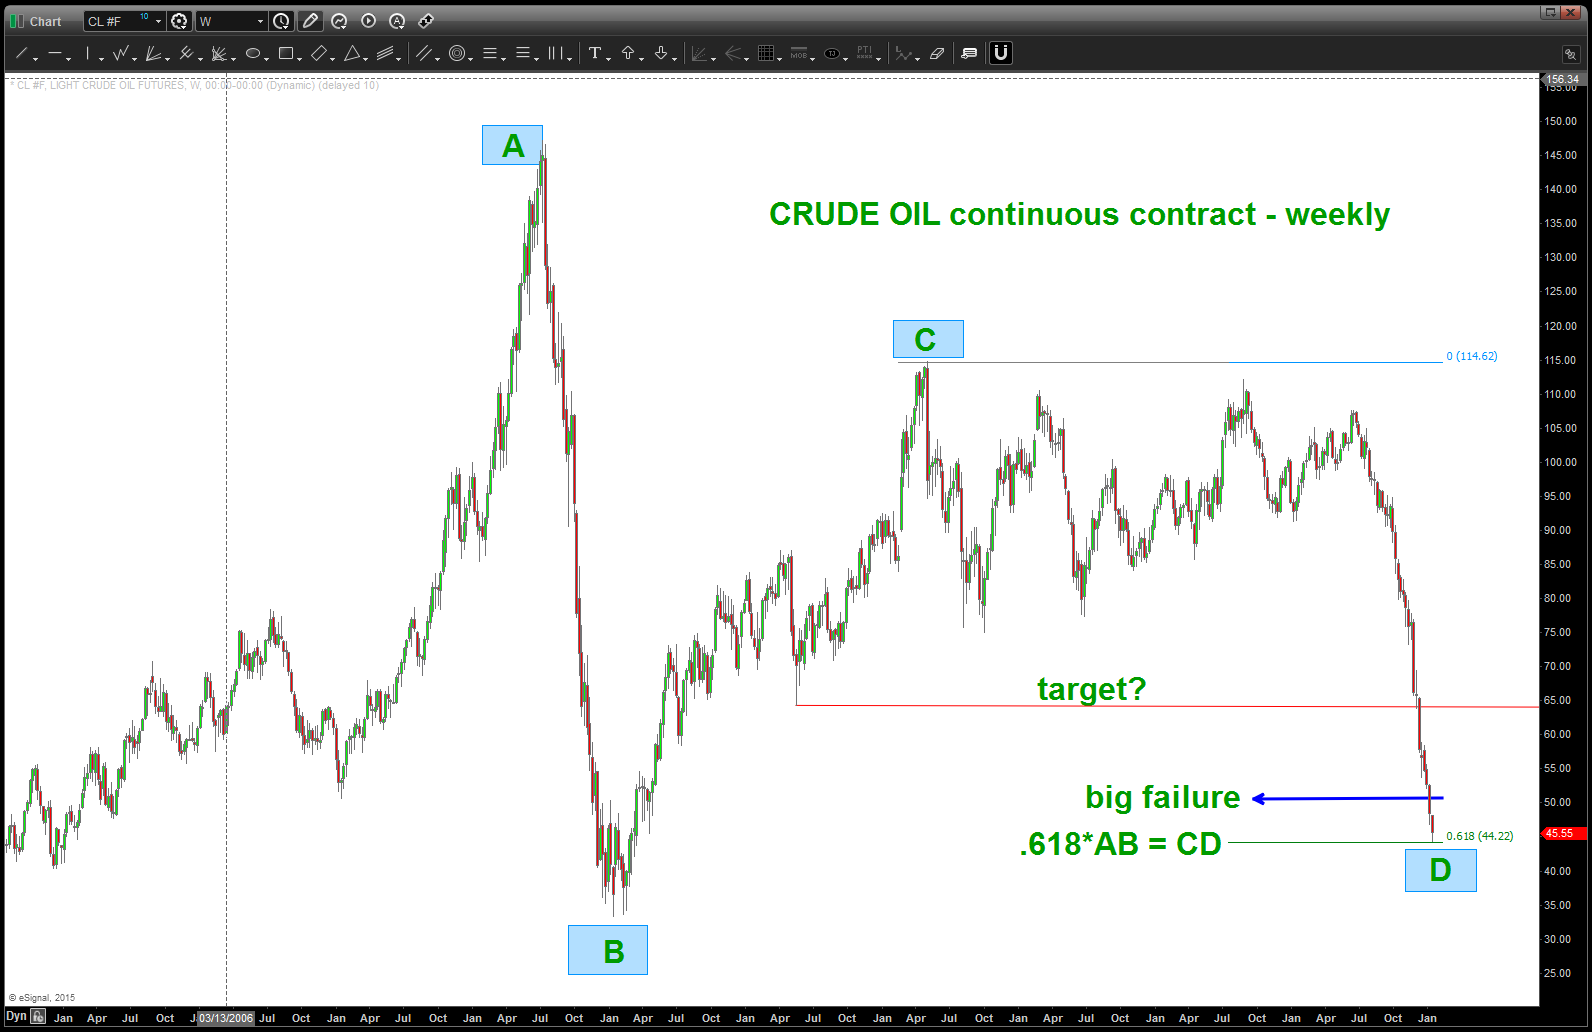
Crude “should” target 76-77 as a bounce target.
Posted on January 31, 2015 4 Comments
Thus far, the low at 44.22 has held. Yes, we had an intraday spike below but – note – it closed above 44.22 and then ripped for a nice signal reversal candle to the upside and believe we could target 76-77 w/ 60-61 as initial resistance.
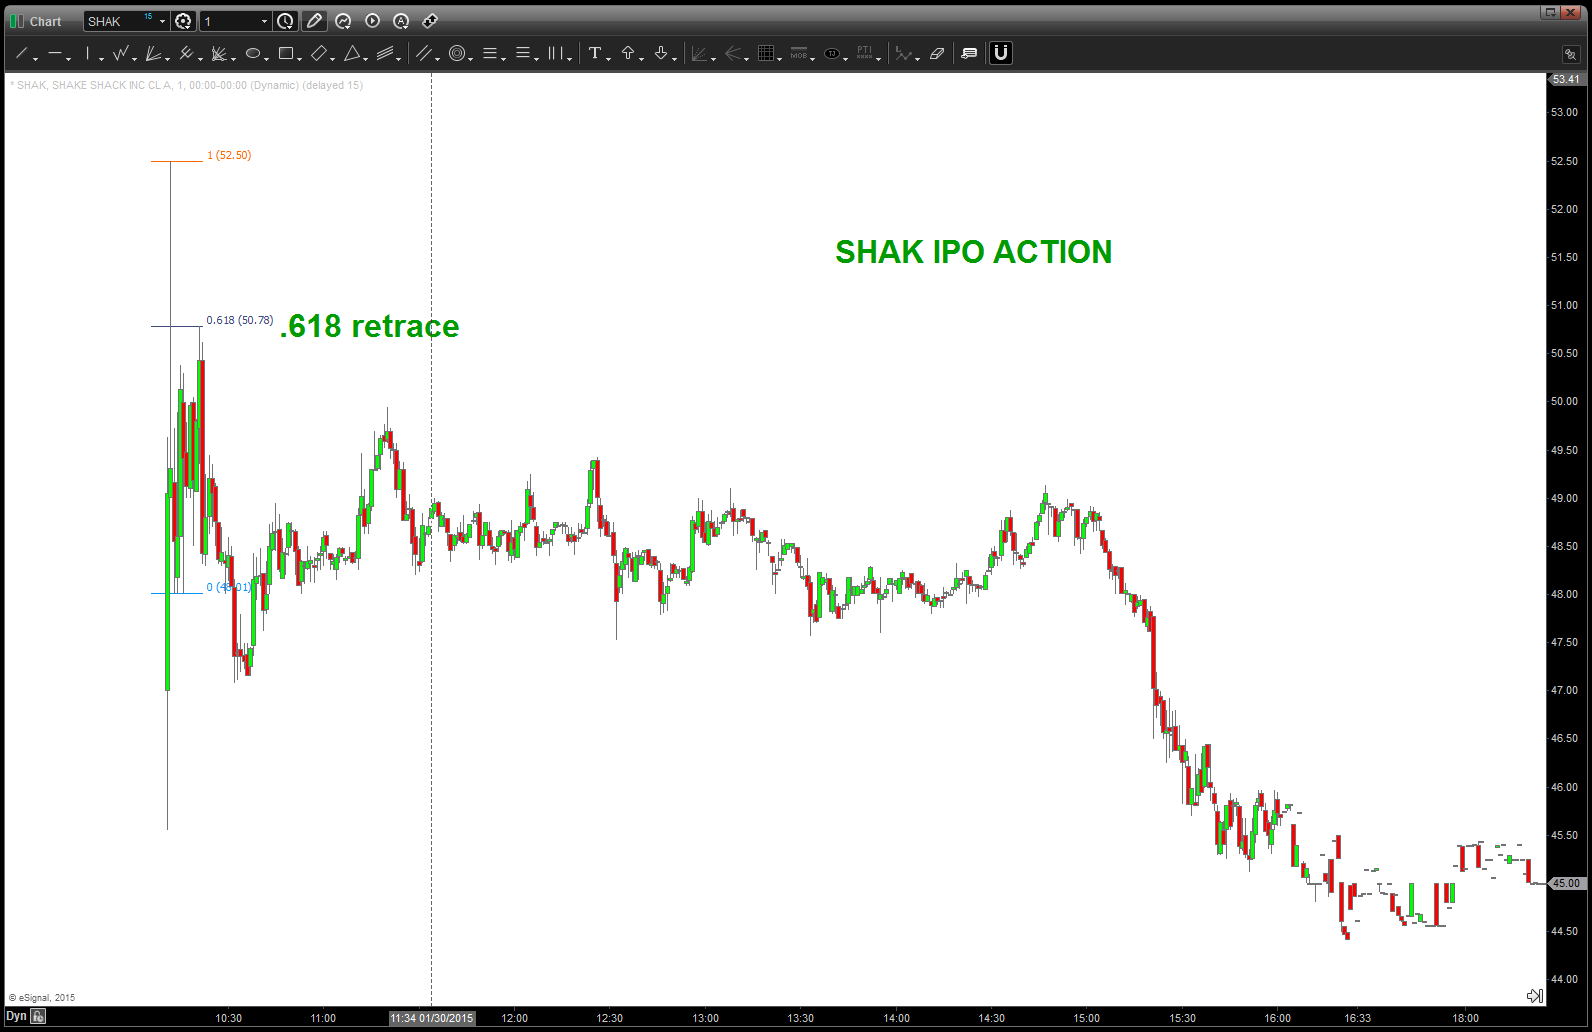
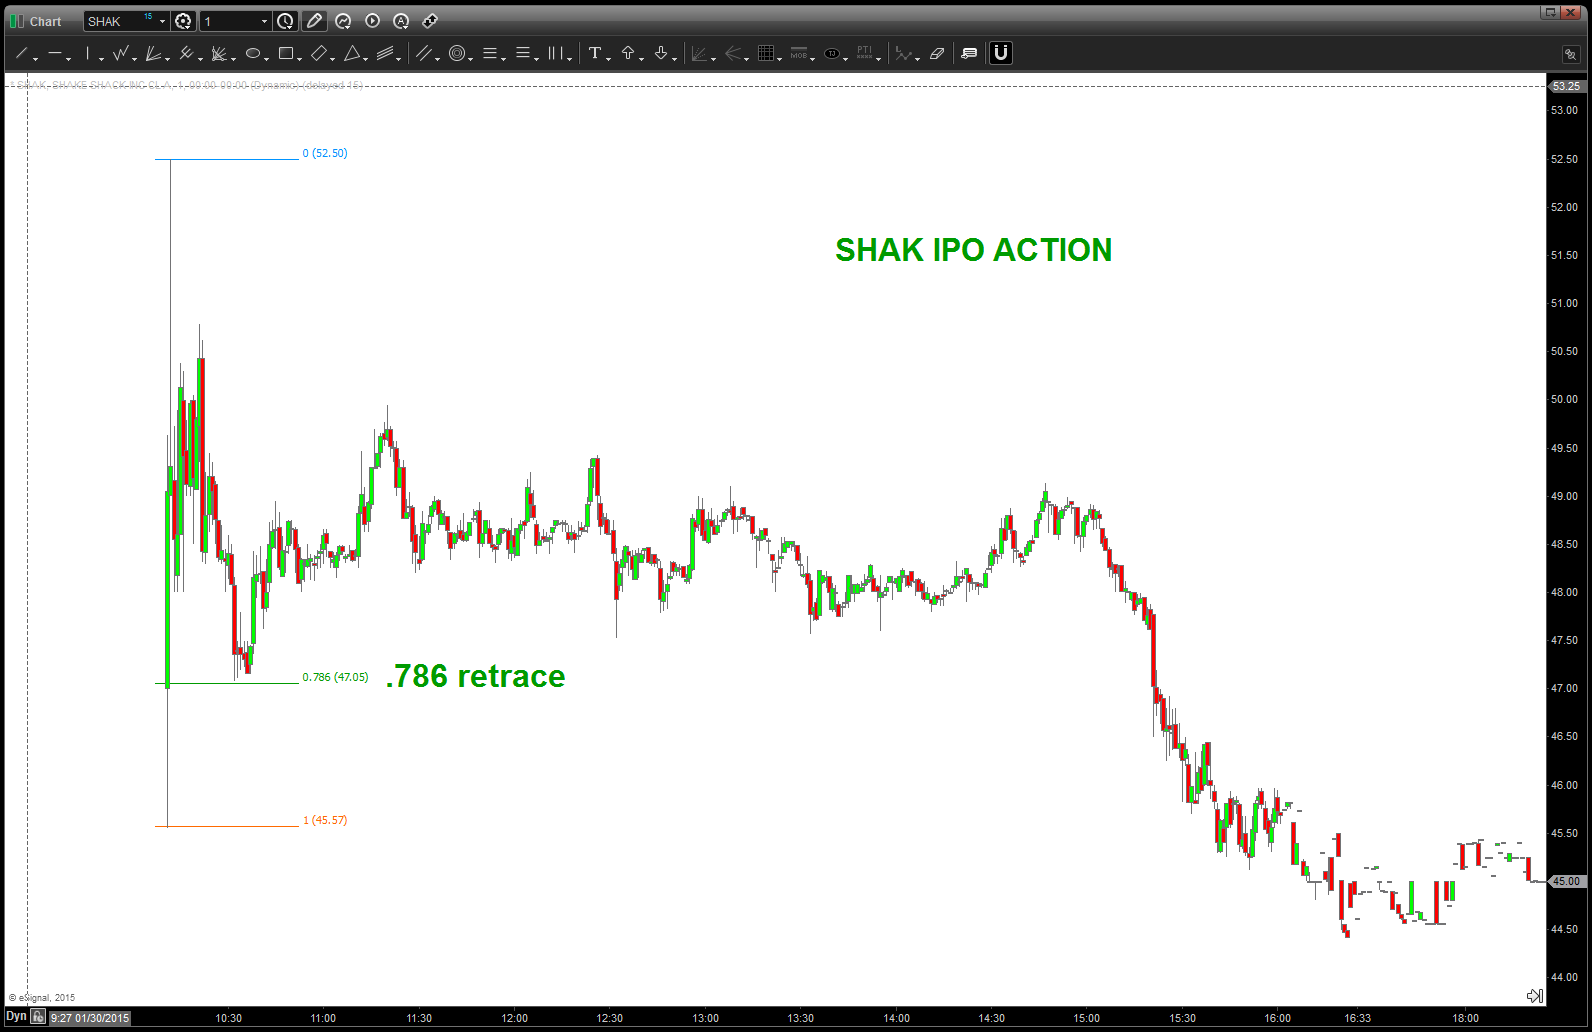
$SHAK “Shake Rattle and Roll”
Posted on January 31, 2015 Leave a Comment
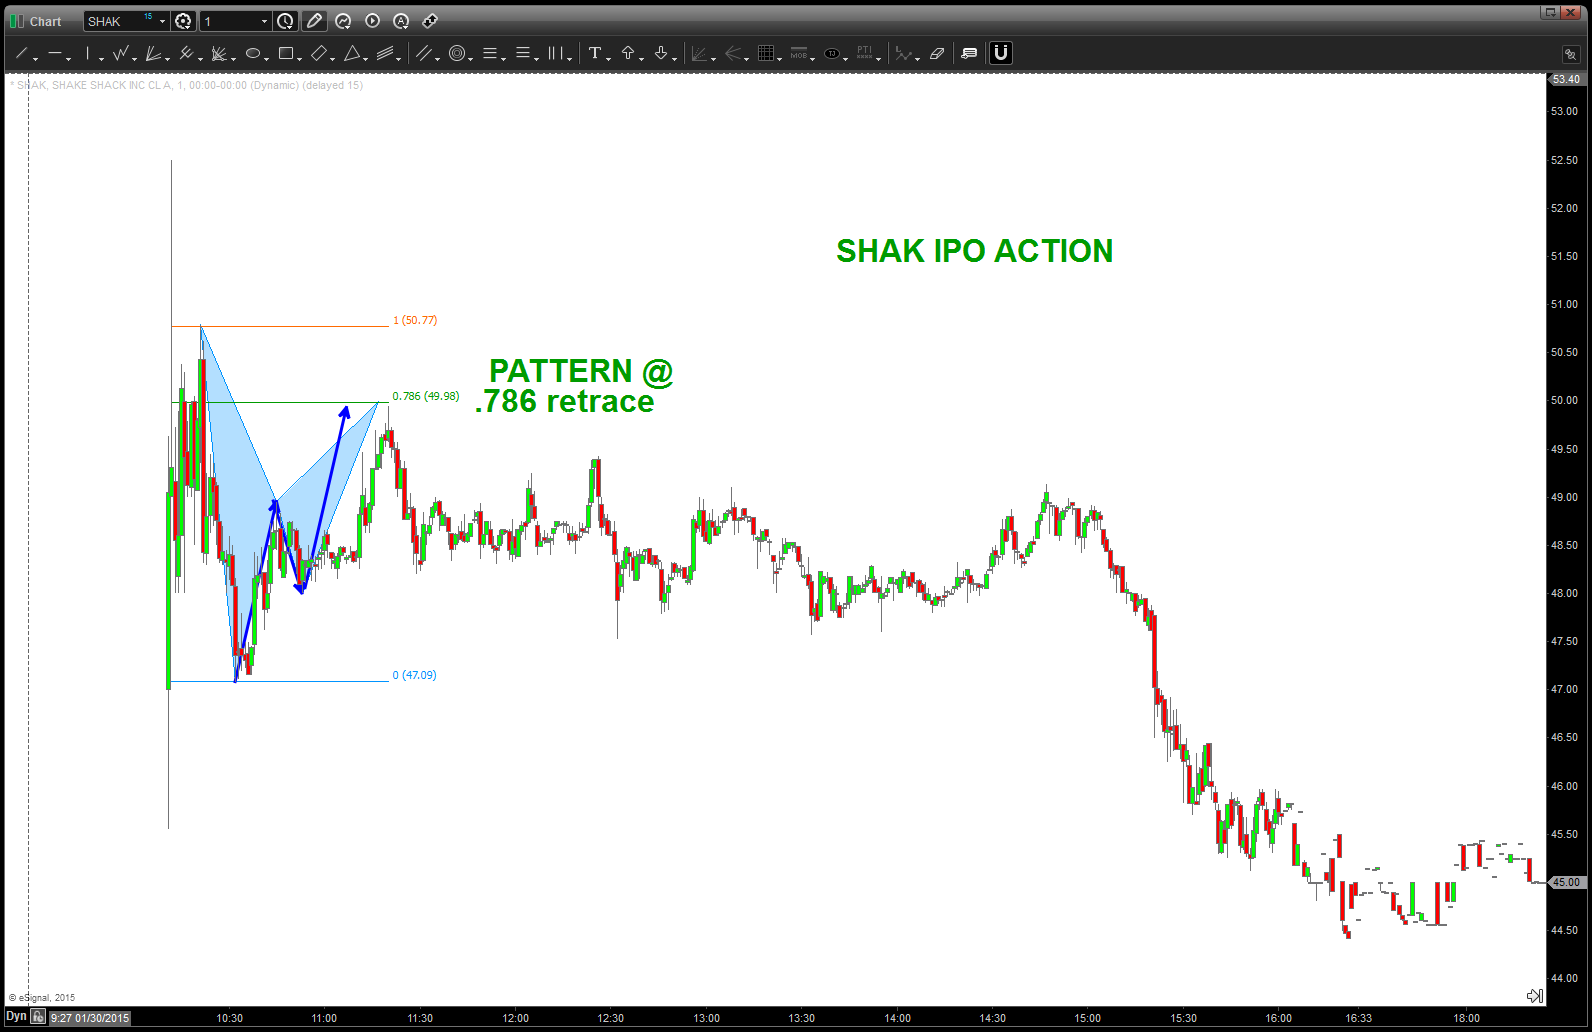
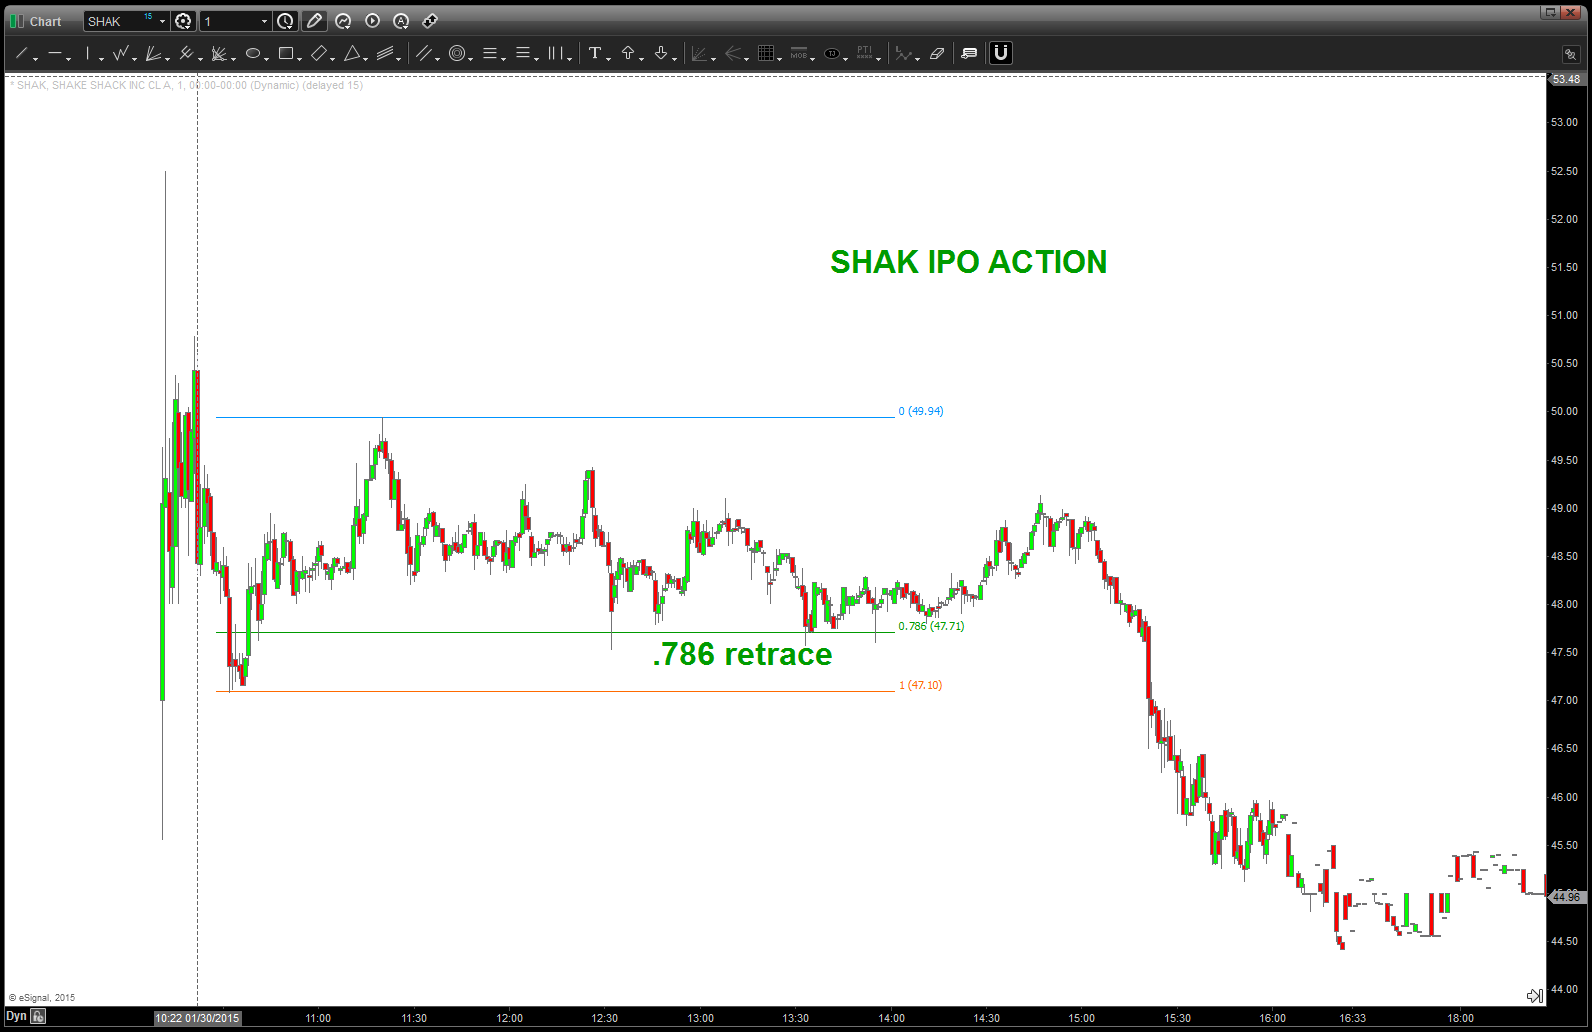
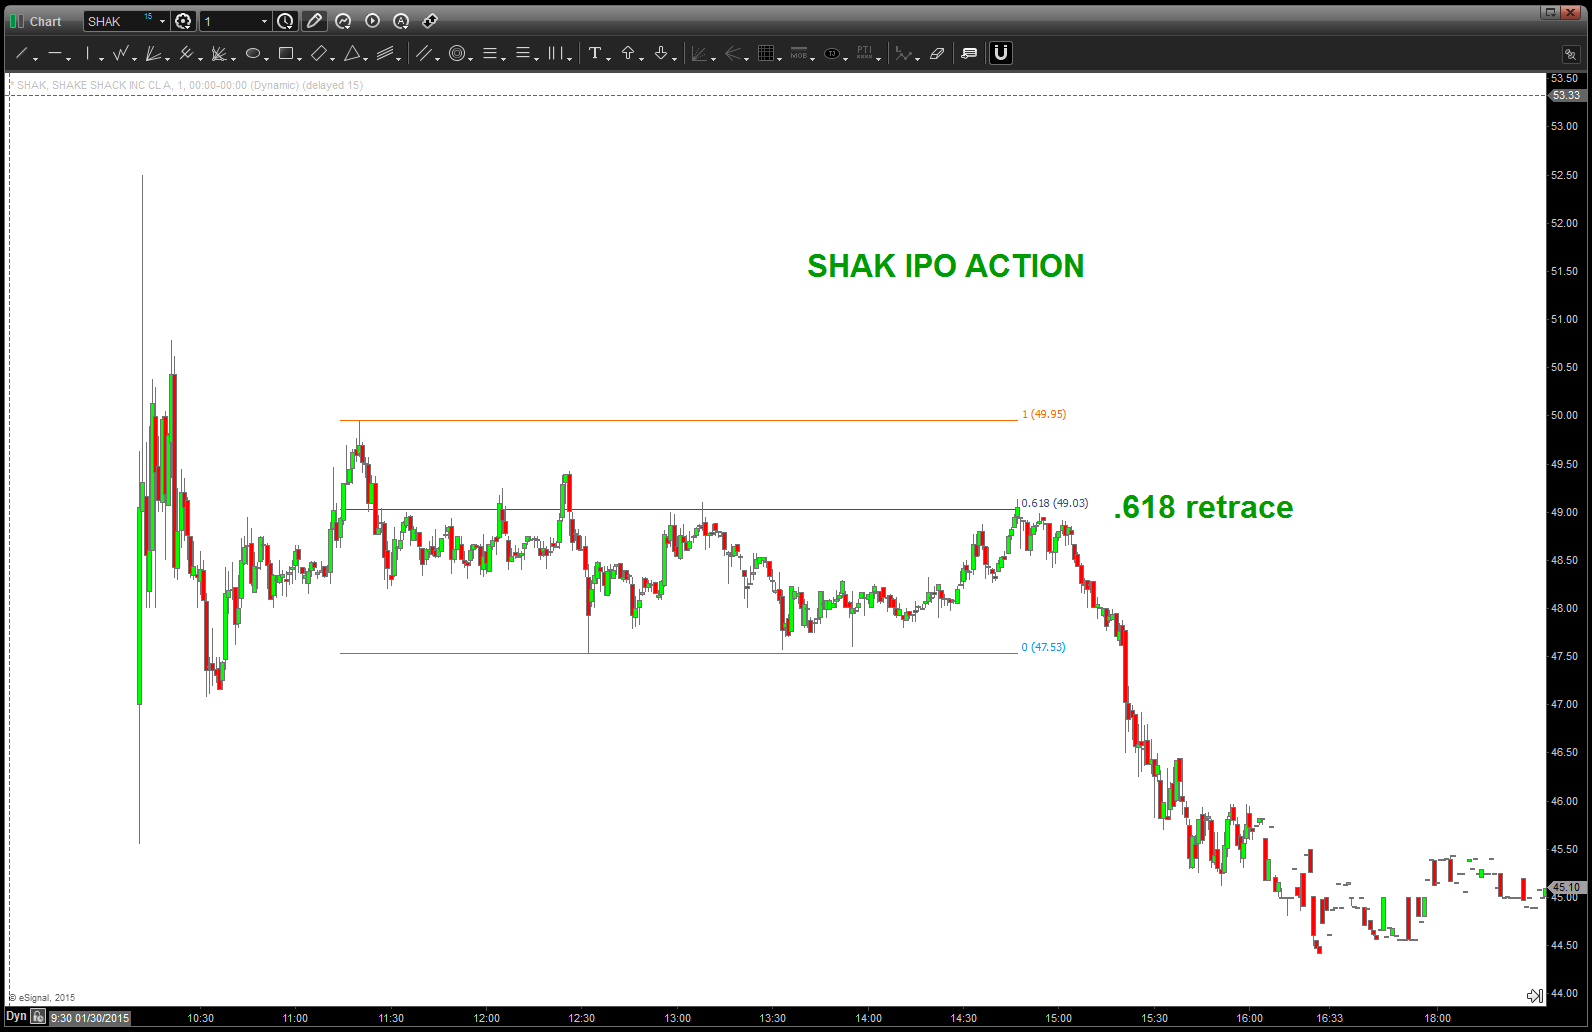
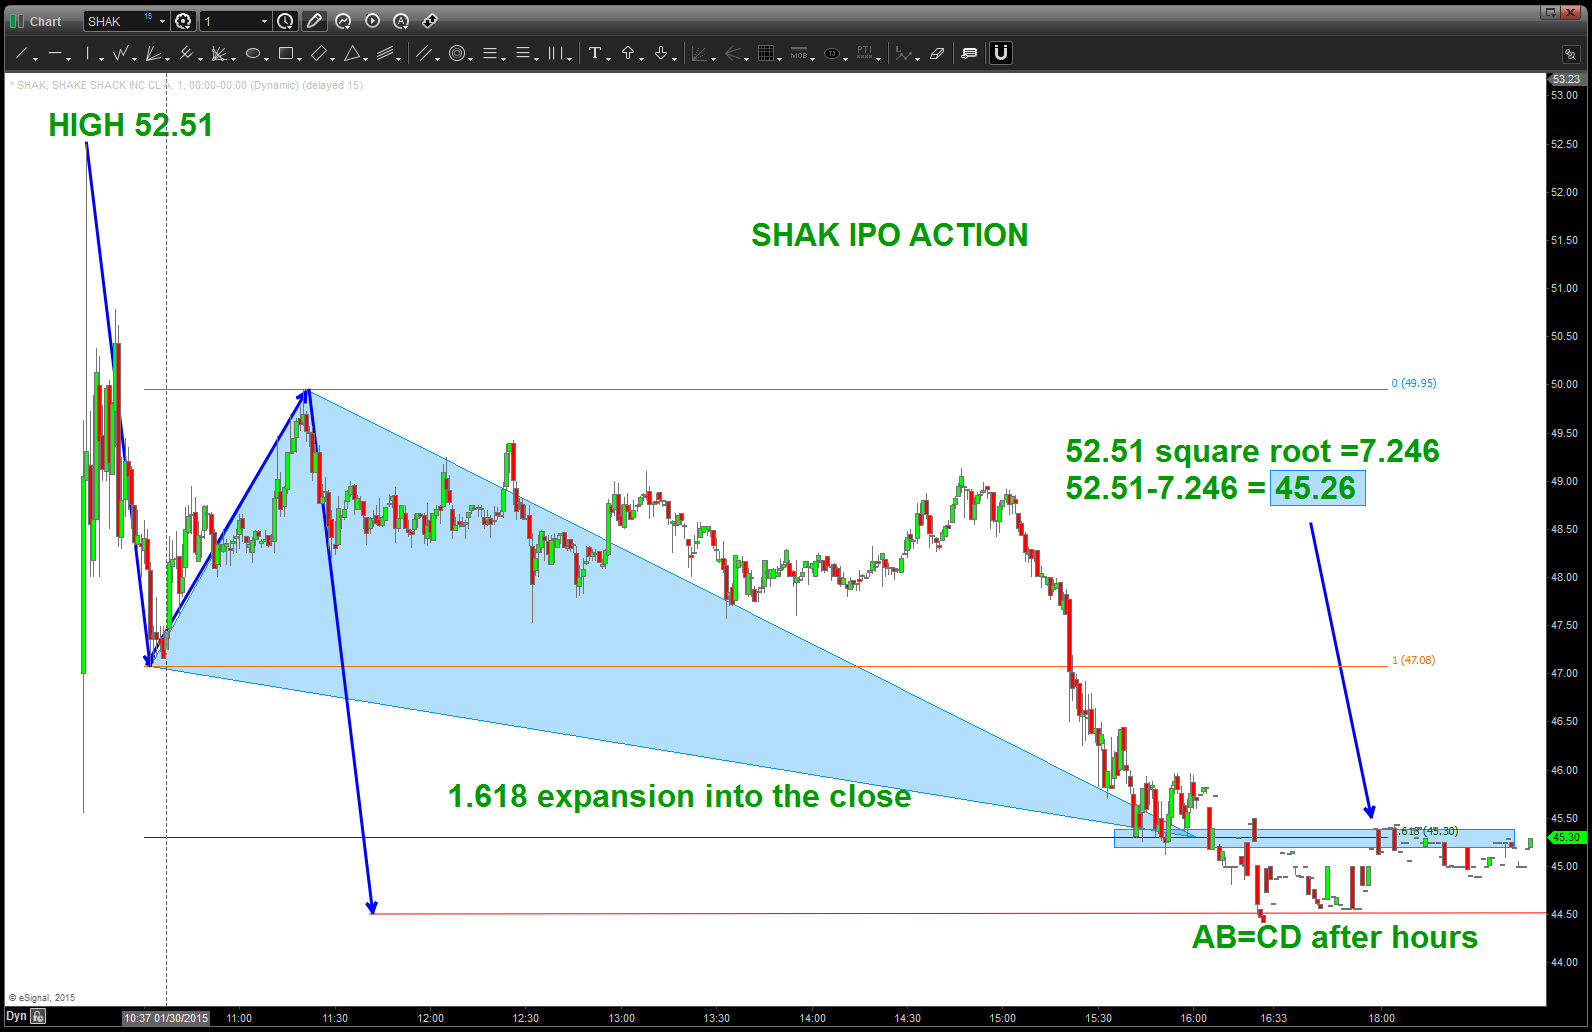
good morning … going to post a series of charts showing the ratio’s at work. I am not sure where this stock is going but wanted to post some charts this weekend and one of them is a demonstration of the ratio’s at work.
the concept I like the most is the world of square roots … the high 52.51-(square root of 52.51) is the EXACT close after hours.
this is a 1 minute chart and it’s showing that every swing was caught by a ratio an then the last moment of the first day of trading caught the lows w/ perfect patterns.
could you trade this? maybe but probably not. I’m a longer term swing position investor but every once in a while dig into the weeds to watch the harmony in motion …
most if not all my charts are real time. that being said, this is looking in the past but just wanted to exercise my brain a little this AM and show the ratio’s at work.
ENJOY …
Home Builders relook …
Posted on January 12, 2015 Leave a Comment
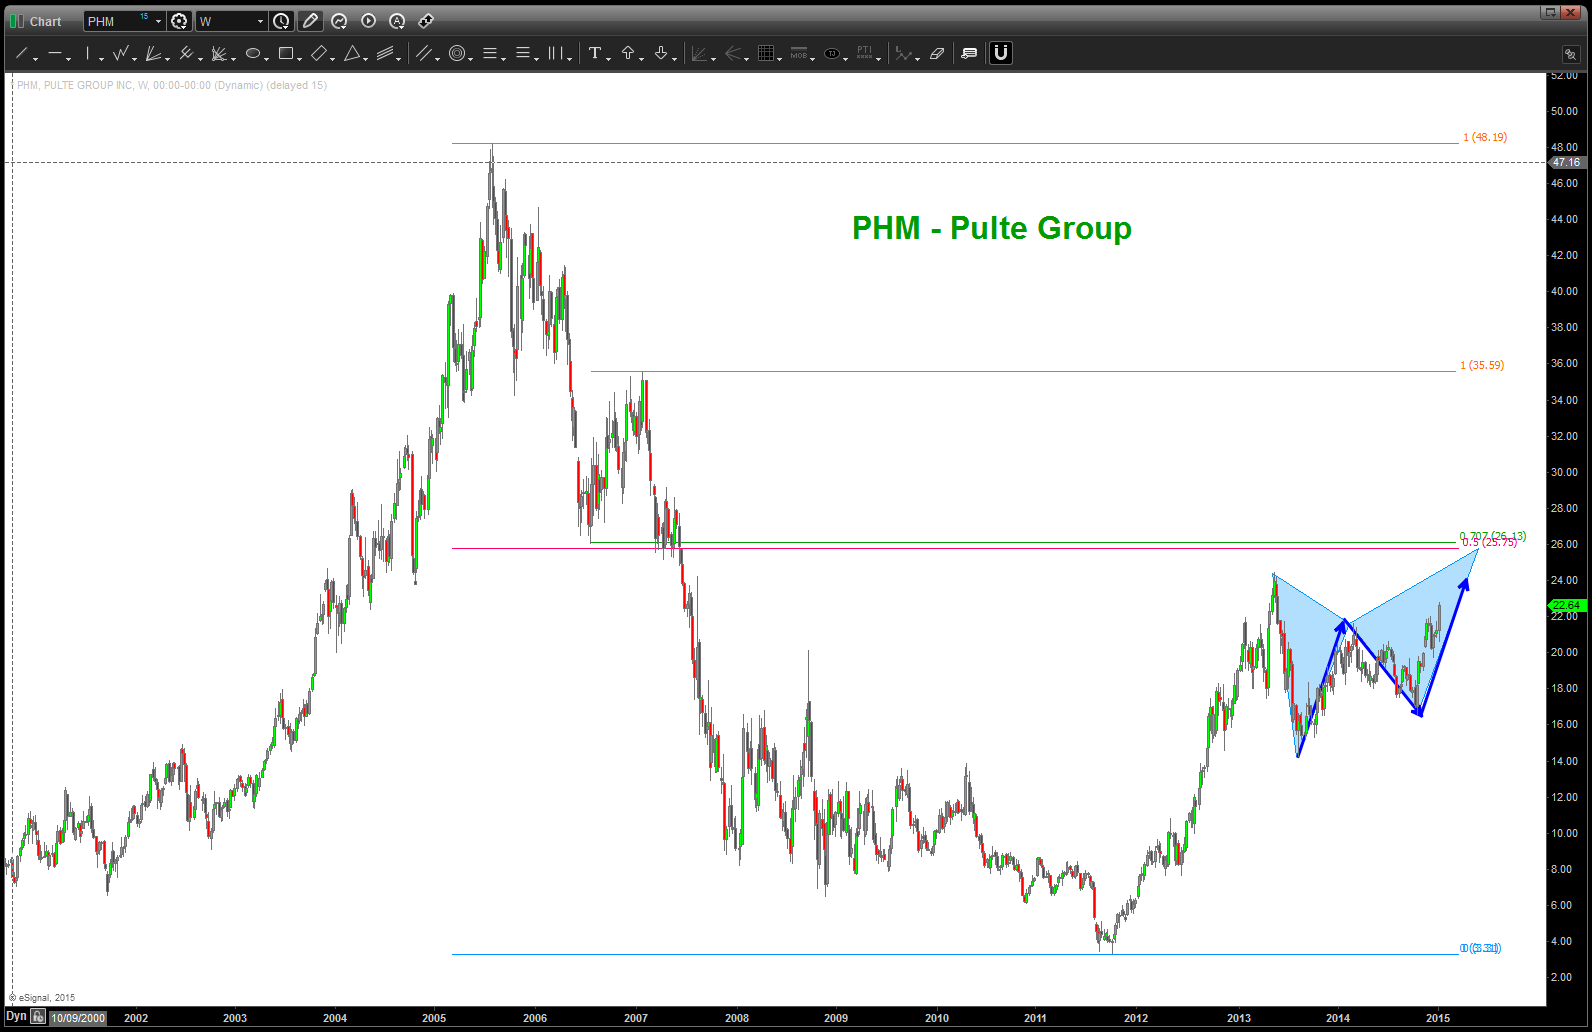
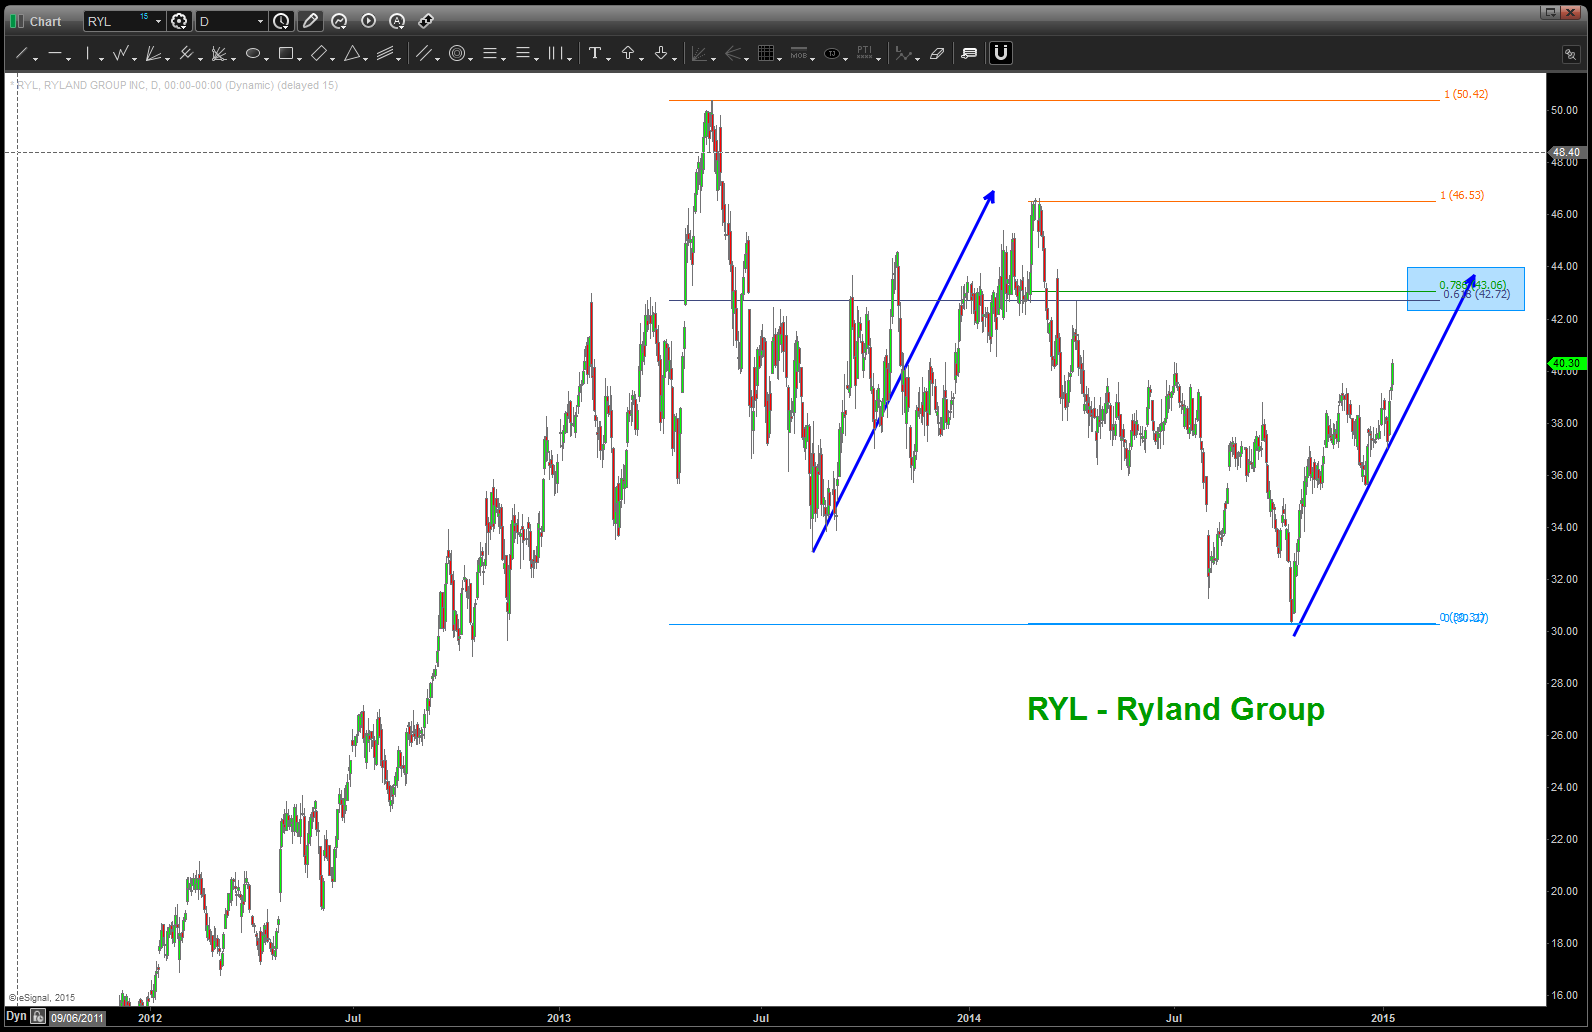
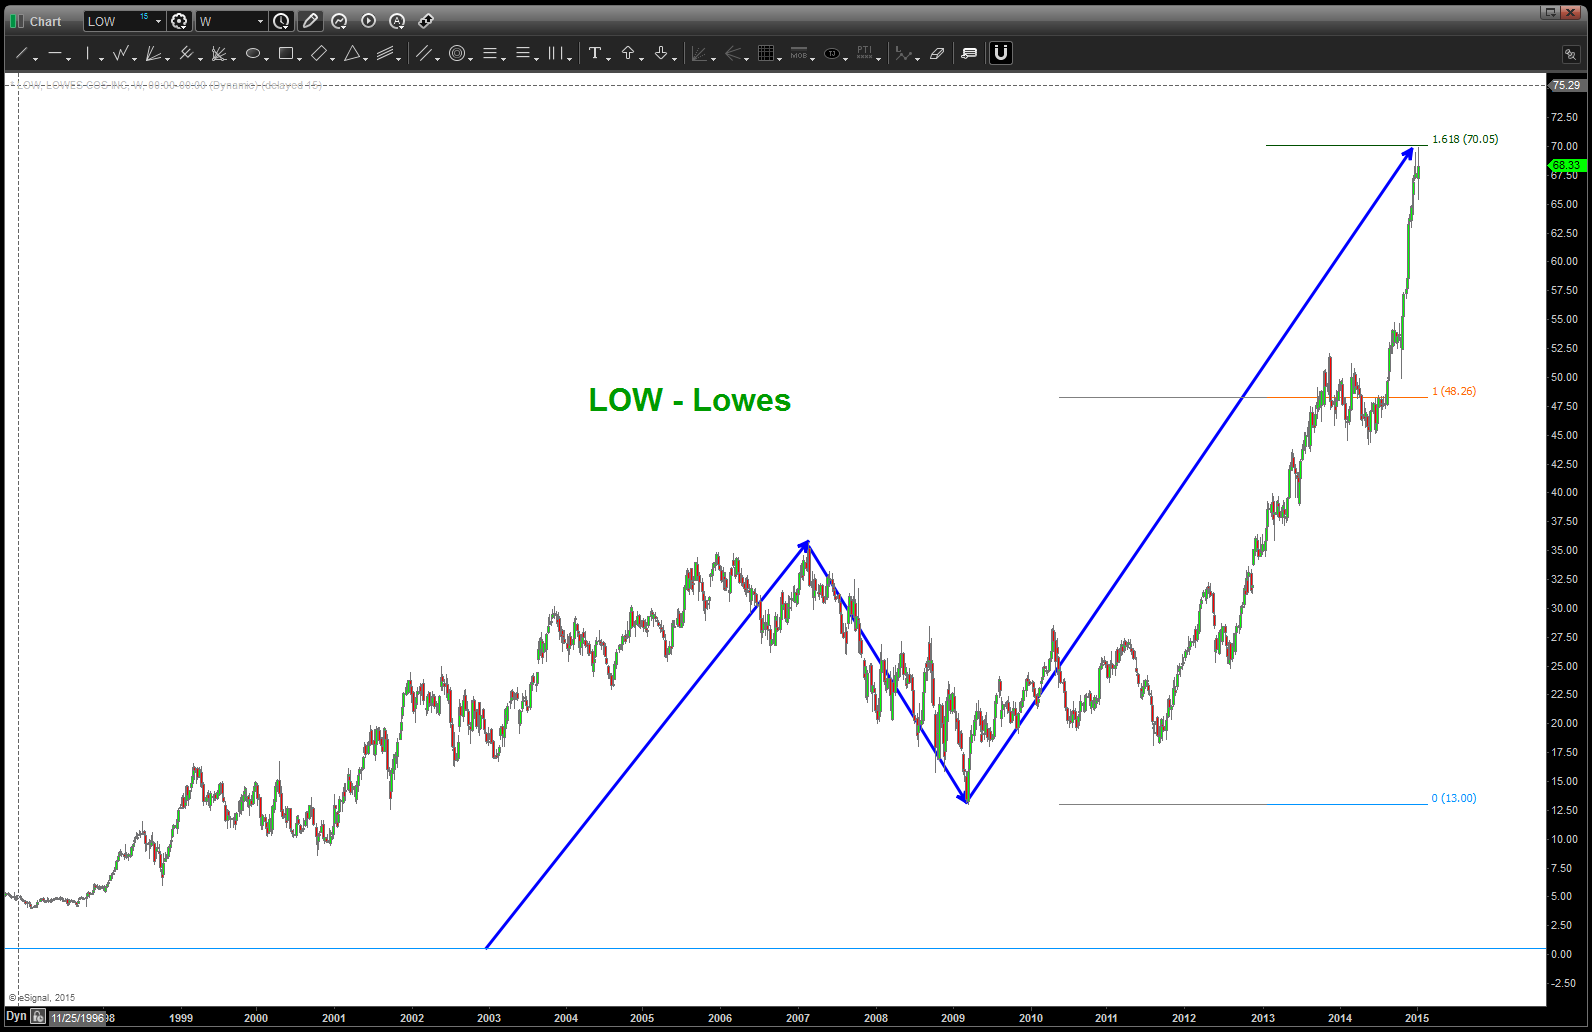
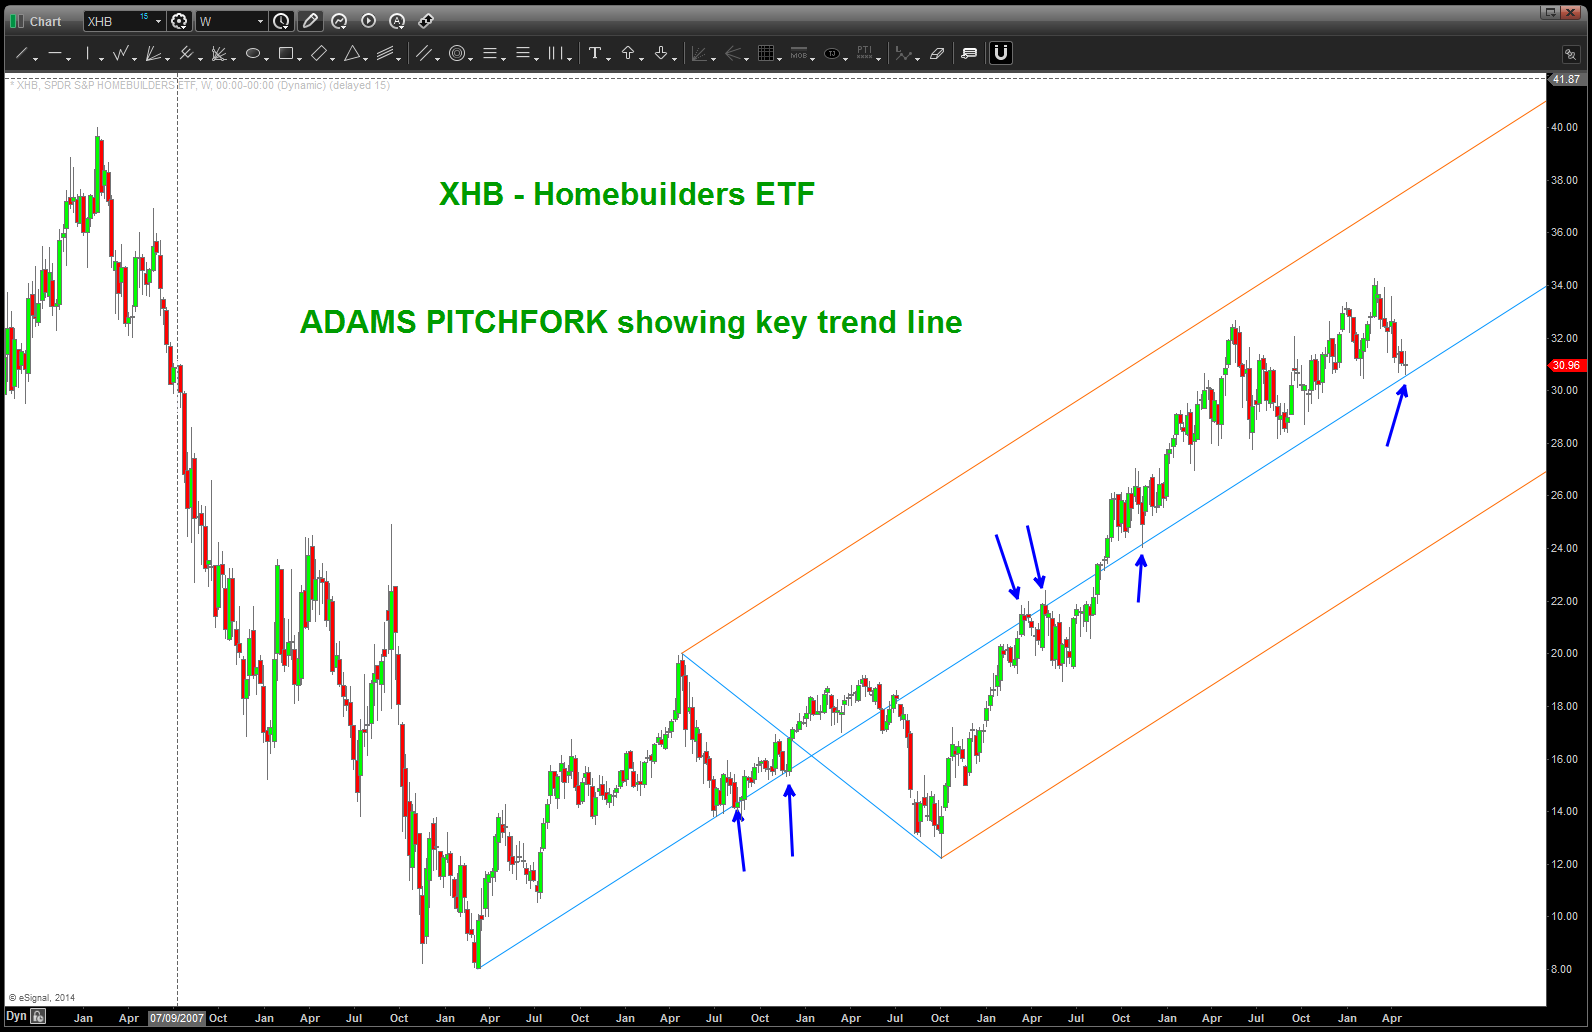
as you can see from below the Homebuilder Index (XHB) has broken out most recently from the congestion area highlighted in the link below and now has a target of 38. Not bullish or bearish – just a pattern guy. so, as you can see below, we are finishing a PATTERN but what about the top 10 holdings of this ETF?
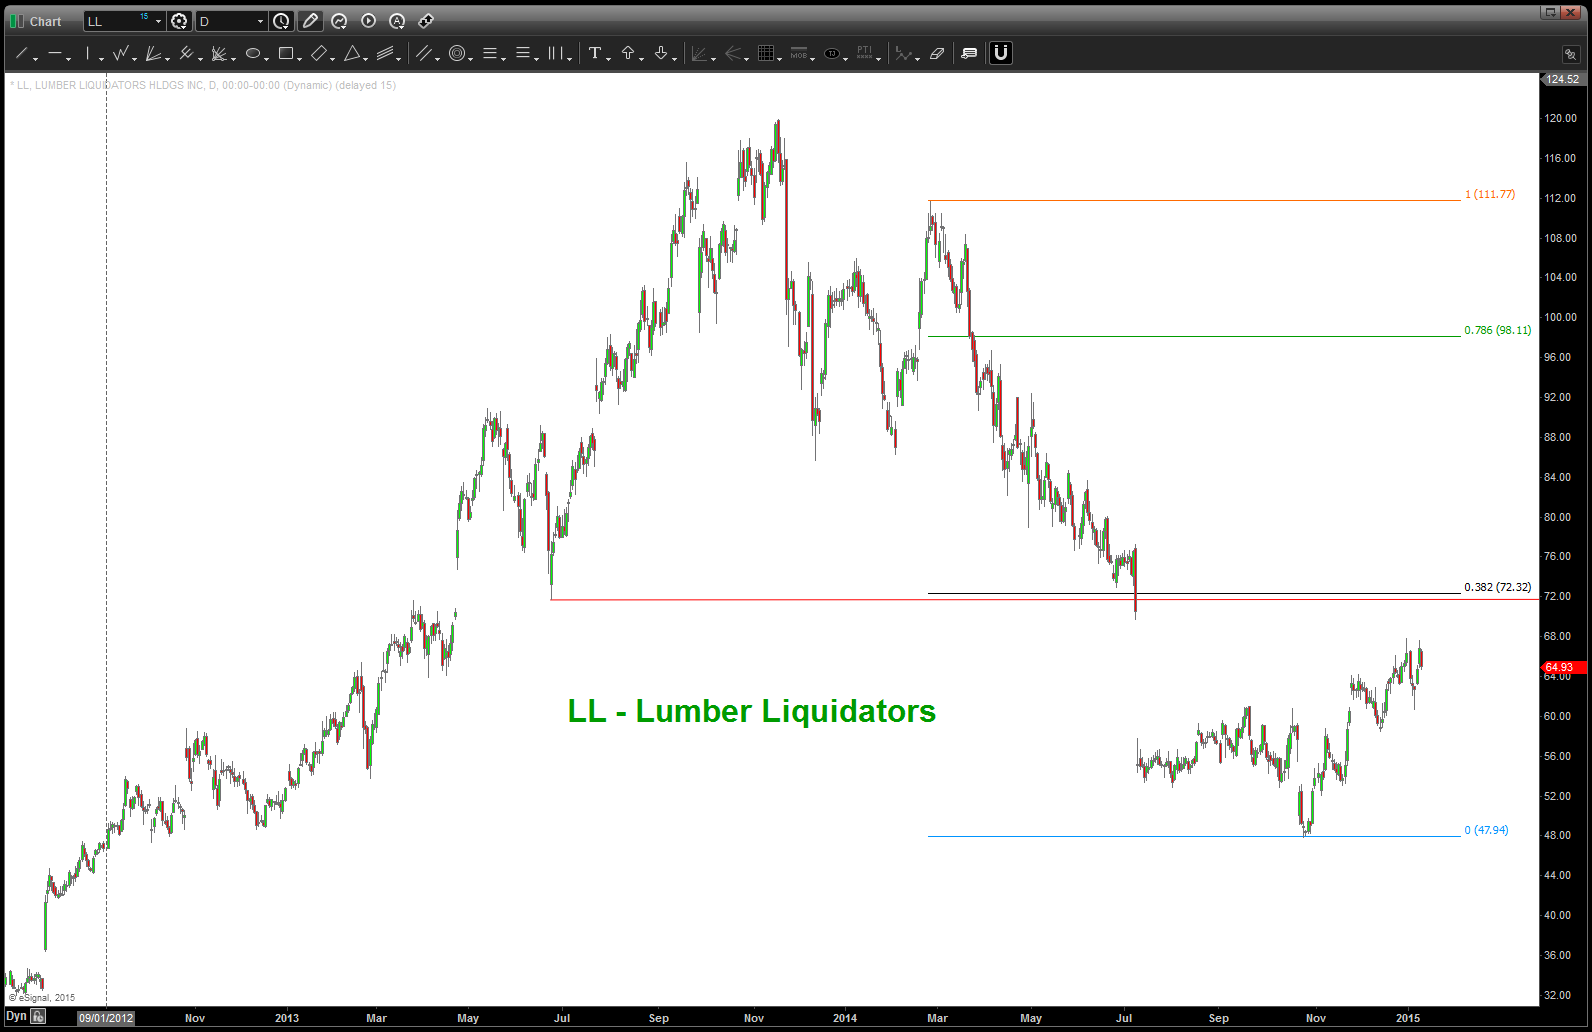
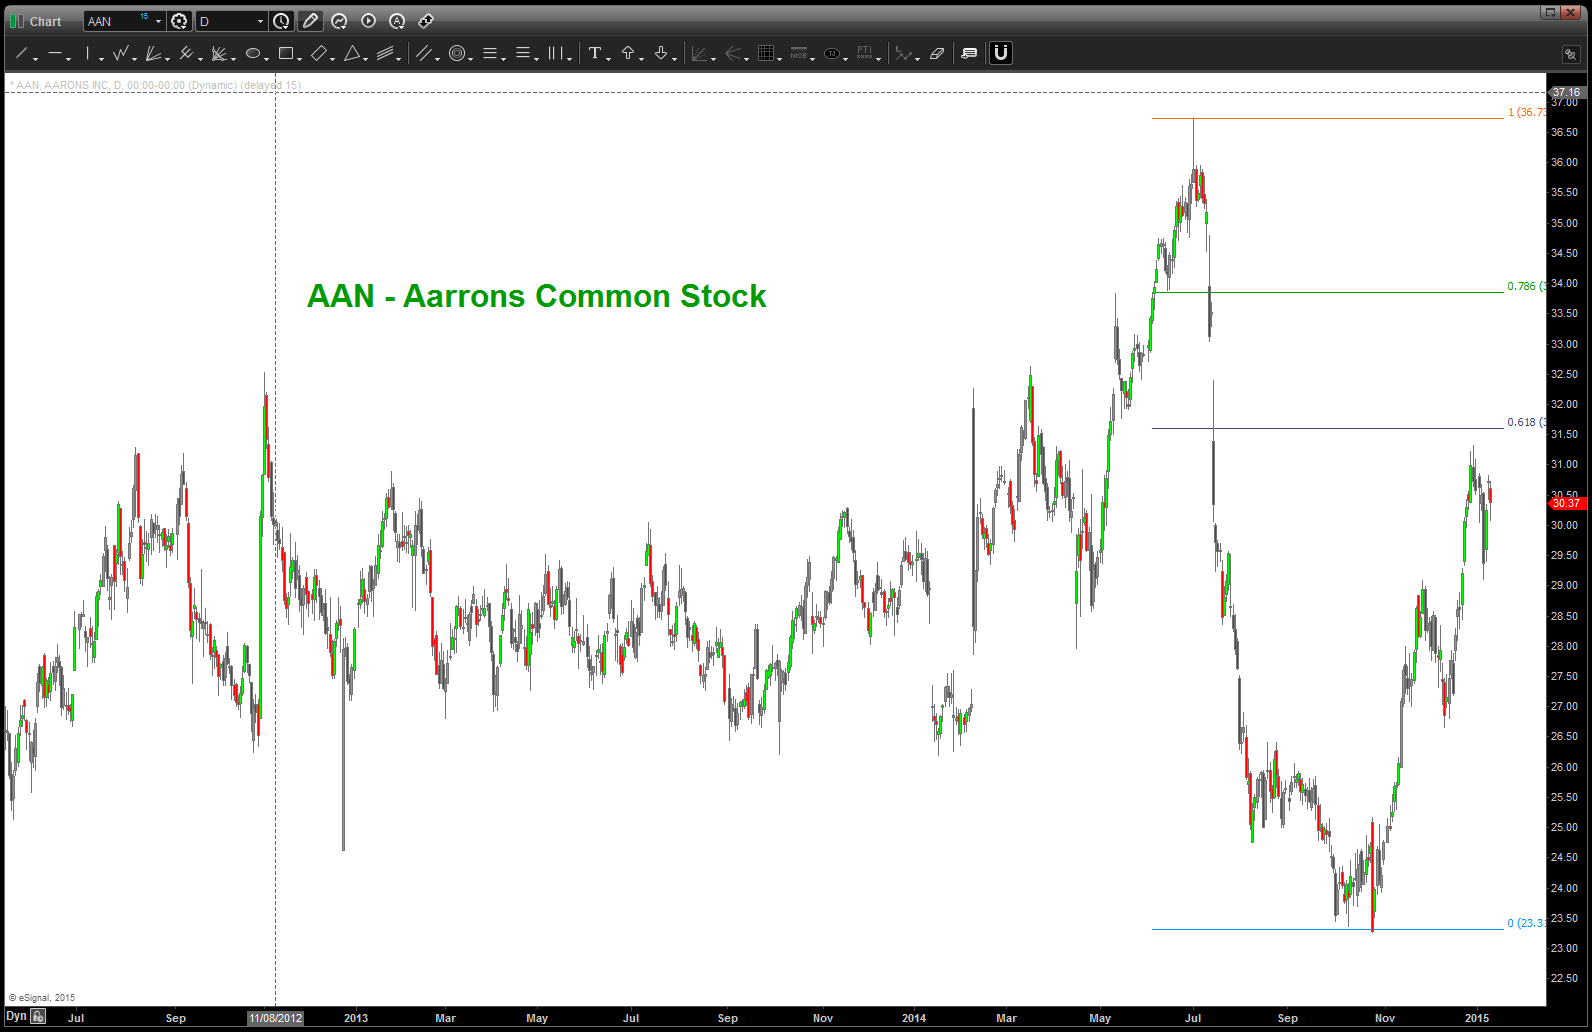
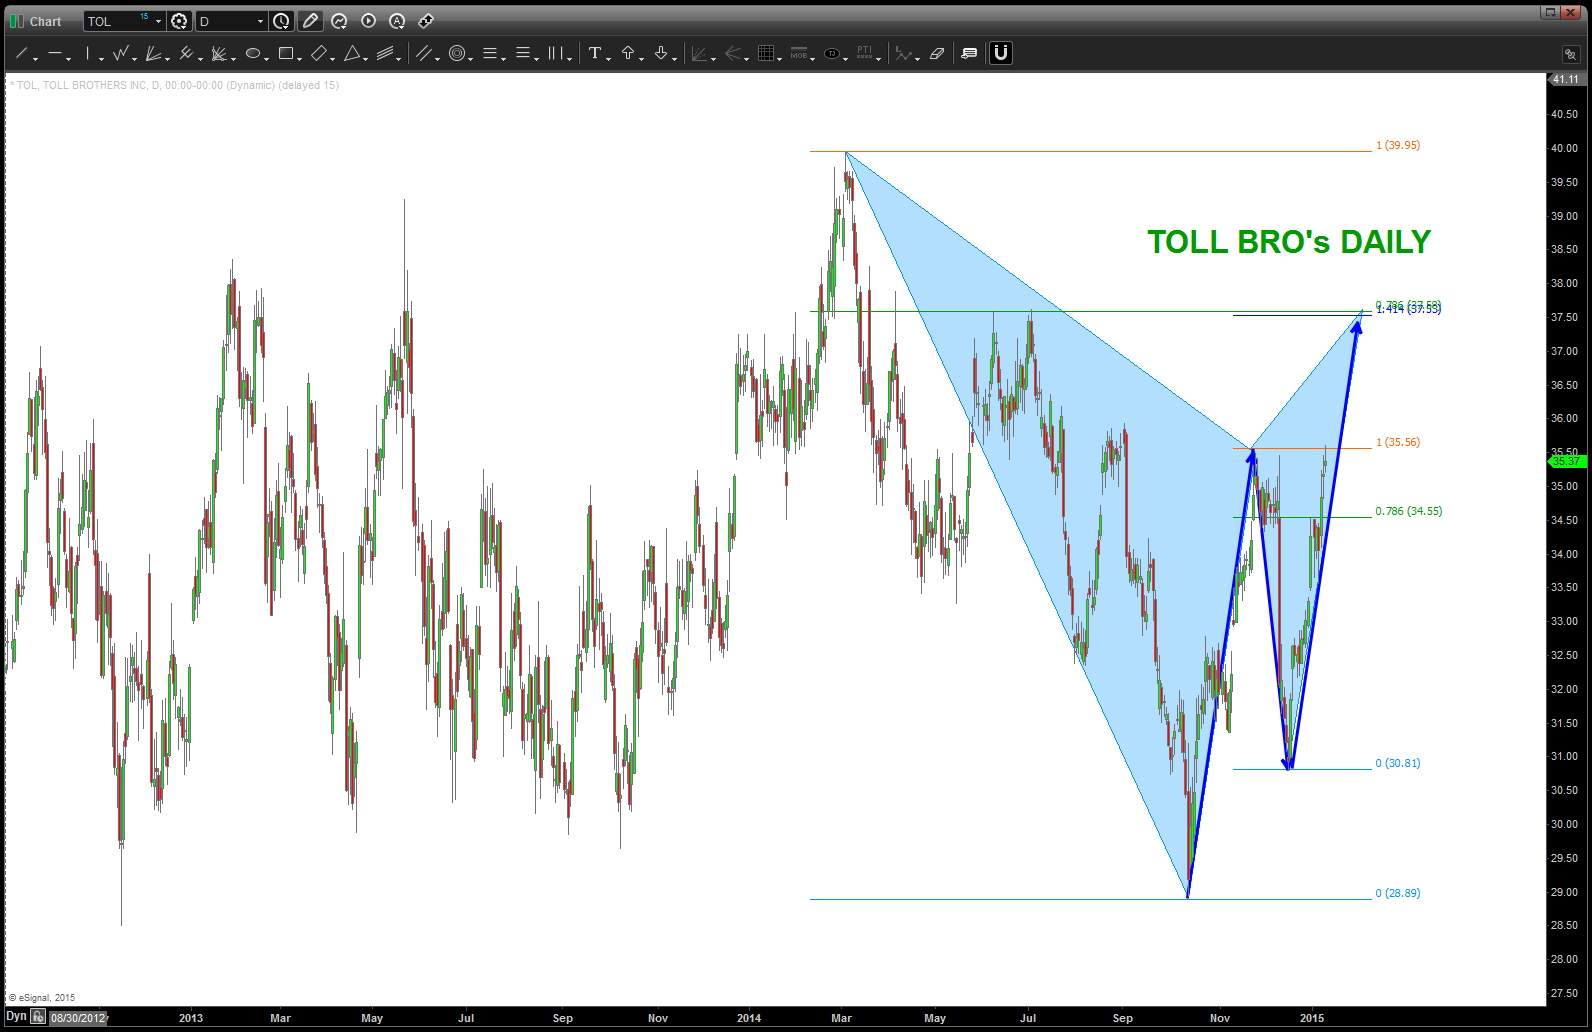
CLIFF NOTES: all top 10 XHB components have SELL PATTERNS. So, IF these work then they will weaken. IF NOT then this ETF should make new highs. We know our line in the sand …
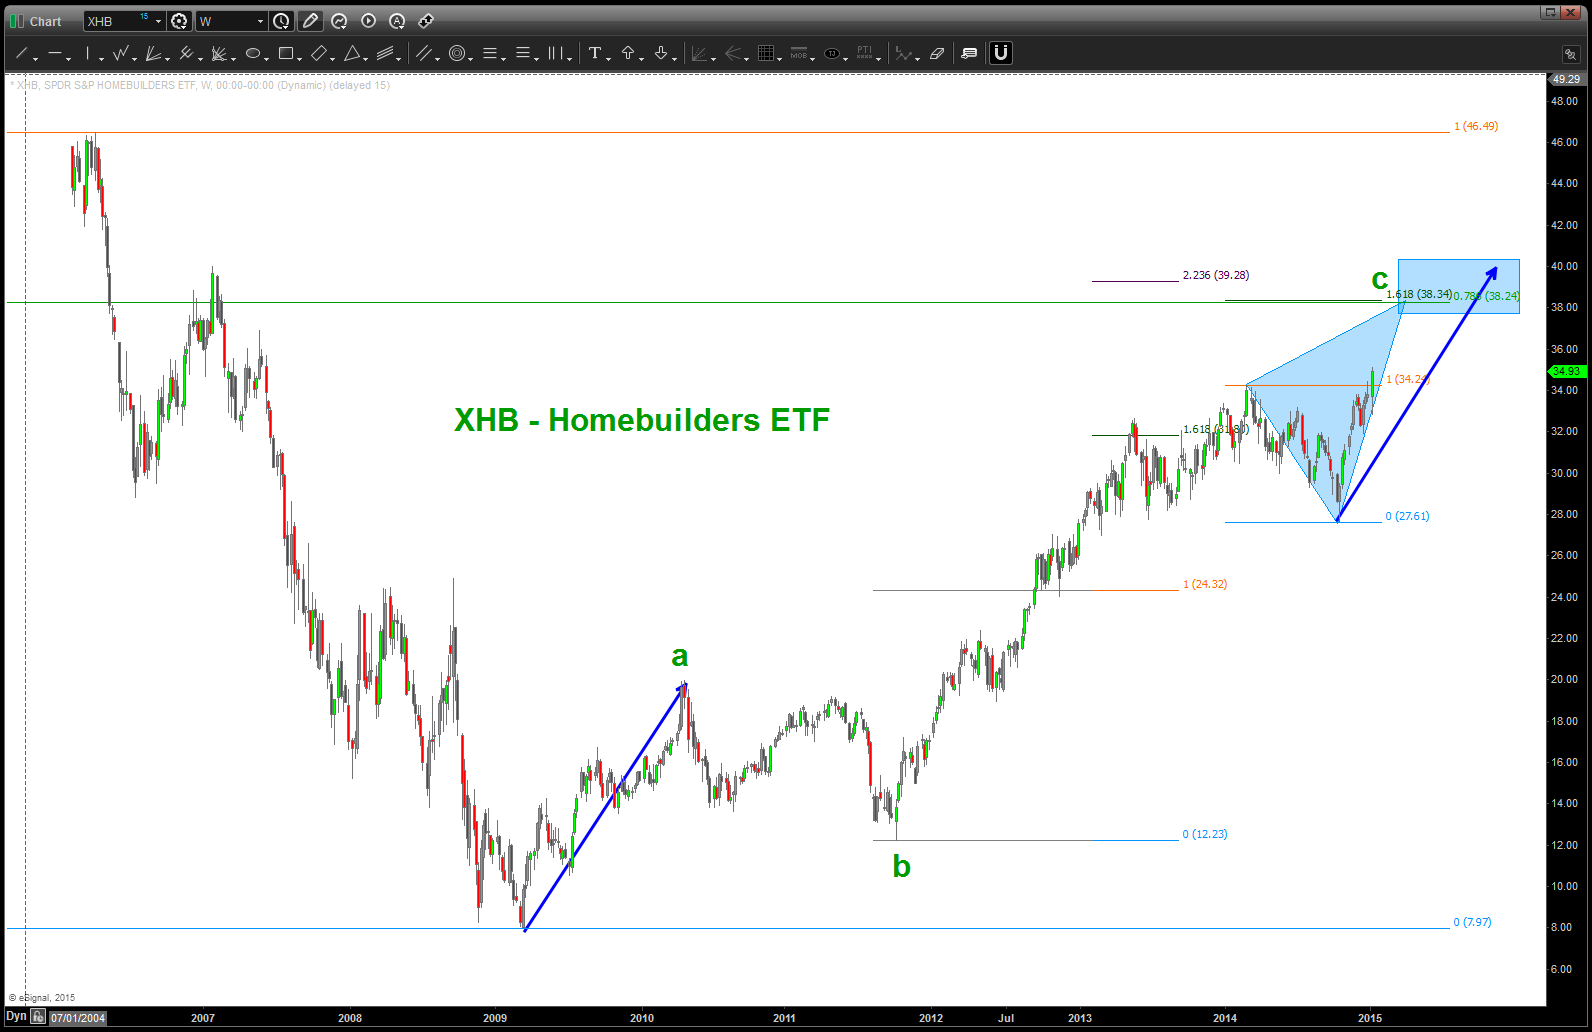
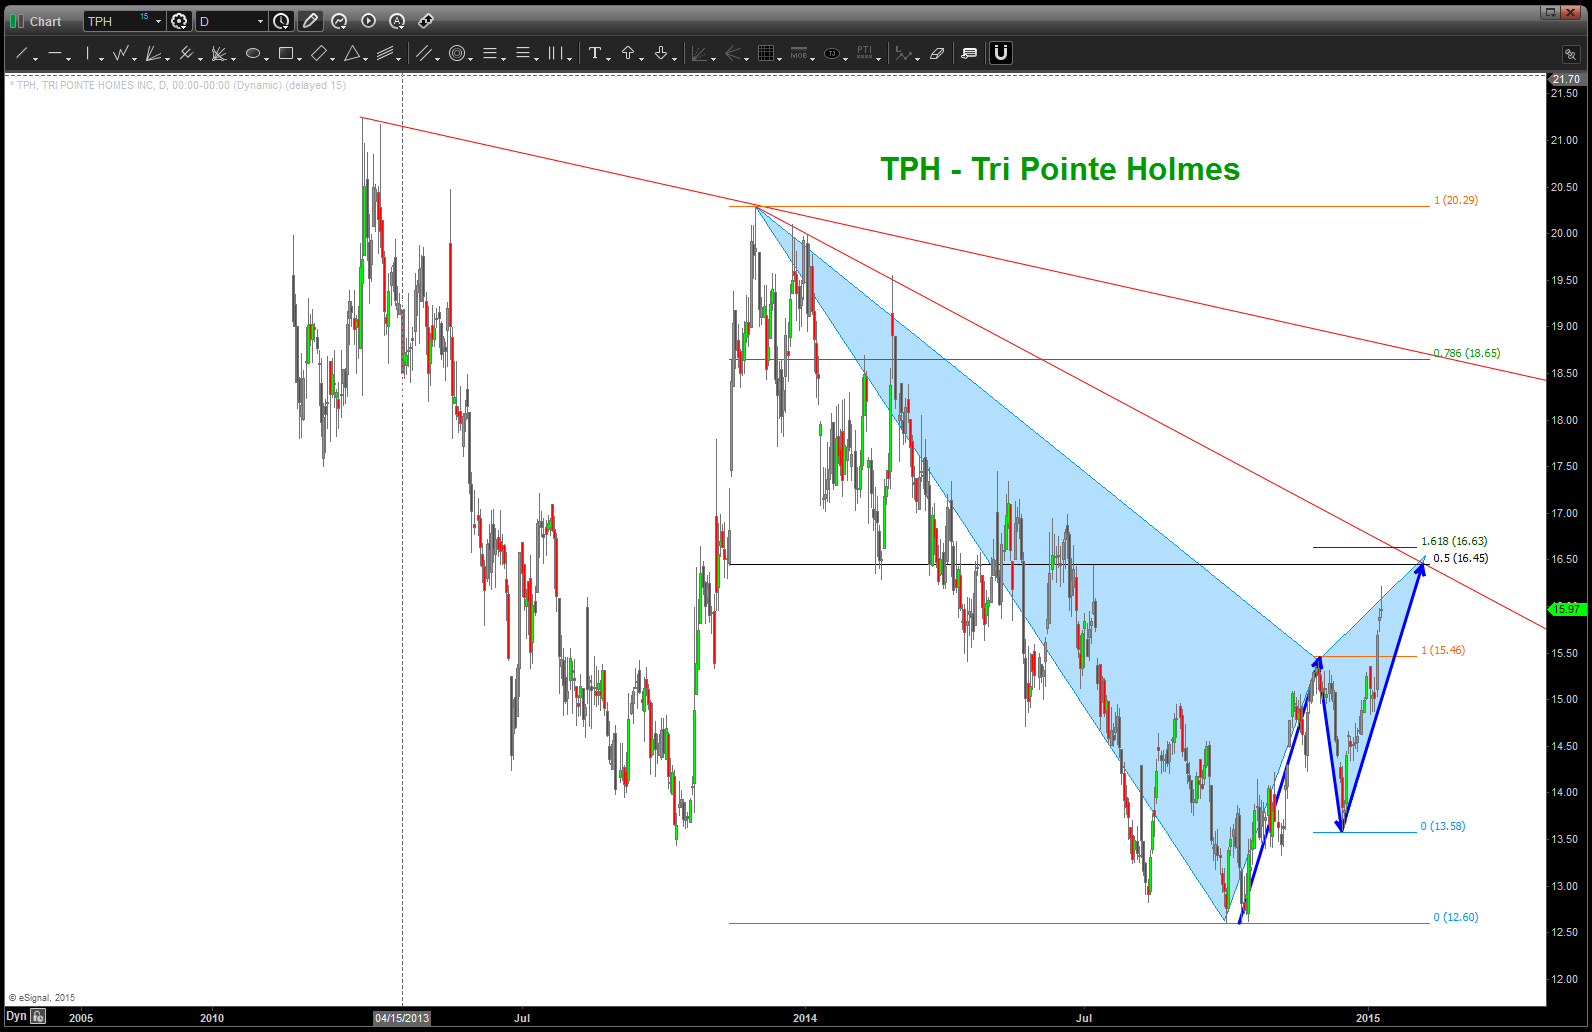
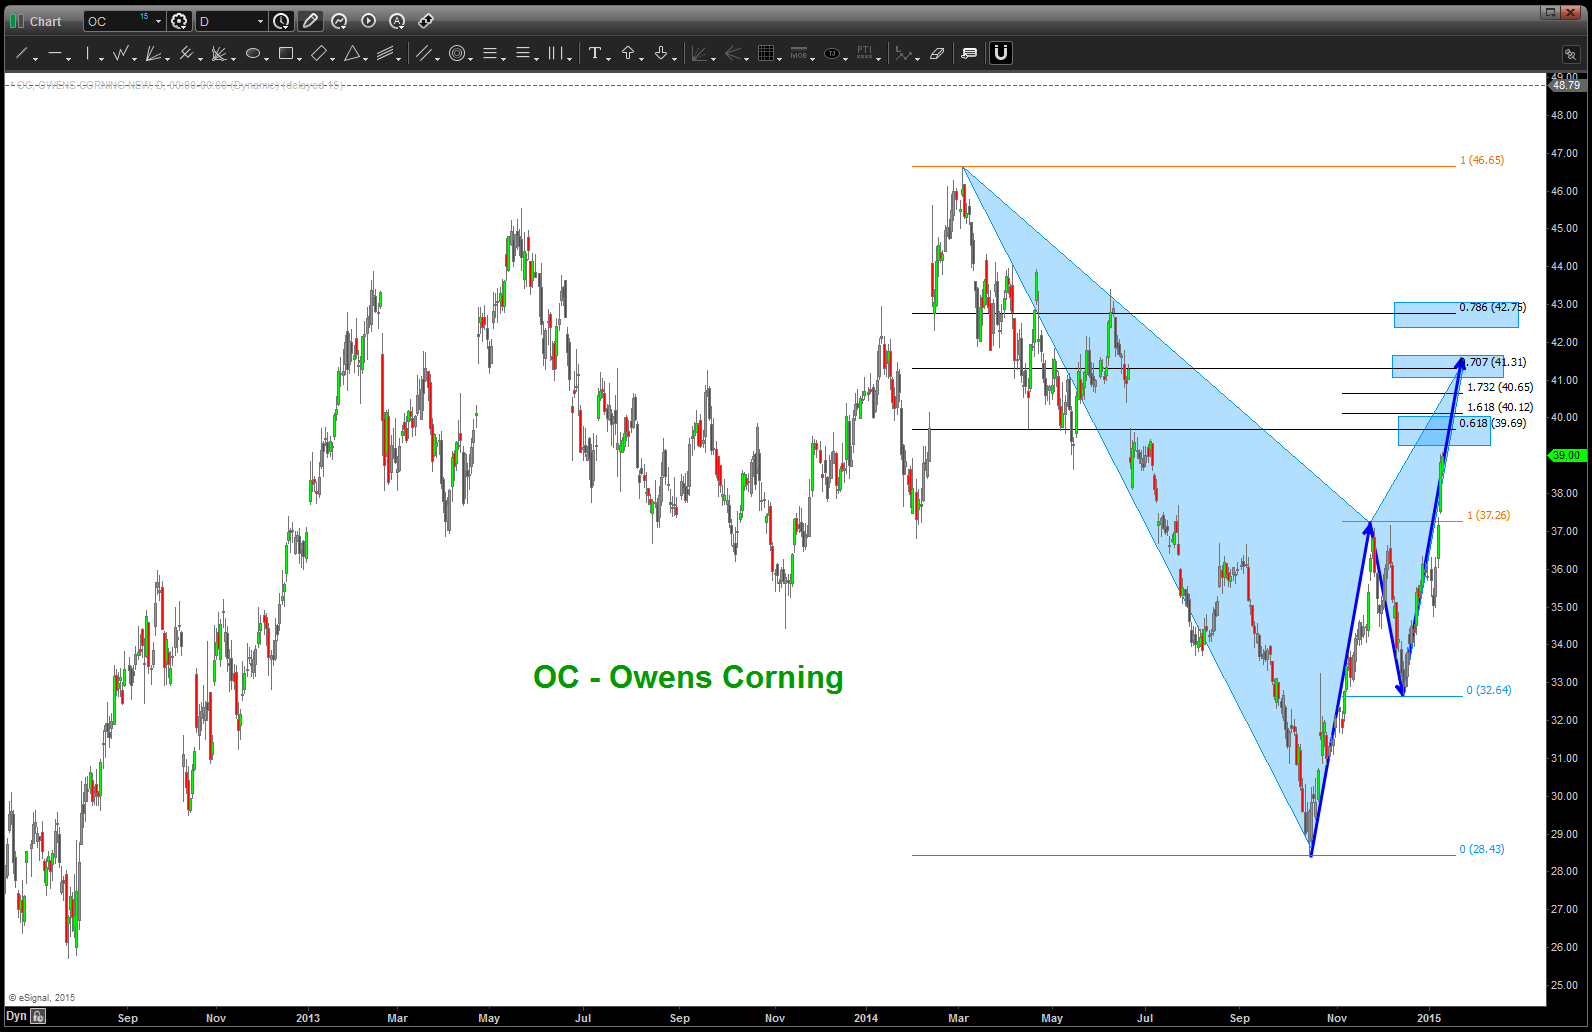
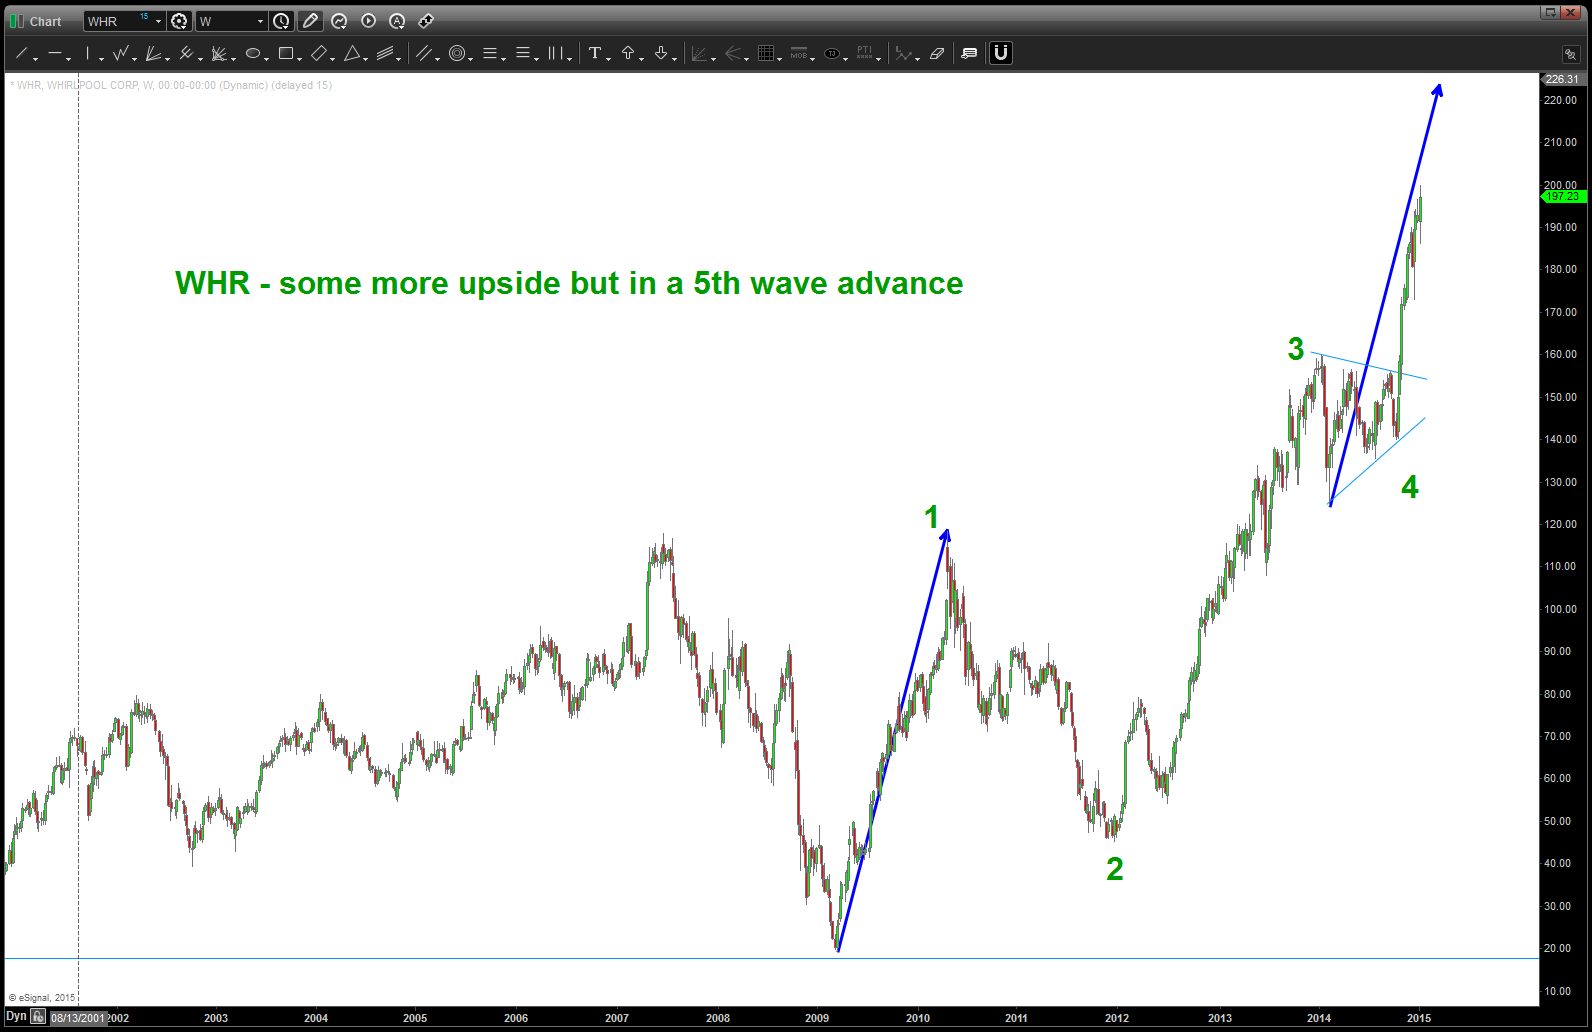
Here are the top 10 holdings of XHB in no particular order – all are showing SELL PATTERNS
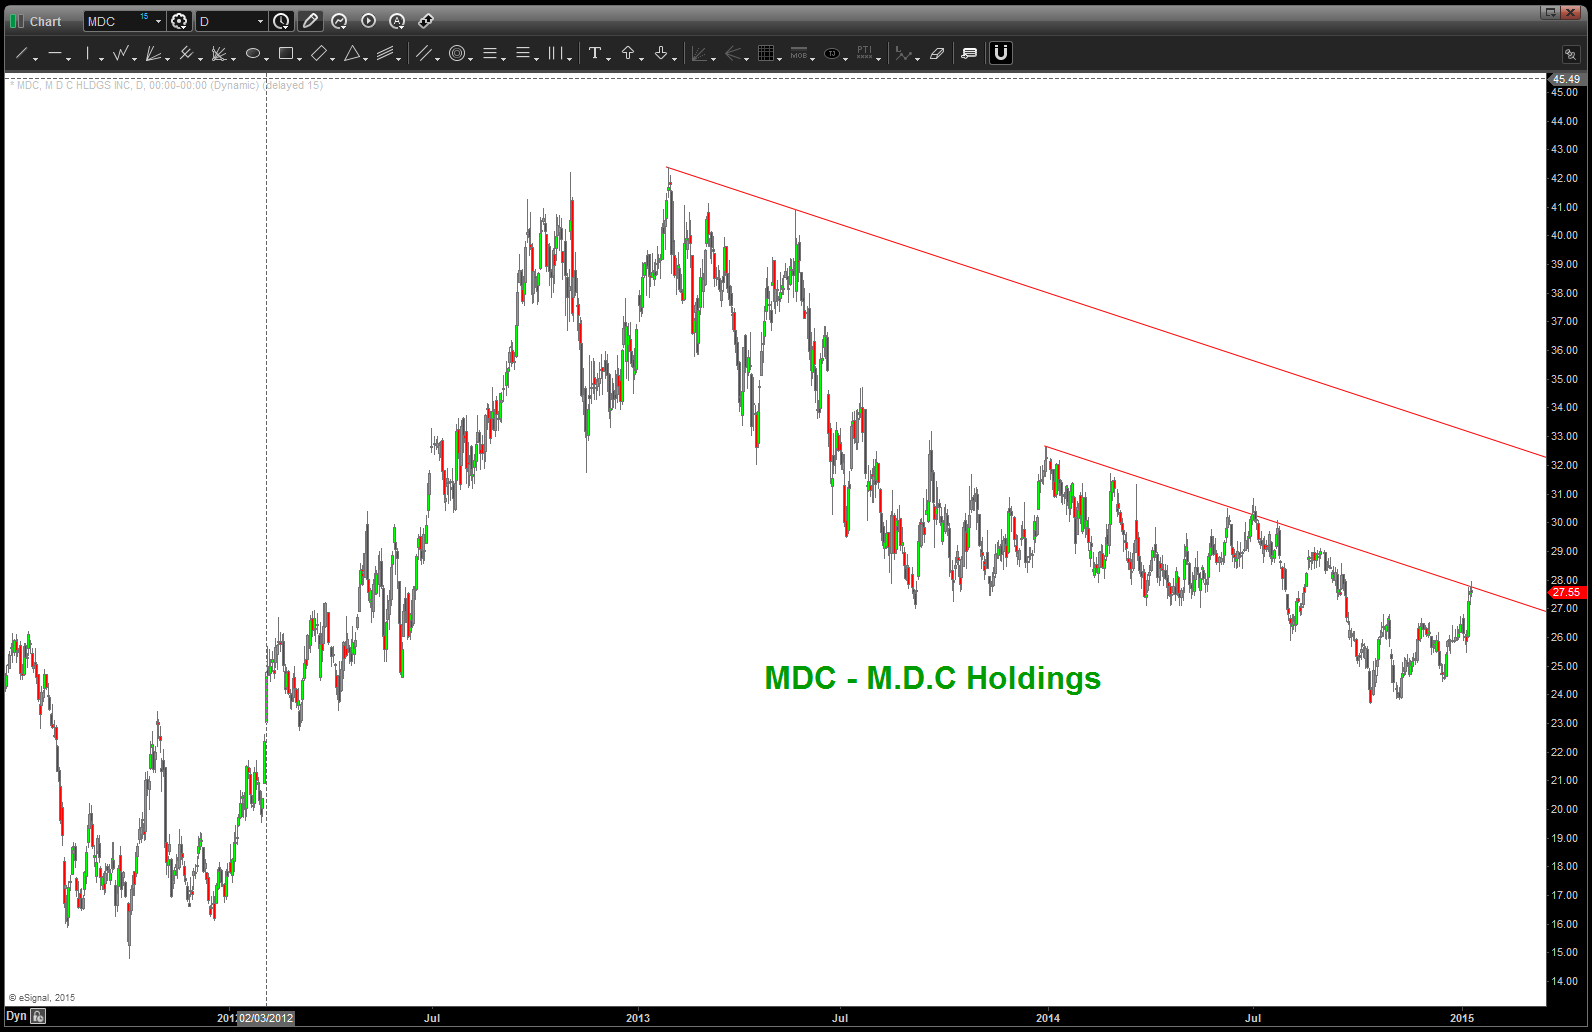
CLIFF NOTES: can see why this current level is important using Adams Pitchfork Method. The Head and shoulders shown in the post below never materialized by breaking the neck line and we rallied a buck or so higher. Still looking for this to be an “end of move” pattern …
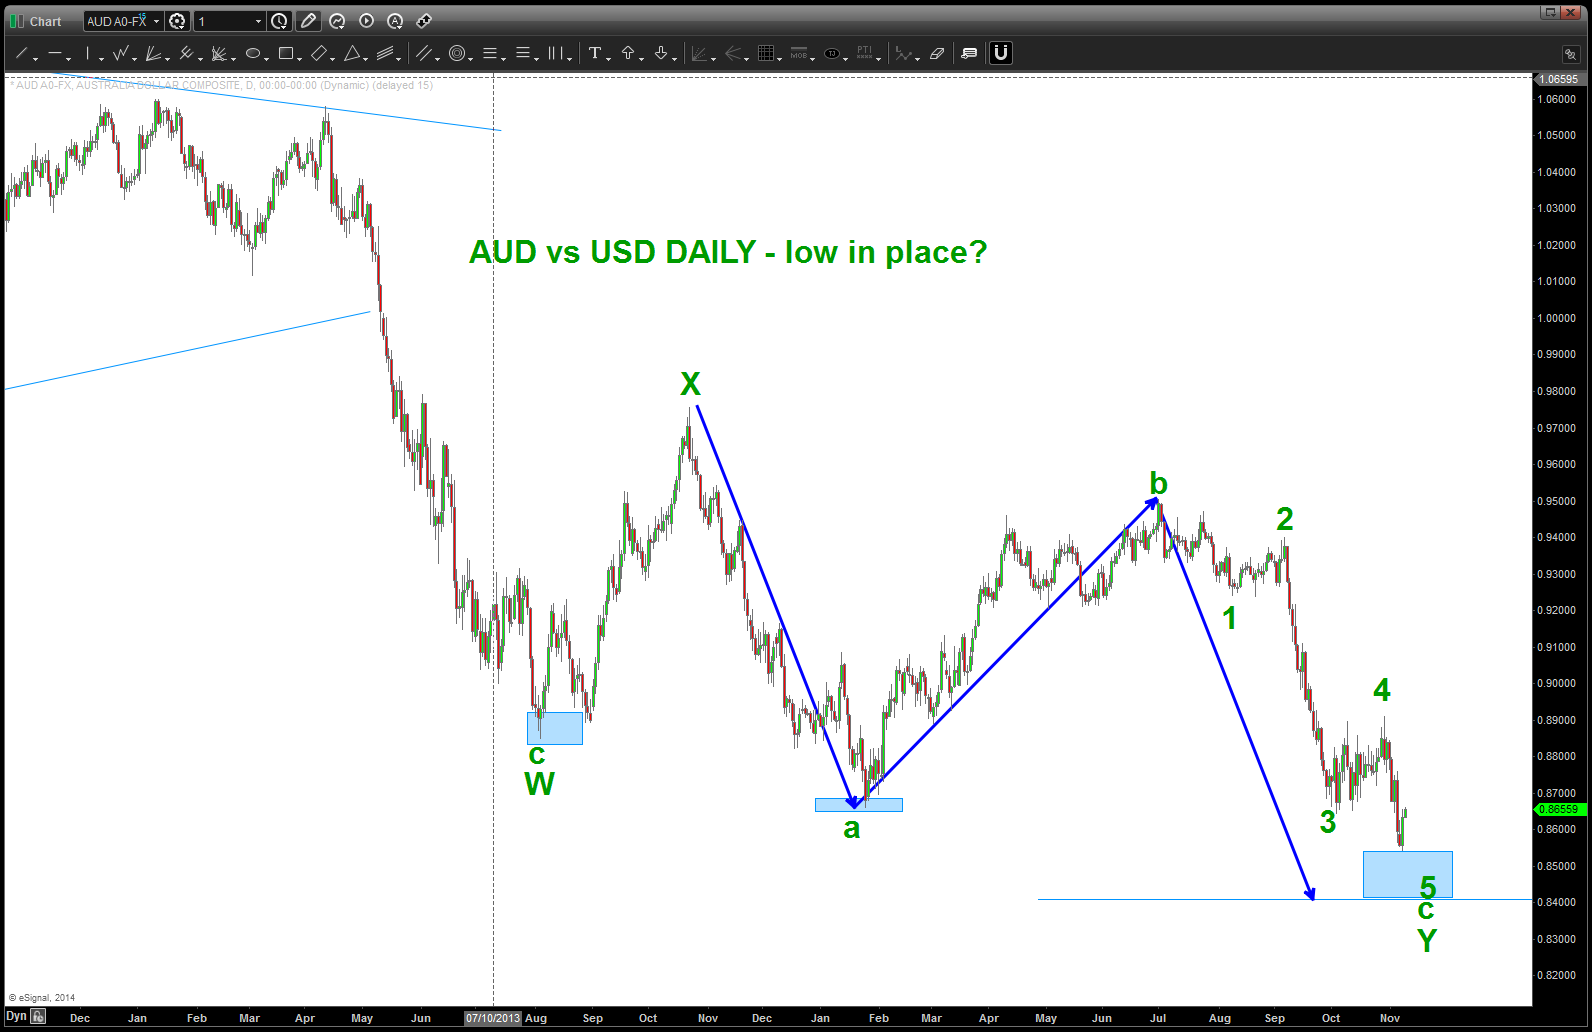
Aussie vs USD bottom in place?
Posted on January 12, 2015 Leave a Comment
Folks, back in October the post below the two dash lines was searching for a low to be in place on the AUD. The form and proportion were just about right. However, w/ the big move in crude, the interest rate extravaganza and the a whole host of other fundamental reasons the real issue is the PATTERN level didn’t work … it went approximately 300 pips below. HOWEVER, the overall thesis that the Aussie is bottoming versus the dollar still holds true. It’s showing some nice strength tonight …would love to get a very nice pullback to go long in/around these levels.
Updated charts below:
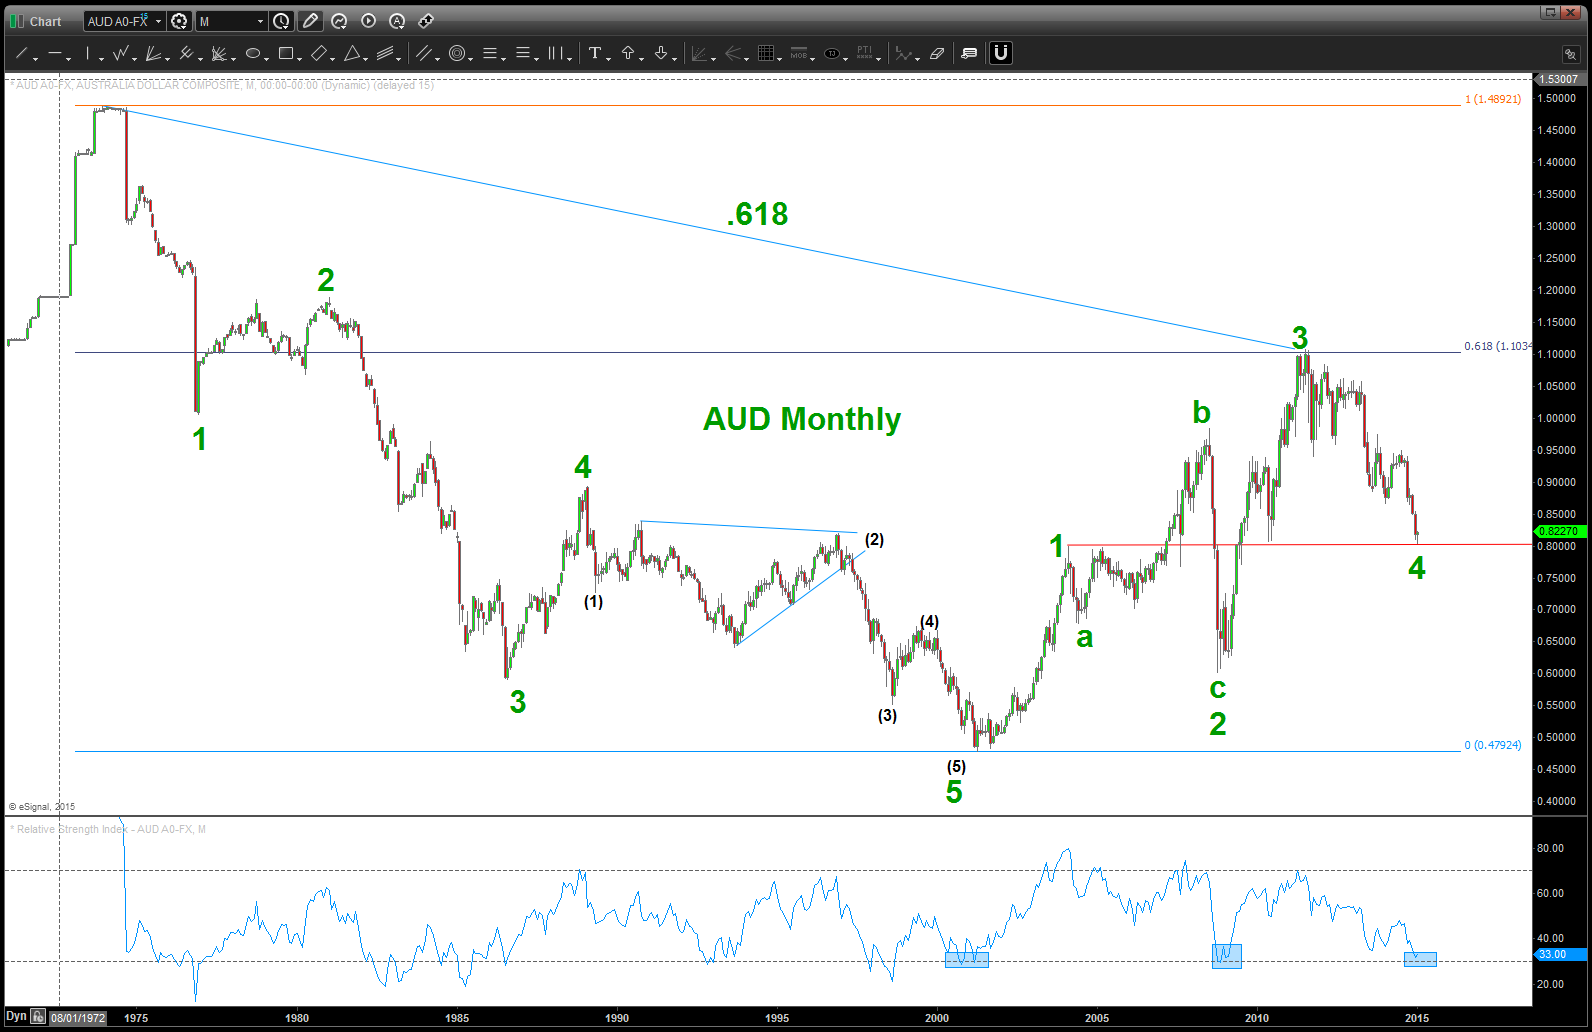
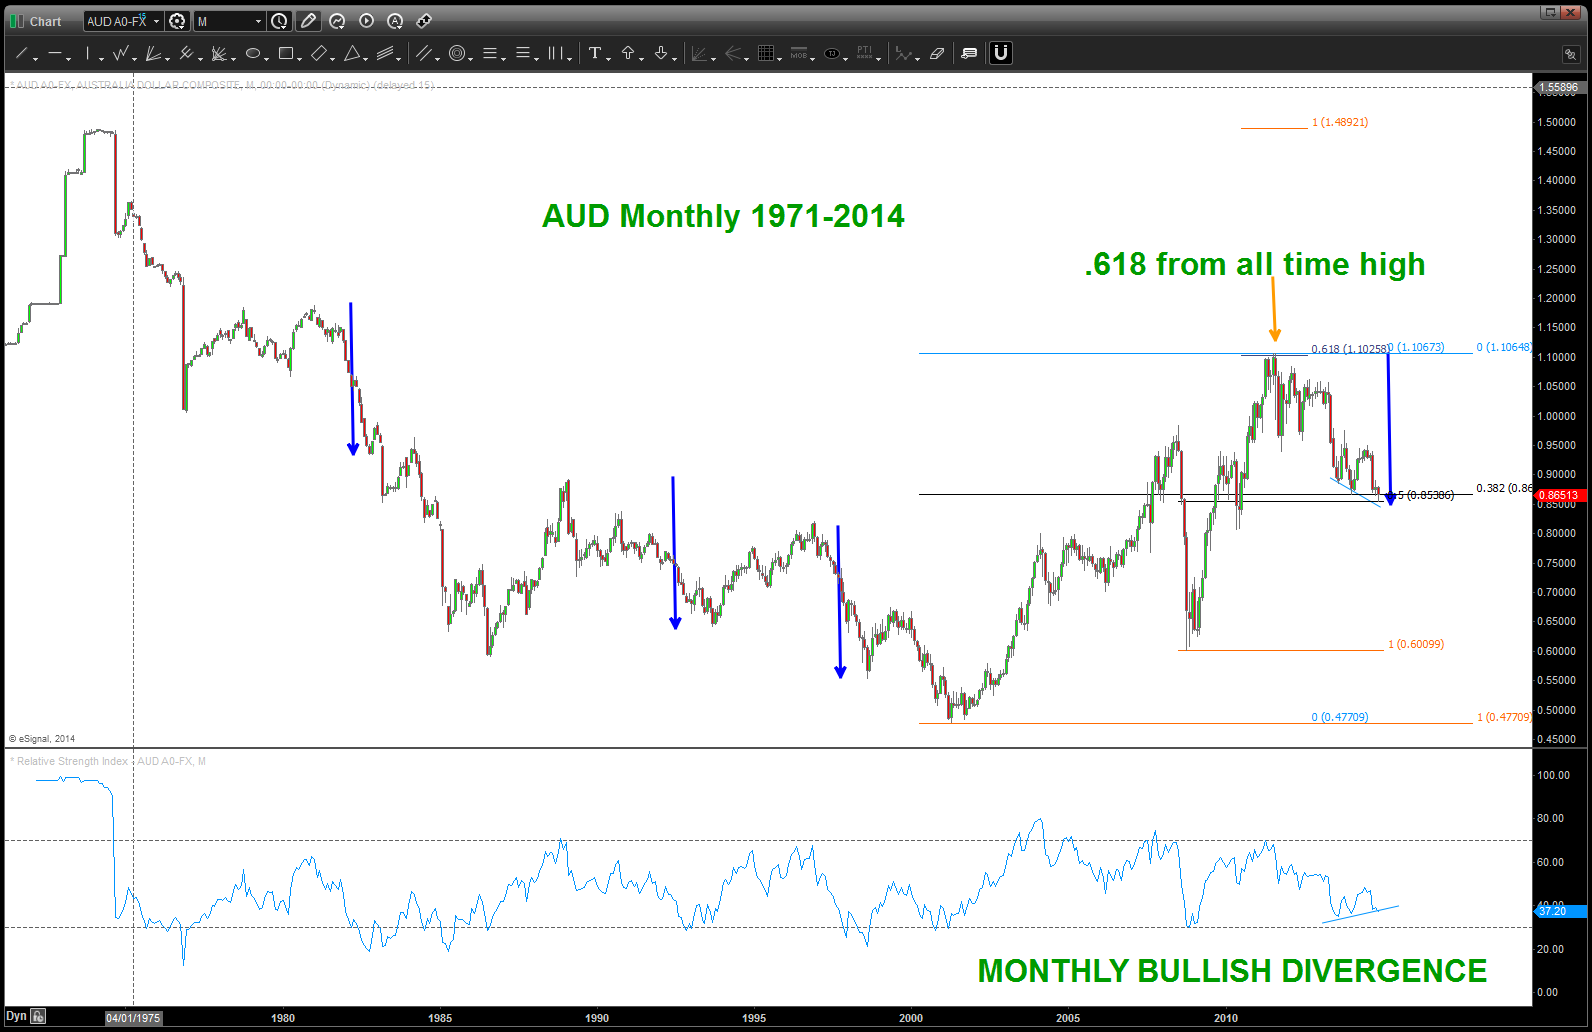
Note the monthly RSI levels … the BIG MOVES UP occurred right where we are sitting. Also, a case can be made that 4 is complete and we are going to new highs …
last time I checked the Aussie wasn’t part of the US Dollar index … so, watch this one closely. At a minimum we are completing/completed an A and a nice B wave up is to occur.
let’s just get on the right side of the trade and right now that looks like bullish entry for the AUD vs USD.
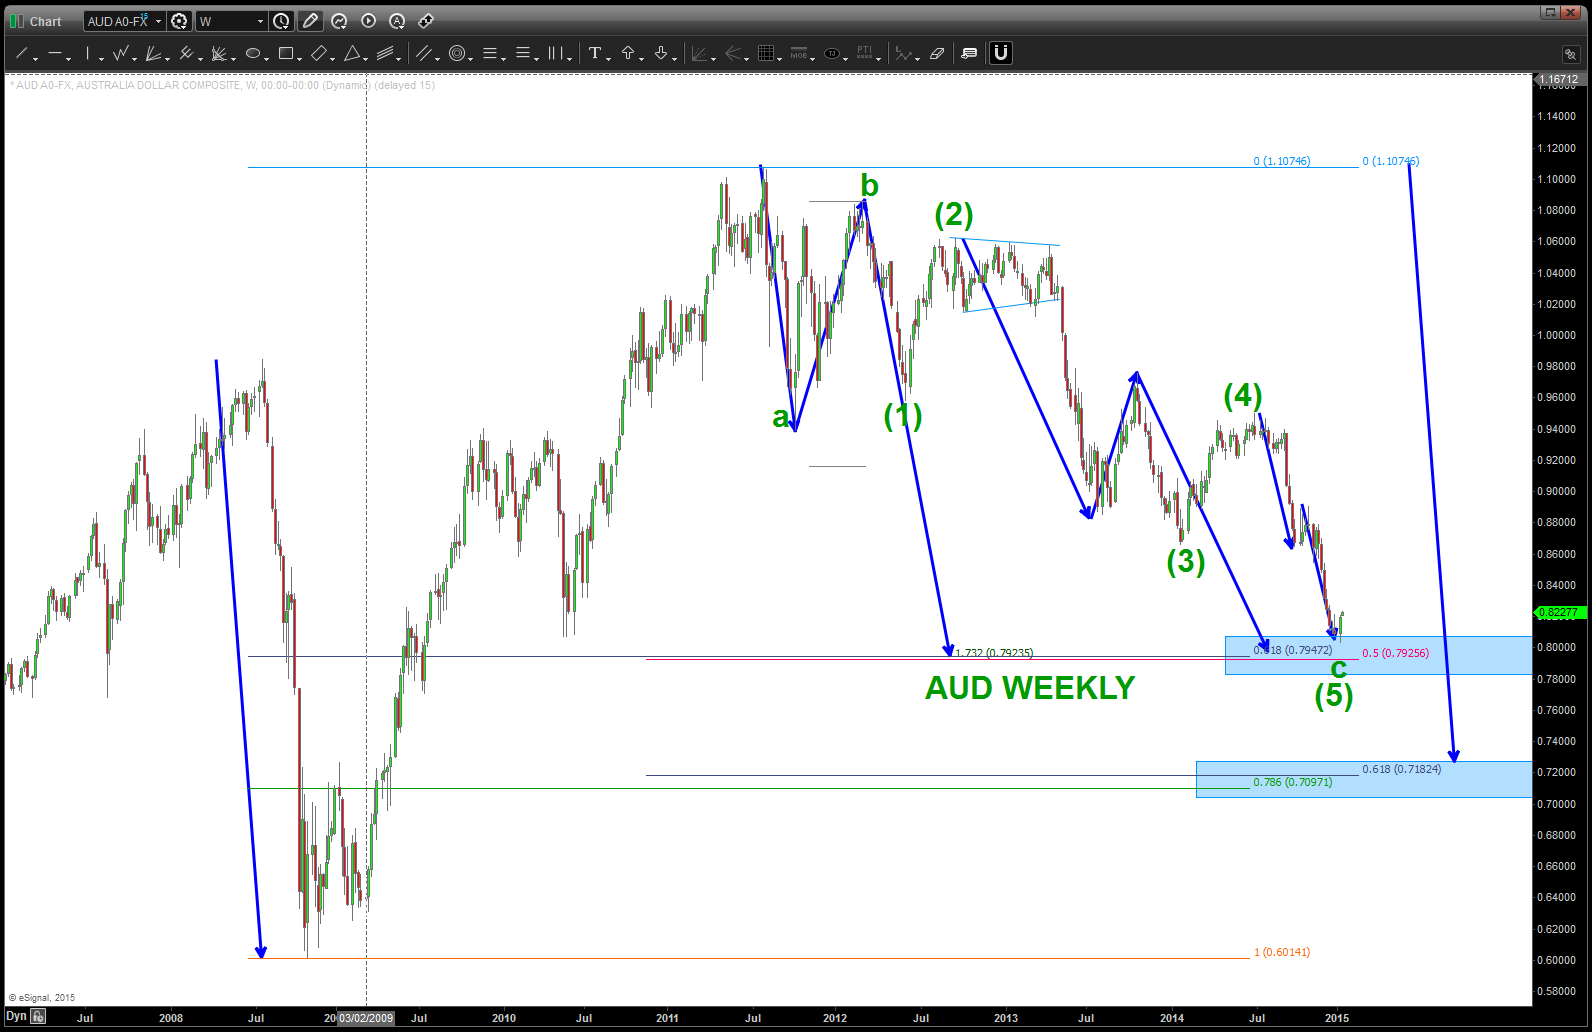
The Aussie has been correcting for a while and, folks, the move down from 1.100 ish certainly appears to be corrective. What does that mean? We are “at” or “near the beginning of a multi year advance that will take out the high July 2011. Here’s the monthly picture …
TILT … everyone is talking about US Dollar strength – yes, but they are talking about the dollar index which the Aussie isn’t even a part of it. Or if it is the weight is negligible so in this case we have to take this pair as a single entity – not a weighted index.
here’s the weekly:
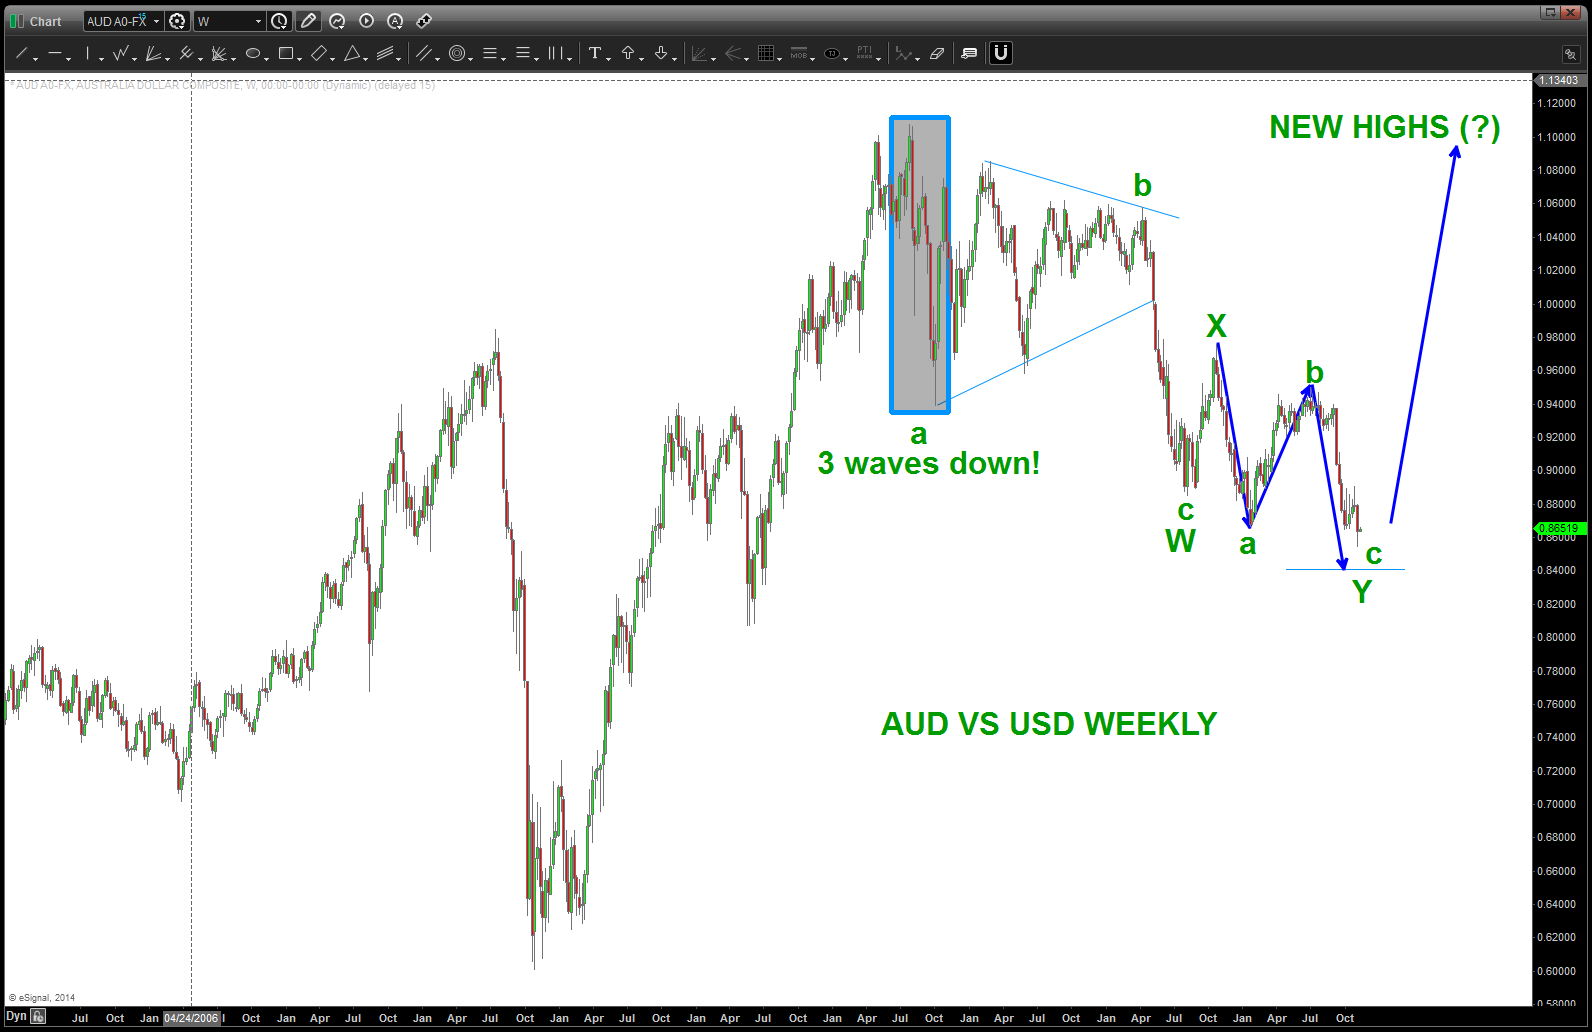
note the 3 waves down … that is the key. it was not a 5 wave movement. has this correction been complex – yes. But it’s falling right in line w/ a double three labeled w,x,y.
and, the daily, shown below, just completed 5 waves down. While it would be perfect symmetrical three drives to a bottom is we go down and attack 8400 – there is a good case to be made that a low is in place. we’ll have to wait for an intraday pattern to appear …
and finally, we’ll see the move down on a 60 minute chart is a clearly defined 5 waves.
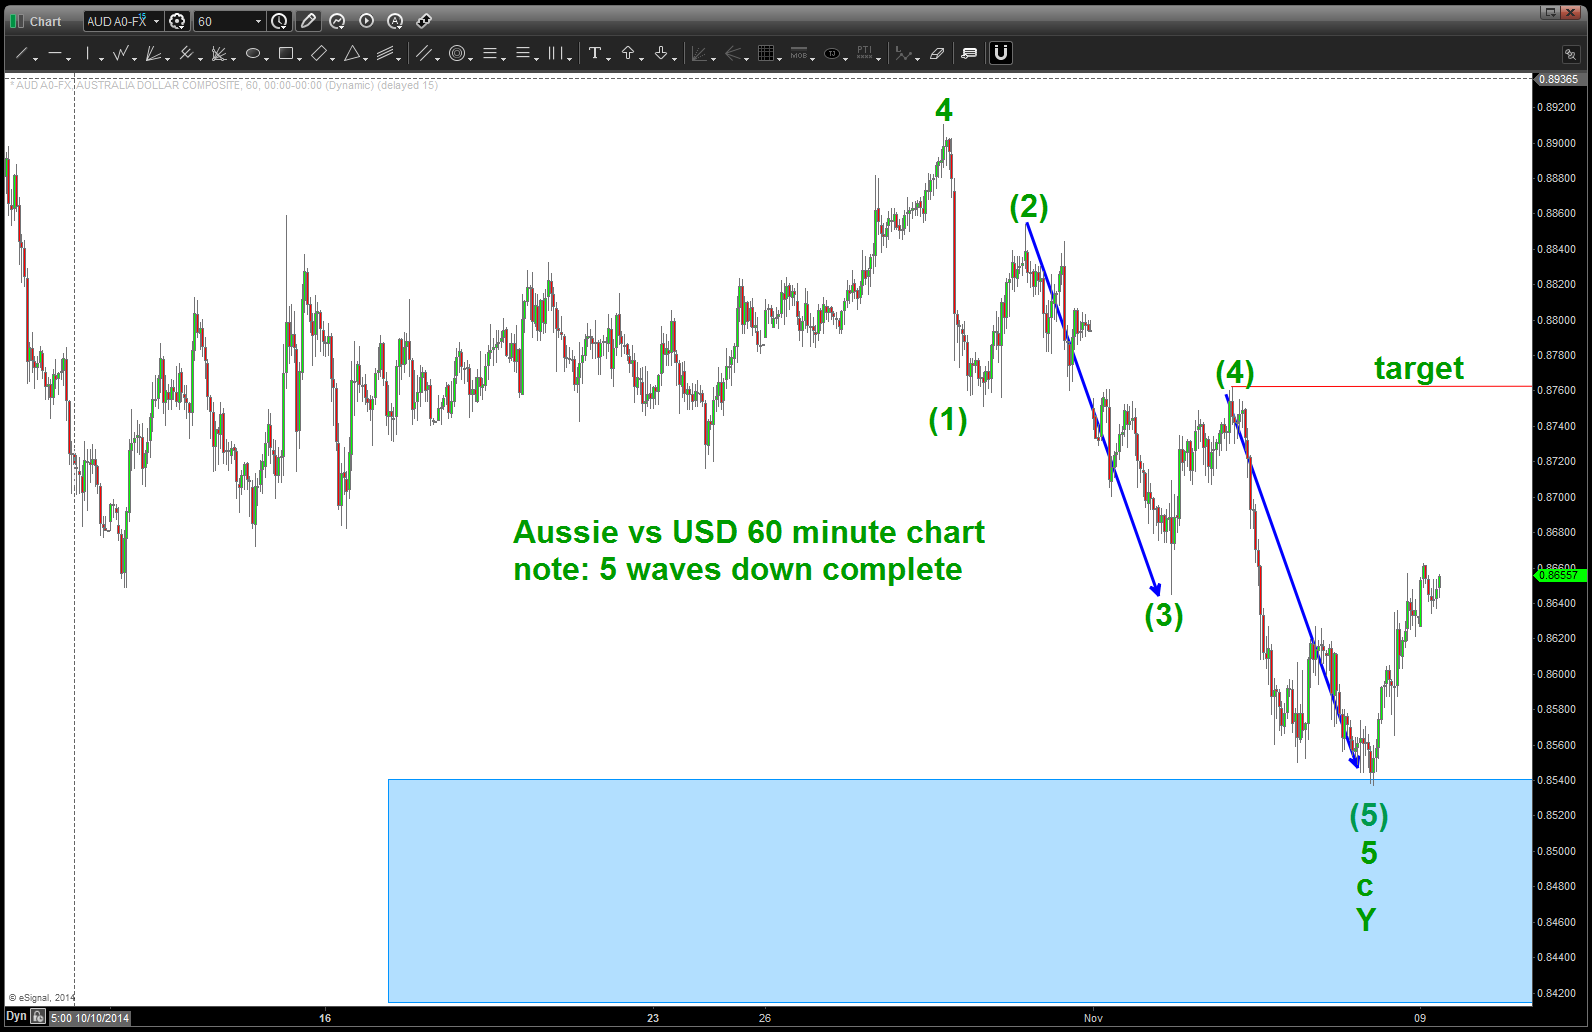
so … there ya have it.
what to do? Well, our thesis is we are beginning a multi year move to take out the old highs from 2011. IF THAT IS CORRECT THEN WE ARE IN the first stages of the advance. the first move up (wave 1) will complete and then wave 2 will come and, more than likely, w/ a vengeance because everyone thinks the “old trend” is in play. That’s the BUYING OPPORTUNITY and price should never go below the low that was formed last week.
stay tuned …get ready to rumble.
Bart
