$WYNN and @seeitmarket
Posted on January 11, 2015 Leave a Comment
had some fun on @seeitmarket (www.seeitmarket.com) after the CES show in Vegas – http://www.seeitmarket.com/wynn-resorts-stock-chart-oversold-broken-14006/
hope your having a GREAT weekend.
Bart
Coffee Correction Complete?
Posted on January 10, 2015 Leave a Comment
CLIFF NOTES:
- Coffee Futures UP
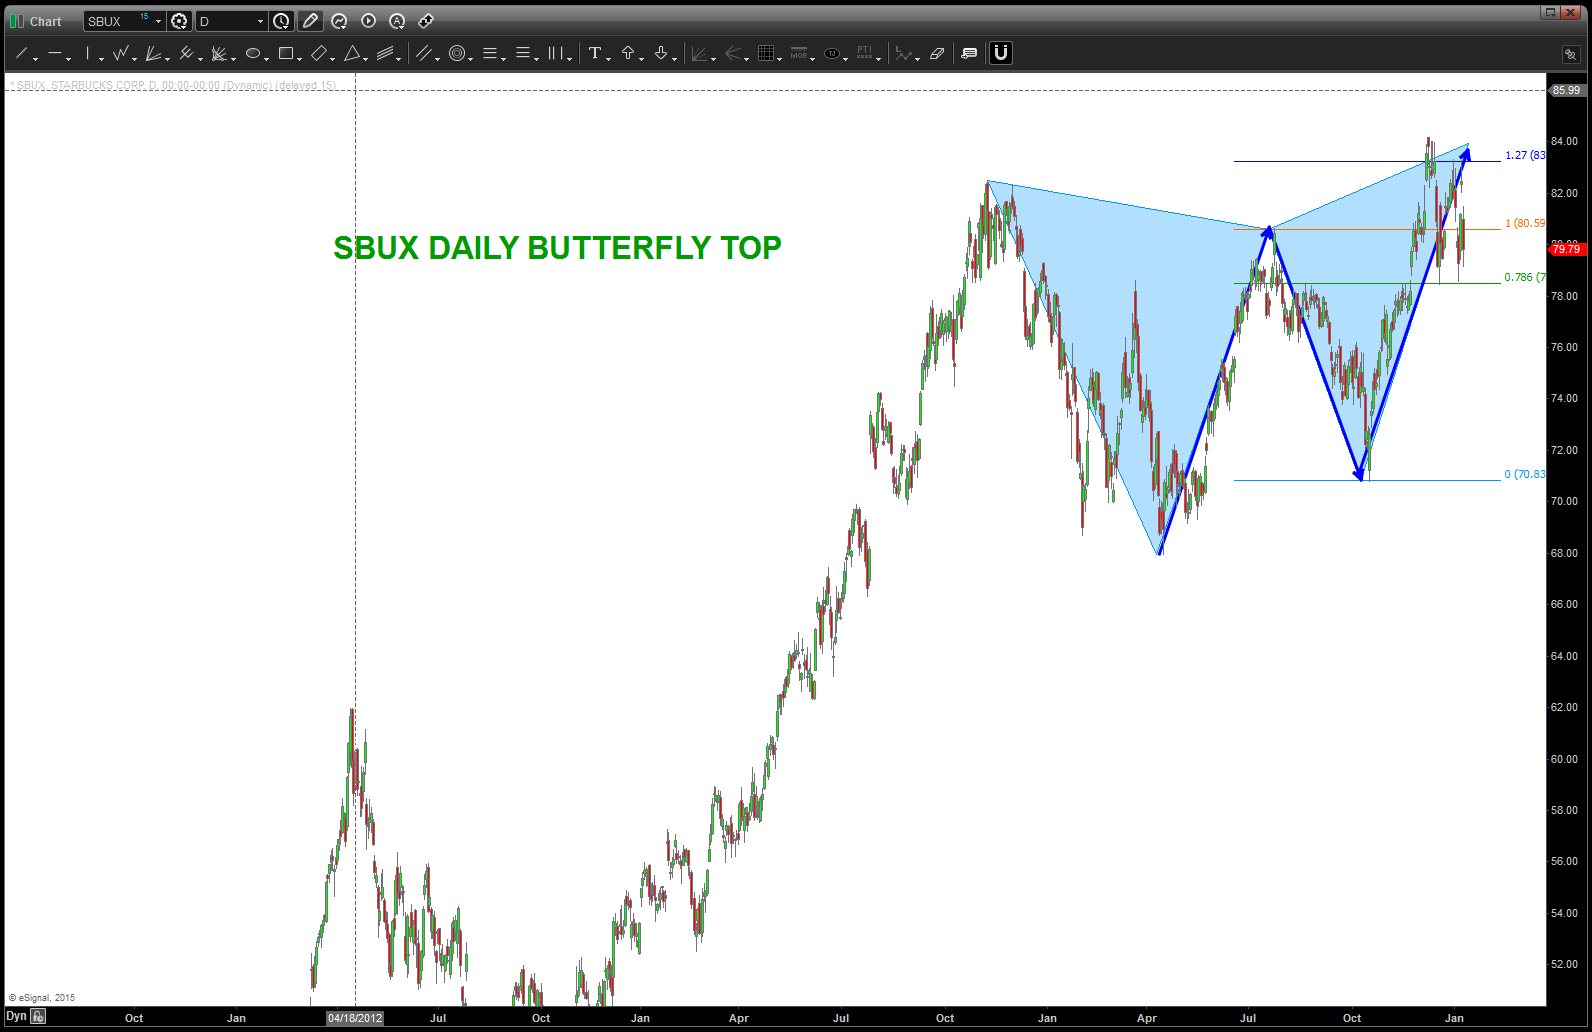
- SBUX SELL PATTERN complete.
See below for updated analysis:
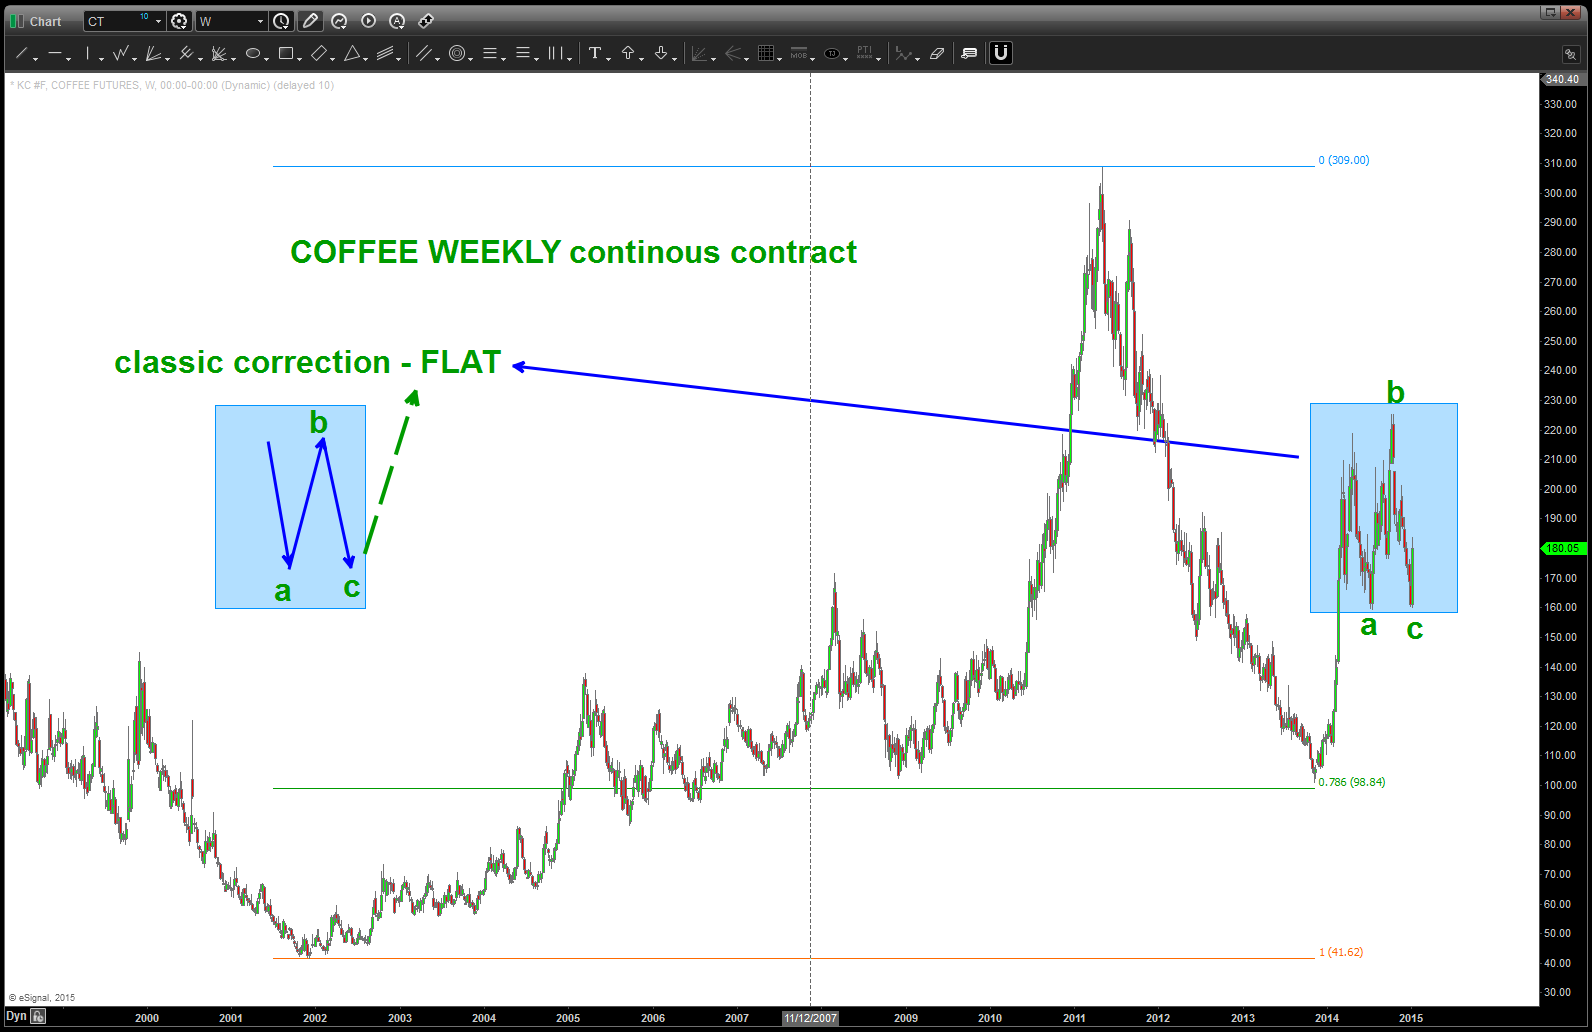
W/ the engulfing nature of the candle from last weeks actions, a case can be made for a FLAT correction being complete and coffee resuming it’s move up.
also, here’s an updated chart of SBUX and note the BUTTERFLY SELL PATTERN that has completed.
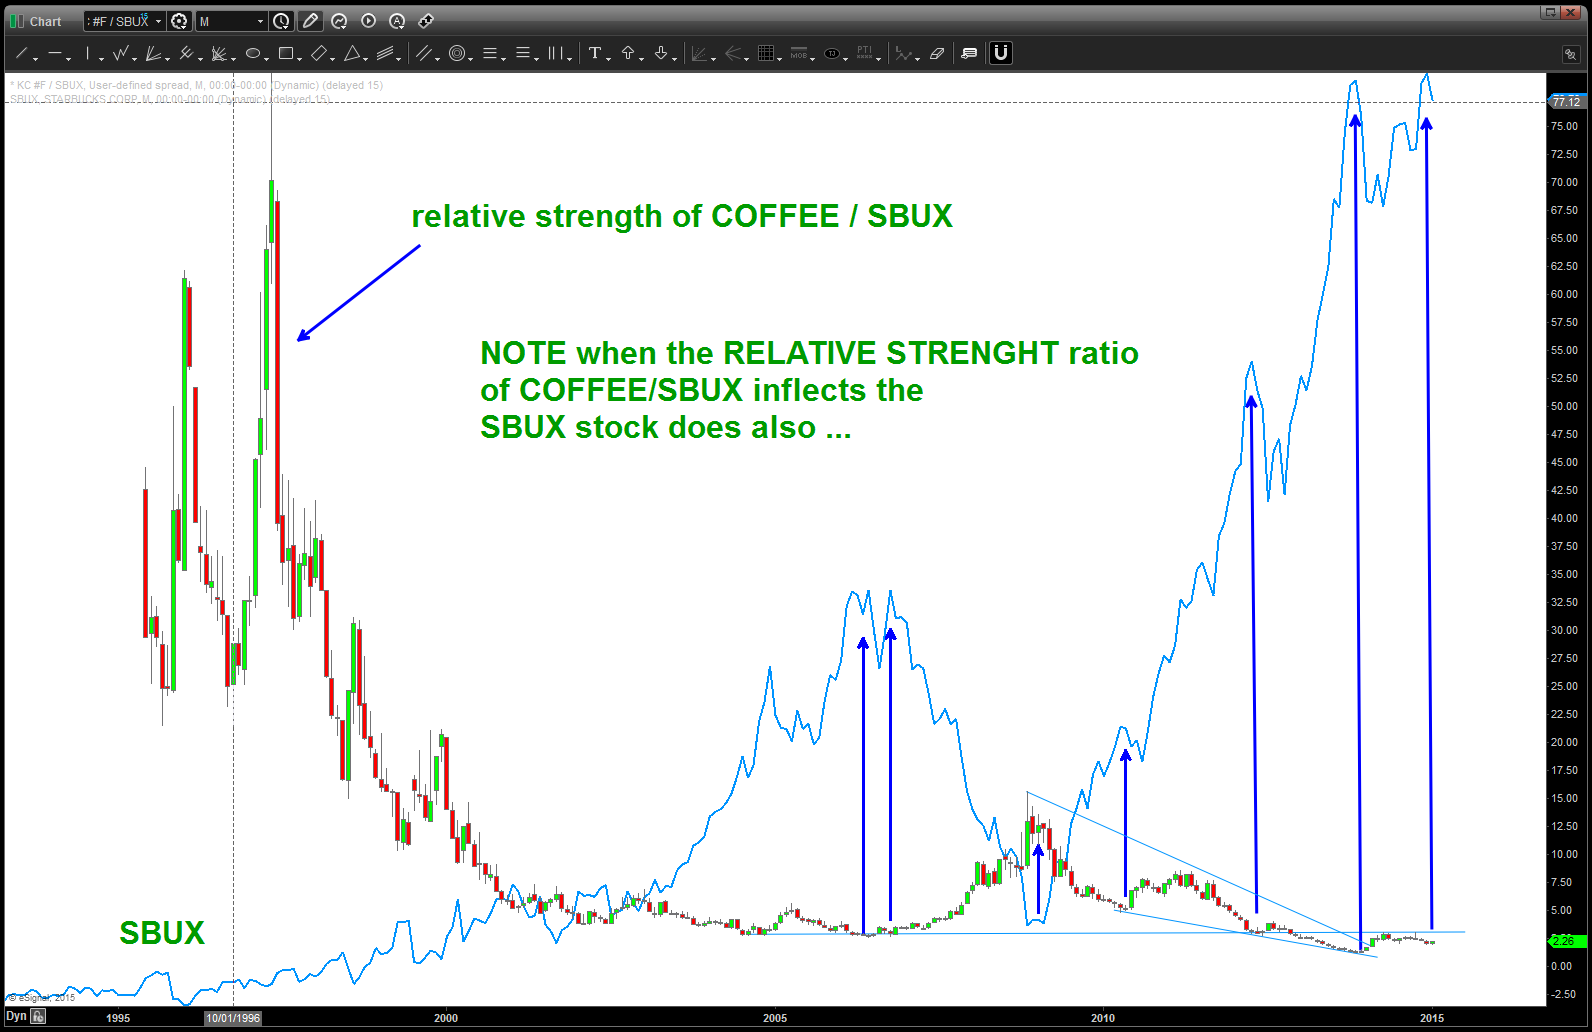
here’s the relative strength chart of coffee and SBUX. Note, the ratio has also finished correcting and that “should” put pressure on SBUX.
my last post on SBUX saw the 73 area as the potential price target to finish a parabolic run. it worked for almost a month but ultimately was defeated.
https://bartscharts.com/2013/08/21/sbux-and-the-land-of-not-real/
so like any good chartist it was “erase” and back to the drawing board.
one would think, as I did, that the price of coffee would certainly be a pretty close inverse relationship to the performance of SBUX. not making any excuses for my no “economic courses” world but if the price of coffee goes up or down then wouldn’t that affect profitability? here’s the chart …
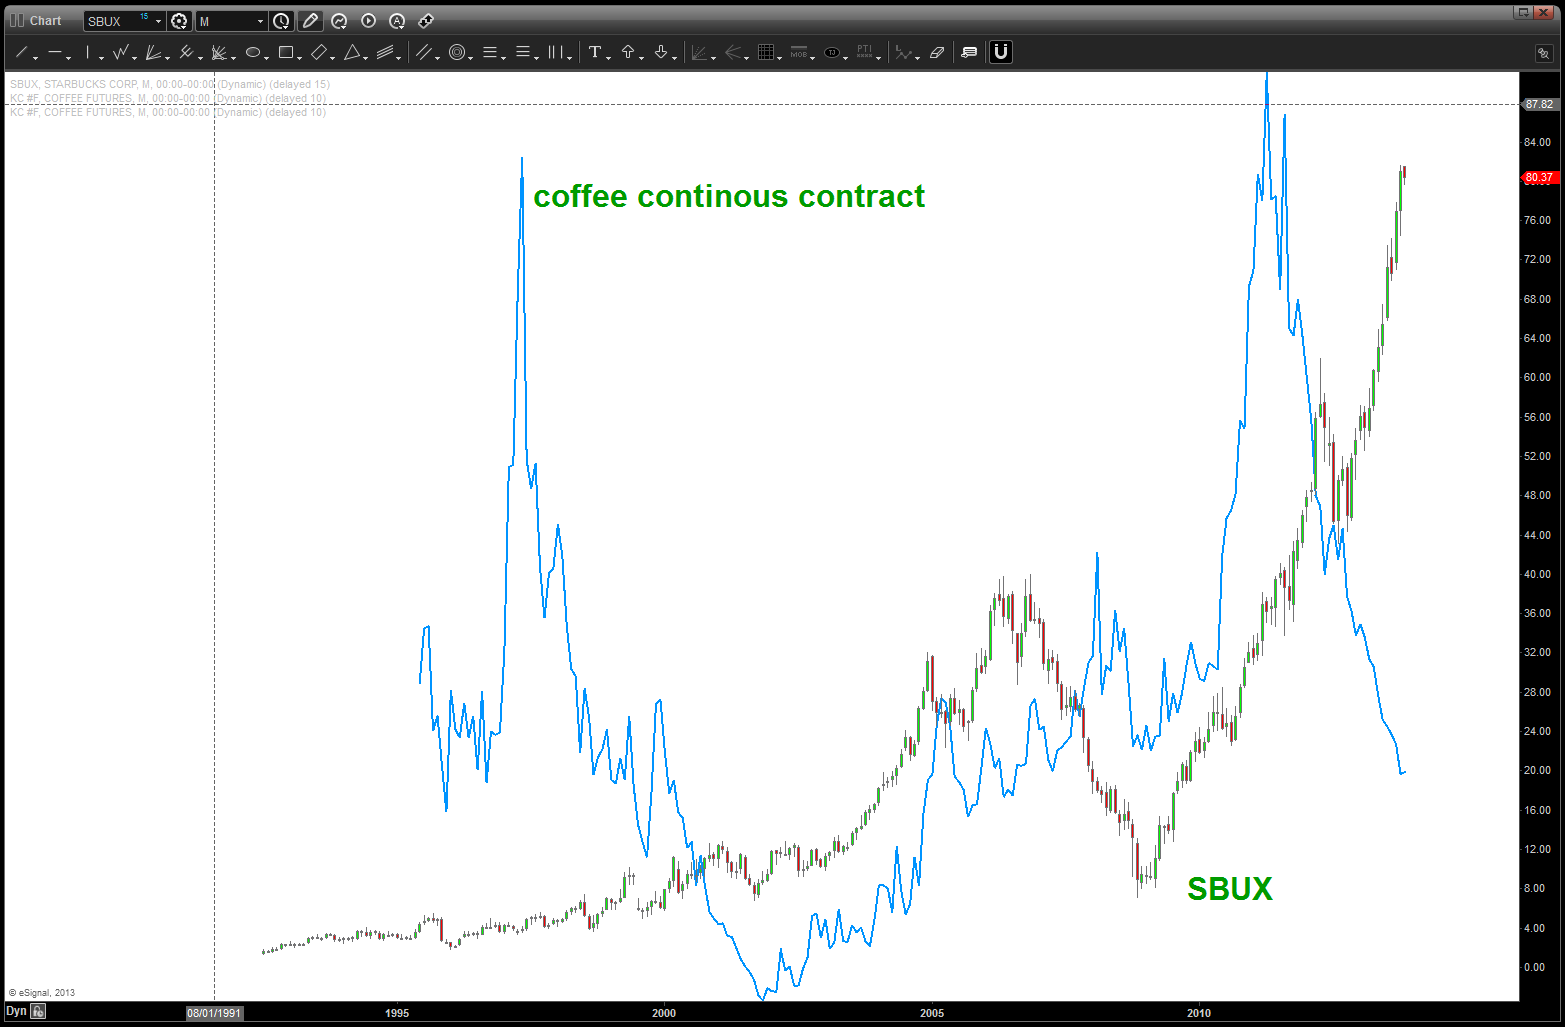
Coffee (line) and SBUX (candles) plotted together …
I can look at this one till I am blue in the face and I really can’t see any correlations … in fact, they both took off together for 10 years and, back in 1997 as prices came tumbling down (as now) SBUX just kept rising. this confused me …there has to be “some” correlation doesn’t there?
so on this wonderful fall morning it came to me “why not try the relative strength of coffee vs SBUX using ratio analysis (KC #F / SBUX)?” and, well, there it was … when Coffee has LESS relative strength (candles are going down) then SBUX rolls like the Crimson Tide. however, when the price of Coffee starts to outperform on a relative strength basis (the candles go up) then the price of SBUX flips on a dime. Picture paints a thousand words …
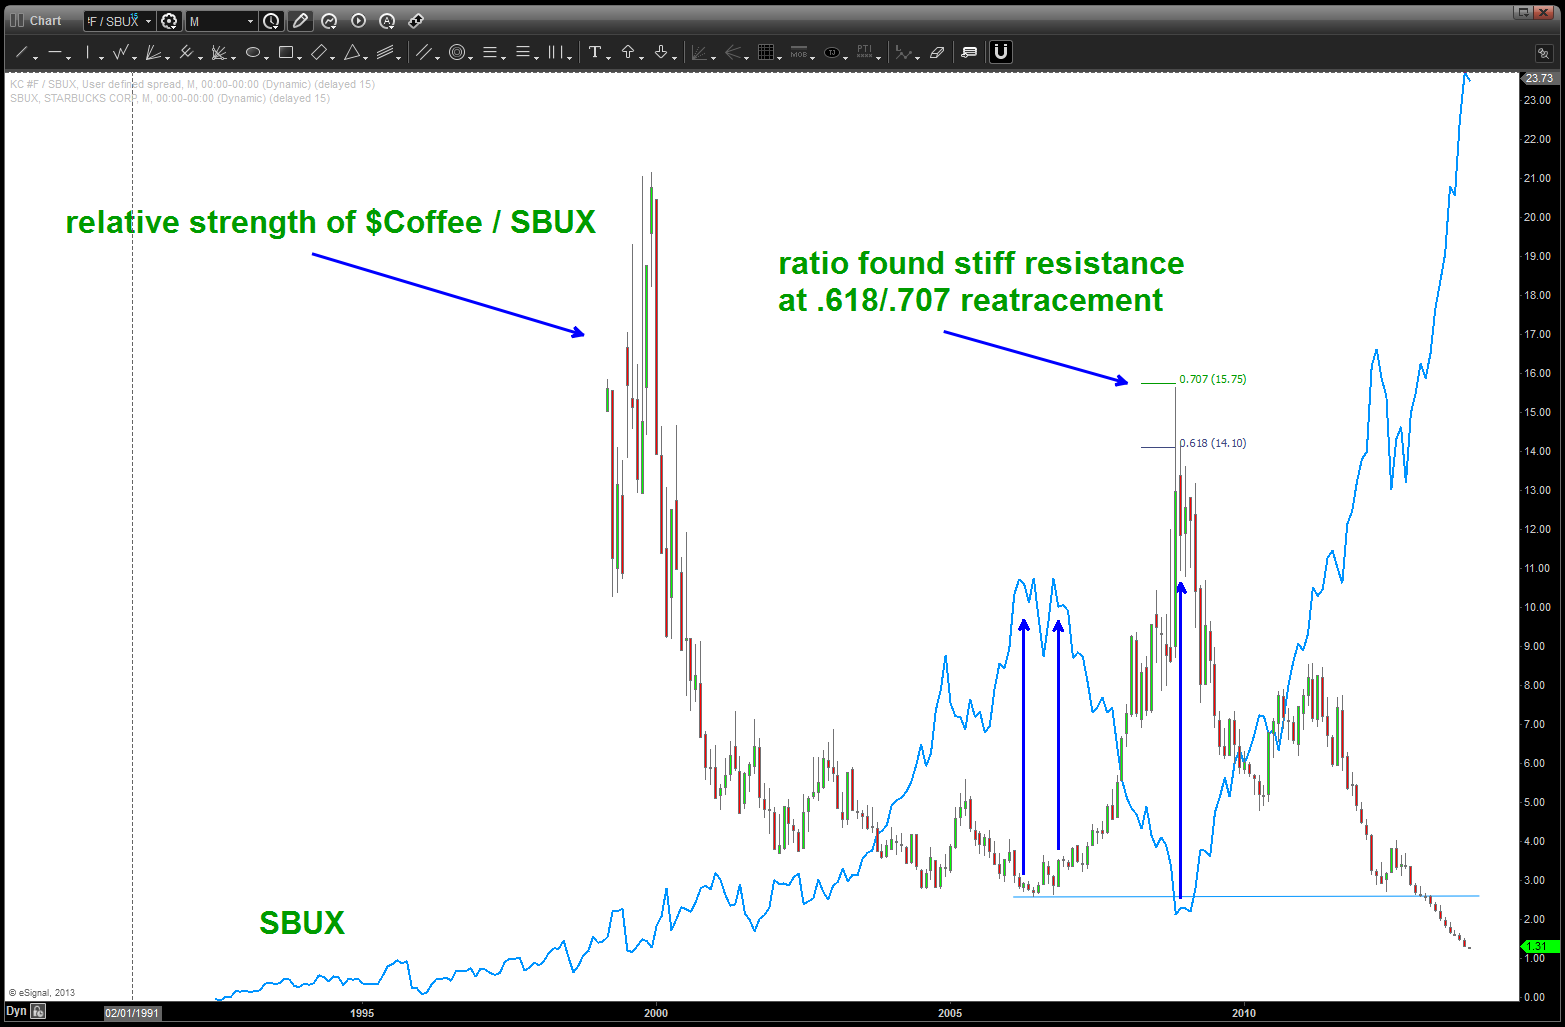
relative strength of Coffee/SBUX.
so, as someone who is a pure PATTERN recognition chartist, naturally I want to find the PATTERN on this ratio that will signal a bottom and cause the price of SBUX to crack and, once again, prove Sir Isaac Newton correct that something that goes UP will, ultimately, come down. (read: gravity) This move in SBUX is amazing .. what is even more amazing is noting the ratio support, once broken in 06/2012 (blue horizontal line at bottom right of chart) is when the parabolic advance really began in earnest …
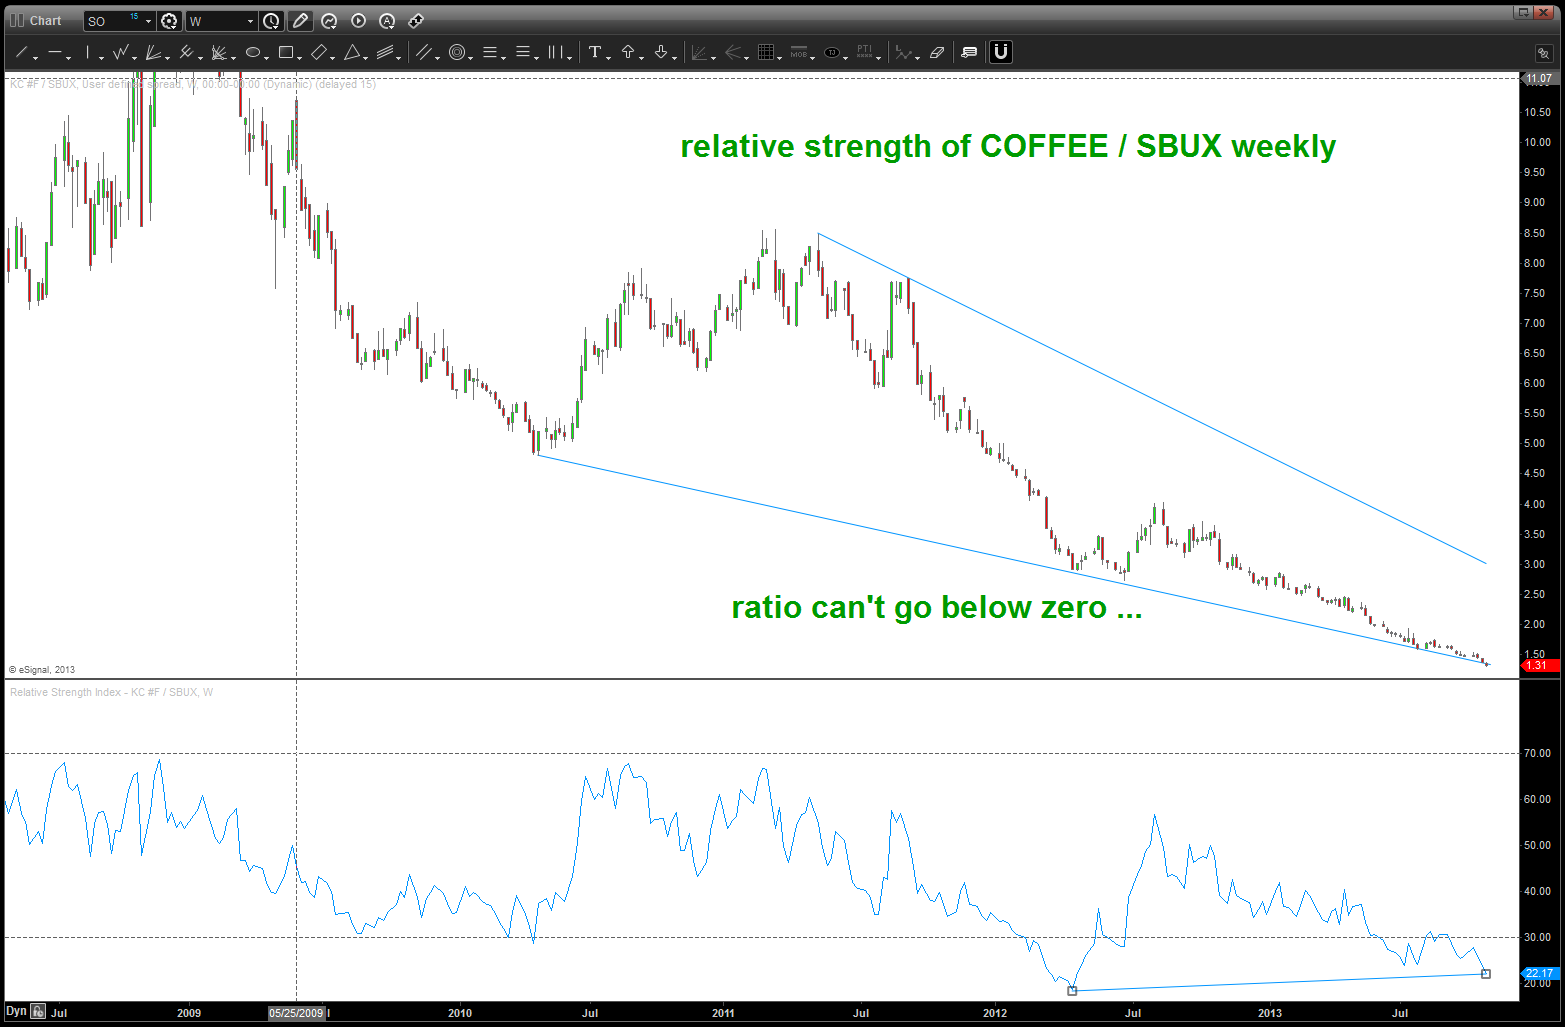
ending diagonal and bullish divergence present for the ratio
there isn’t a clear pattern coming into play as I look at the monthly and weekly charts …standard projection/extension techniques have targets that are (-) numbers and that “dog don’t hunt” so we can use RSI bullish divergence (present), contracting ending diagonal like pattern (present), very little volatility (note the small candles) (present) and the fact that we are coming to extremely important support on the continuous contract (.786 retrace from a monthly node)
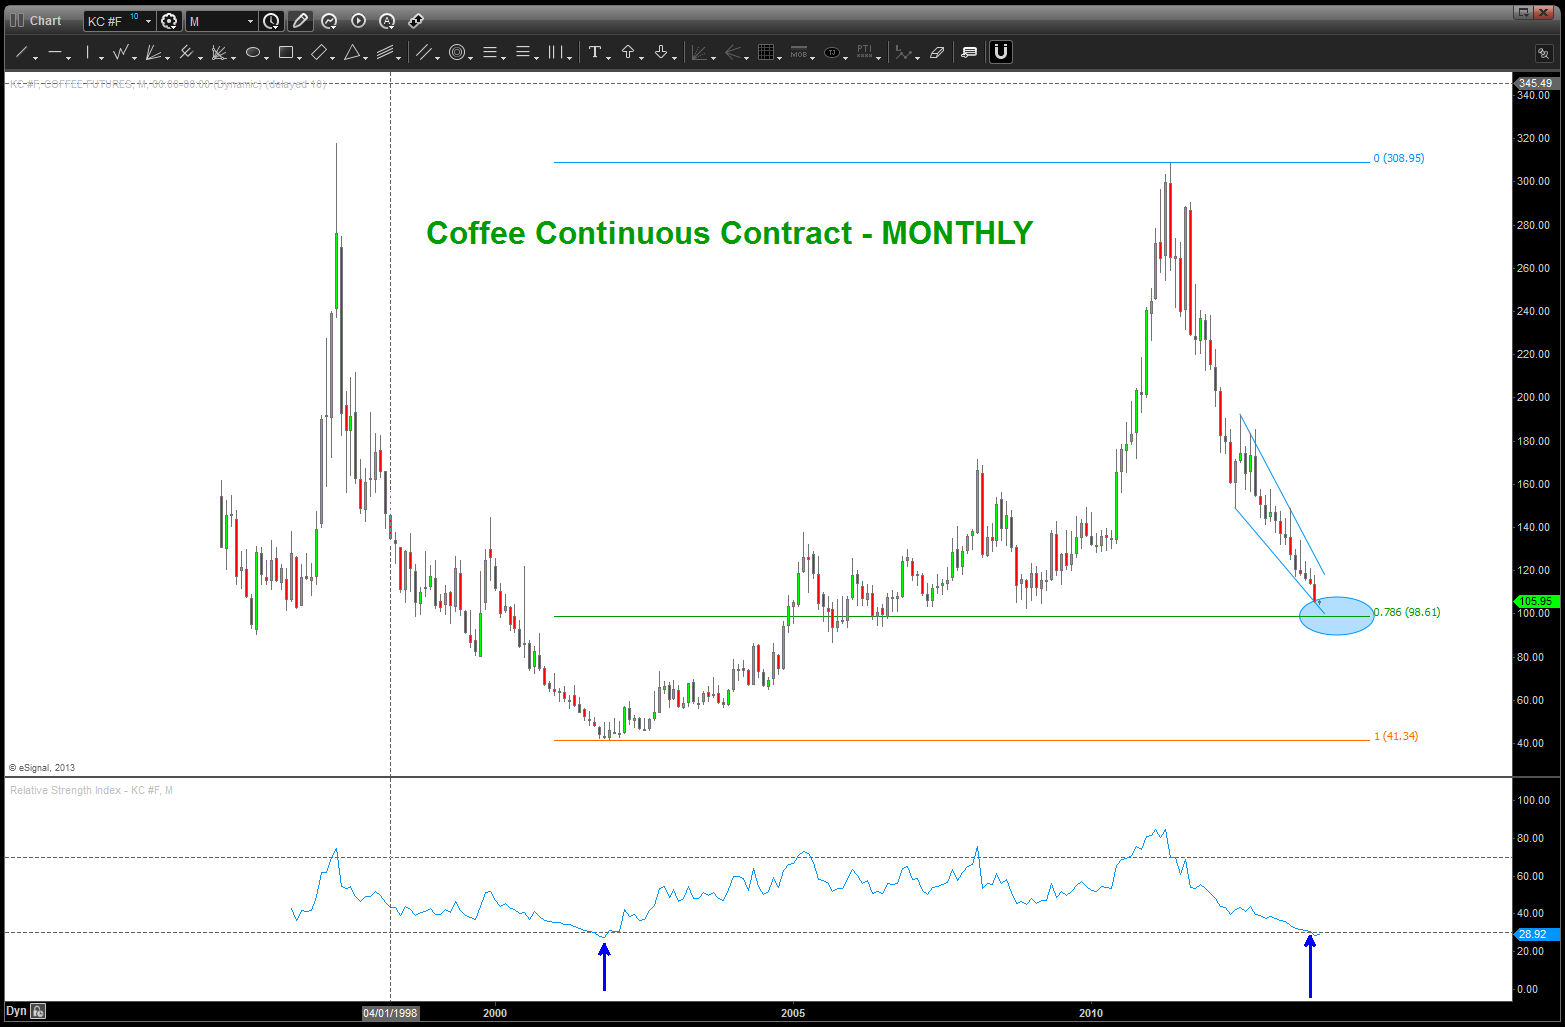
Coffee Continuous Contract Monthly approaching major support
if not NOW then, in the very near future, believe 1) Coffee will find significant support and 2) the relative strength of Coffee vs SBUX will bottom and start back up and 3) this will cause the parabolic advance of SBUX to flame out …. it is inevitable.
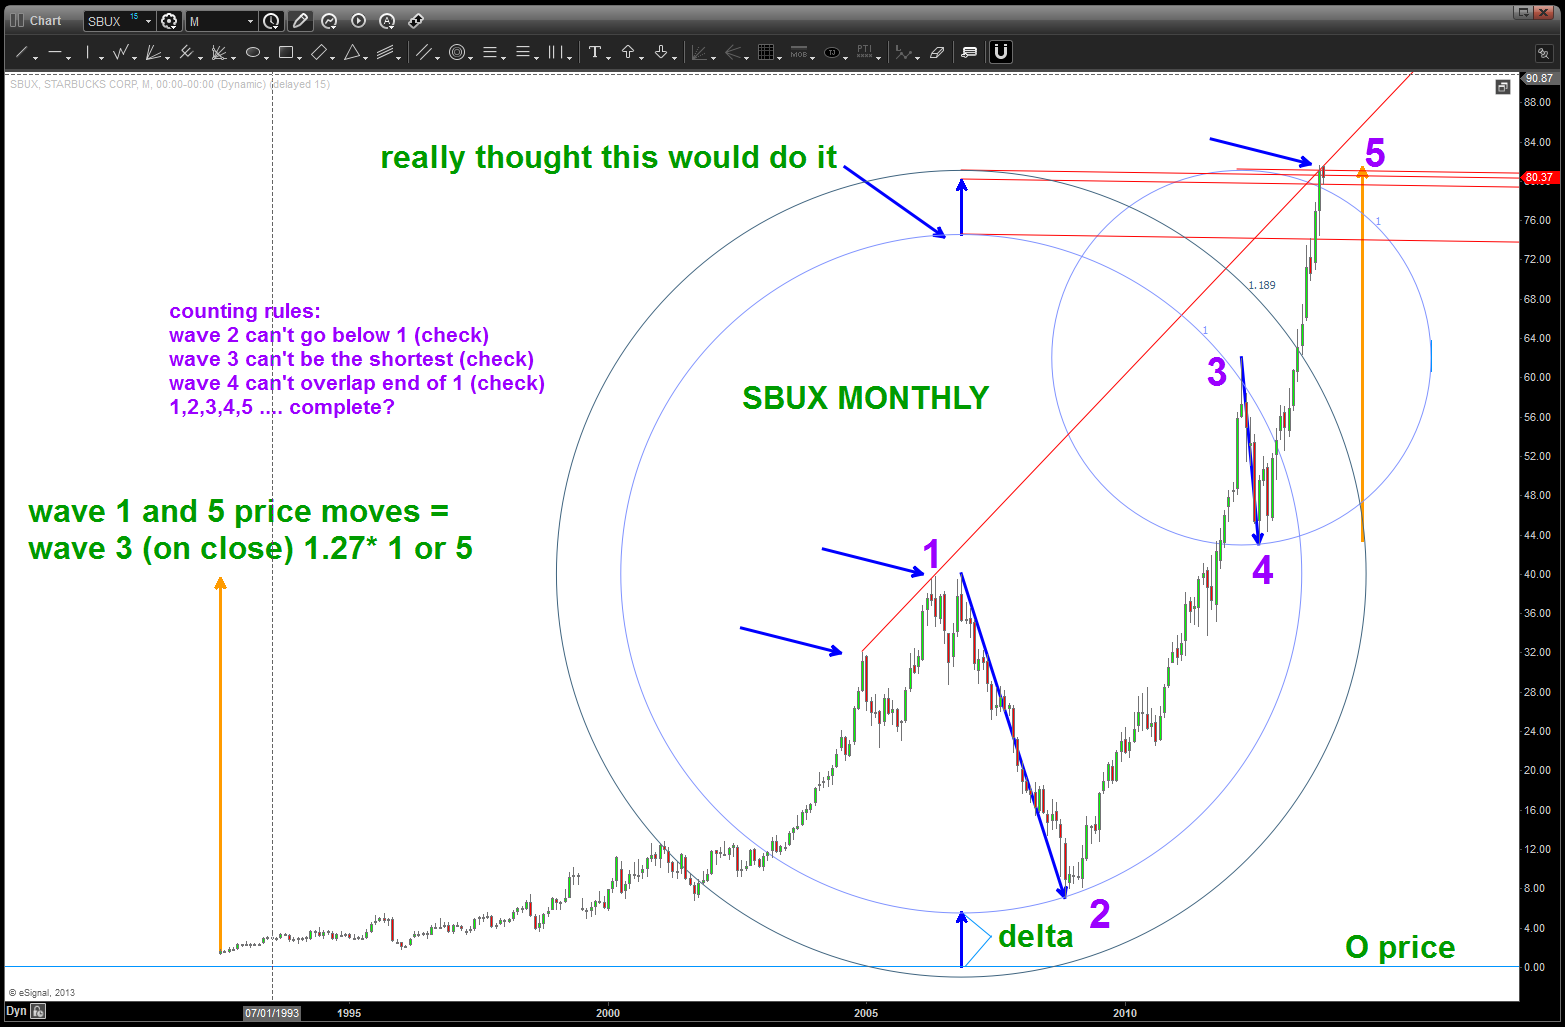
SBUX potential targets and count that doesn’t break any rules (valid (?))
What a blast – thanks again JC!
Posted on January 8, 2015 Leave a Comment
The WordPress.com stats helper monkeys prepared a 2014 annual report for this blog.

Here’s an excerpt:
The concert hall at the Sydney Opera House holds 2,700 people. This blog was viewed about 29,000 times in 2014. If it were a concert at Sydney Opera House, it would take about 11 sold-out performances for that many people to see it.
Busy with @seeitmarket coming into the 2015!
Posted on January 4, 2015 Leave a Comment
Folks, what a wealth of information from Andy @seeitmarket …..
Here’ what I’ve been up to – check out the links and all of the amazing contributors:
- the Banks … they lead us up and they lead us down. PATTERNS suggest they are at MAJOR resistance and what this means for the overall market: http://www.seeitmarket.com/bank-stocks-near-make-break-point-2015-13986/
- IBM … a complete laggard. A case can be made, however, this a stock to own in 2015: http://www.seeitmarket.com/ibm-stock-reverse-higher-2015-investing-13980/
- Copper … a BUY has been BULLISH for China and we completed an intraday BUY at the end of the year. Perhaps a nice bounce is coming? http://www.seeitmarket.com/copper-prices-falling-buy-zone-13975/
- the DOW … is it going up into 20,000 in 2015? As my loyal readers, you know I was watching the .618 projection from the all time low at 28.48 and it did not hold at all. so, the logical next target is the AB=CD and, folks, that’s up at 20K+ here’s the link … http://www.seeitmarket.com/dow-jones-targeting-20000-djia-investing-13972/
- the TRANSPORTS …the AB=CD got crushed. so, perhaps higher is in the cards: http://www.seeitmarket.com/dow-transports-move-higher-targets-13969/
- YAHOO – will it stay or will it go? http://www.seeitmarket.com/yahoo-yhoo-sell-price-pattern-important-time-price-13965/
Enjoy and bookmark http://www.seeitmarket.com
Bart
a look at mirror image foldbacks and Natural Gas
Posted on December 31, 2014 3 Comments
Wanted to do a follow up on some Natural Gas questions that have hit the blog. THANKS FOR ASKING
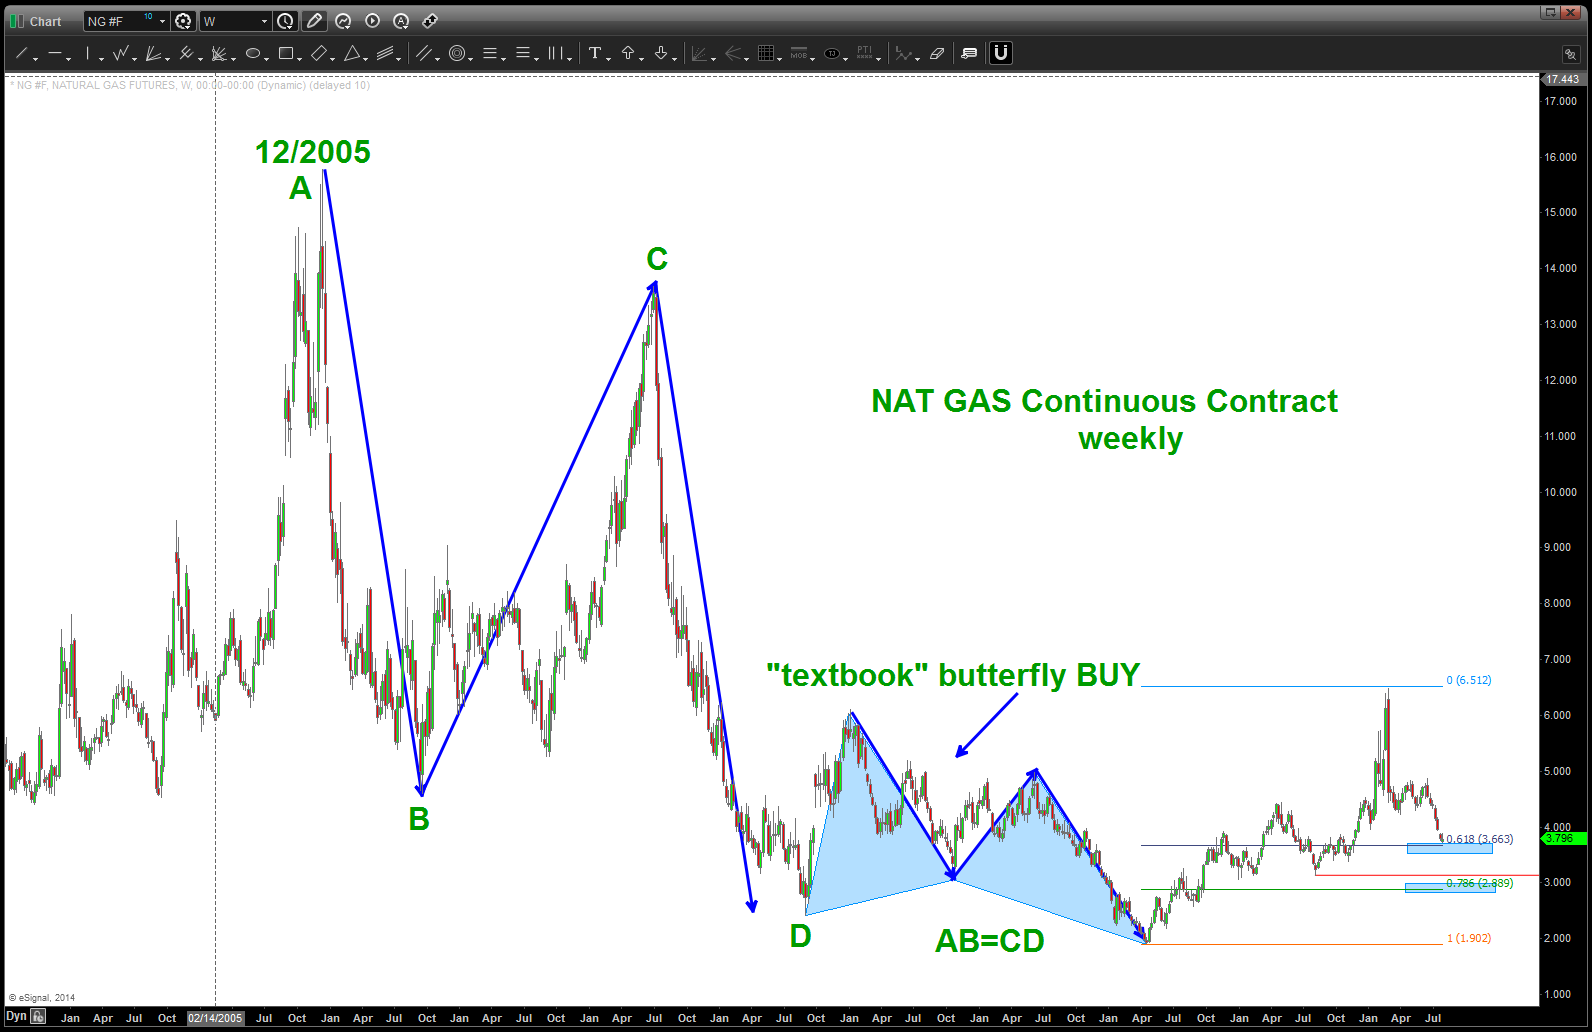
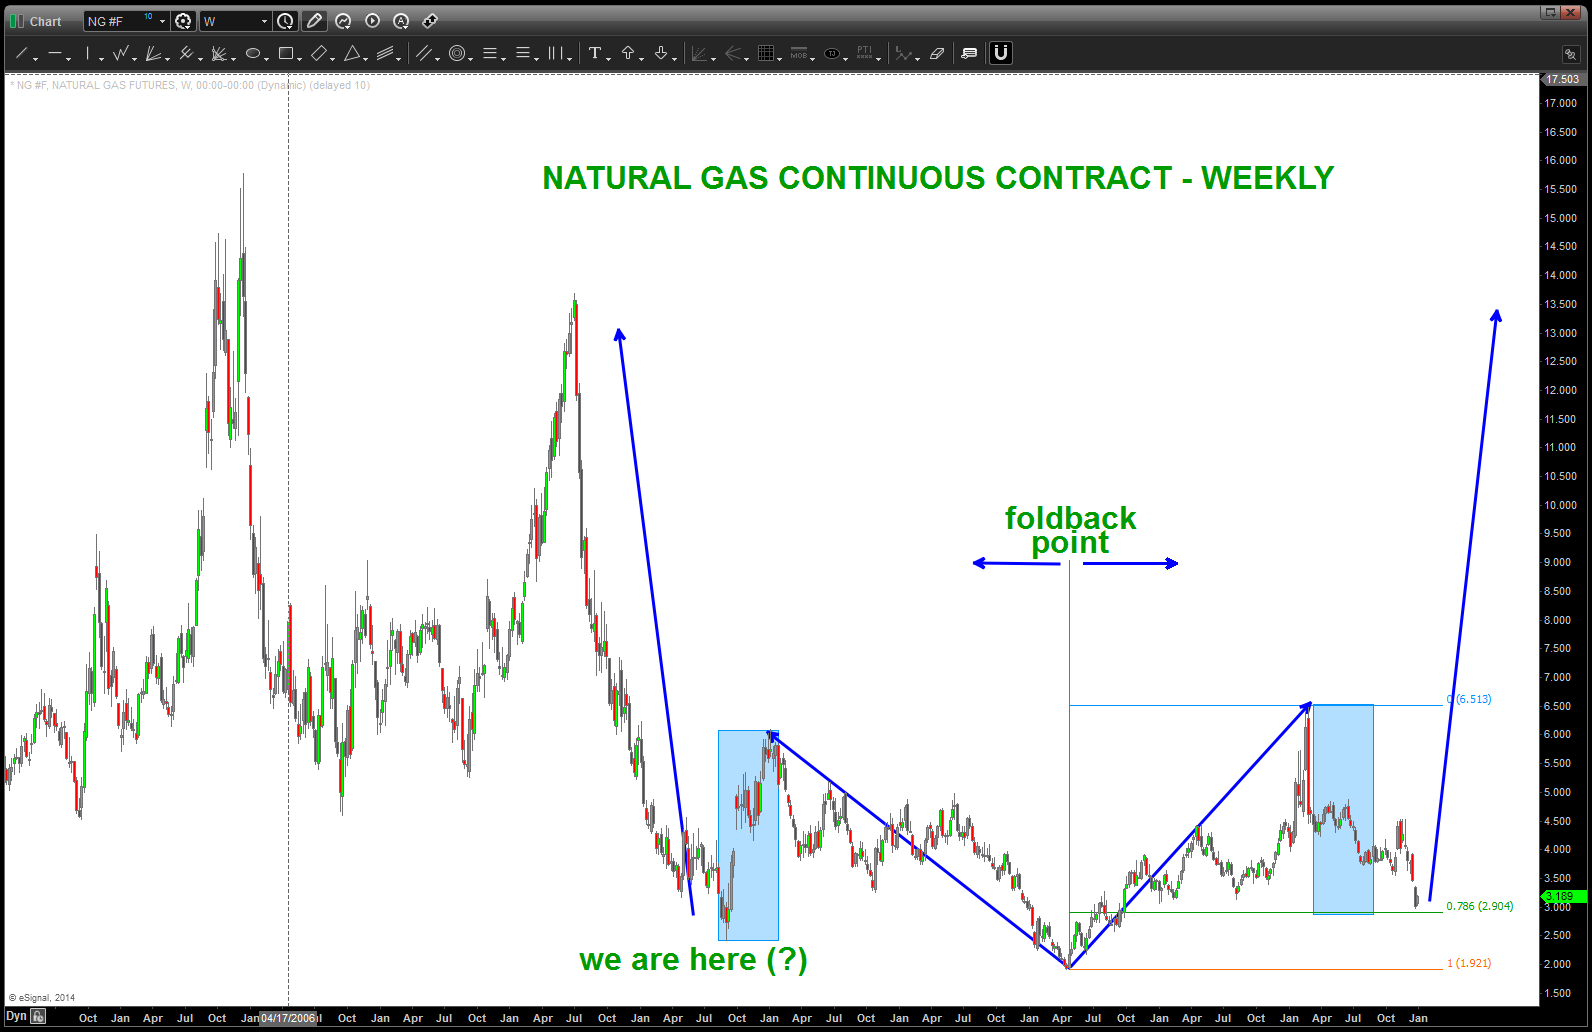
The chart below is back from August and it showed the completion of a “large” AB=CD PATTERN and then a BUTTERFLY PATTERN appeared and held. The natural flow of things calls for a BUY once a key retracement level is reached. So, we are approaching the .786 level as shown and believe that should be respected.
Additionally, when I do mirror image foldbacks I try to recognize (try being the operative word) the last major correction that happened in the past and then see how that lines up w/ the rhythm/balance of the chart. Some charts below will show that concept: JEC, Silver and the US Dollar.
The “real” reason for the foldbacks is, believe it or not, planetary in nature. It “usually” involves a combination of 2 planets moving in/out towards conjunctions OR a big planet going retrograde. It’s hard to find the right combo or pair so, frankly, I just go w/ what looks good to the eye and then look for a PATTERN and SENTIMENT that makes sense.
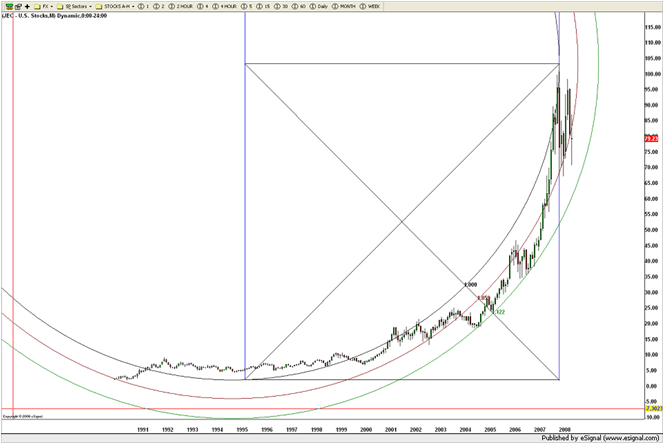
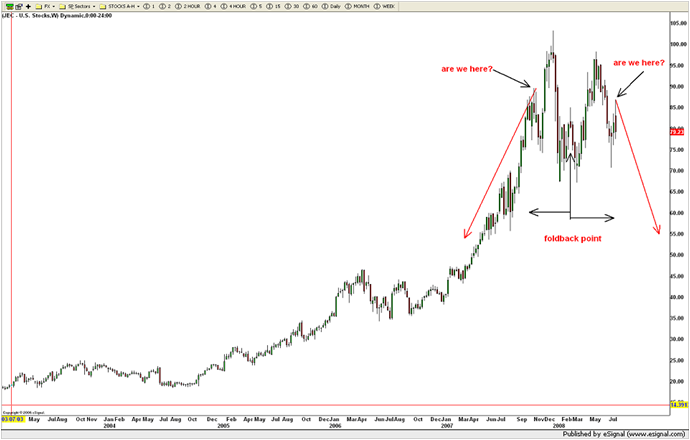
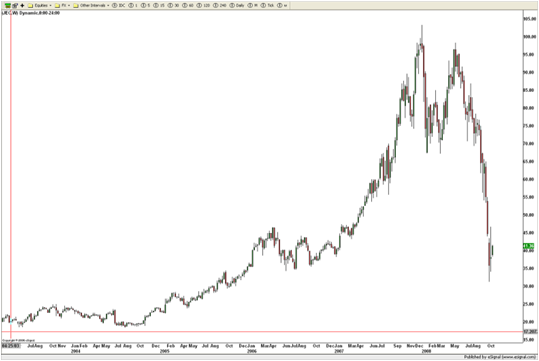
First chart is JEC … the first chart was showing the parabolic nature of the move and how it was pretty much done. Now, note the very nice symmetry of the move down from the high. so that “last” move up going from the top and down left to right is EXACTLY equal to the move in the “current” time and the “are we here.” Rest was history …
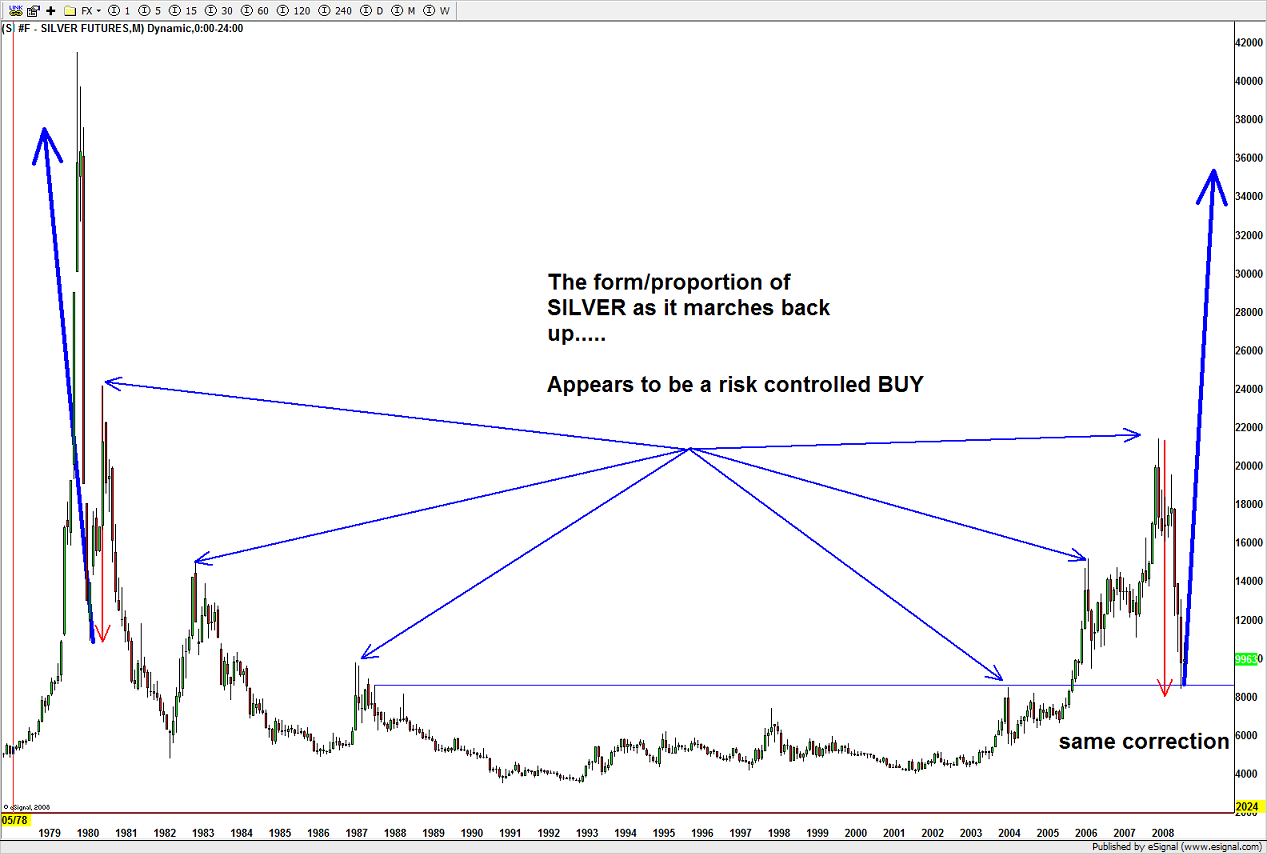
Here’s SILVER ….buy at 8 and foldback up the big plunge down. Forecast was upper 40’s. IF IT WAS THE CORRECT POINT. We NEVER know …this one worked.
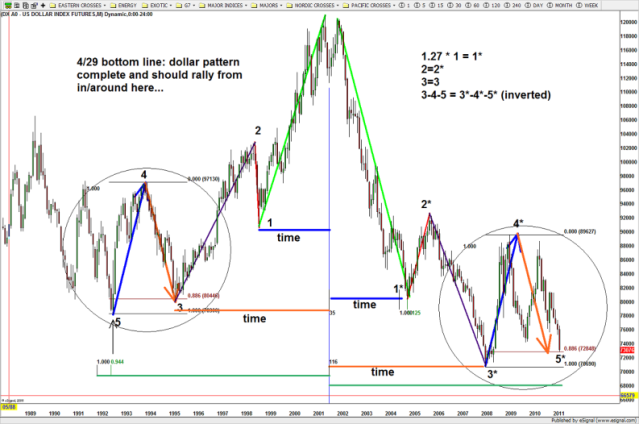
Here’s my favorite on a LONG TERM MONTHLY of the US Dollar. Study this one …this chart below has NOTHING to do w/ the global macro fundamentals and EVERYTHING about the PATTERN.
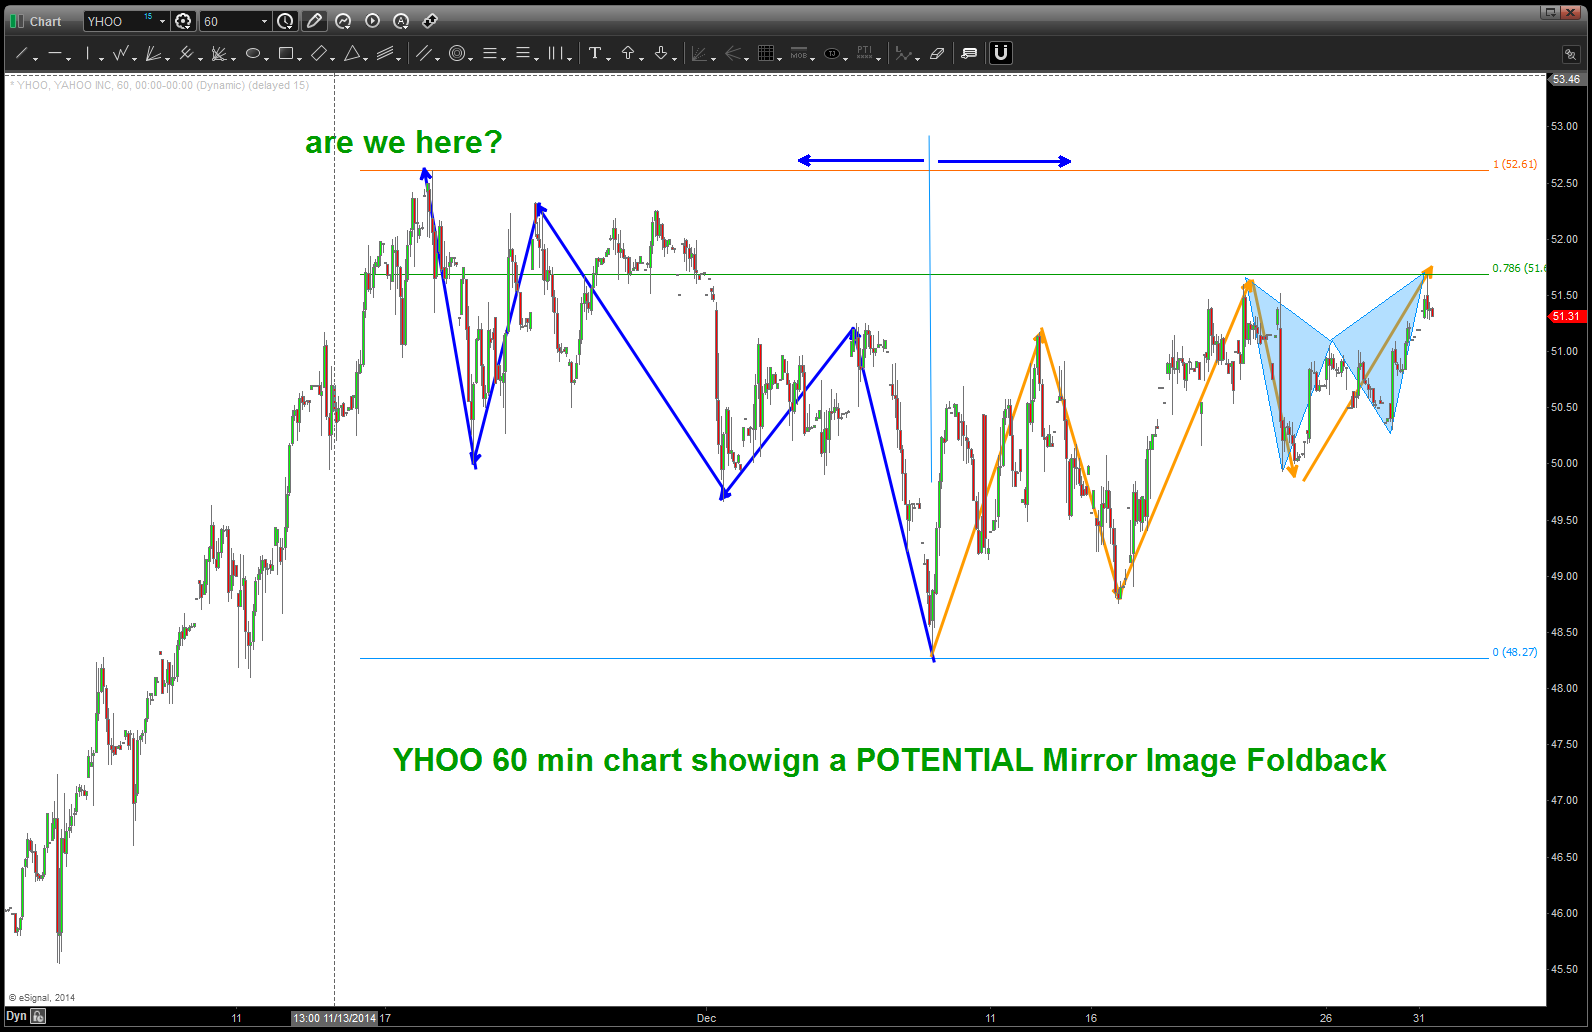
If you’ve been following my posts on http://www.seeitmarket.com (@seeitmarket) then you’ll know that I’m watching the current area on YHOO and have noticed a POTENTIAL intraday foldback appearing. (http://www.seeitmarket.com/yahoo-yhoo-topping-pattern-still-play-13929/)
so where does this leave us w/ NAT GAS? if you look at the chart below, you’ll see the 2.903 level as a key level based on 1) the .786 retracement and the measured move down that completes the foldback. That is what I’m watching….
hope this helps and let me know if you have any more questions.
HAPPY NEW YEAR!
Bart
so far, it’s been a very nice and symmetrical move in Natural Gas futures …
if (the big if) the mirror image is at play THEN either 1) here or 2) a little lower and we should see Natural Gas foldback up the blue arrow shown by the “we are here (?)” in the middle of the chart.
NOBODY believed me when we said BUY Silver at 8 and it could go to 48. They didn’t believe me when they should take profit either…just PATTERNS folks.
So, if this is correct, Natural Gas is getting ready to explode.
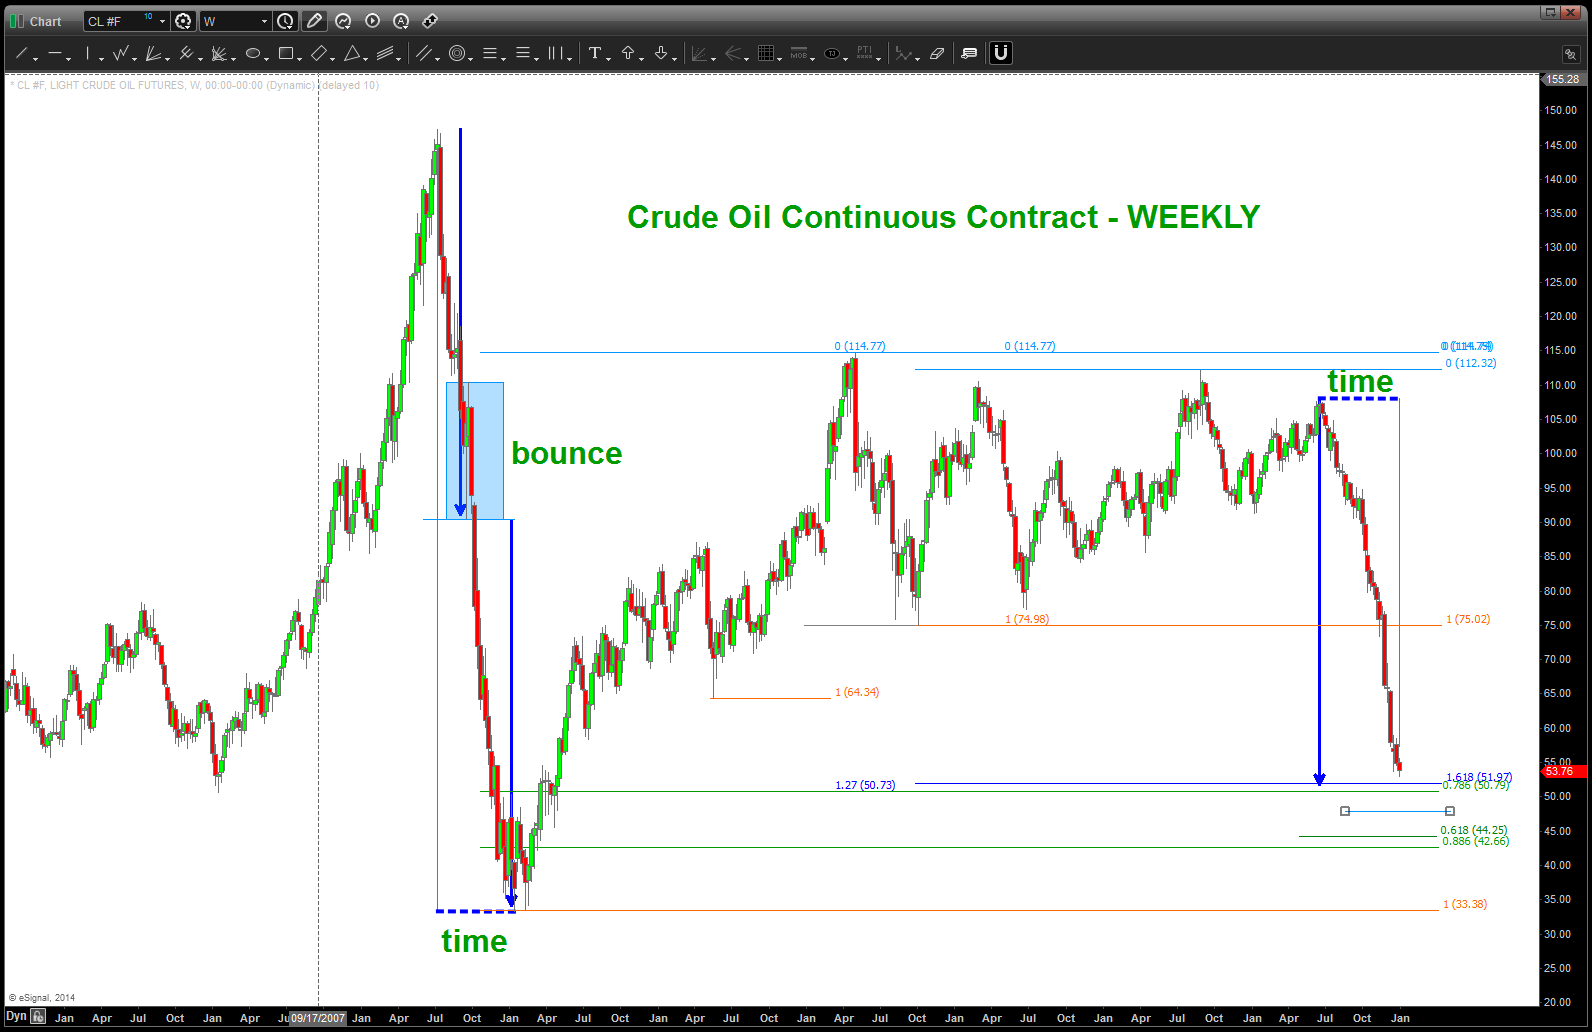
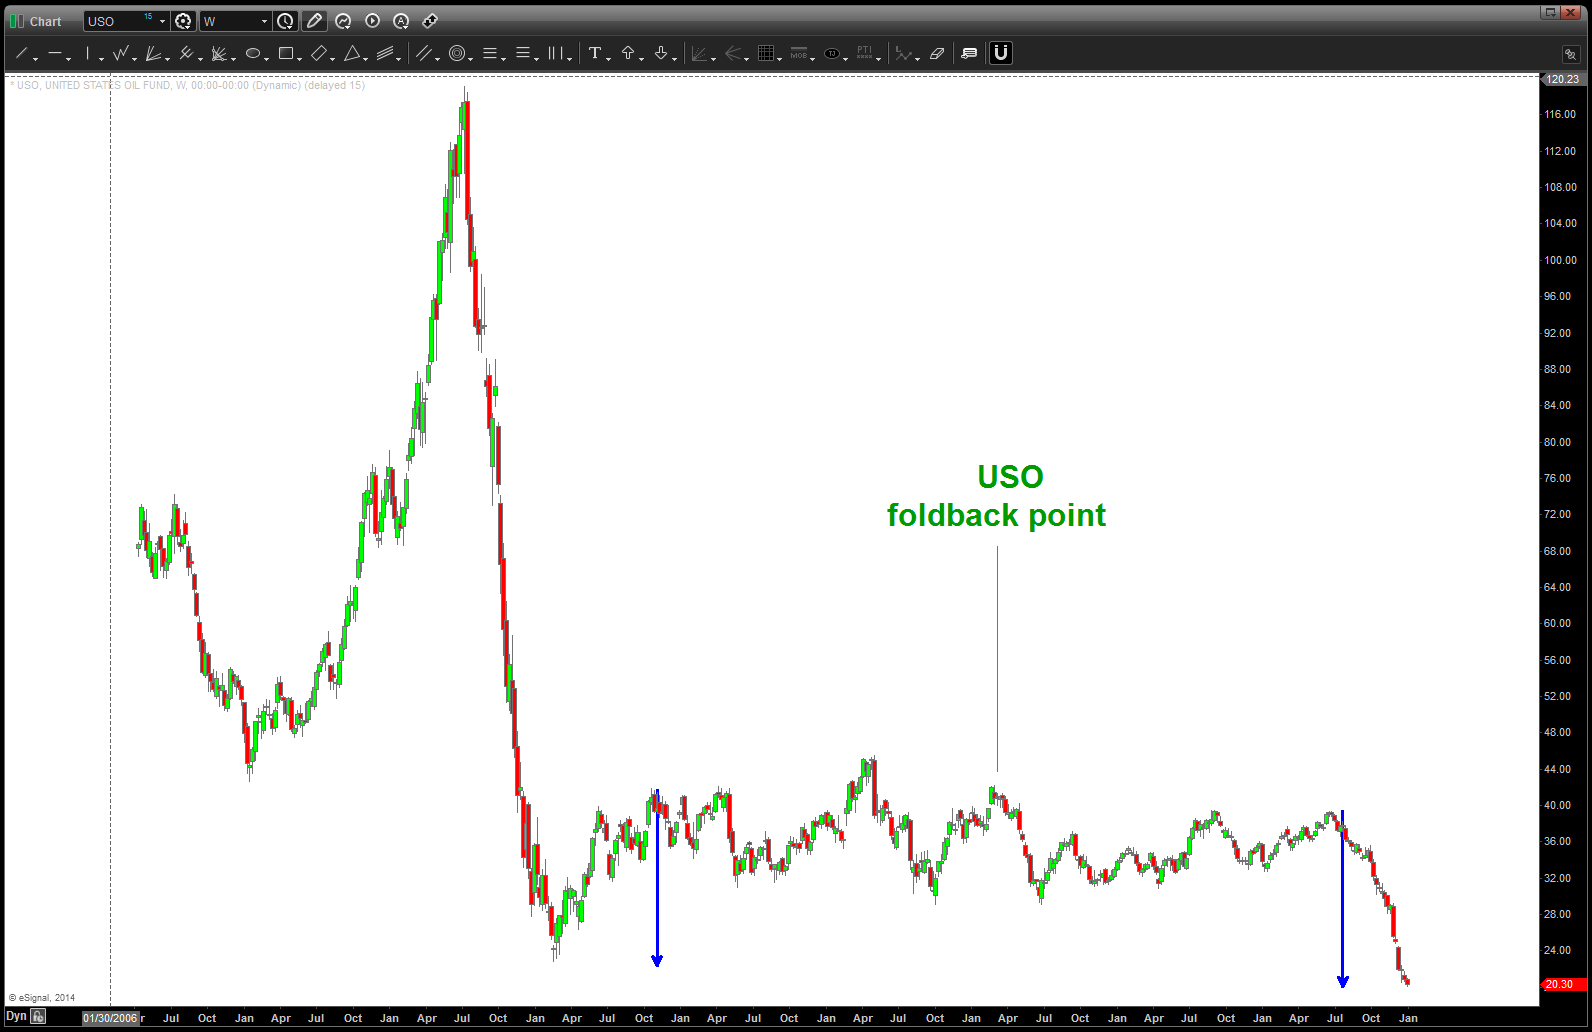
Crude Oil Geometry ($USO)
Posted on December 29, 2014 Leave a Comment
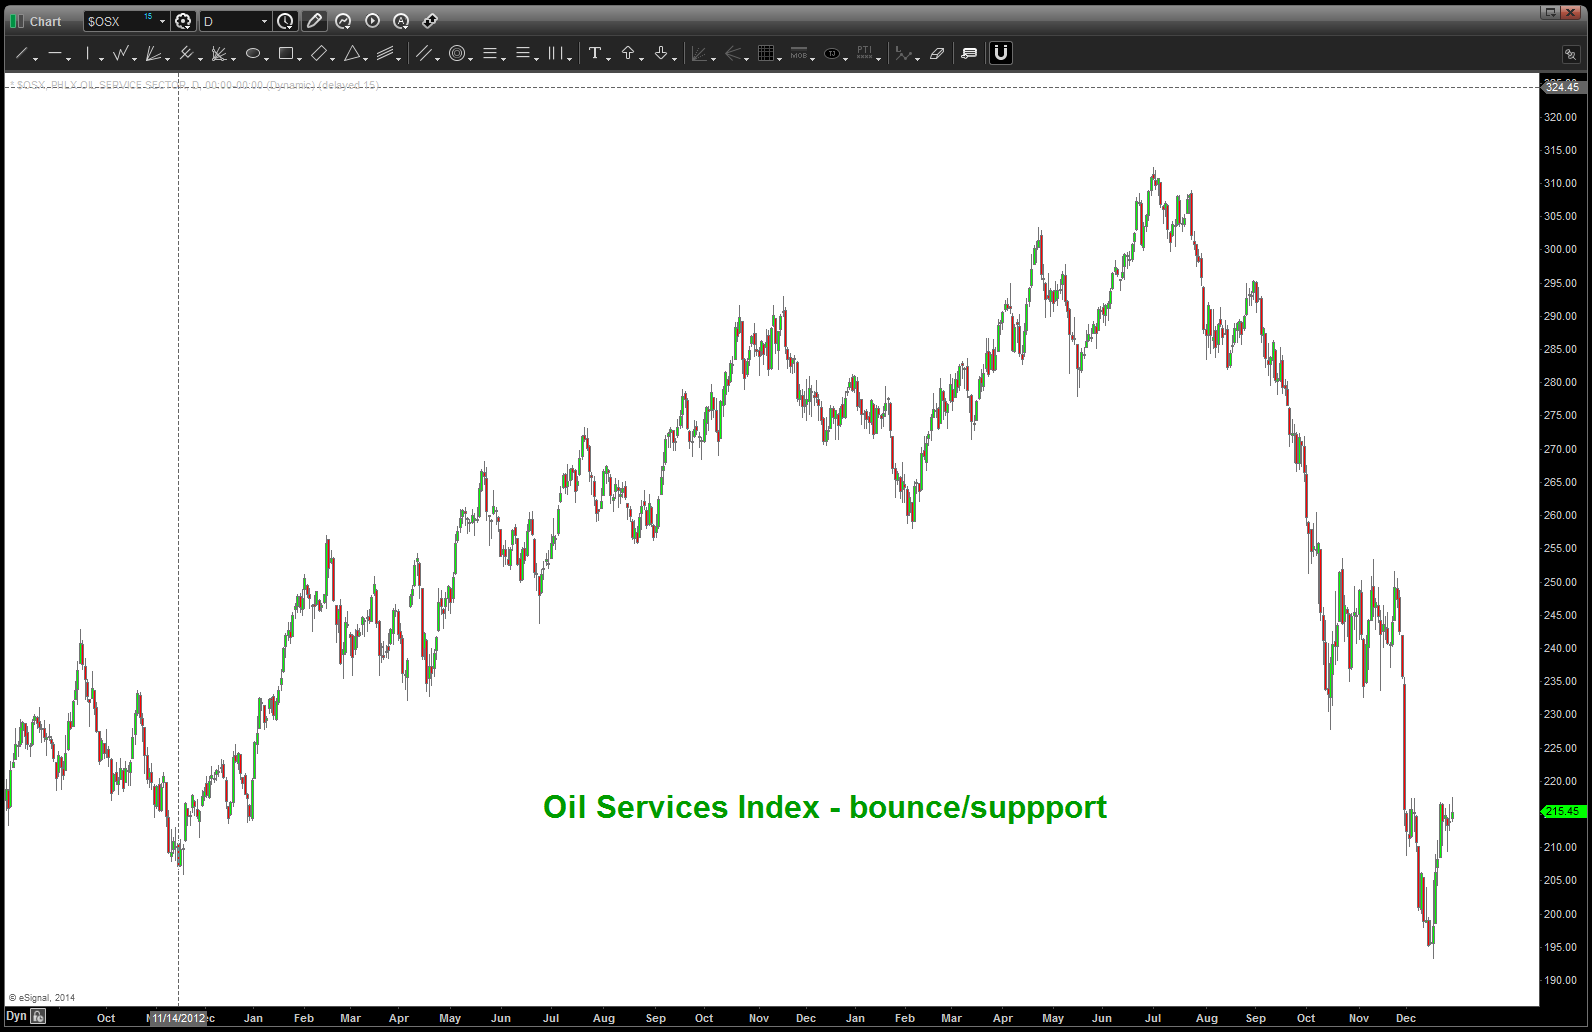
the oil complex is in the midst of a deflationary thump BUT do believe it’s coming into a zone of support.
posted for Andy @seeitmarket http://www.seeitmarket.com/correlation-watch-crude-oil-services-loonie-13951/ and so far the $OSX and Loonie have held.
why 50-51 for a bounce in crude:
- 3 ratio’s – .786 retrace, 1.618 and 1.27 extensions
- NOTE the TIME of the oil crash from the all time high is equal to the time from the June high in Crude.
- NOTE back in 2007 oil BOUNCE after it had traveled a distance shown by the blue arrow. it rallied 20 dollars/barrel and that same move down in price is right at your ratio’s. Additionally, that “balance point” in price represented the next move into the lows.
so … watch the 50-51 as we approach this crucial level. (note: 48 and then 42 are other targets)
Bart

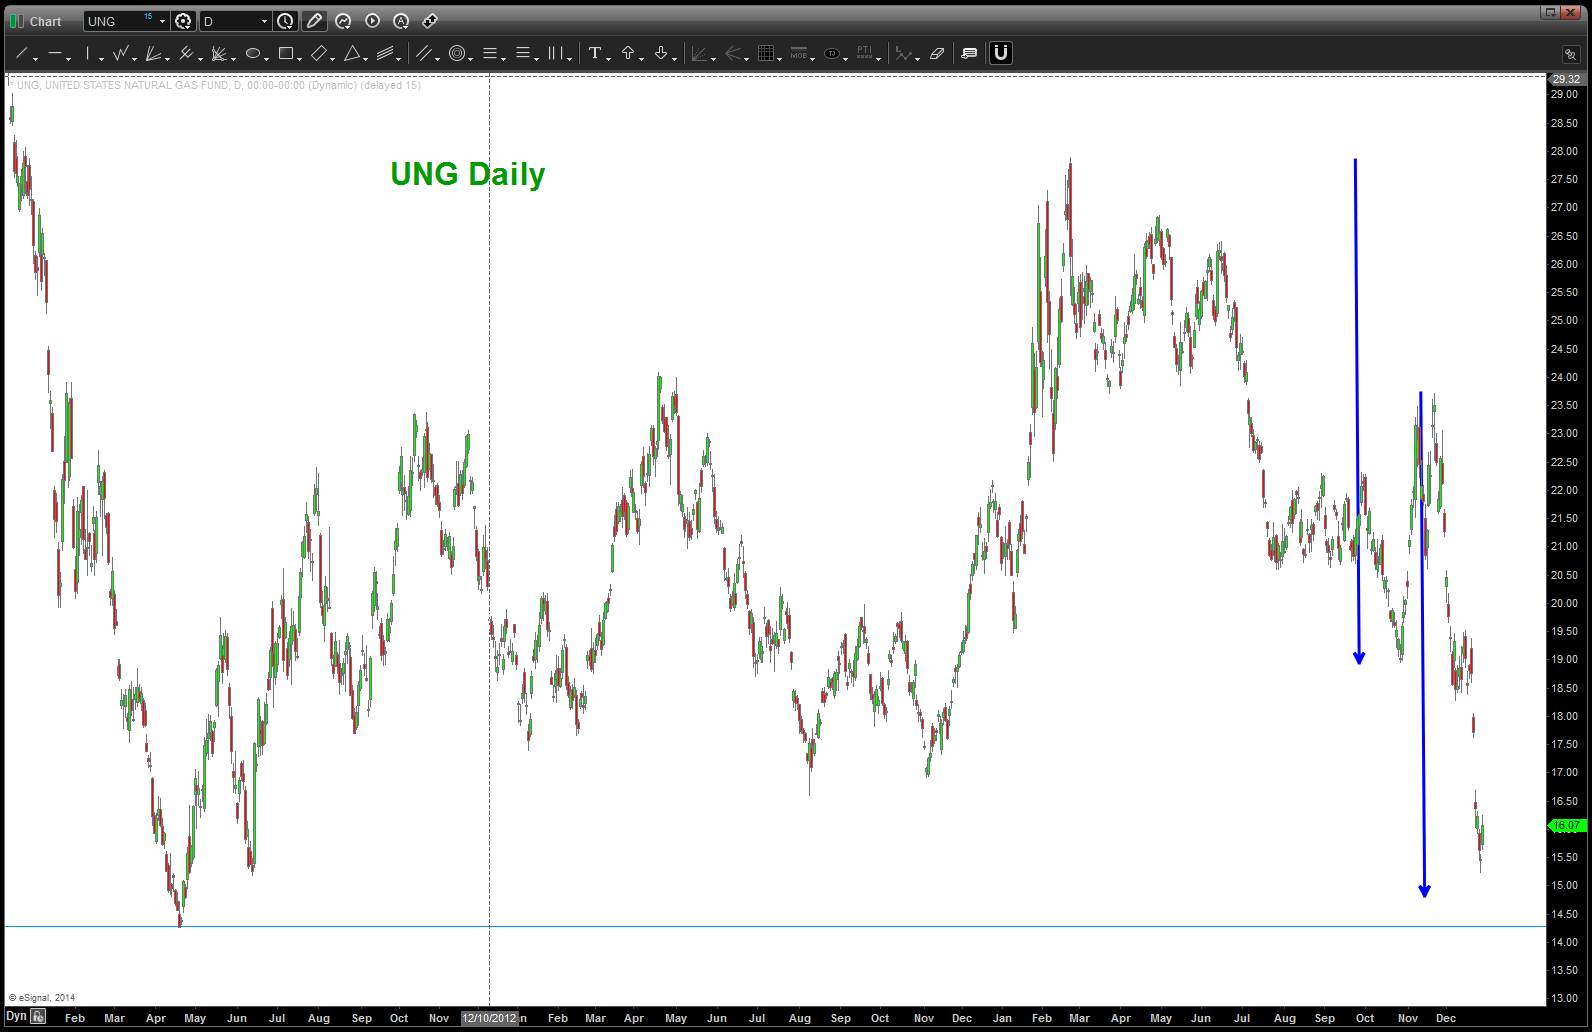
Natural Gas Mirror Image Foldback ($UNG)
Posted on December 29, 2014 7 Comments
so far, it’s been a very nice and symmetrical move in Natural Gas futures …
if (the big if) the mirror image is at play THEN either 1) here or 2) a little lower and we should see Natural Gas foldback up the blue arrow shown by the “we are here (?)” in the middle of the chart.
NOBODY believed me when we said BUY Silver at 8 and it could go to 48. They didn’t believe me when they should take profit either…just PATTERNS folks.
So, if this is correct, Natural Gas is getting ready to explode.
INTC on the move – updated
Posted on December 28, 2014 1 Comment
An update to $INTC is below. Gameplan is working thus far….it came back and tagged the neckline and off it went. Now, expect the low 40’s to be resistance and for another pullback to occur. BUY this pullback.
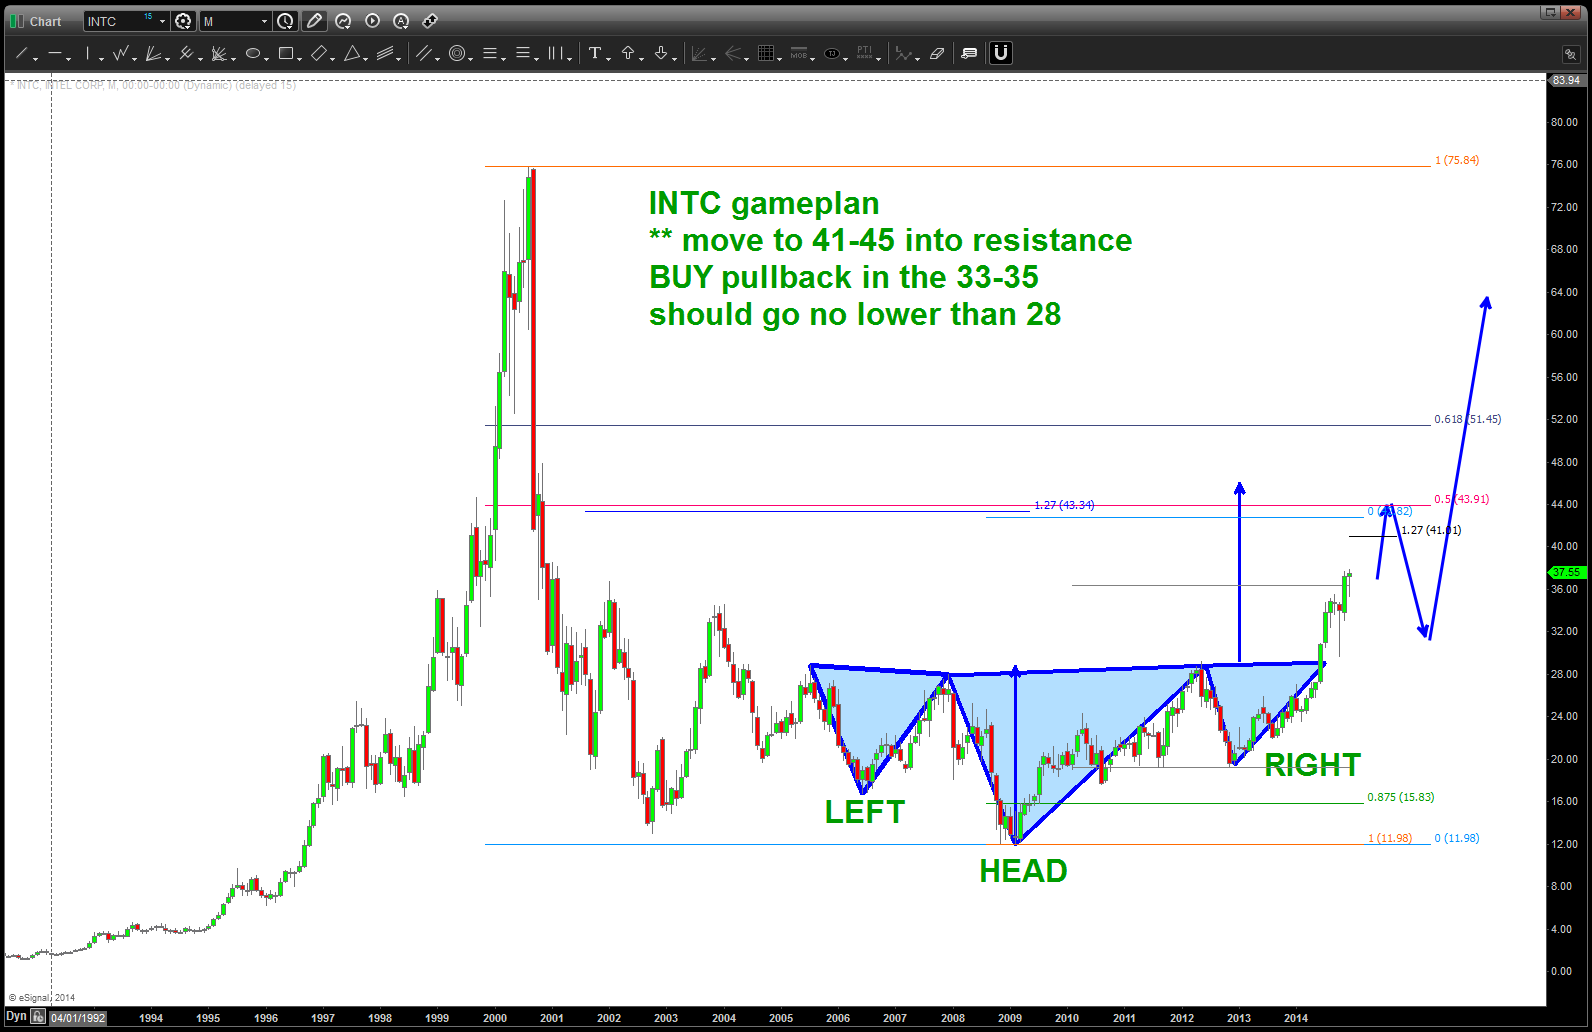
CLIFF NOTES: INTC is on the move breaking thru and CLOSING (KEY) at the high end of the range, above a 9 year resistance line and now testing the higher end of the bearish resistance zone on the RSI. The base it has moved up from has carved out an inverse head and shoulders in addition to basing for 10+ years. Watch this stock for leadership.
GAMEPLAN is, however hard it is, to let this move go and then look to buy the “outside return” against the neckline around 28. Initial targets are shown …
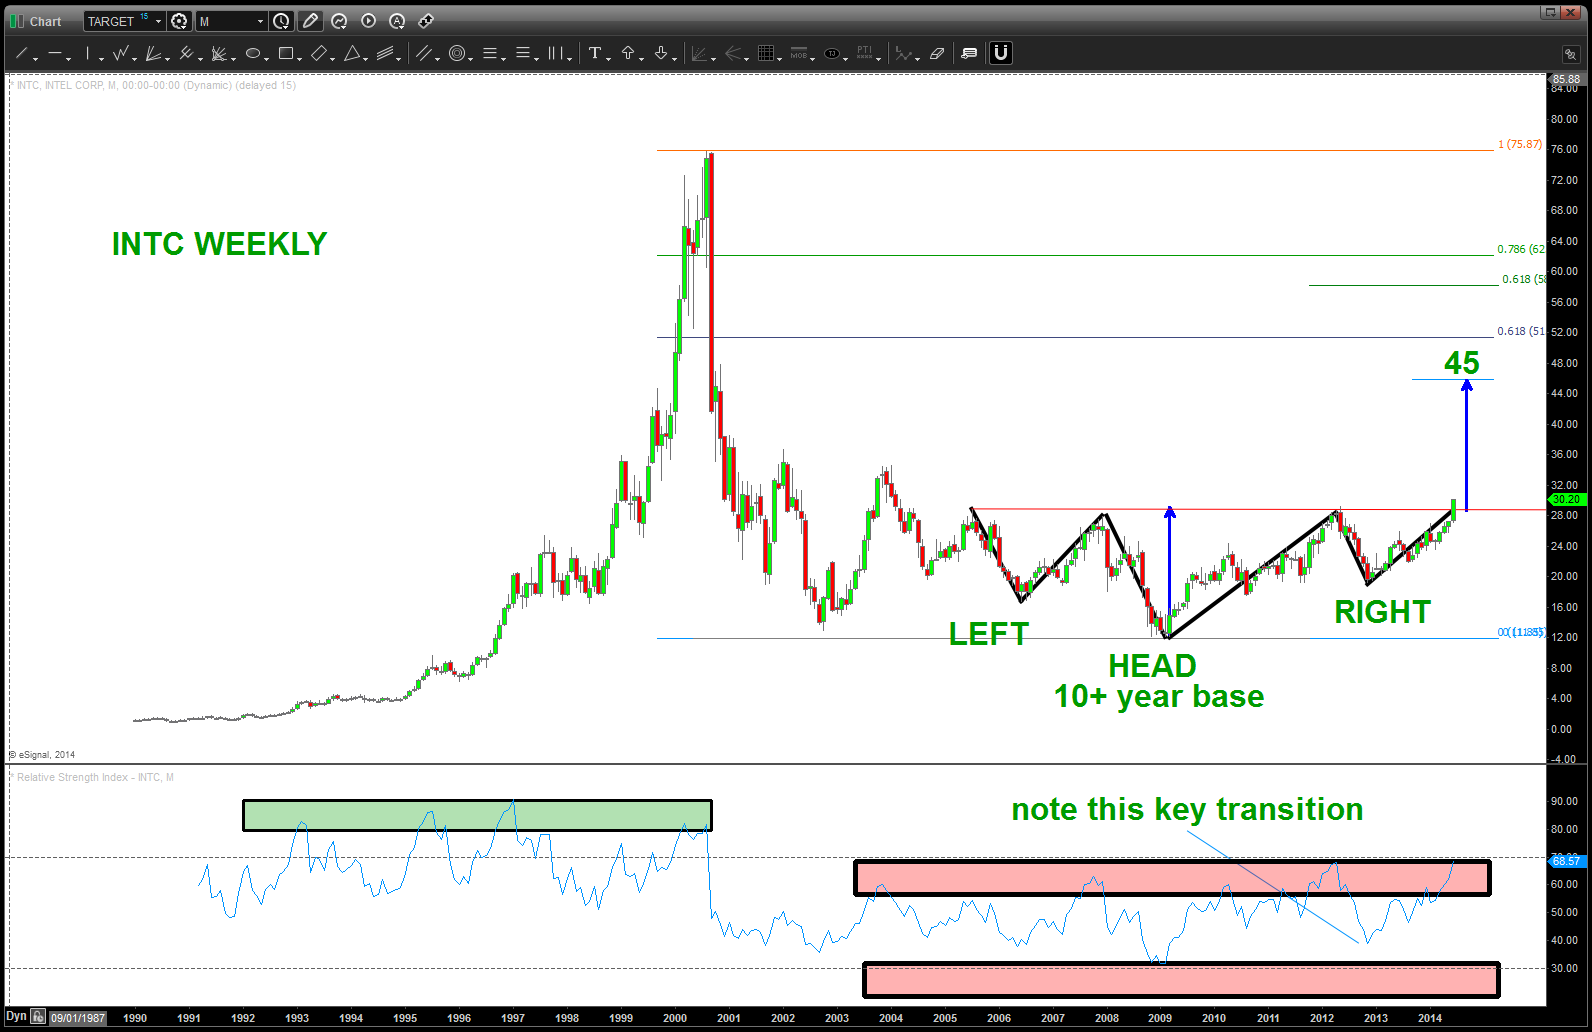
INTC WEEKLY
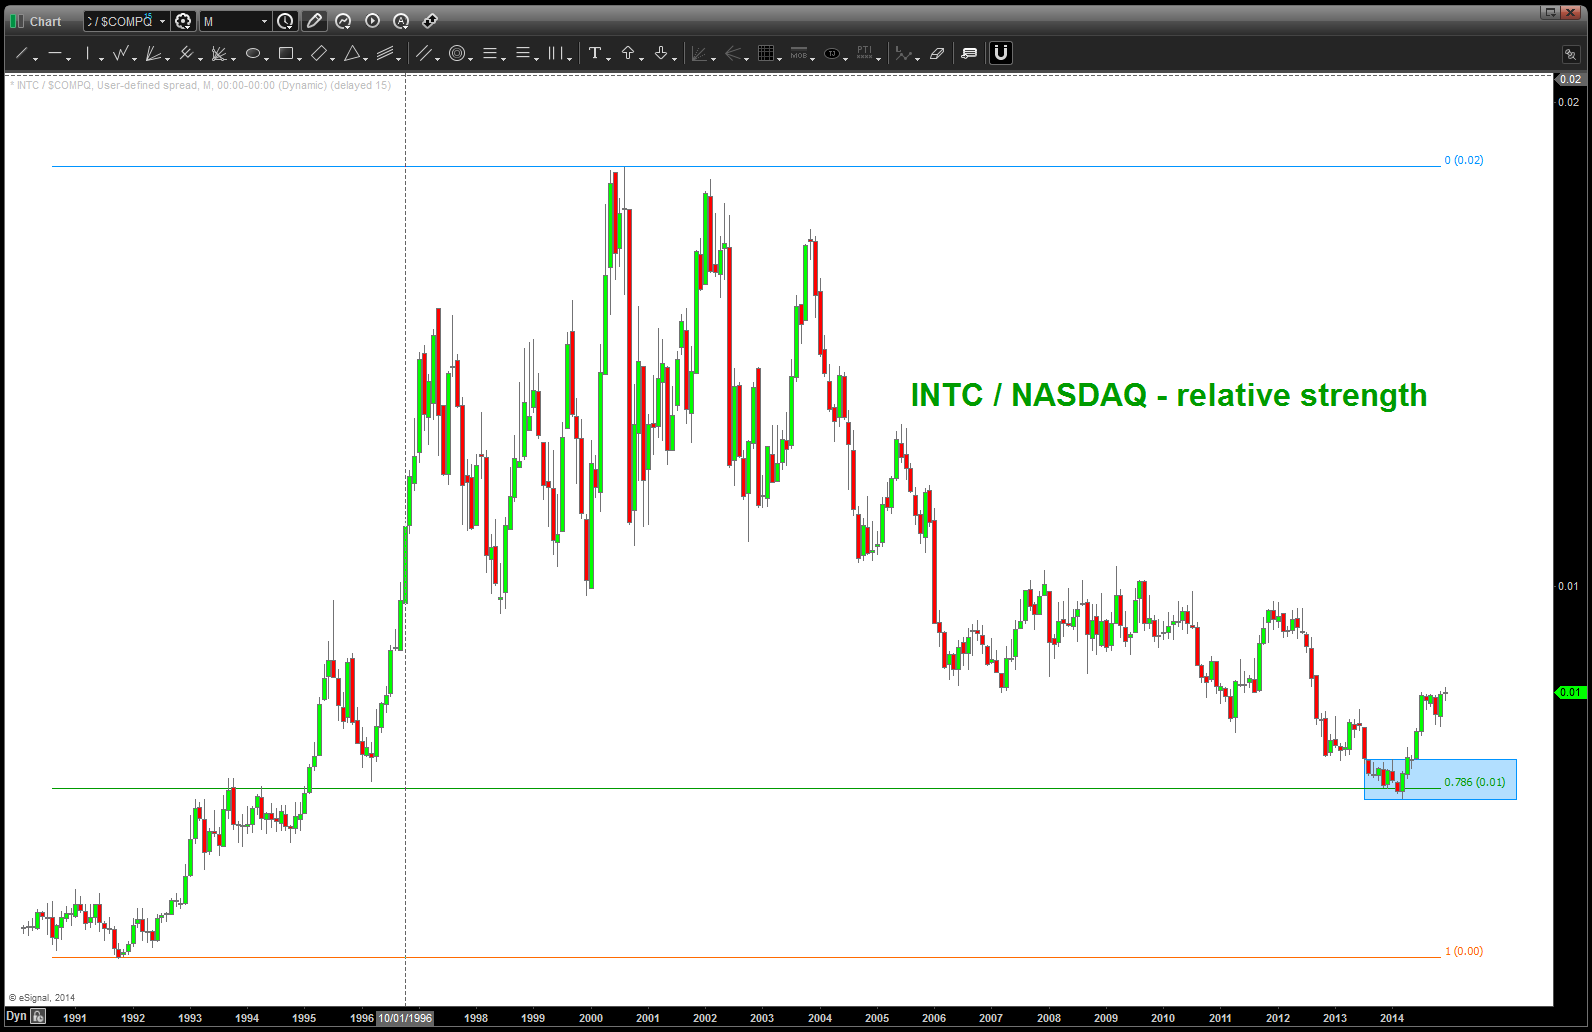
Now, we need to ask ourselves, how is the stock doing against the NASDAQ? This is where we go to our ratio analysis and look at the picture below … banged right off the .786 retracement level and perhaps this is a rotational play by the institutions. What a nice picture …
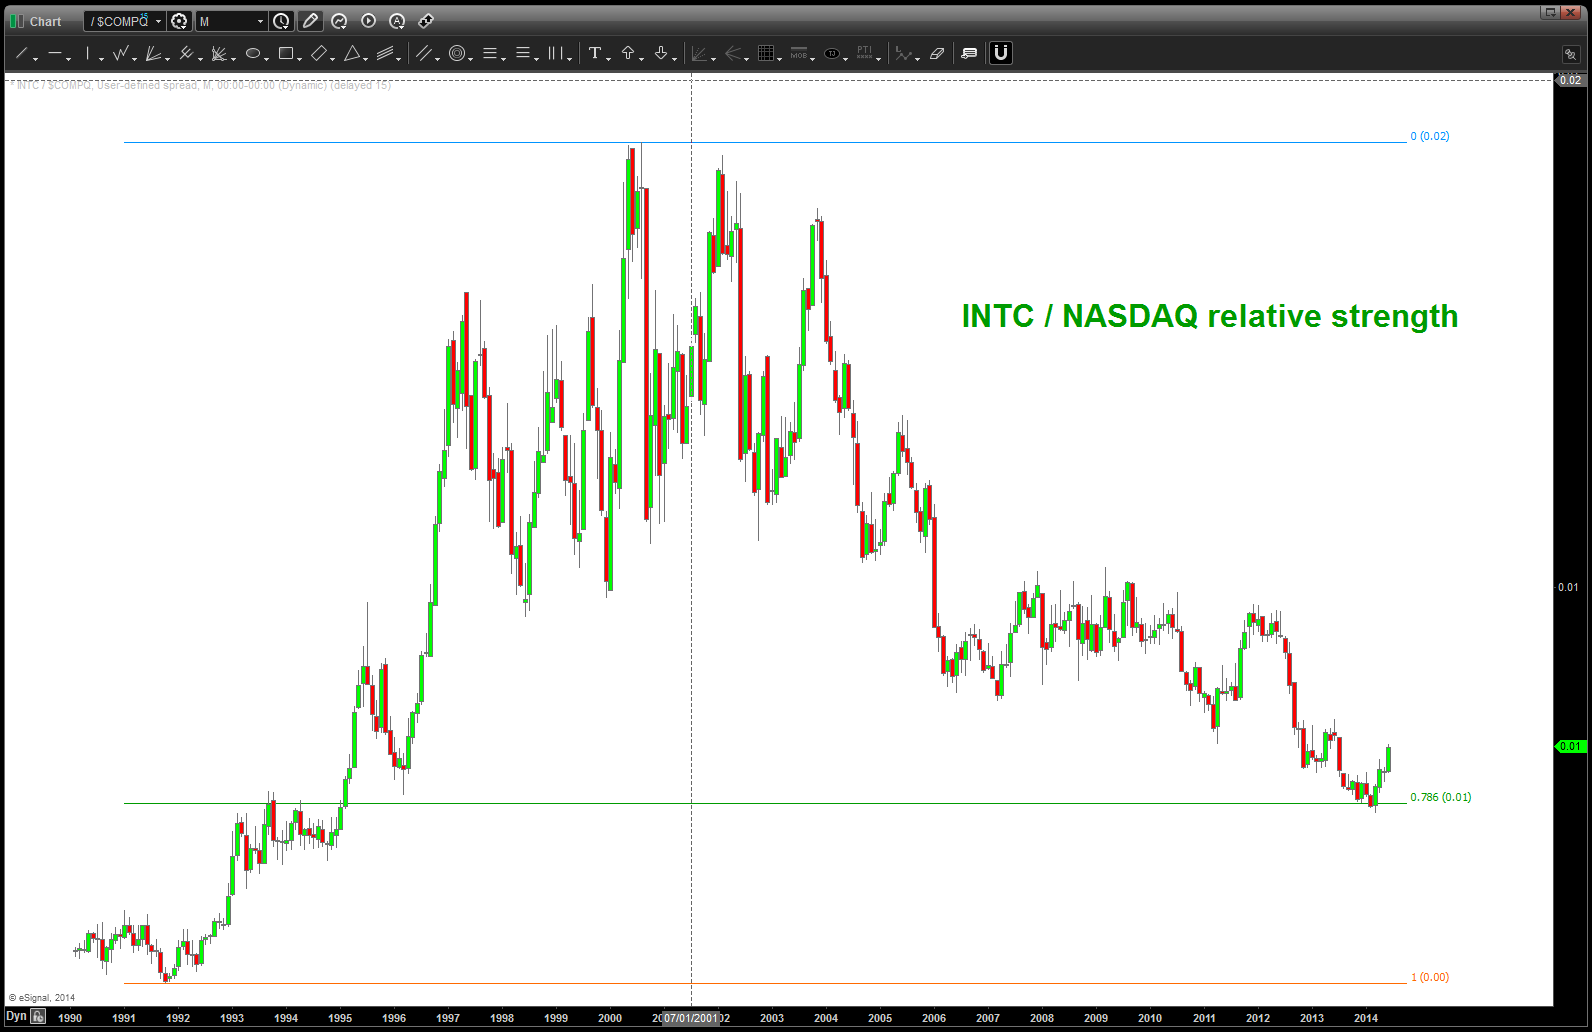
ratio analysis of INTC / NASDAQ
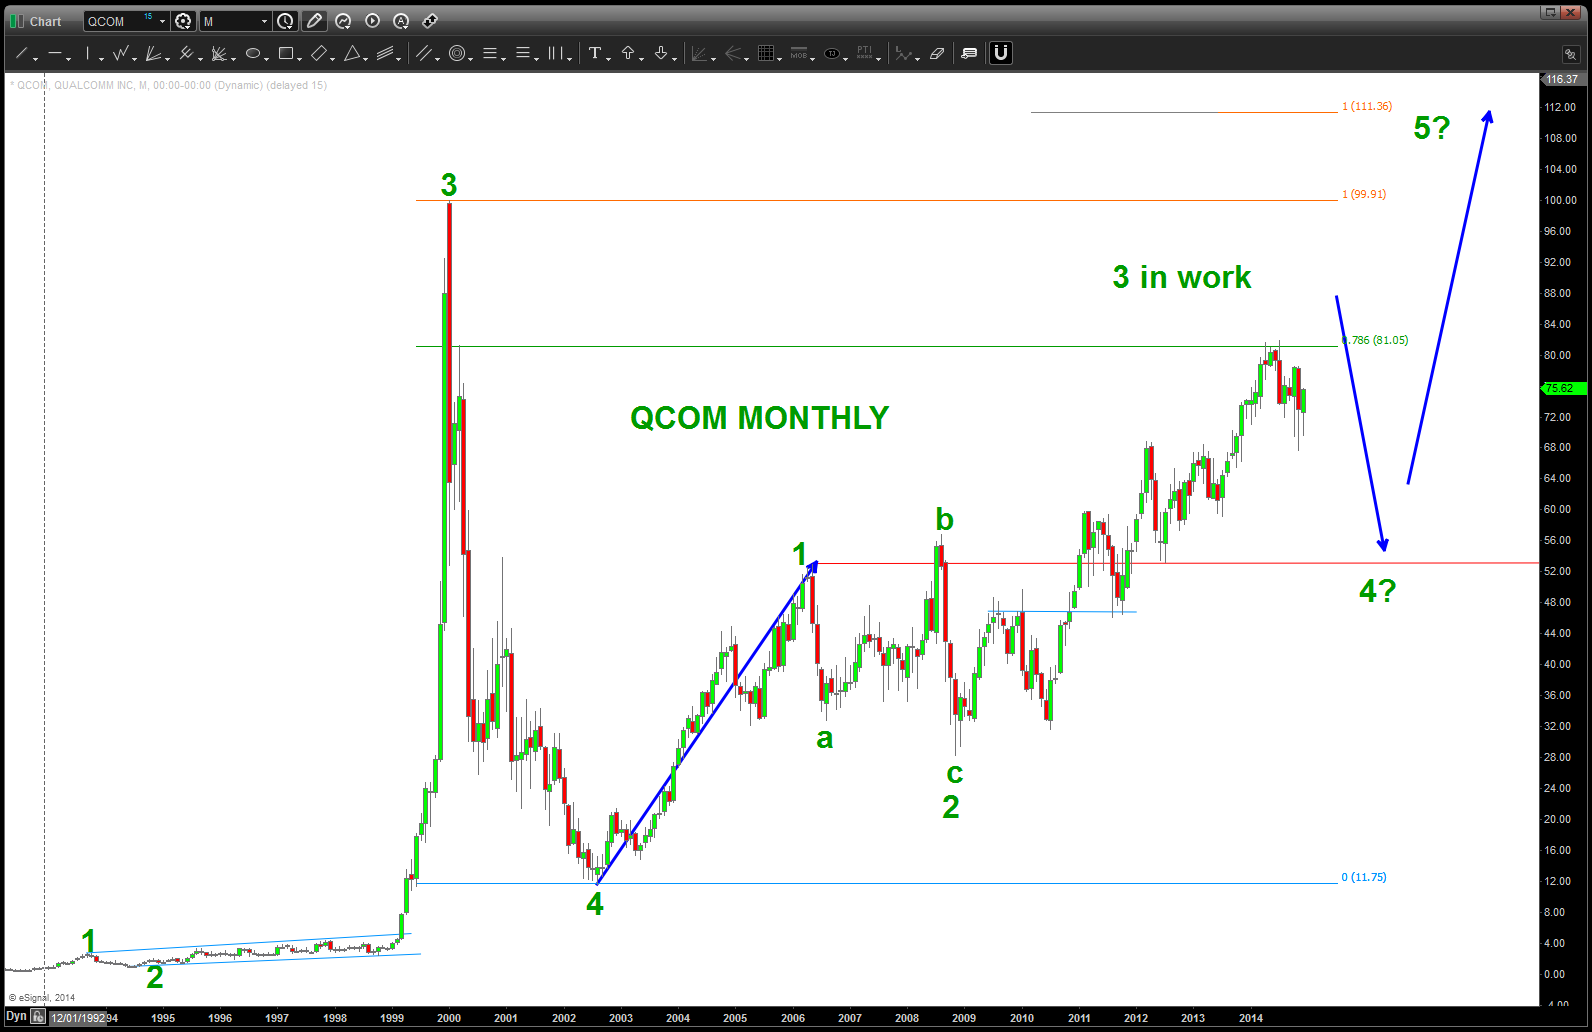
QCOM
Posted on December 27, 2014 Leave a Comment
QCOM appears to be in a 3rd wave advance. Expecting some resistance for a 4th wave pullback/consolidation and then a final thrust in wave 5 into the 111 area. Will update as it progresses …