most important chart to end 2014
Posted on December 6, 2014 5 Comments
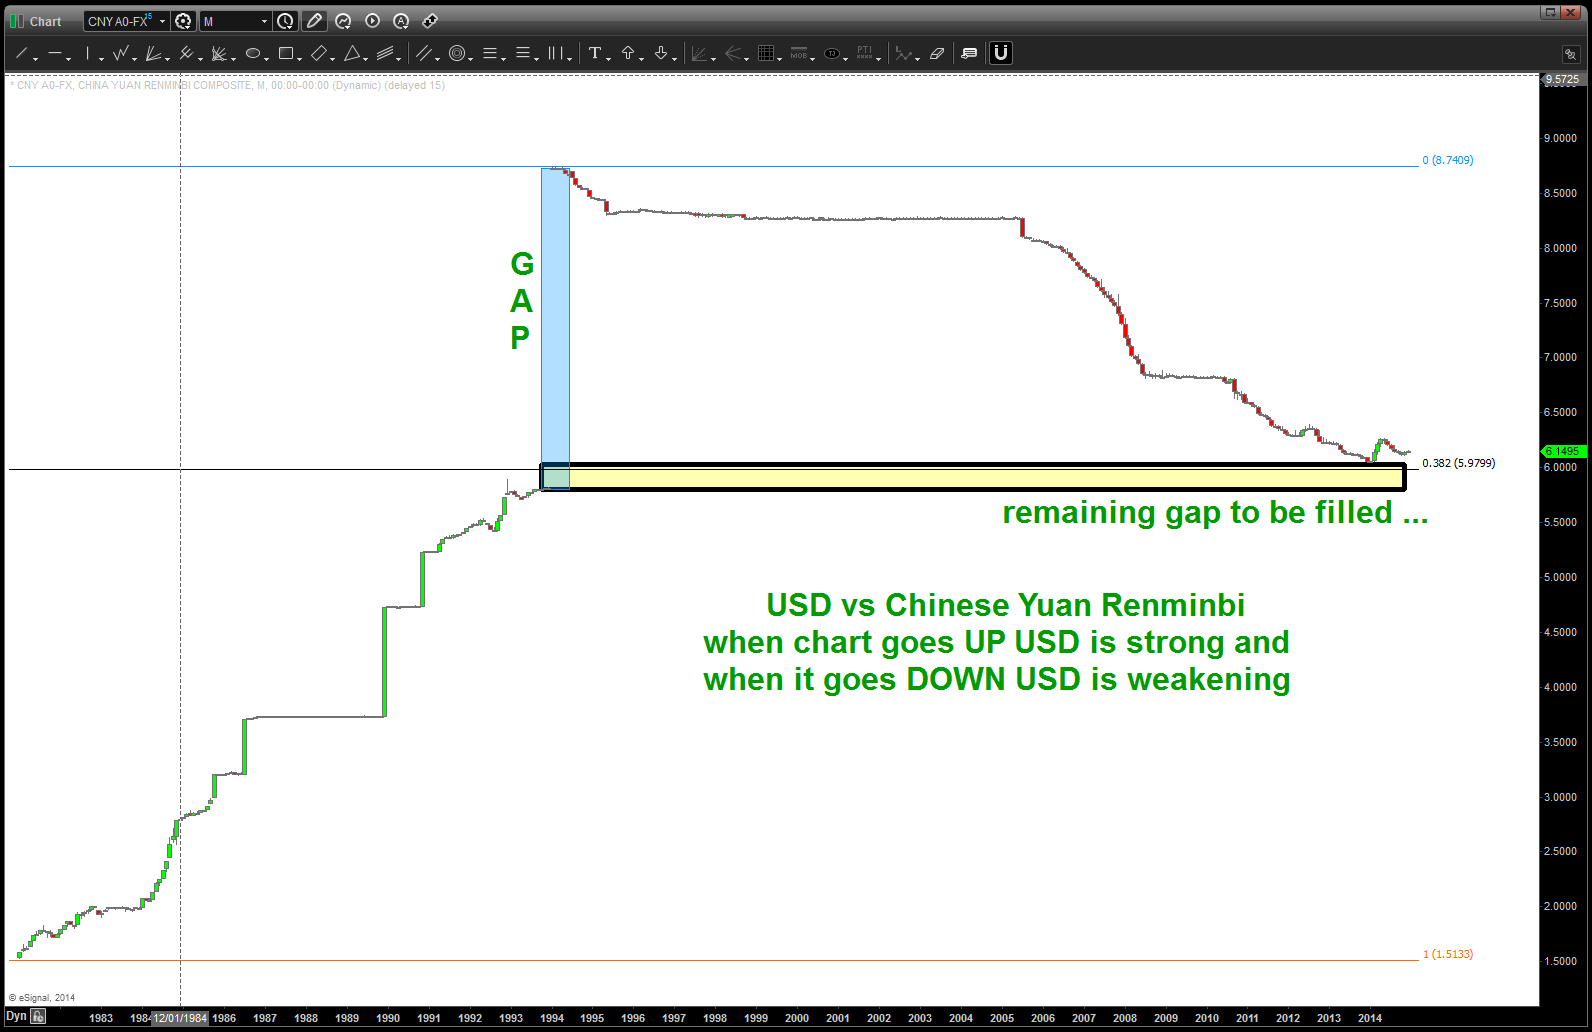
Folks, there is a major global move occurring in the biggest market in the world – the FX market.
Not only is the YEN,RUBBLE and EURO simply crashing the Chinese Yuan continues to weaken against the USD. This is a big deal and should be watched closely. We’ve been blogging about it for a while (https://bartscharts.com//?s=yuan )
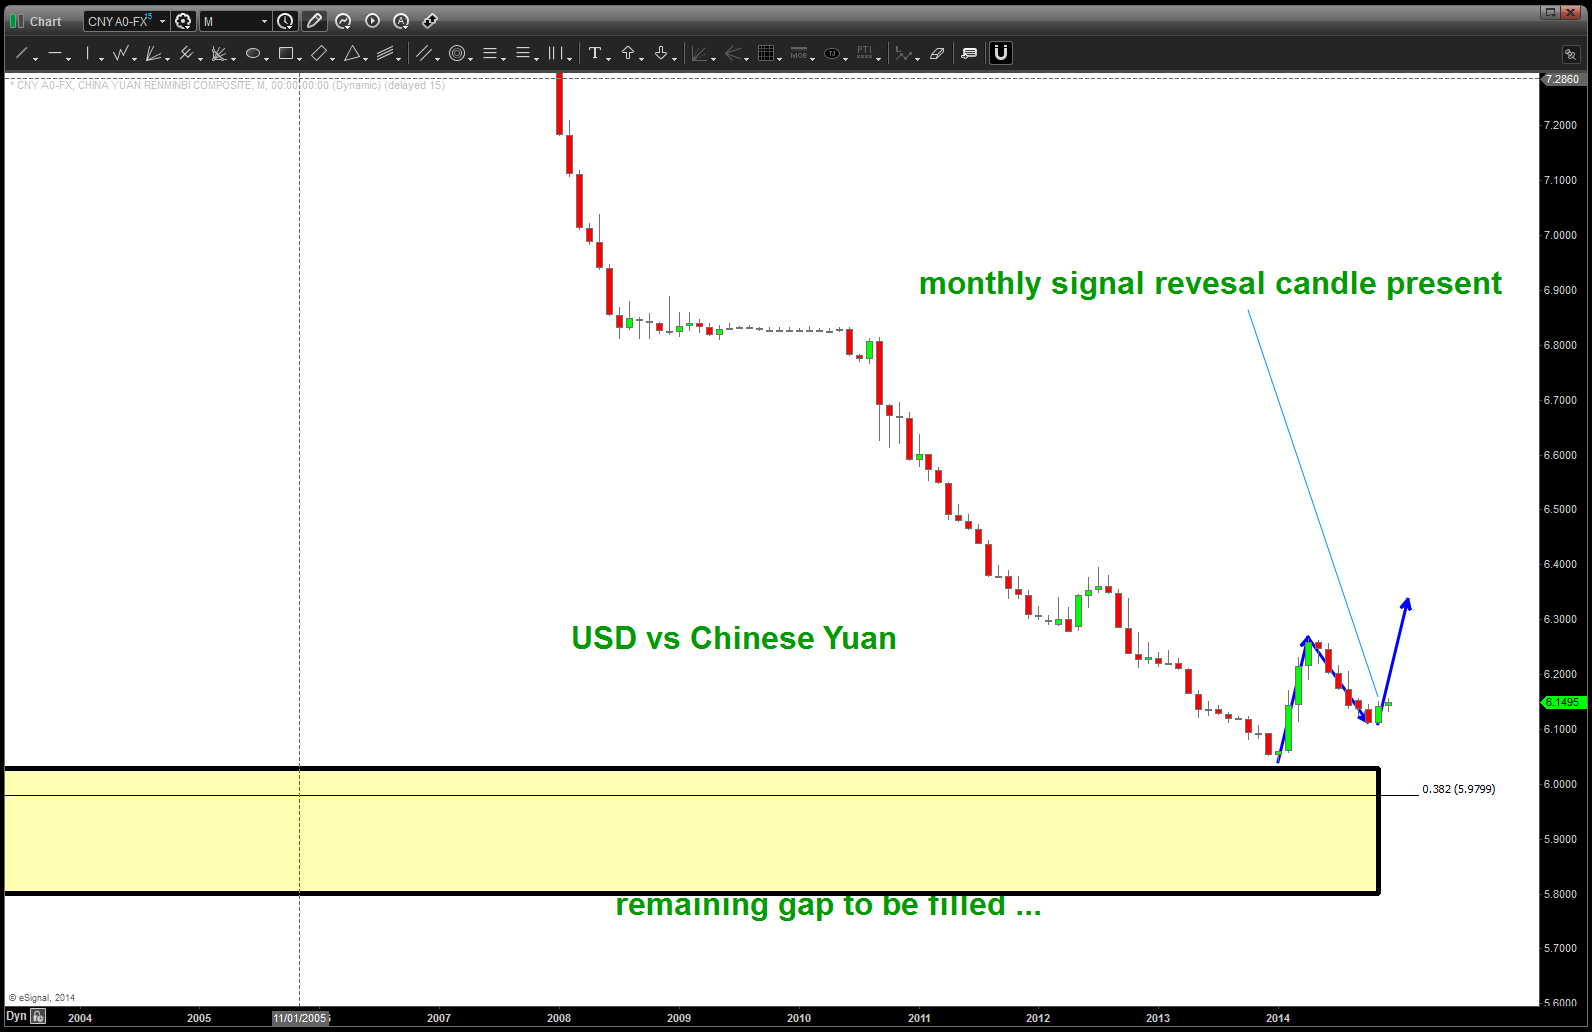
Appears, for now, our pattern has worked and the $$$ has again started to rise …
quick look at the YEN and the Nikkei 225
Posted on November 29, 2014 Leave a Comment
I’ve seen the catch phrase – “it’s raining YEN” and, well, it certainly has…folks, believe it or not I got stopped out around 77.5 on the USDJPY. What a game, what a game …
Anyhoooooo …. couple YEN things:
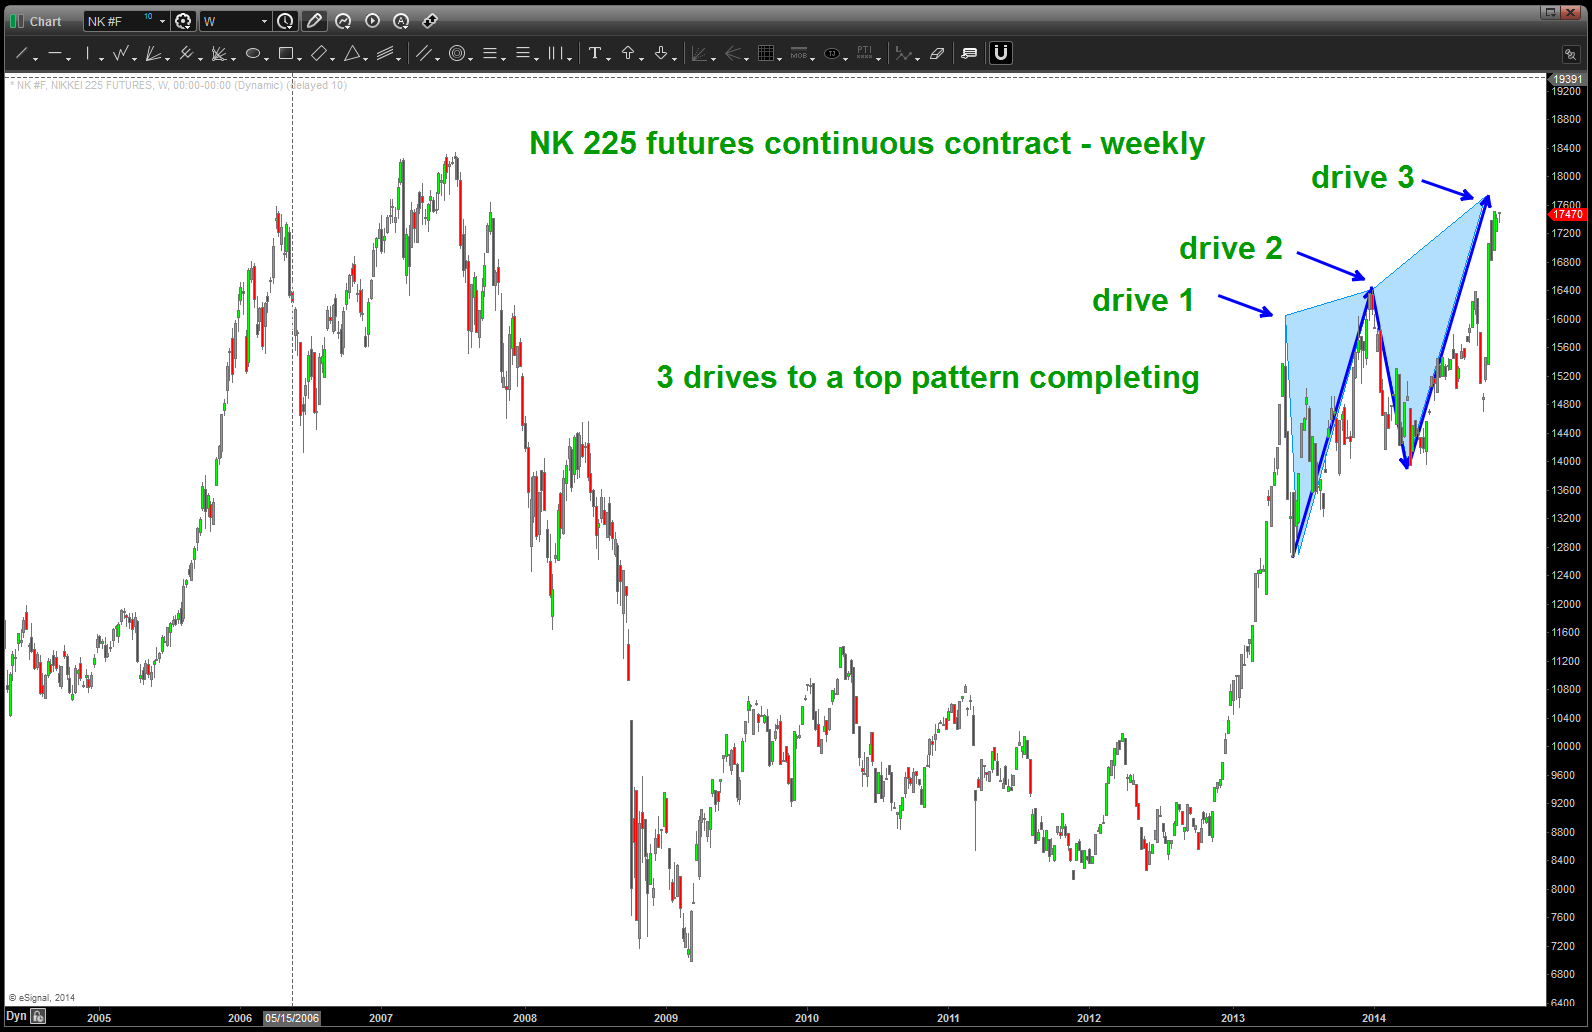
- 3 drives to a top pattern present on the NK225 continuous futures.
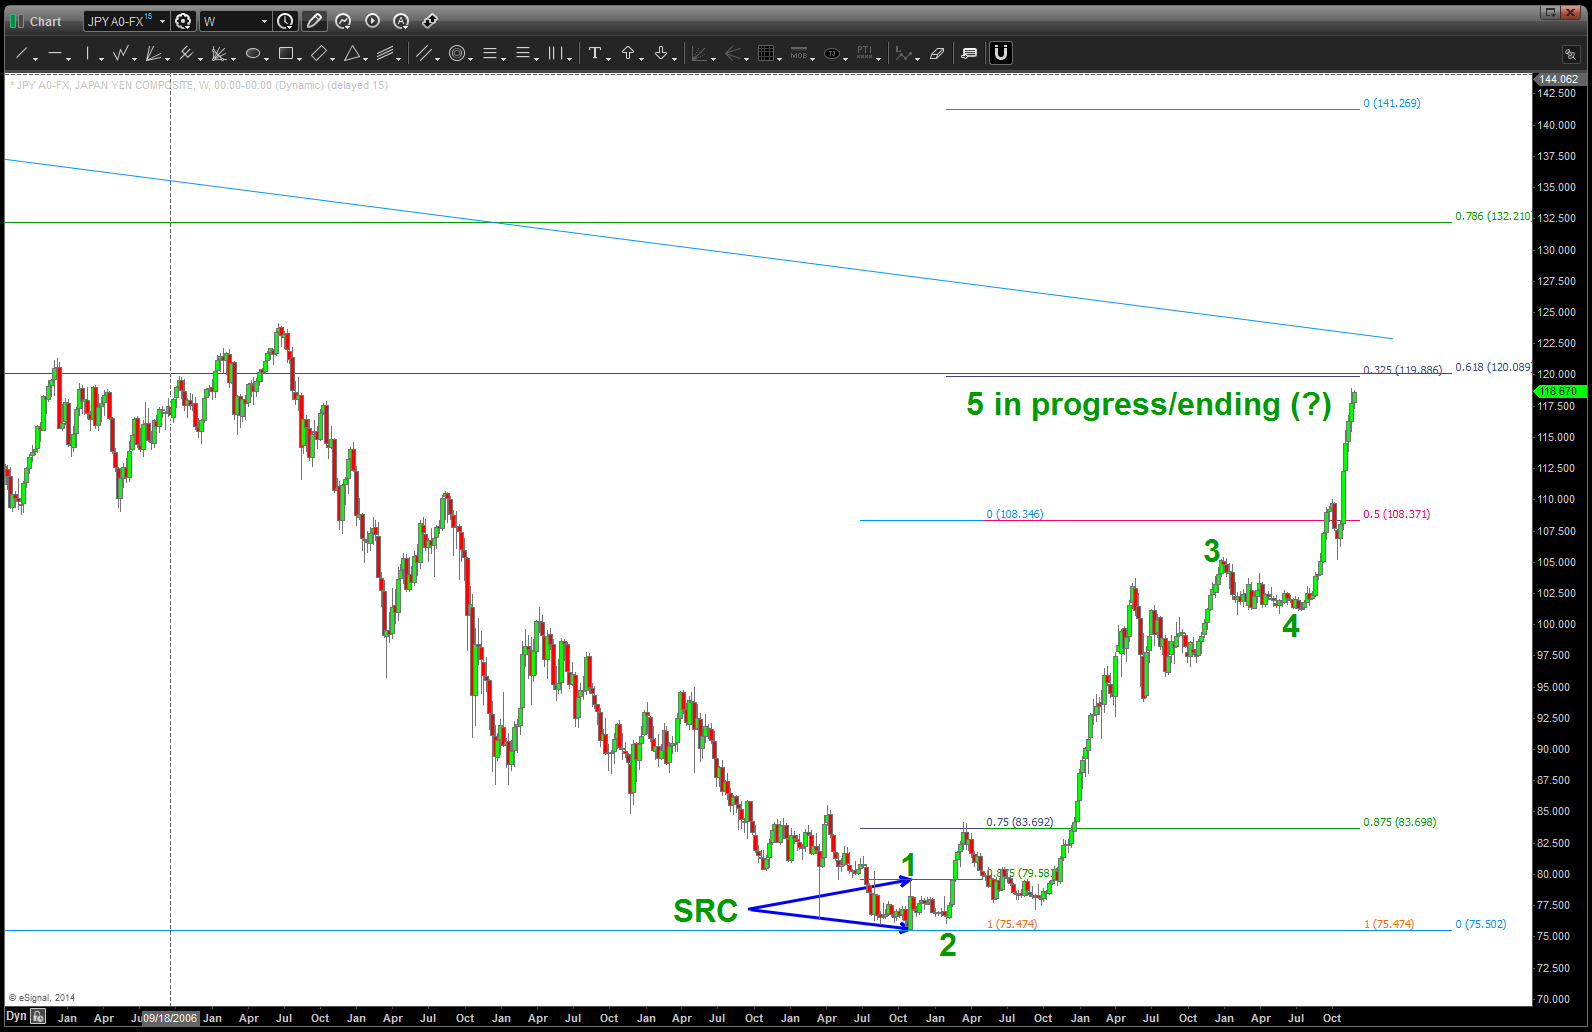
- USDJPY – a STRONG 5 waves complete/completing on the USDJPY … perhaps a little higher into the 120 handle as shown.
- .618 retrace is from the top of the decade long triangle .. we also have the 1/8 ths projection method using the signal reversal candle (SRC) sitting on top of the .618. (that’s the .325) FYI … this technique projects 141.25 on the JPY.
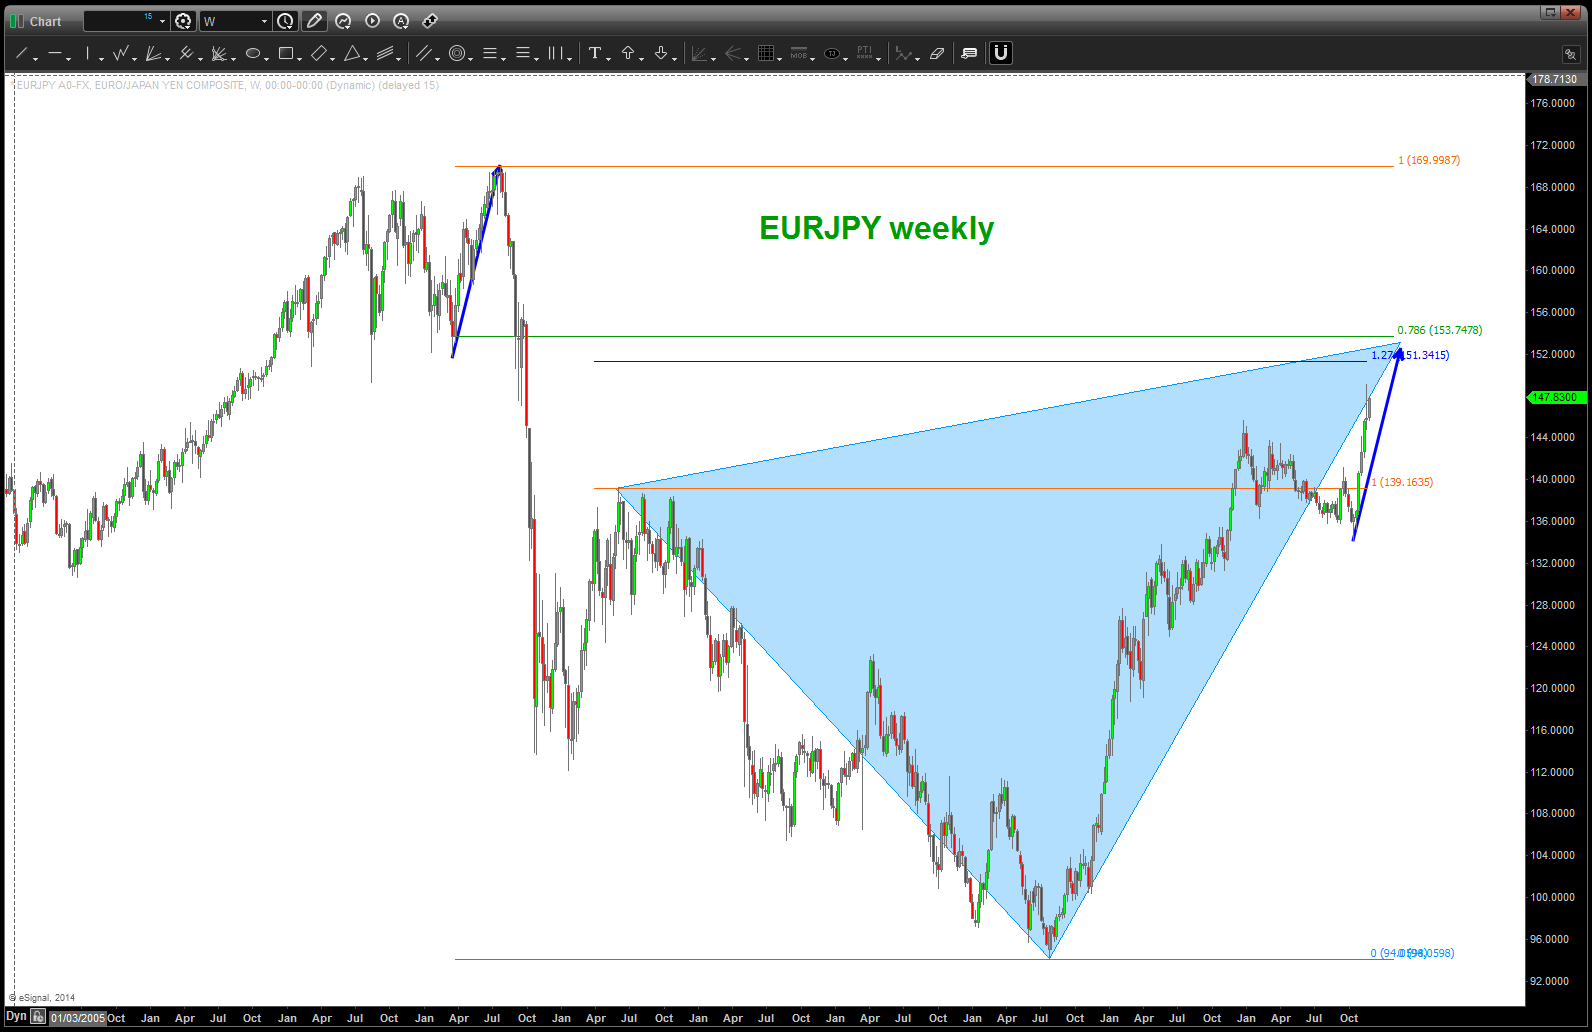
- EURJPY perhaps a little higher into the 151-153 handle
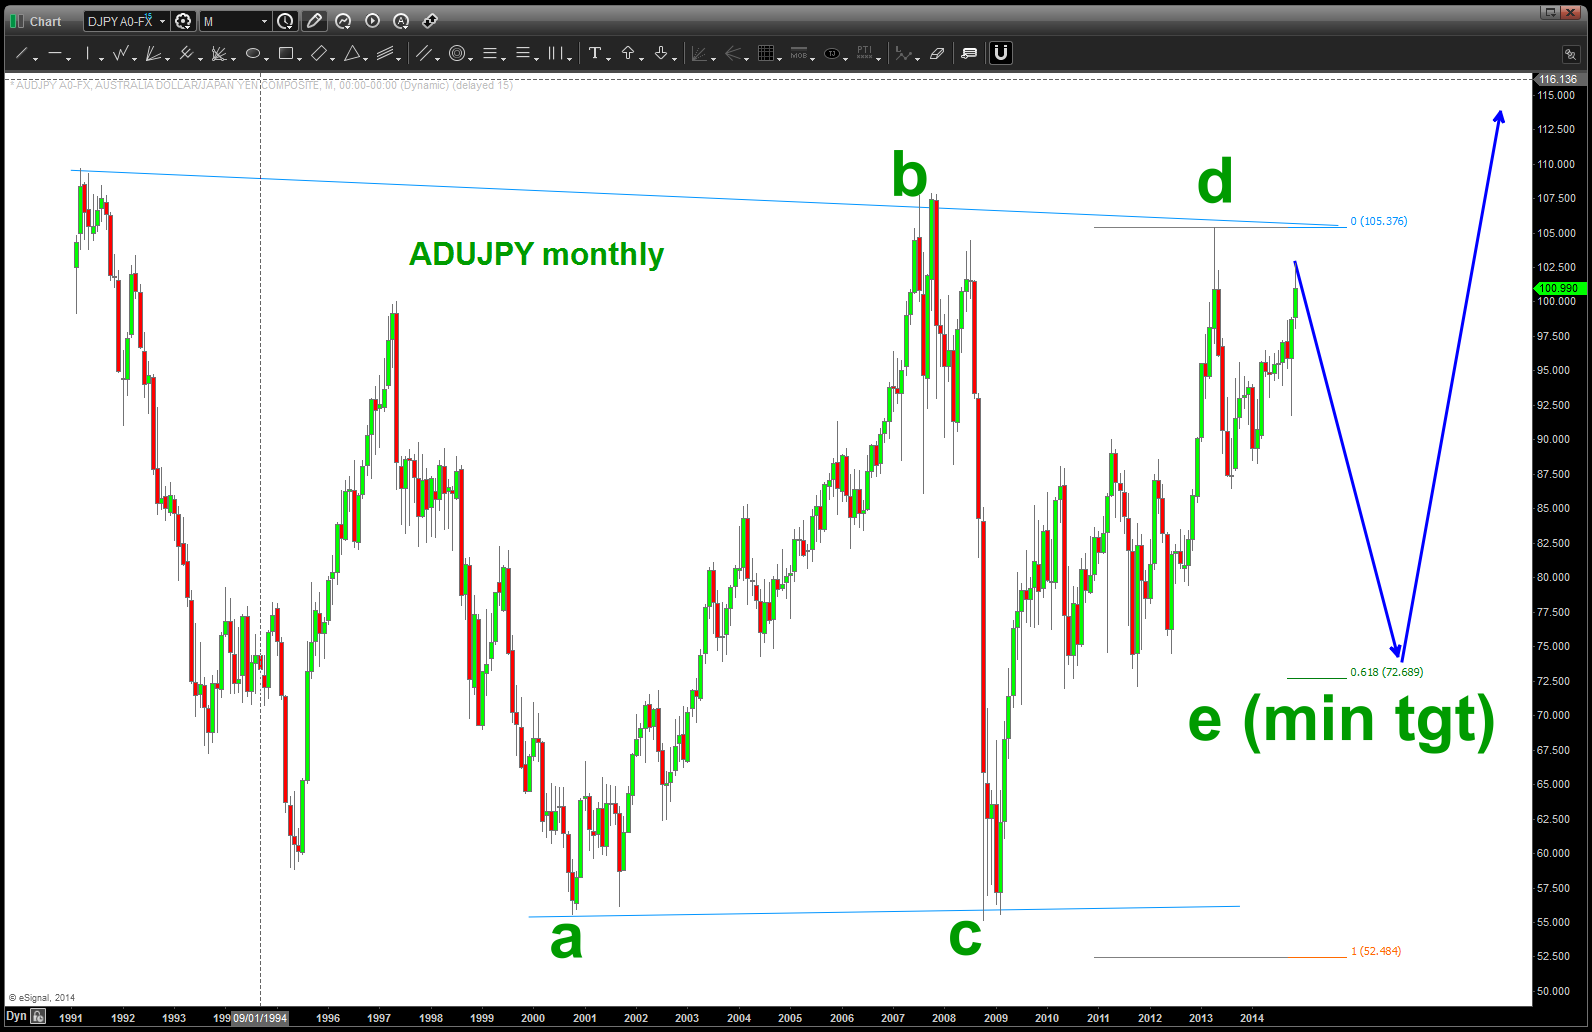
- AUDJPY pattern hit PERFECTLY … working that one tomorrow night.
- THESIS (only a thesis) – this is a MONSTER triangle …..
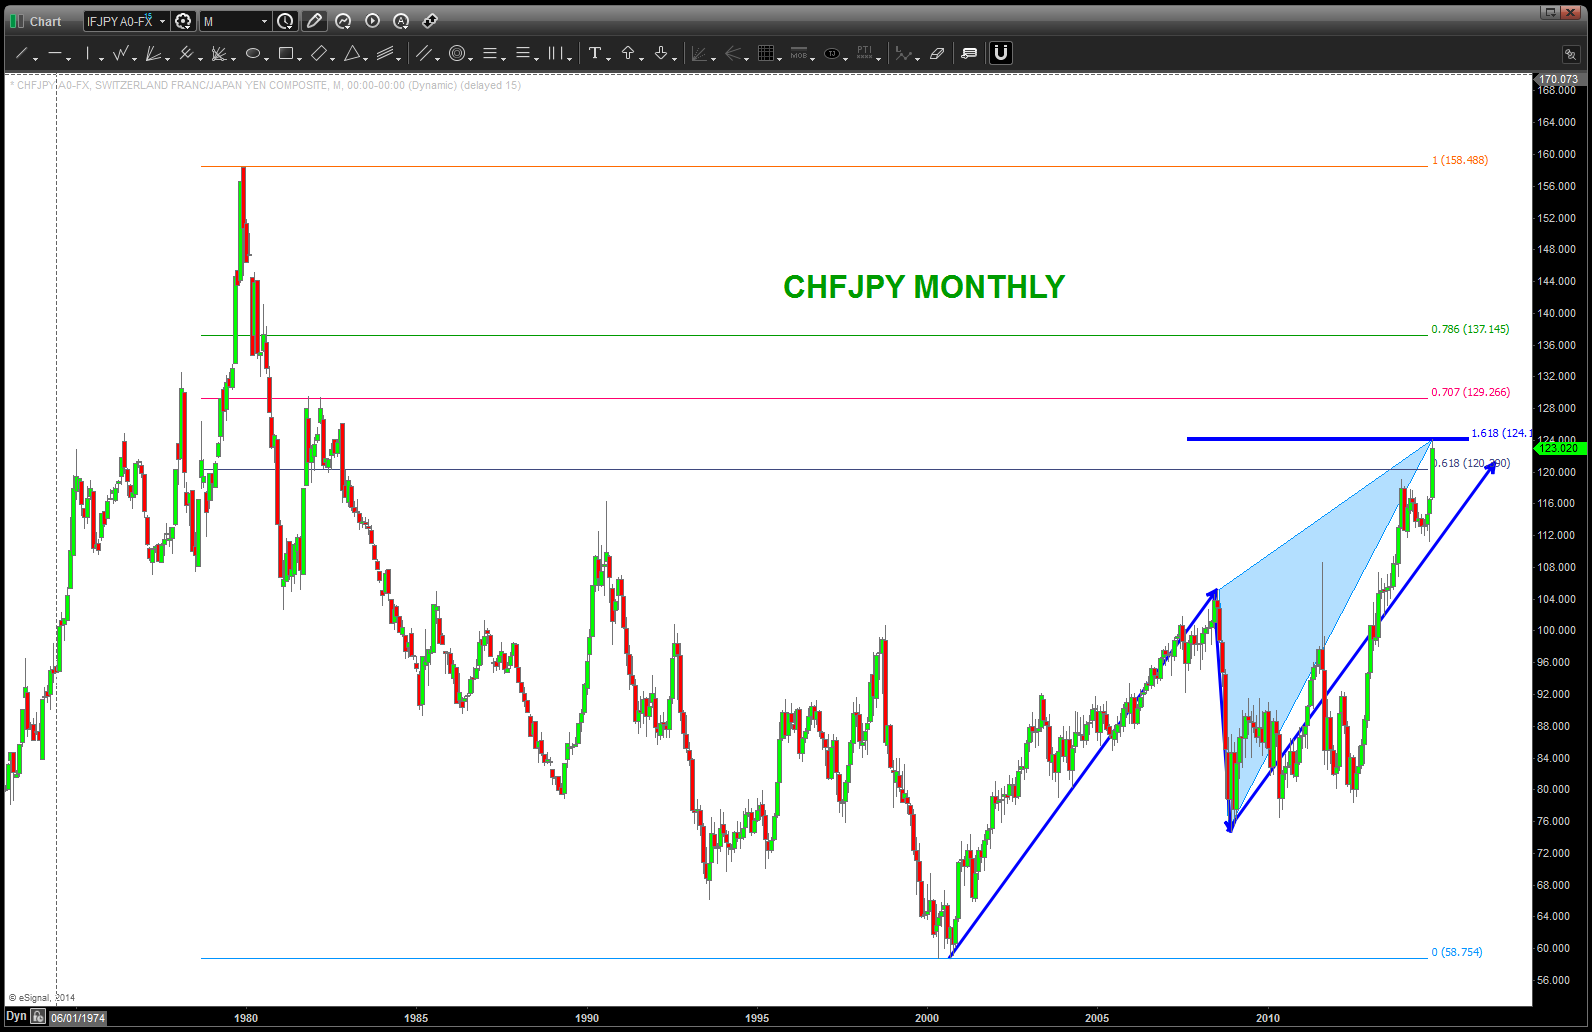
- CHFJPY – 1.618 extension pattern complete
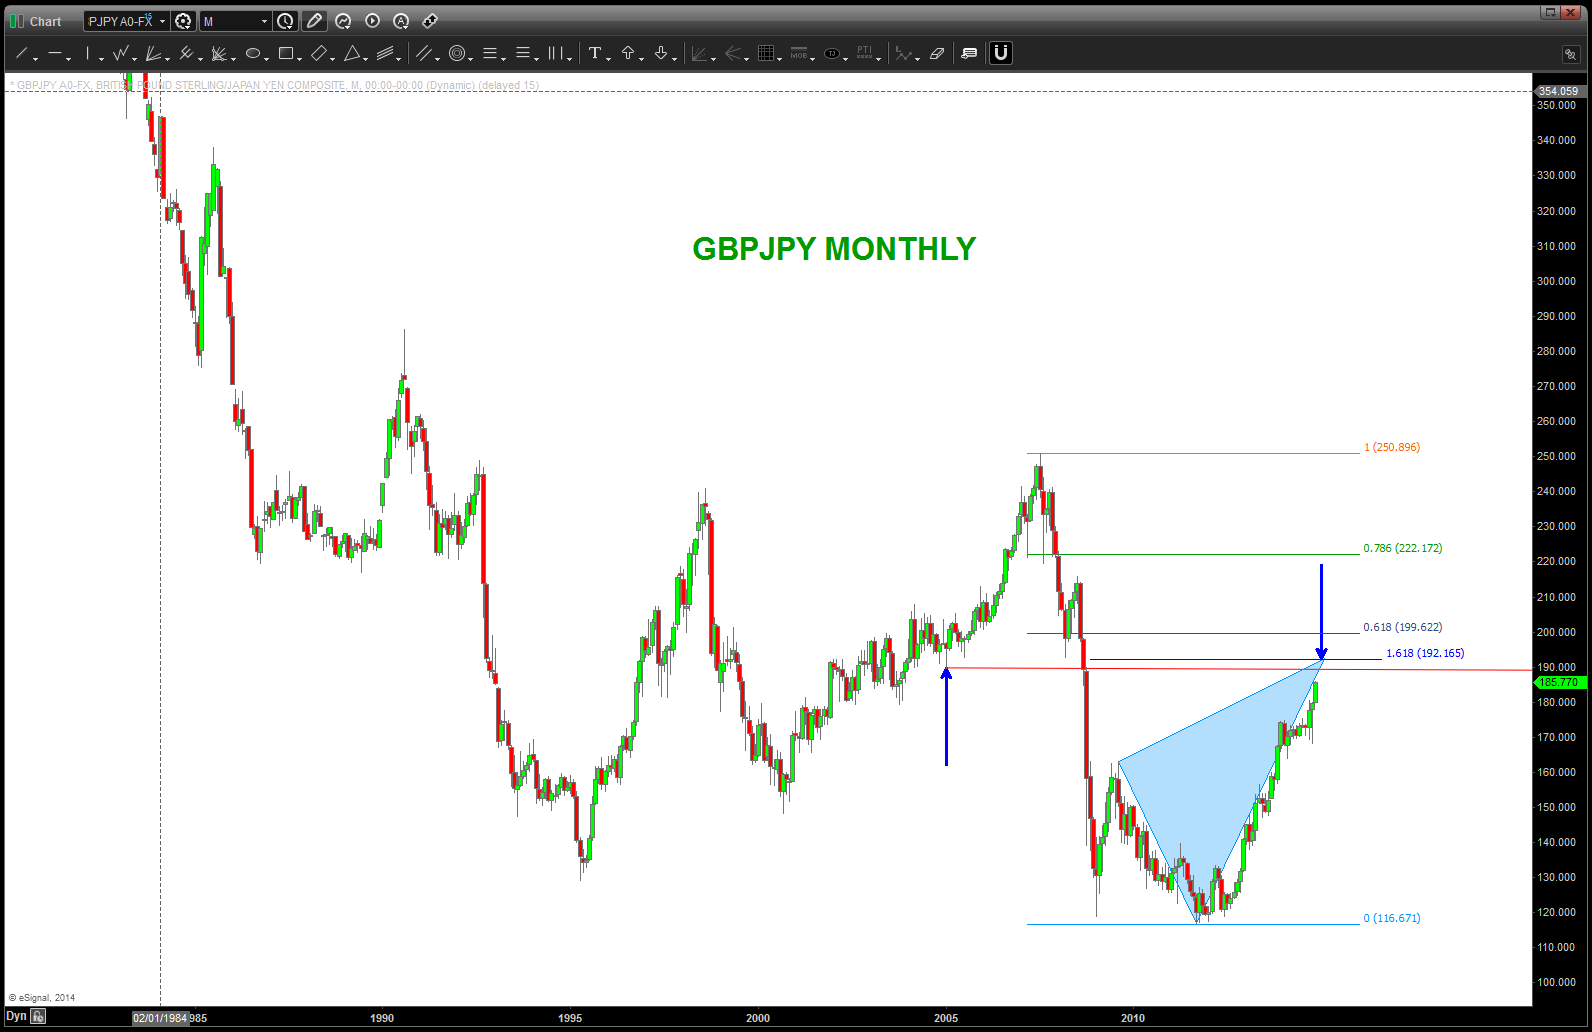
- GBPJPY – pattern appearing …
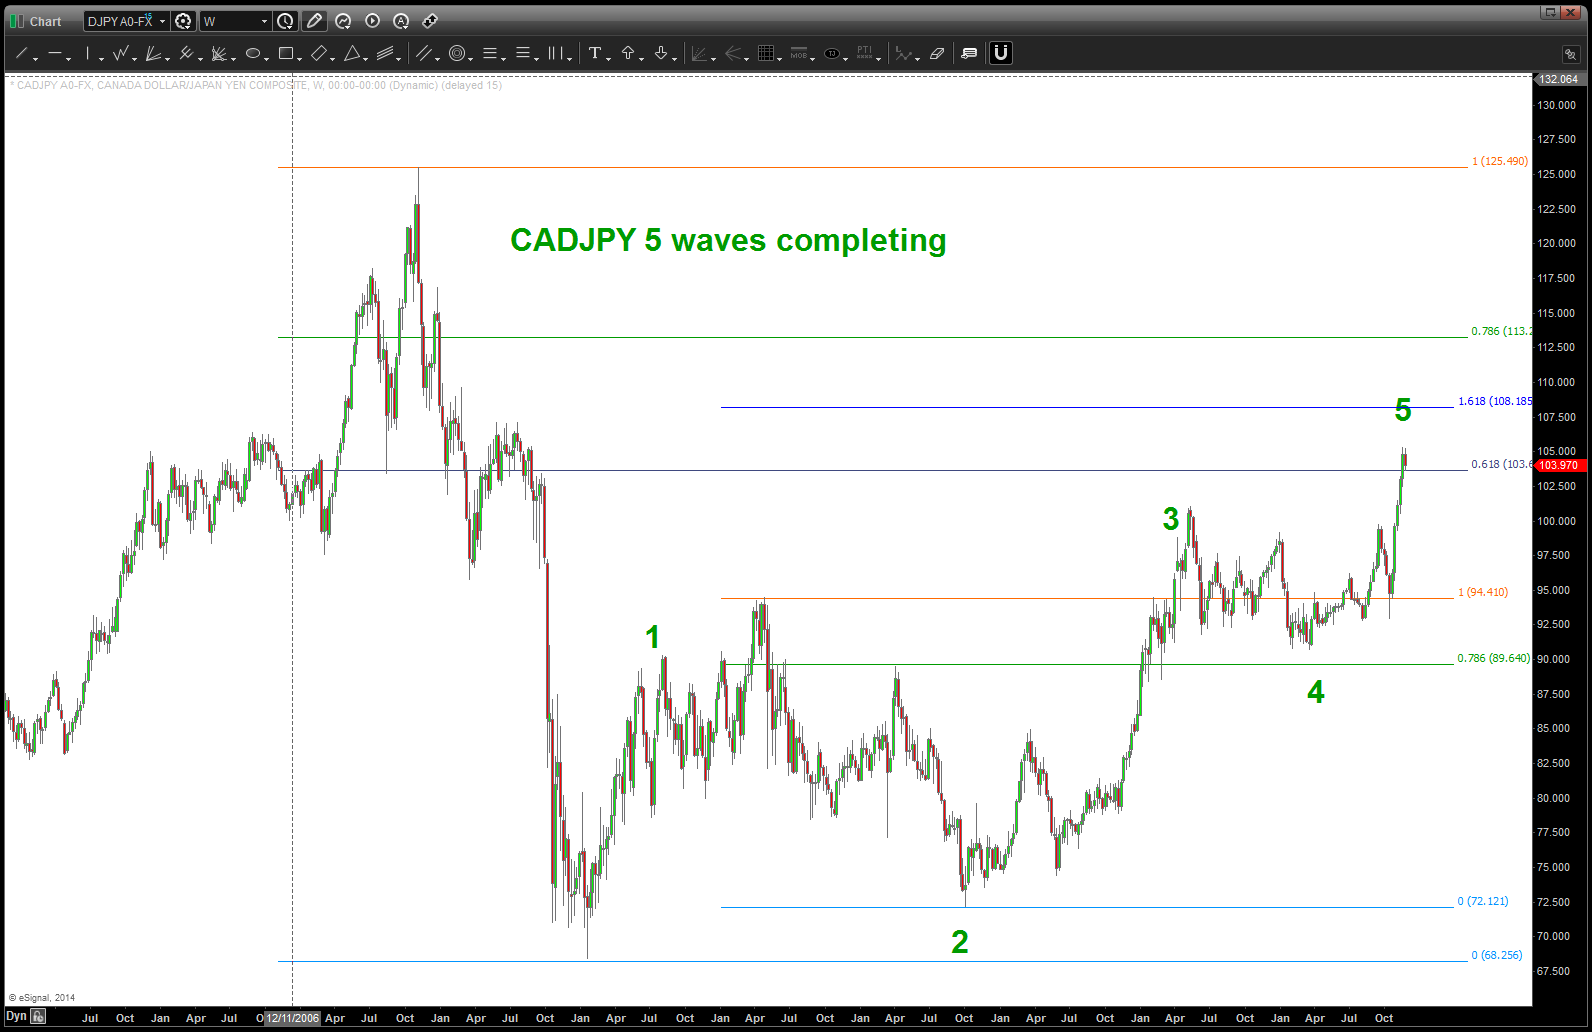
- CADJPY – 5 waves appearing to be complete or completing
So, yes the BOJ has made it pretty darn clear on their intentions … however, I’m a pattern guy and it appears the patterns are calling for a bottom in the YEN …
the case for $170 oil ….
Posted on November 28, 2014 Leave a Comment
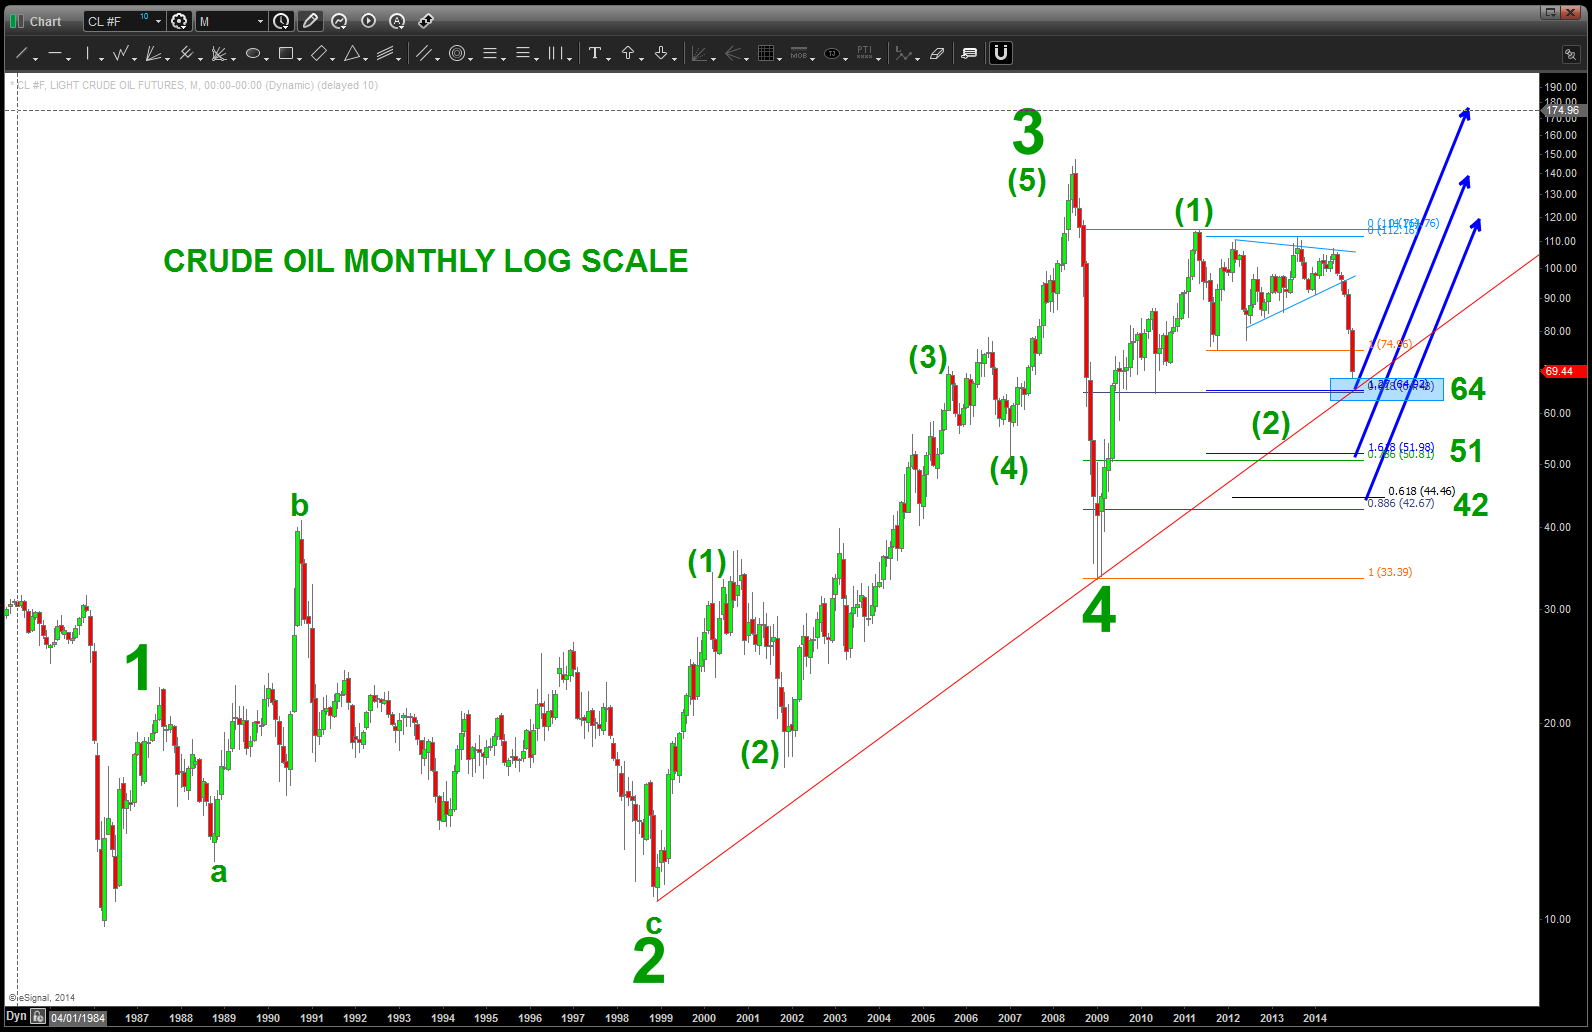
one chart – the only thing wrong w/ this chart is the length of the data. “wish” I had longer time frame oil prices. however, based on that I put together this count.
rules:
- 2 can’t go below the origin of 1: check.
- 3 can’t be the shortest: check
- 4 can’t go below 1: check
thesis, this move in oil is a C wave and is certainly acting like it.
why not step in and BUY at 64 OR wait for a nice pullback since, as shown below 67 might have done it. (NOTE: PRICE = TIME today for the 67 level)
What if … what if this count is correct? K A B O O M ….
the case for BULLish OIL …perhaps?
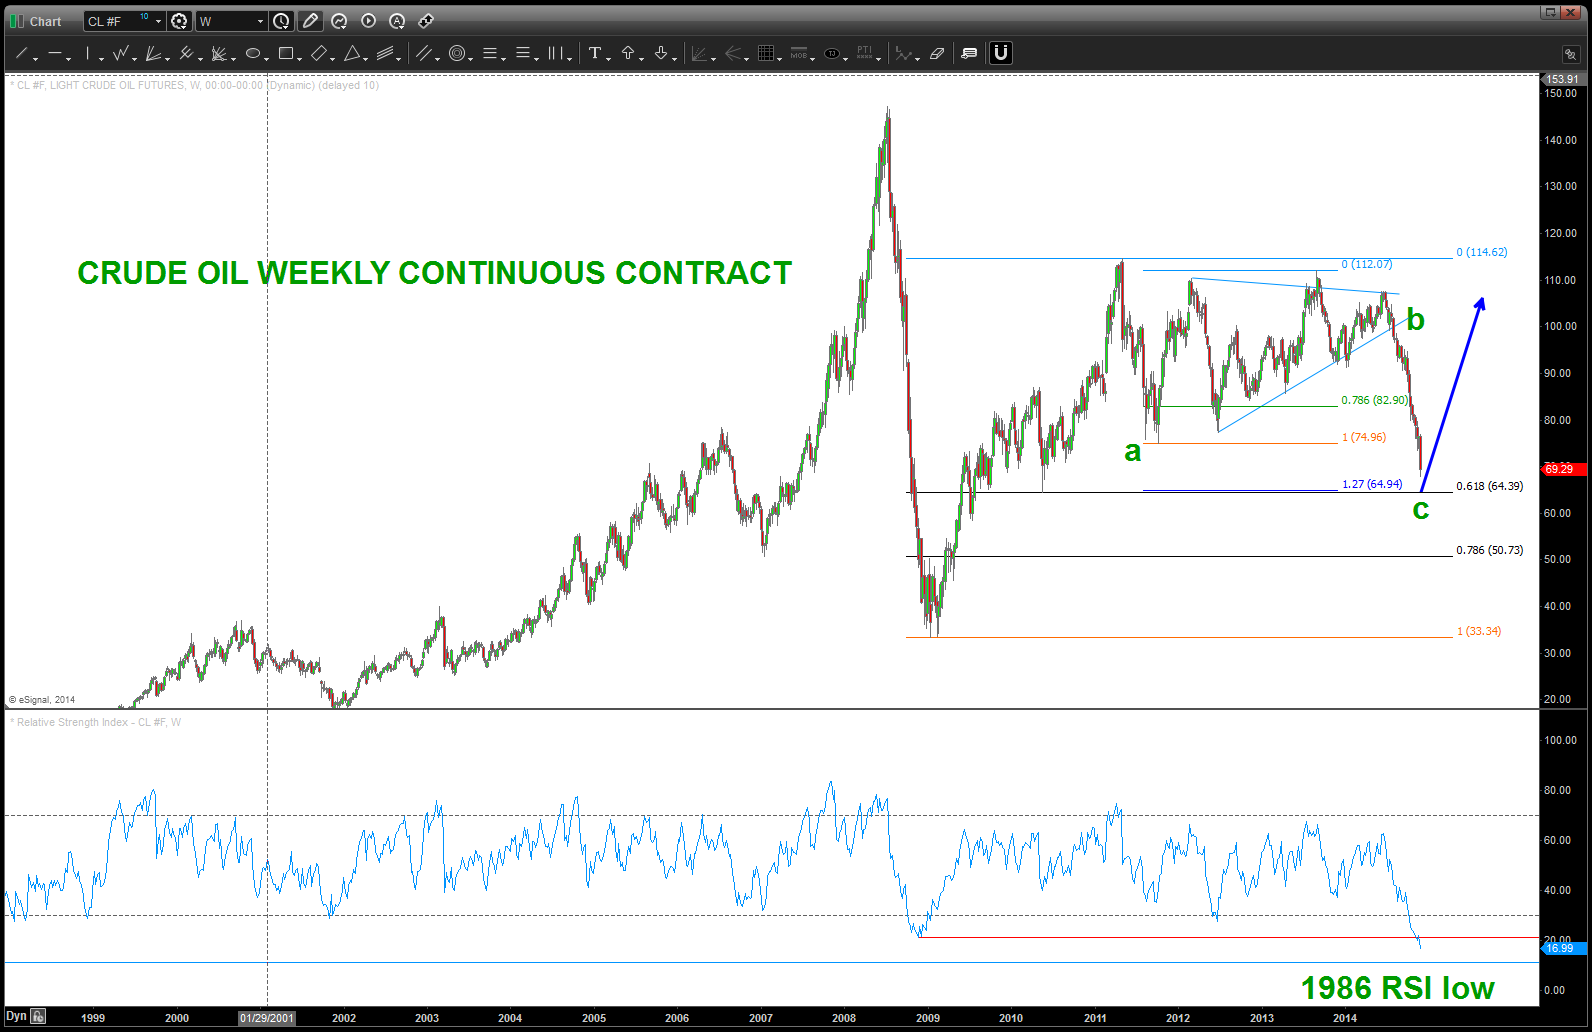
RSI ALMOST AT EXTREME
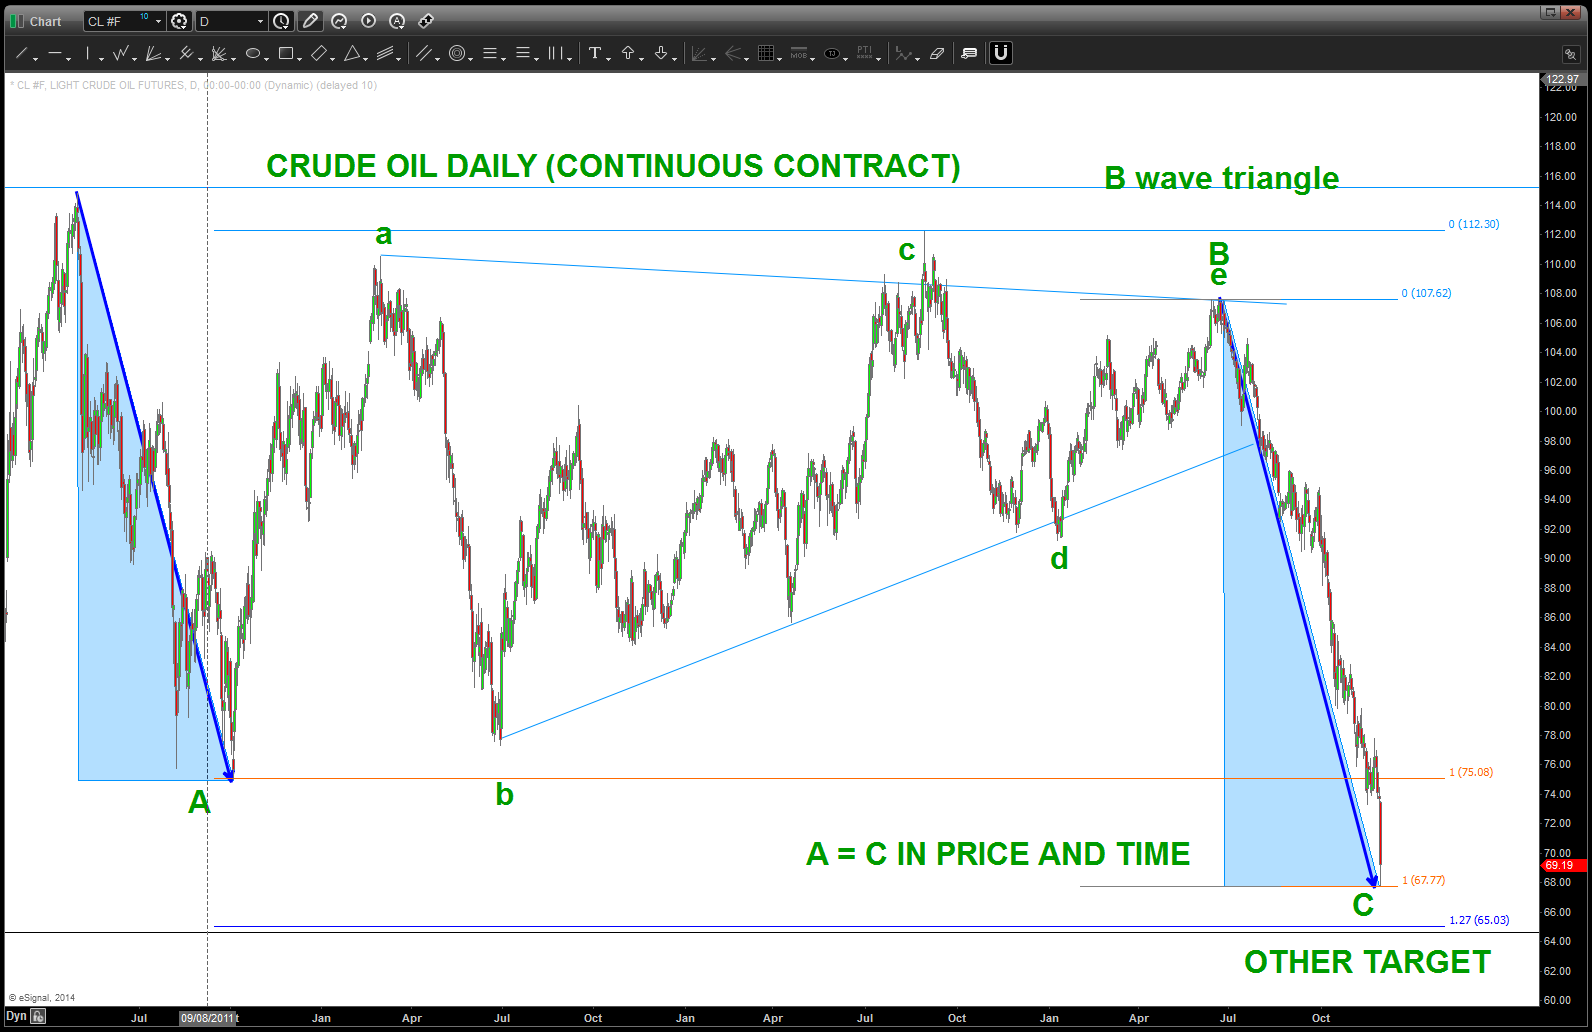
A=C IN PRICE AND TIME – TODAY
Chinese Yuan … decline continuing?
Posted on November 28, 2014 4 Comments
Per Bloomberg.com a couple hours ago:
China’s one-year interest-rate swaps completed the biggest weekly drop in four months after the central bank cut borrowing costs and stopped draining funds in open-market operations.
The People’s Bank of China reduced its benchmark rates for the first time since 2012 a week ago, supporting growth in an economy set for the slowest full-year expansion in two decades. Yesterday’s auction window was the first since July that the monetary authority didn’t offer repurchase agreements at, and maturing contracts added a net 35 billion yuan ($5.7 billion) to the financial system this week, the most since August.
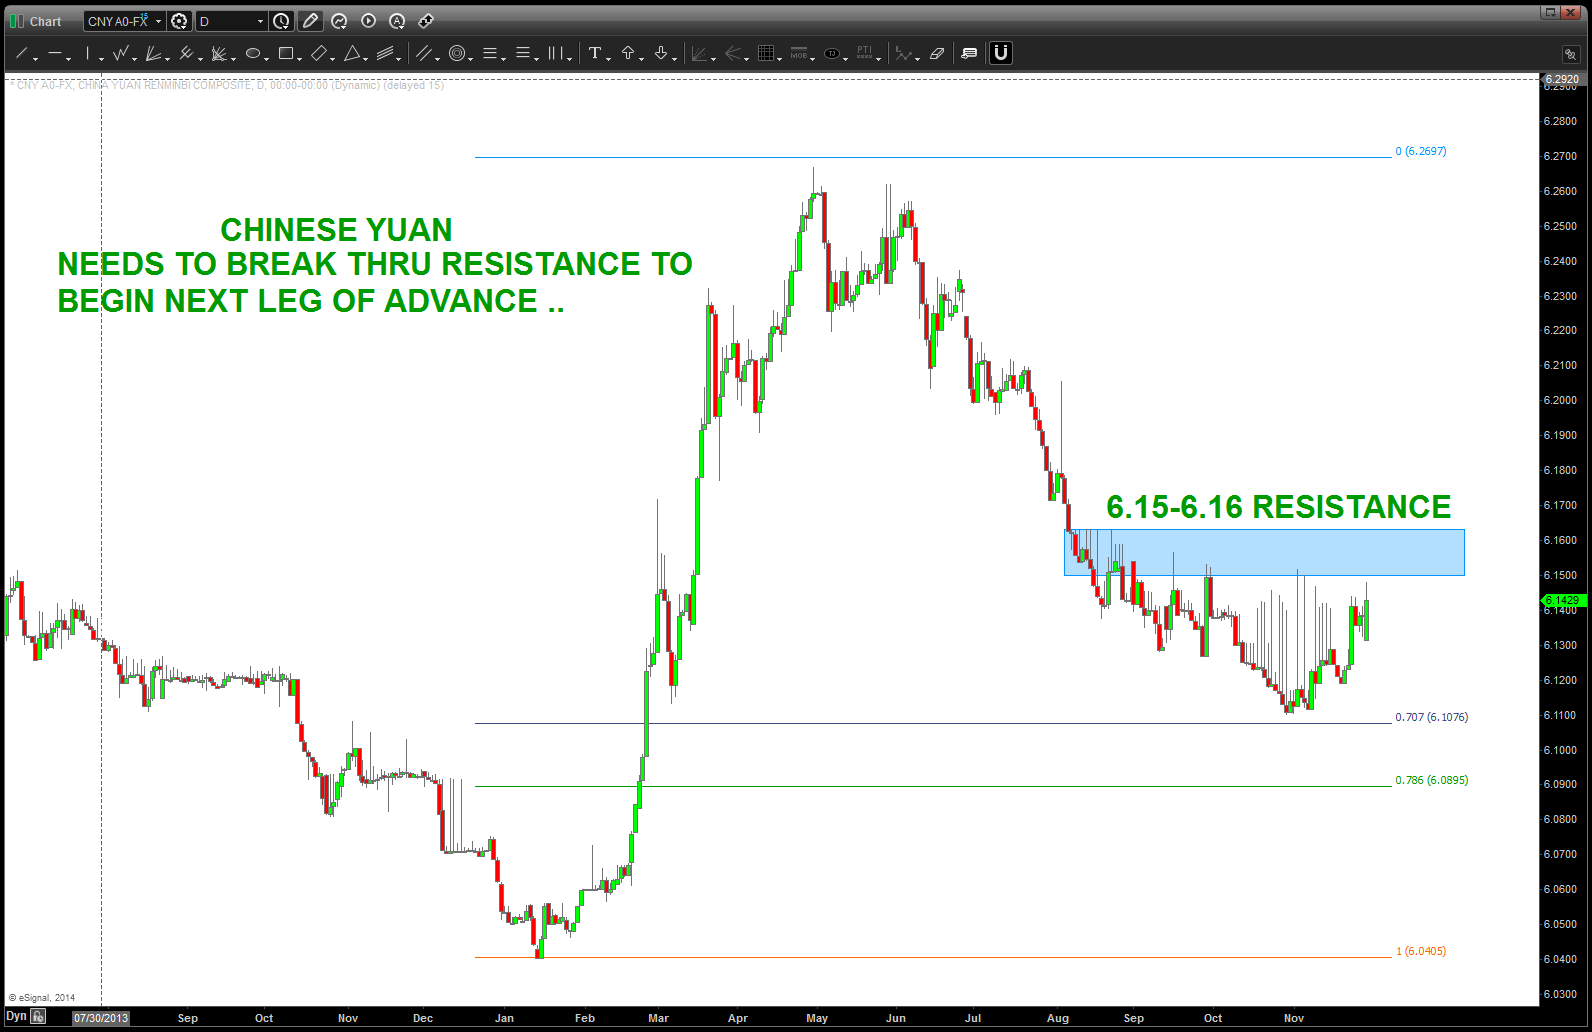
Chinese Yuan Pattern Complete
watch this … closely.
Andy and @seeitmarket
Posted on November 27, 2014 Leave a Comment
Folks, have been sending Andy some pretty amazing work of late. Follow this link: http://www.seeitmarket.com/author/james-bartelloni/
Just sent him over a Agricultural look (DBA, Corn, Wheat, Soybean, Sugar) and how it sure looks like they are going to begin a very strong “corrective” bounce OR start a trend in the bullish direction that could last for a while.
Some pretty significant developments:
- German Dax: remember the long term pattern? Well, that level is going to be tested … WATCH AND SEE if it gets thru.
- Australian All Ordinaries and AUDJPY – pattern hit on AUDJPY PERFECTLY … a key development to watch to see if the JPY strengthens or not …
- CNY (Chinese Currency) – they lowered their rates and … the currency didn’t budge. Something afoot at the circle K.
- Japan – NK225 finishing up a nice 3 drives to a top and a 5 wave pattern … could the YEN be ready to strengthen – completely against the BOJ? Hmmmm
Stand by as it’s definitely getting interesting.
Questions to me and make it a great LONG weekend w/ family and friends. Happy Thanksgiving!
Bart
Butterfly Effect and the markets …
Posted on November 13, 2014 Leave a Comment
you know what, that theory was proven … its’ fact folks, scientific fact. done … no more discussion needed.
so if the physical manifestation of a butterfly can make typhoons happen how powerful are thoughts? thoughts ARE things and EVERYTHING is a VIBRATION so … what IF, just what IF, the PATTERN on the German Dax from the all time low is going to WORK? Somewhere out there for whatever reason the “butterfly flapped it’s wings at the all time low” and set the course for the creation of this wave that has developed. The wave that has developed is a PATTERN and that SELL PATTERN or SELL wave is either going to work or “not develop as forecasted” (willi willi from my flying days)
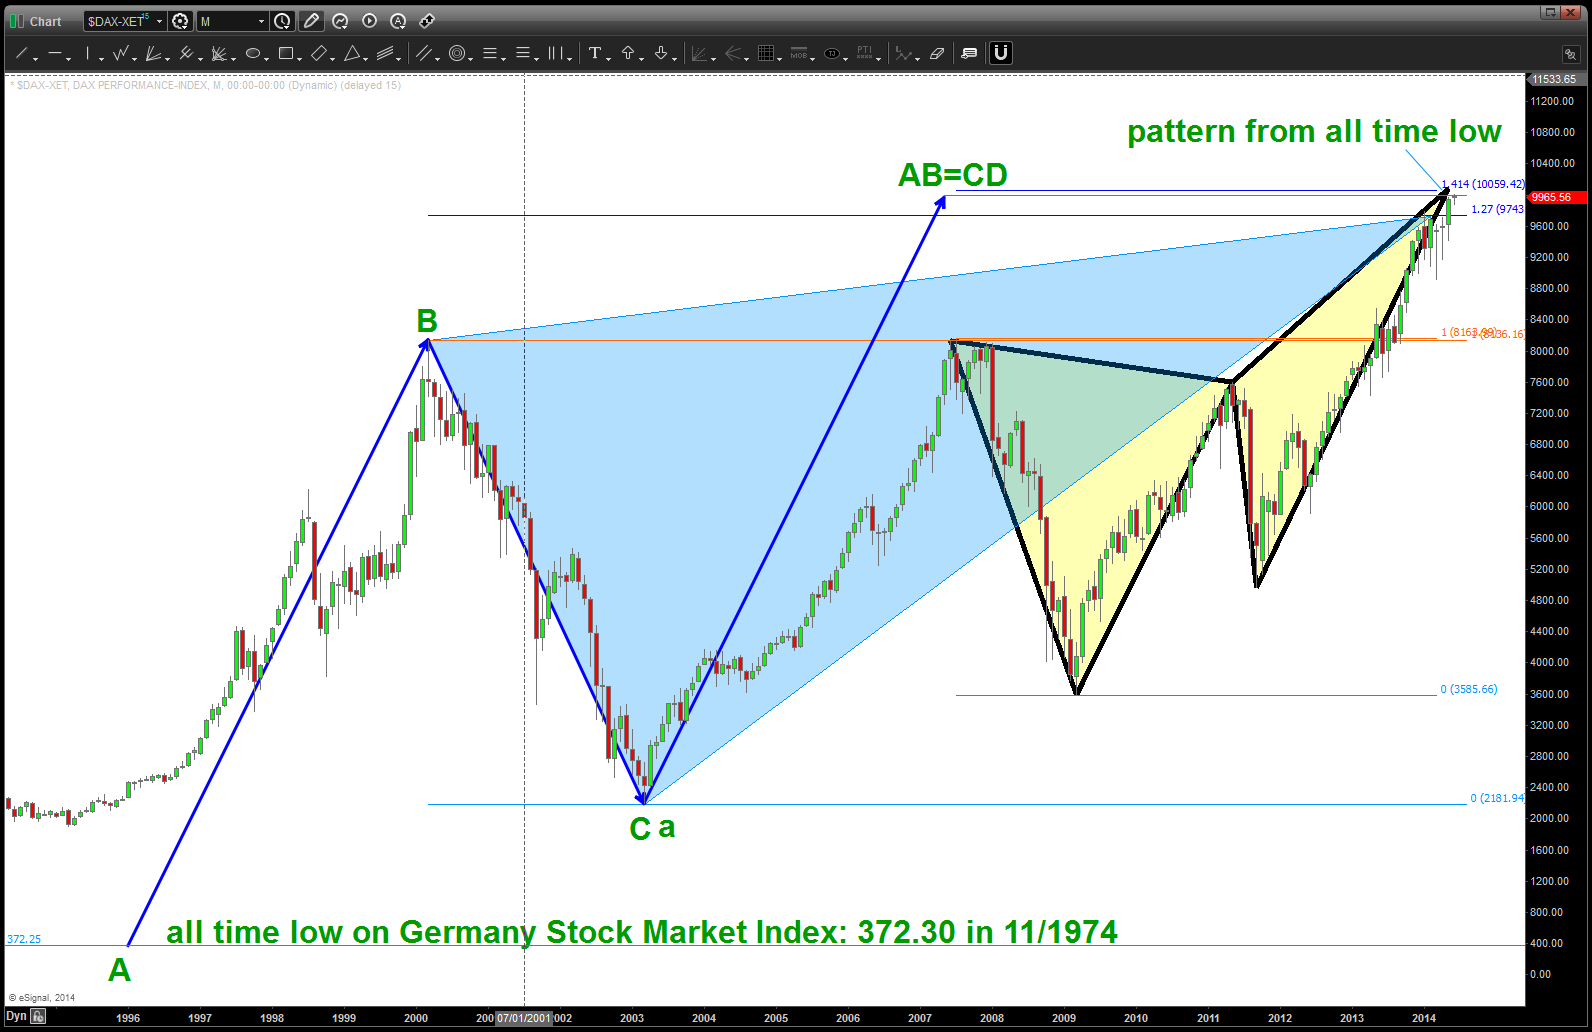
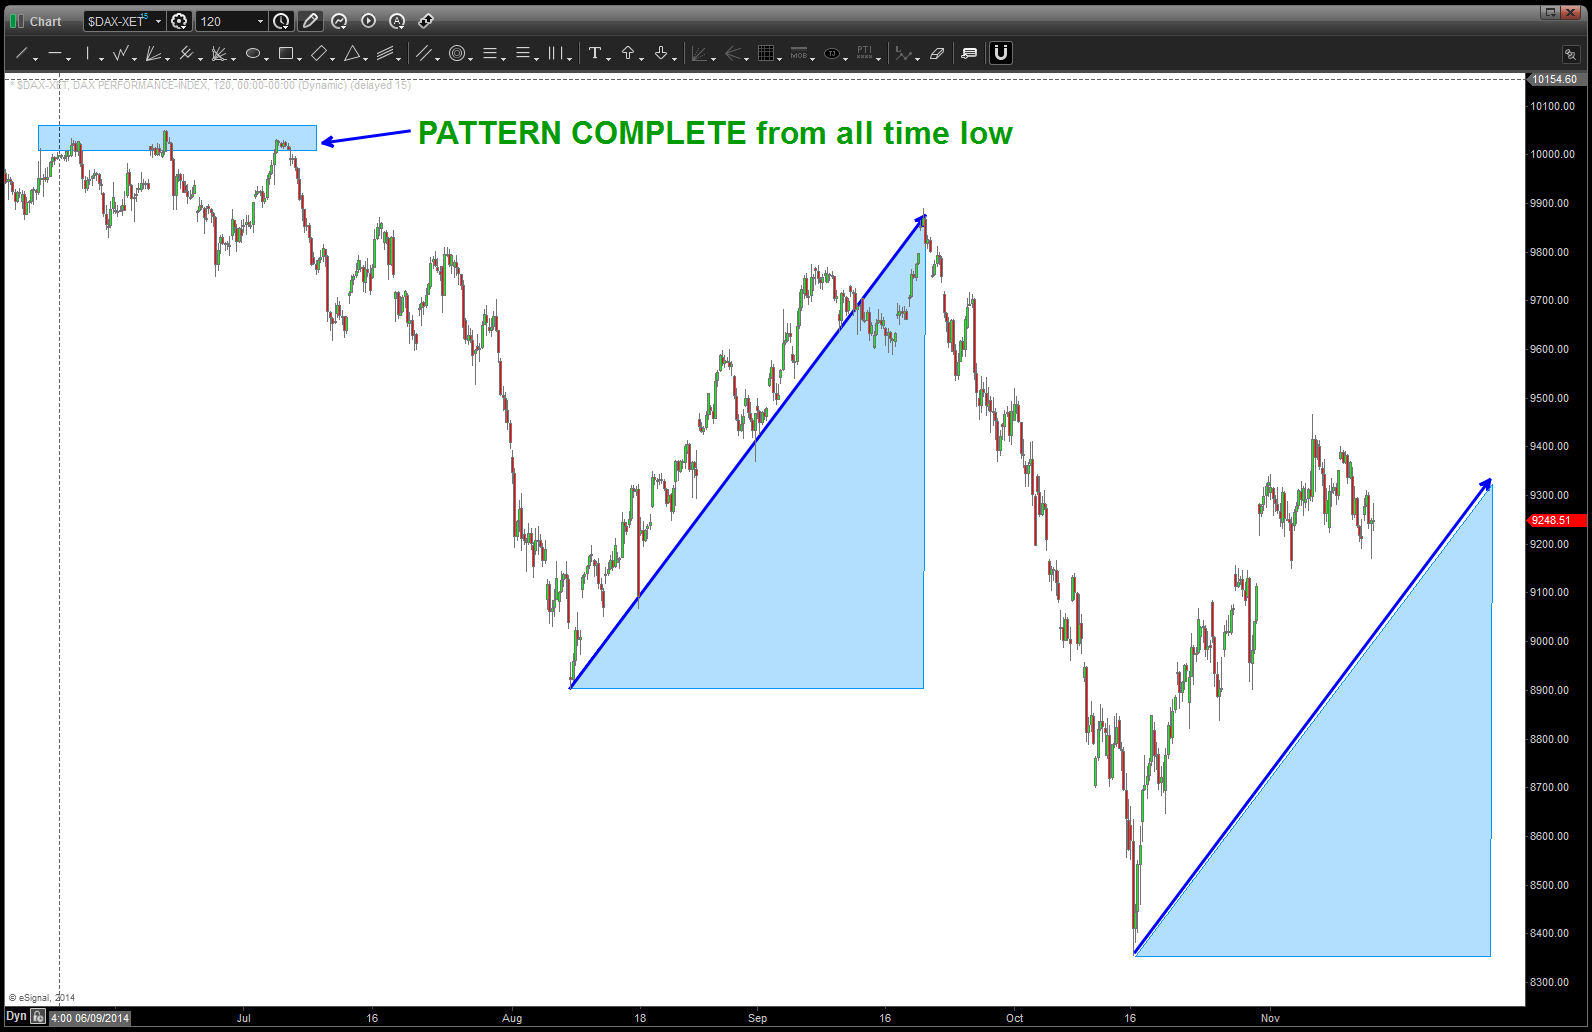
see the POINT A .. that is where the butterfly flapped it’s wings …energy, vibration, waves, etc. The PATTERN is complete
so, I think (I really don’t know fundamentals or any of that crap) that Germany is important to the Eurozone. I KNOW they have completed a MAJOR sell pattern and basically, they have rallied up like the last time. So, is it time for it to start back down? We’ll see .. perhaps the butterfly flapped it’s wings a lot harder and things explodes to the upside — I do know it’s very important.
rock on, ok?
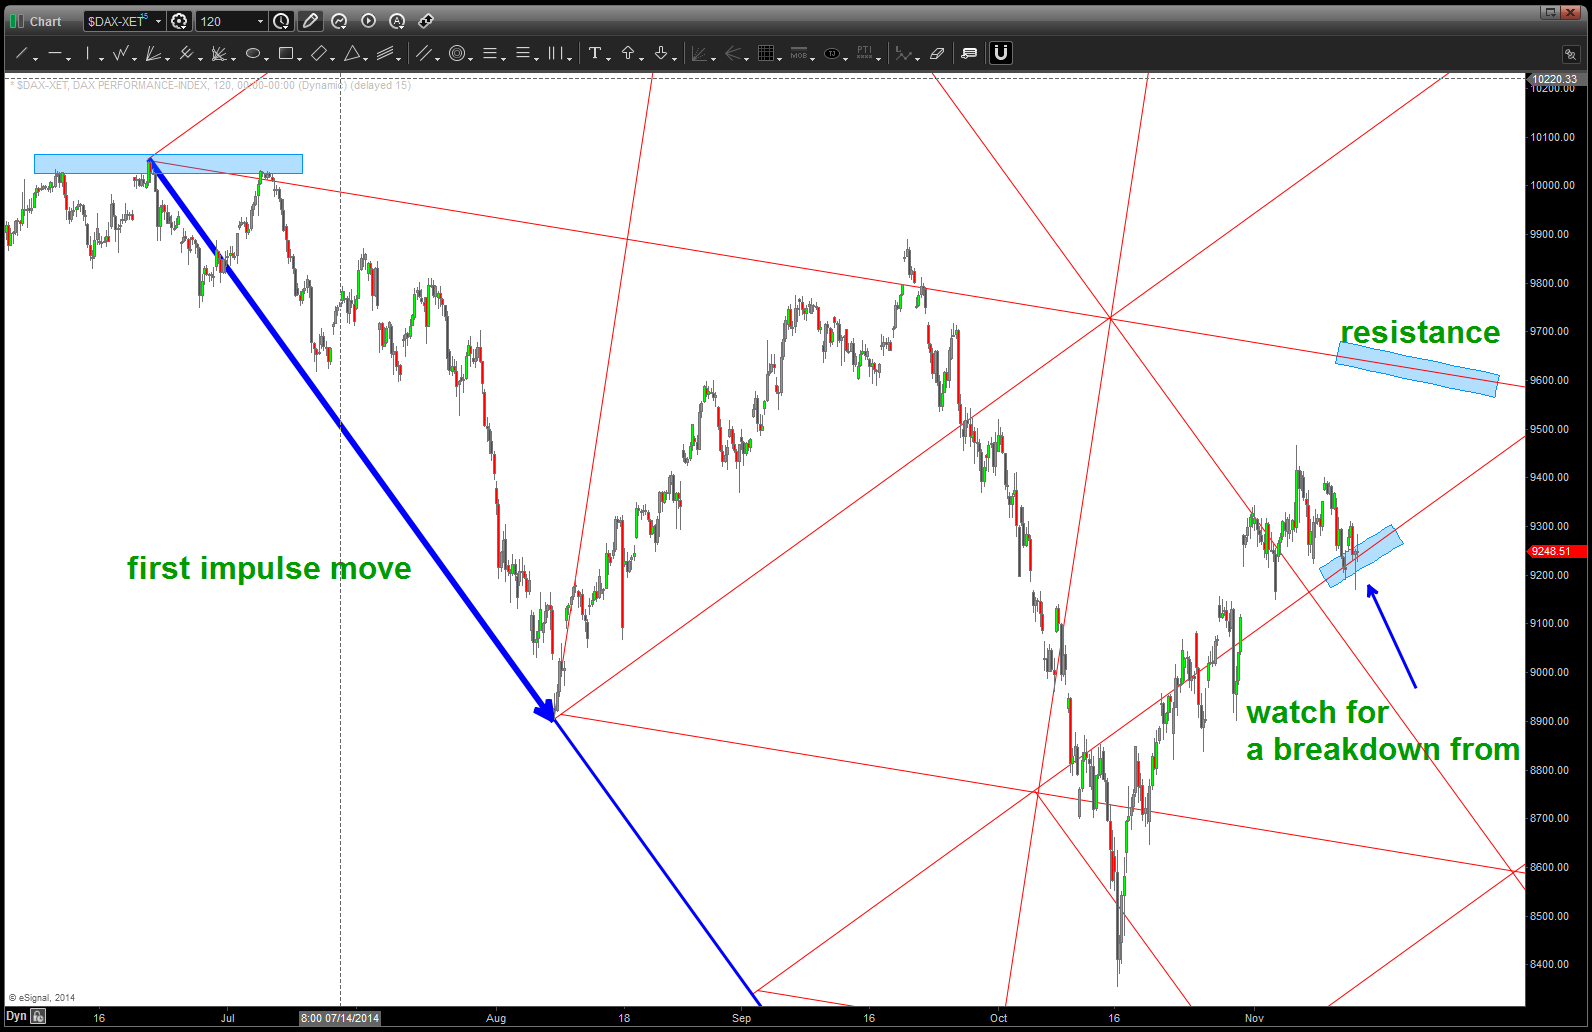
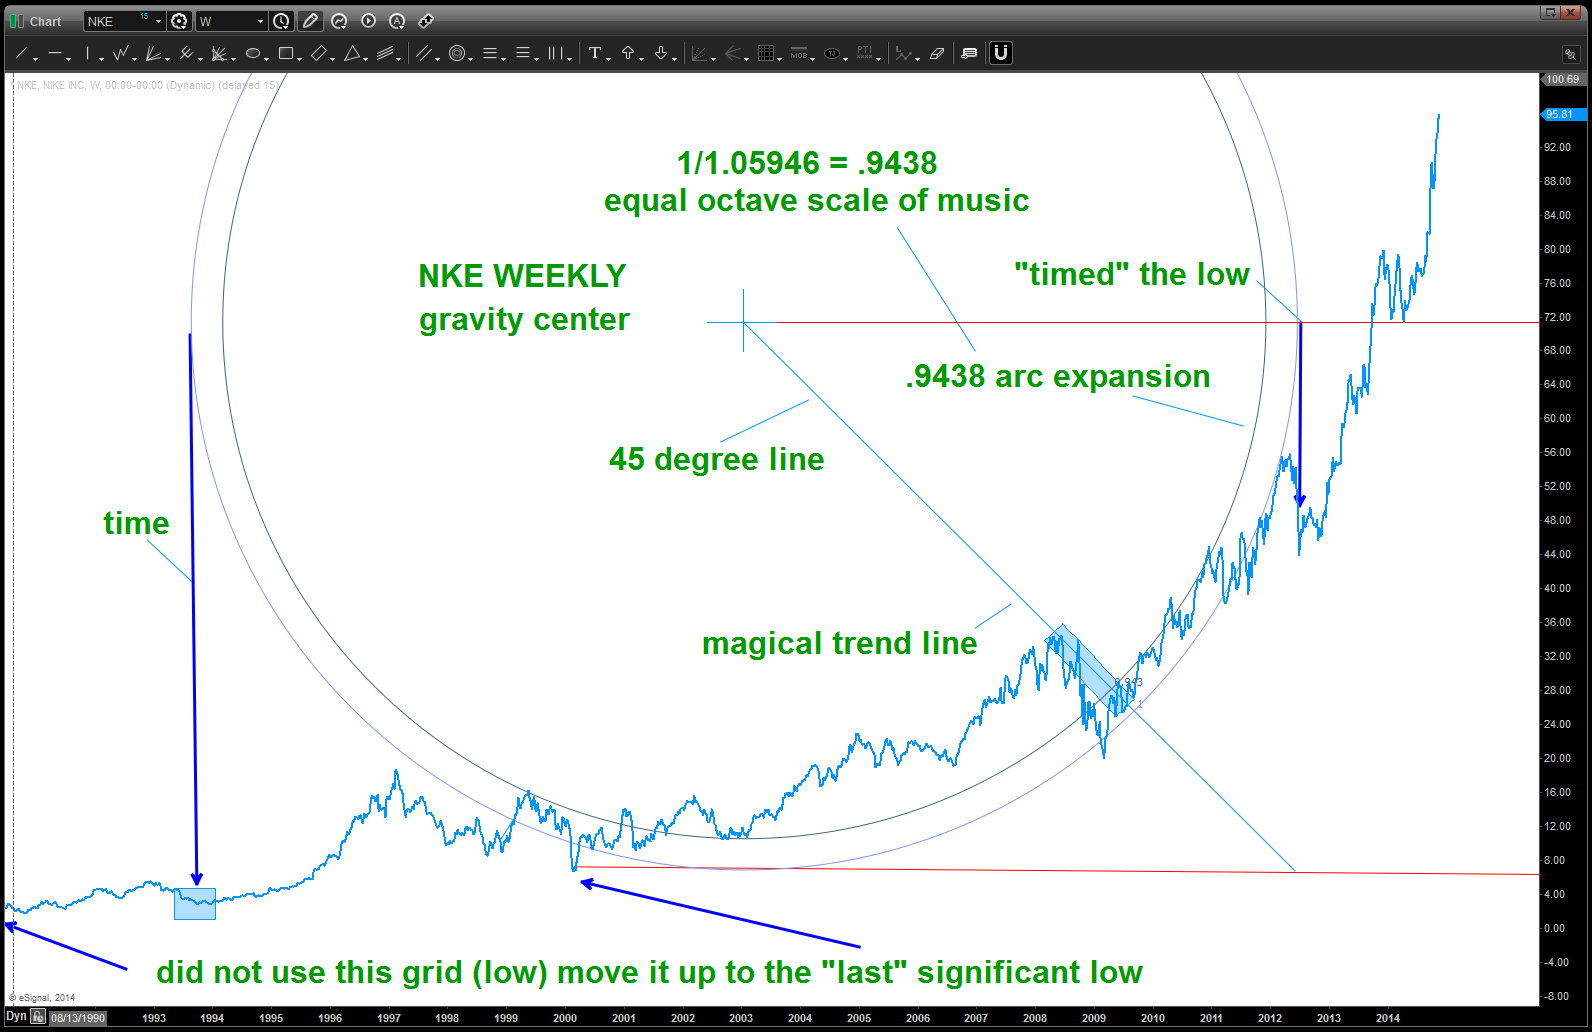
so, what’s the geometry telling us? well I like to use the first impulse move down (bold blue arrow) to draw the simple squares. You can see where teh key trend line REALLY is so watch closely the two areas labeled.
Nike and the Perpendicular Bisector .. yes, I just typed that!
Posted on November 12, 2014 2 Comments
I’ve shown this technique, successfully, on the parabolic run in IBB, AAPL and others. I’m not going to repeat it here – search on this website for IBB or AAPL and Sir Isaac Newton and the APPLE falling from the tree. But what I’m going to do is go chart by chart to TRY and figure out when the Tv=0 (Terminal Velocity) and it falls like a rock, literally. These types of charts scare me …
- I have NEVER seen a parabolic rise that doesn’t swiftly lose 20,30,40,50 % of it’s value .. never.
- I have NEVER done this exercise on Nike (NKE) Fact is I like Nike, just bought a pair of running shoes the other day and they employ my daughter at the local outlet mall. But, shoving that all aside – it’s parabolic and that’s just not good.
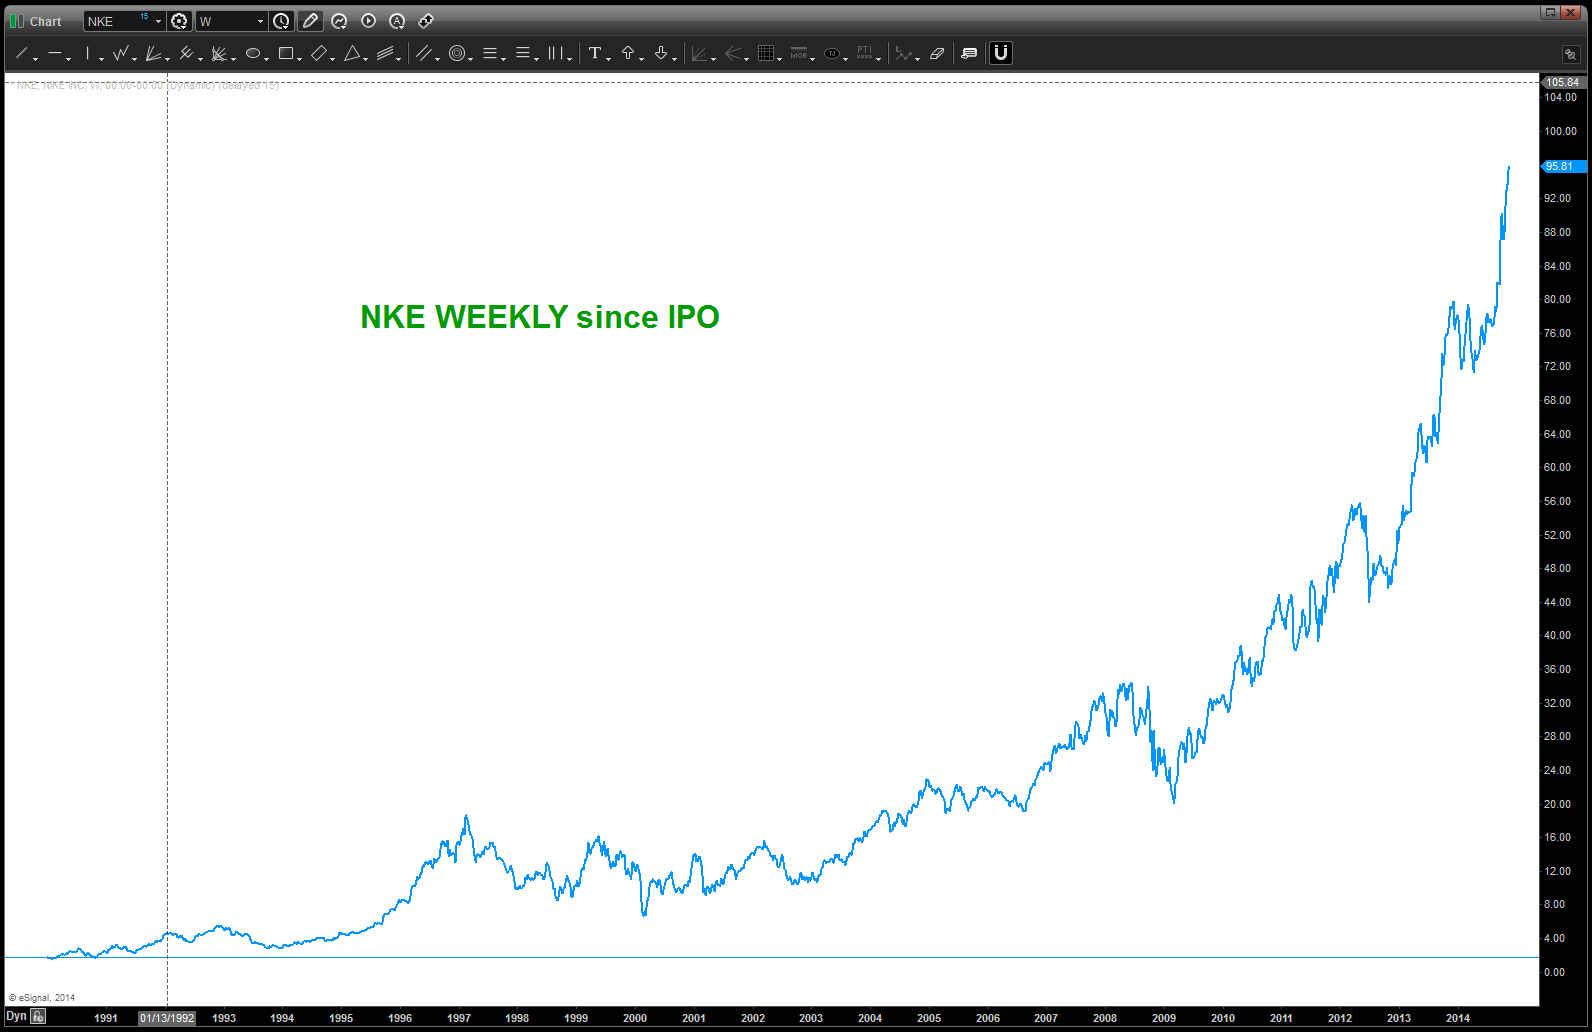
1. Chart of NKE
- note, used the “line chart” so I could fit the history of the stock into the screen and scaled it down considerably. using a line chart helps you.
2. Pick 3 points, that make sense to the eye, and calculate a circle from those 3 points like the dude did in the video link below
- Use this link from geometry we learned in elementary school: http://www.youtube.com/watch?v=GUgMOzwCBEE
- Or “GOOGLE” – “how to make a circle from three points …
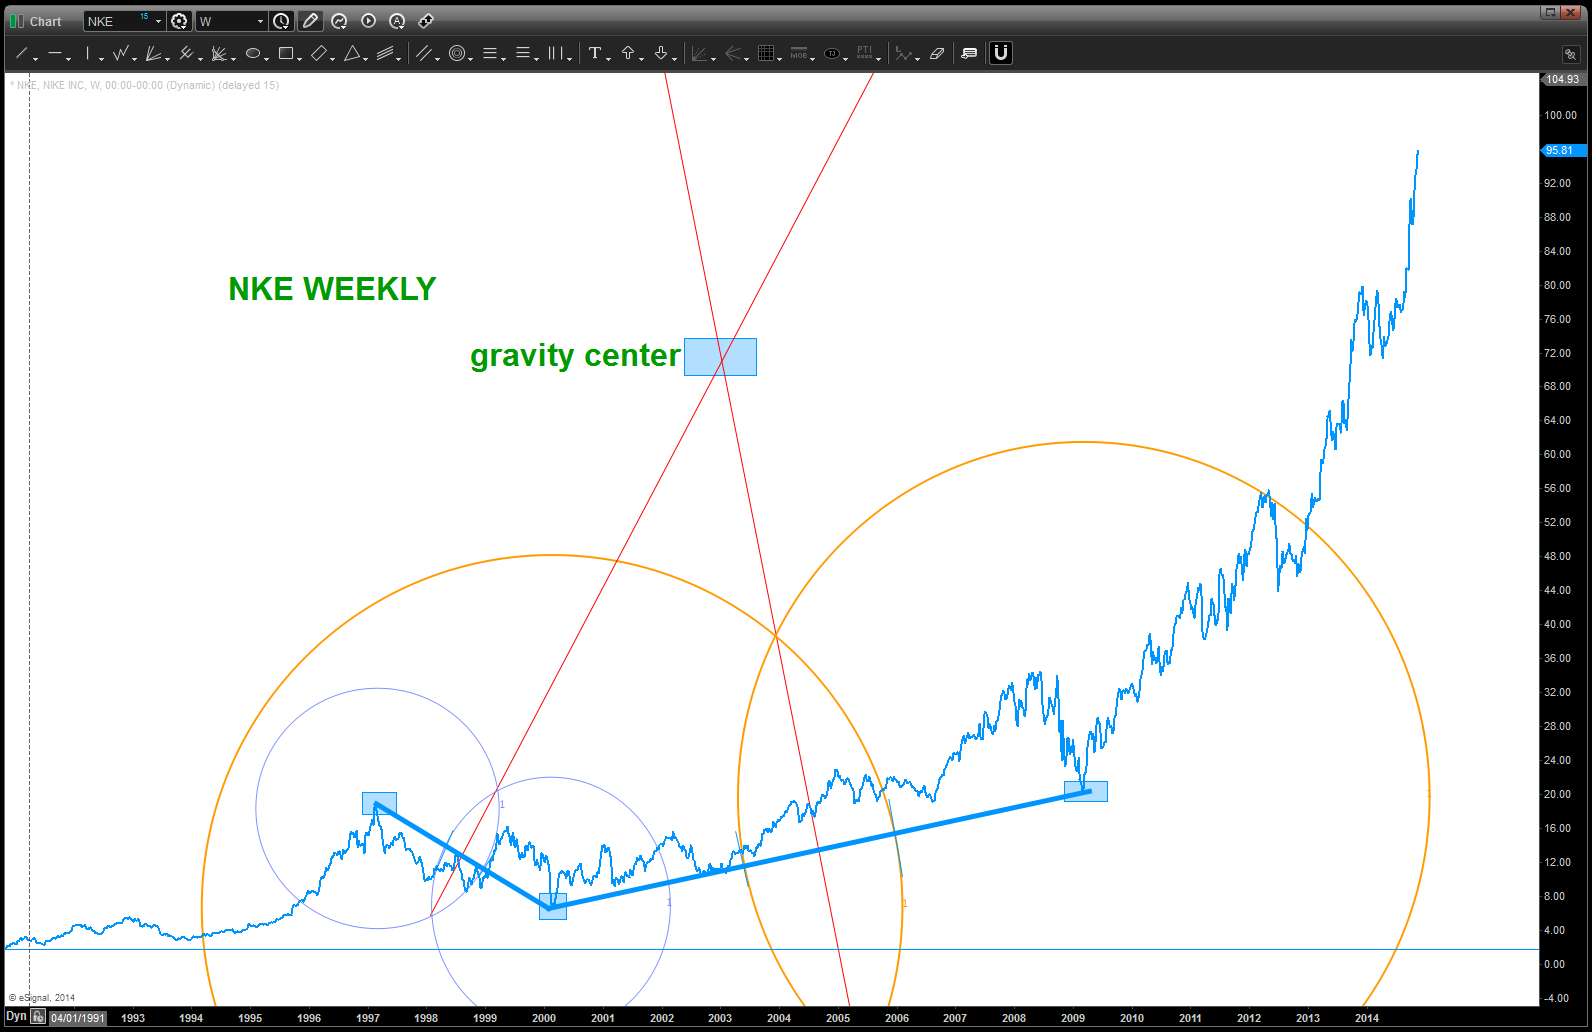
3. Here’s the picture w/ the gravity center and the arc shown. I don’t like it, you’ll see why. So have we done something wrong? No, just not using the right grid. Do you see how the all time lows did their own “mini” parabolic run back in 1997? So, decided to shift up the low horizontal grid line to the “next” low and … look two charts lower. Please pay attention to the annotations on the chart.
Note, by using the all time low to extract the radius from the gravity center it was not a good fit to the eye or thru geometry. Scratch this one …
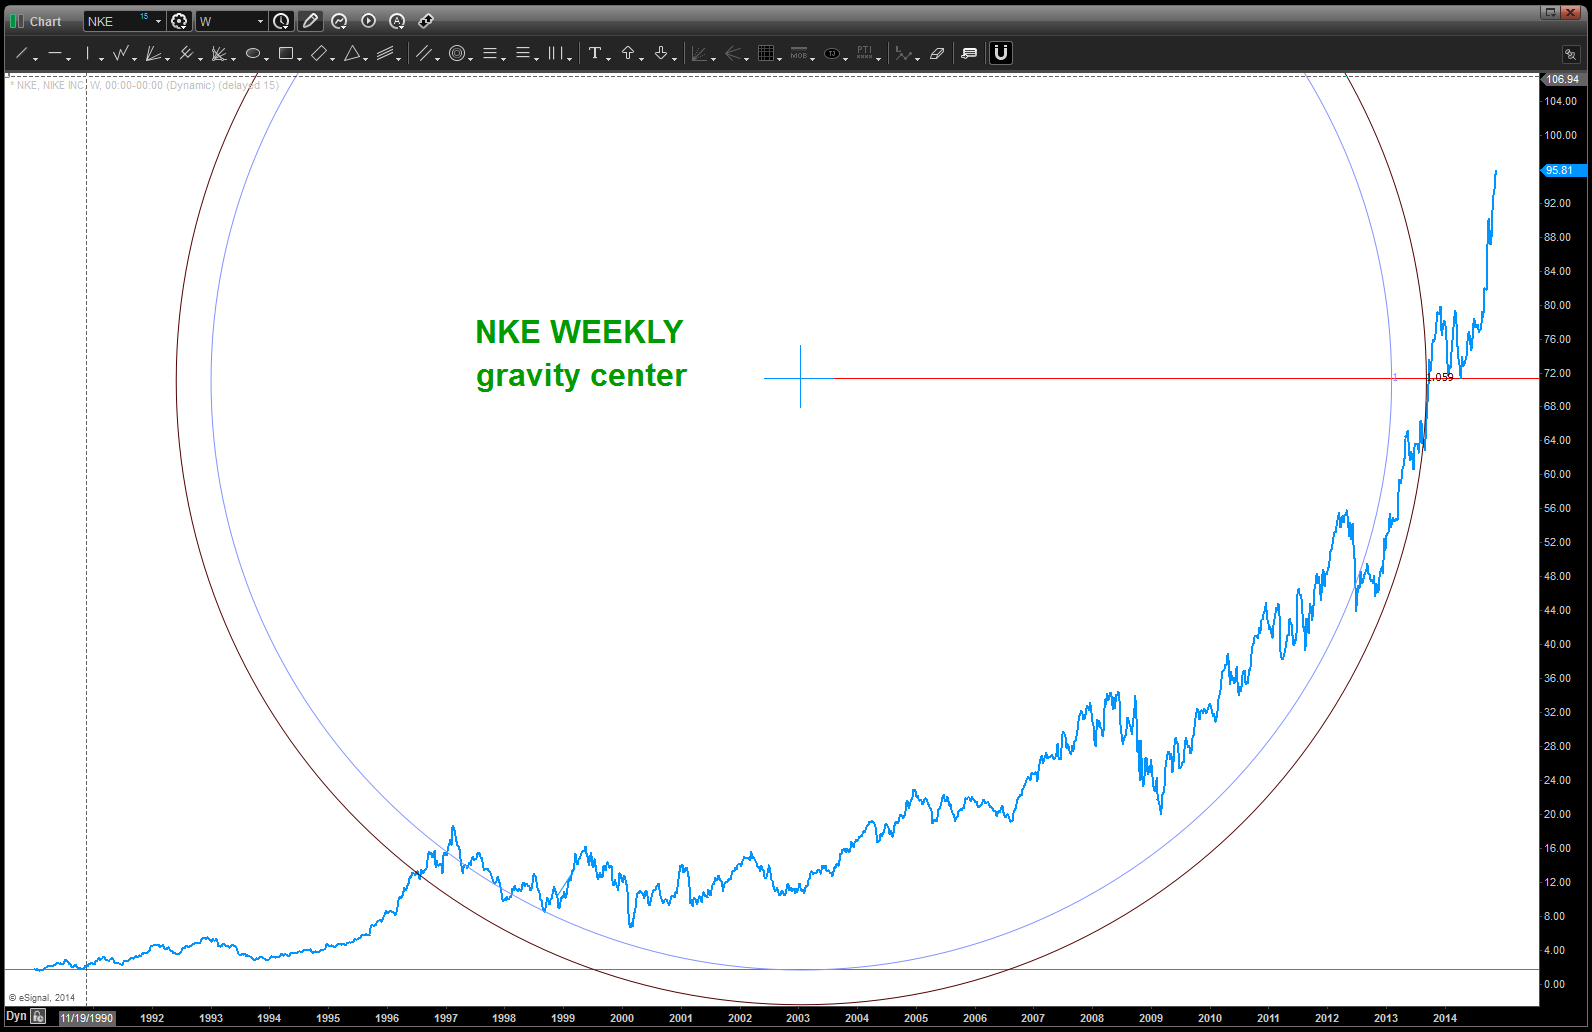
this grid workds
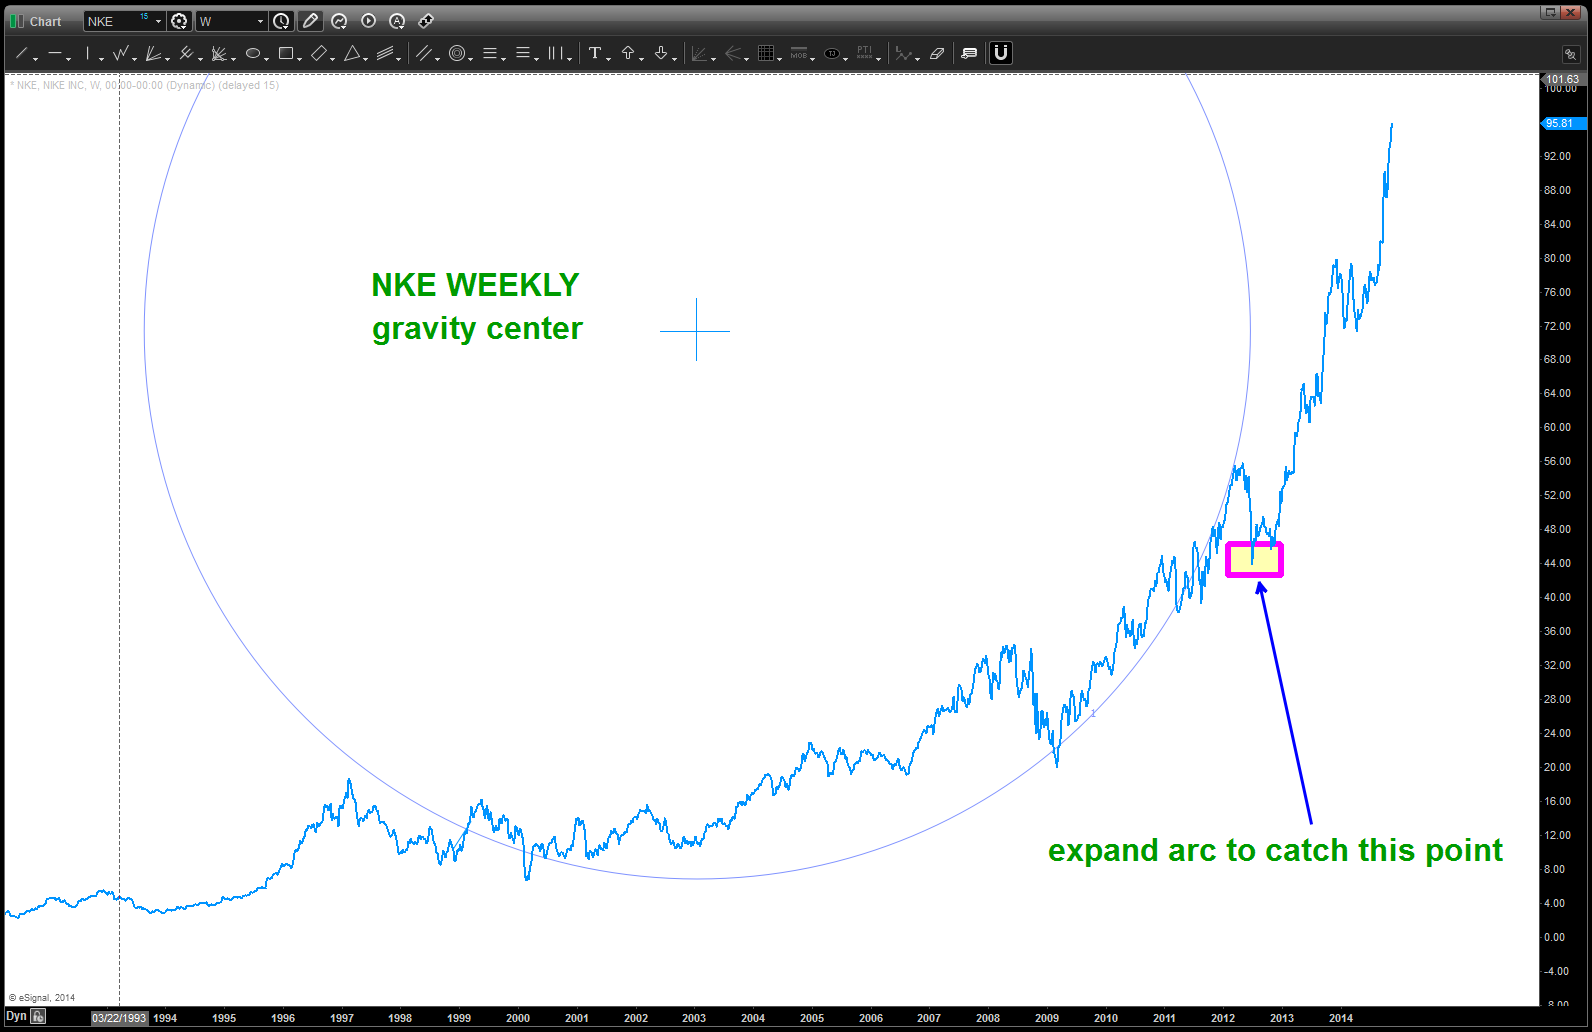
4. Now, we need to catch the highlighted area w/ an expansion of our 1.0 arc. This expansion is not arbitrary .. it will be derived from sacred geometry ratios, equal octave scale of music and Fibonacci. When we catch this point we then look at the parabolic extreme point at 3 o’clock on the arc.
what you’ll see is I used the musical ratios: 1.12248/1.1892/1.2592.
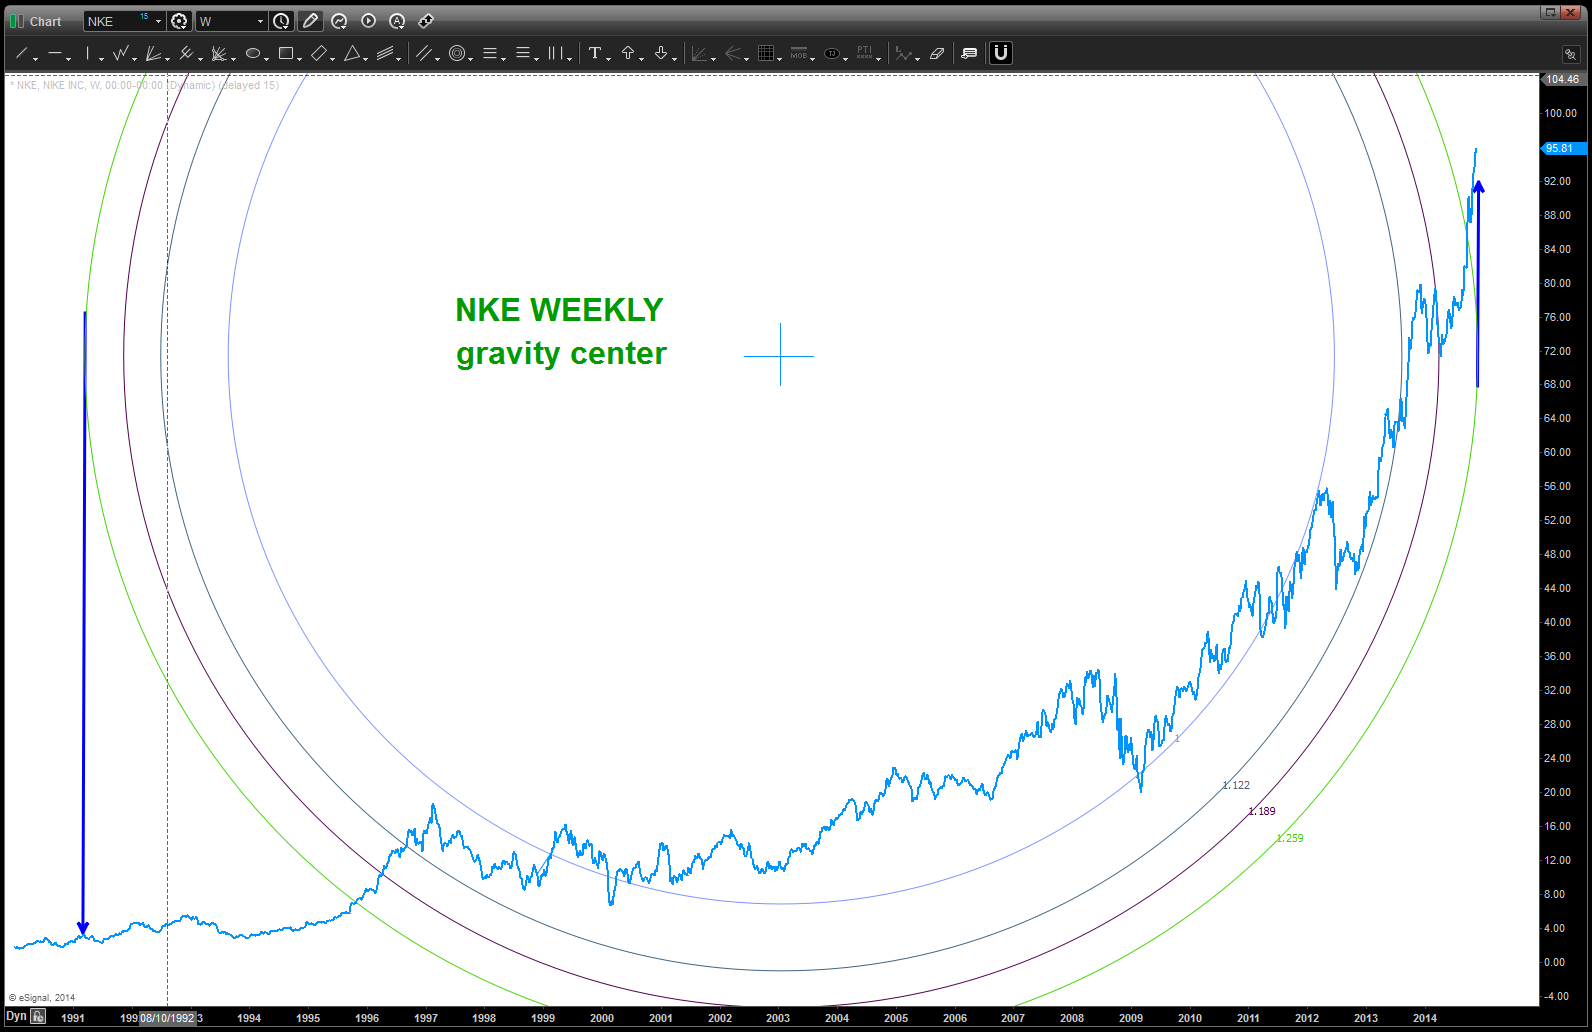
the green ratio could be it … so what else can we try?
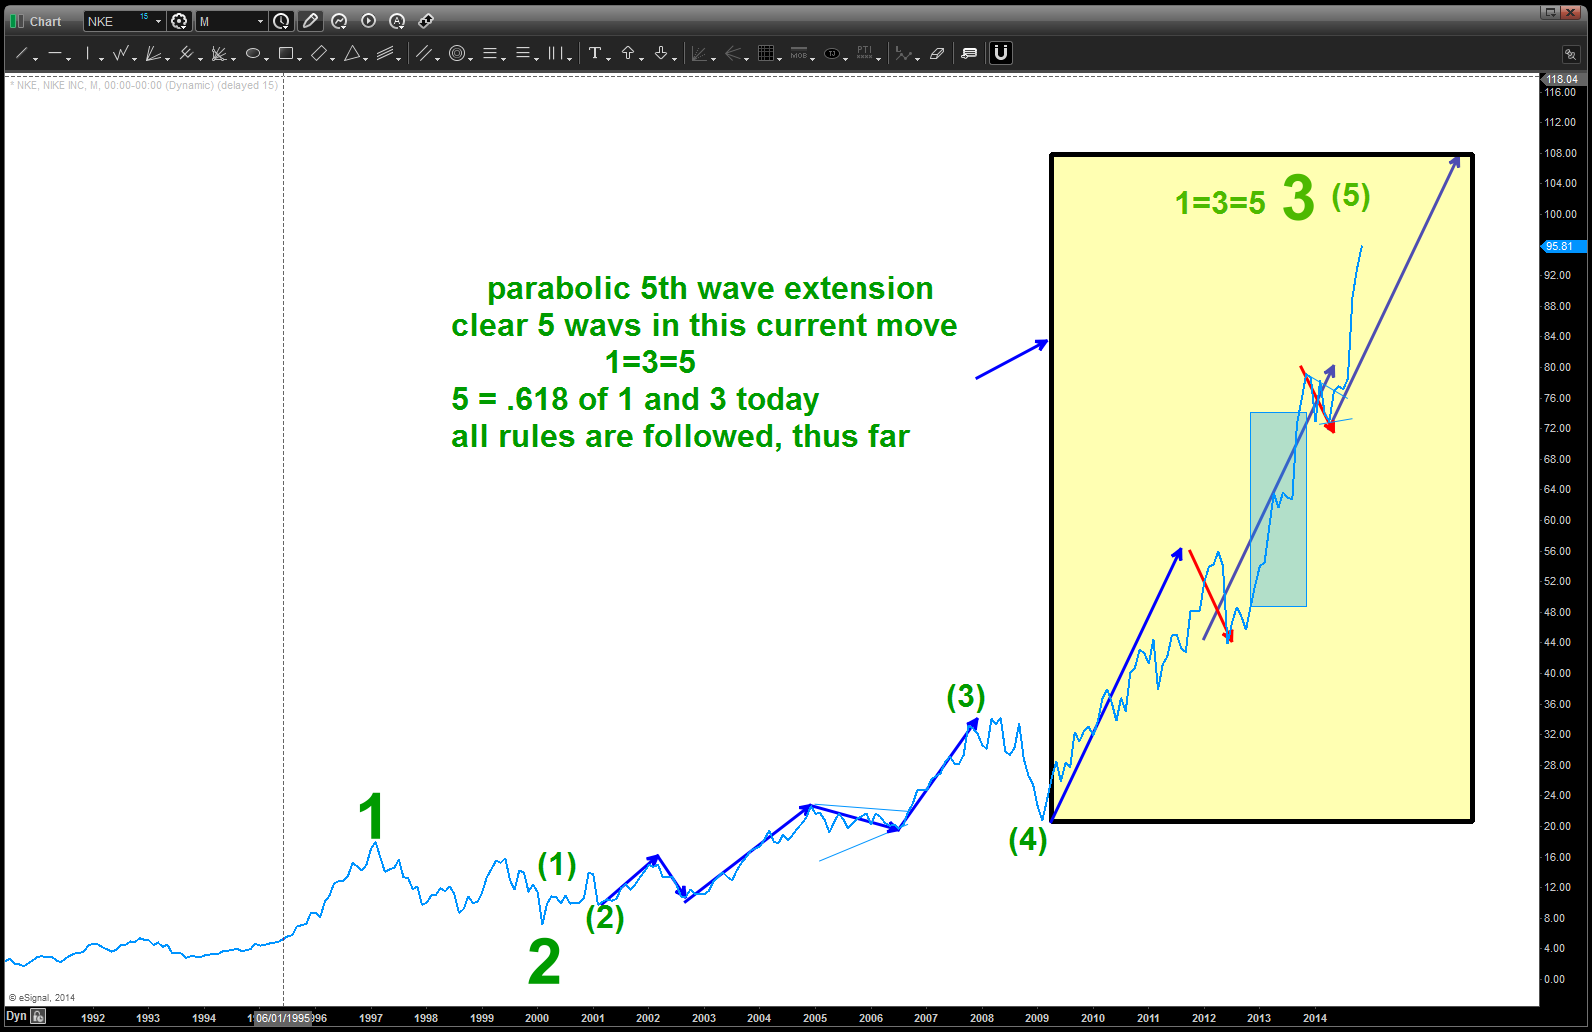
5. Elliott Wave perhaps but in log scale …because that allows us to see long term waves better, that’s and, also, take it out a scale (monthly) to remove most if not all of the noise.
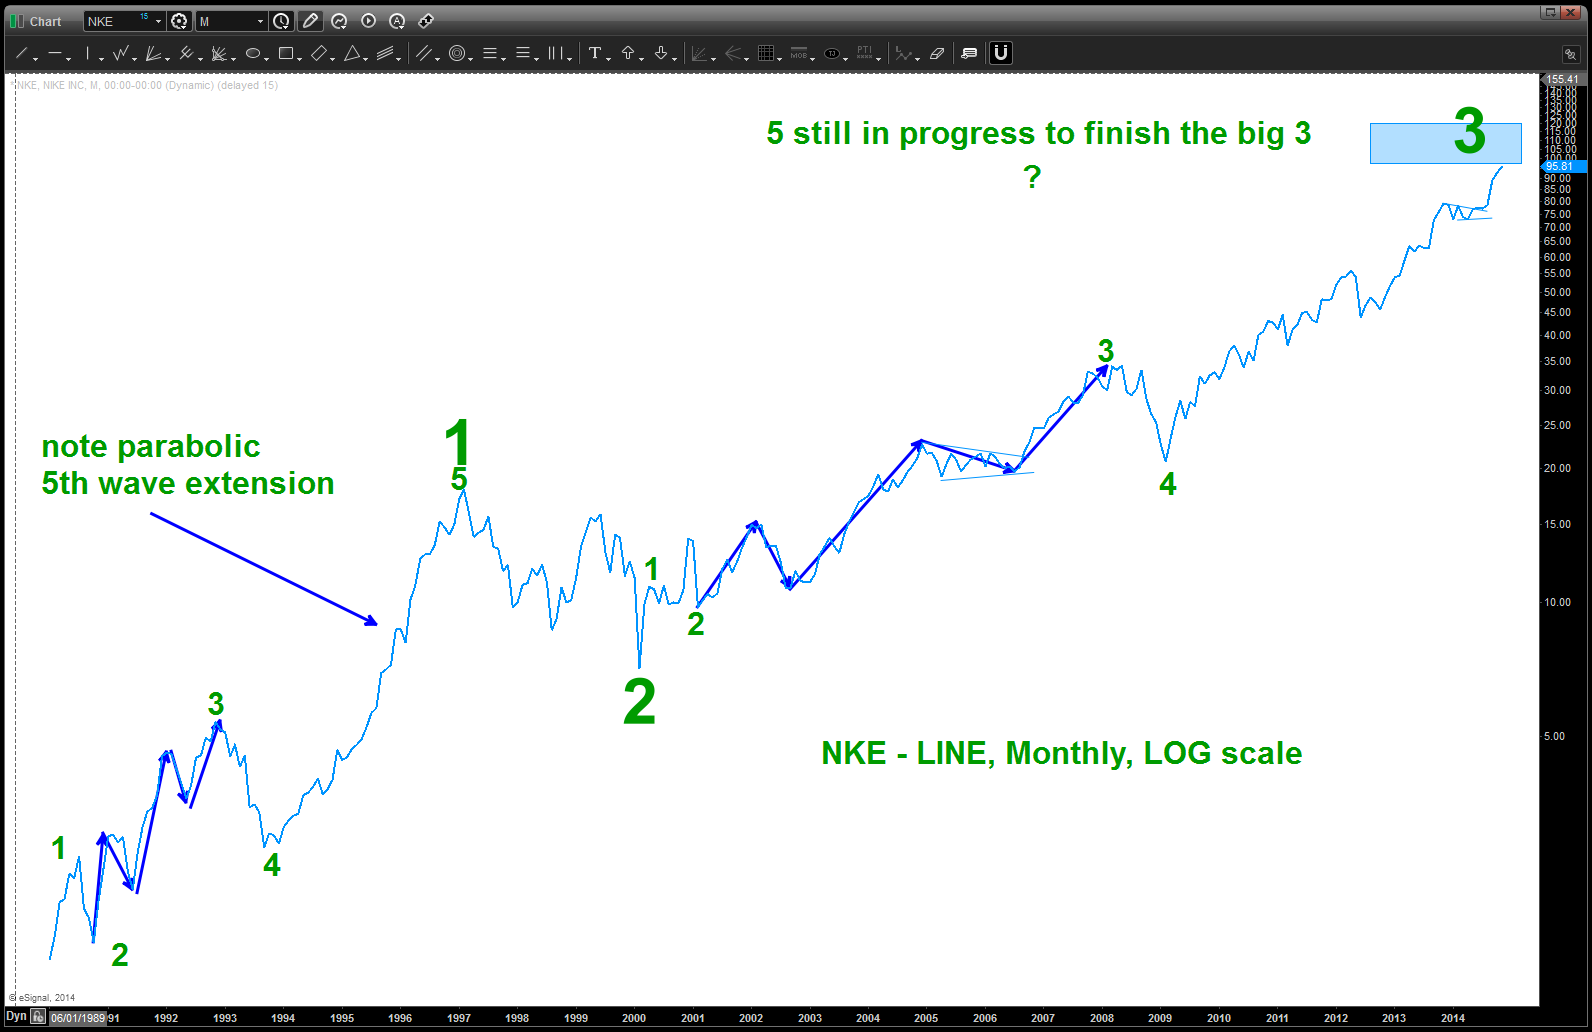
so looks like a nice 3 is in progress perhaps … I’m having a tough time counting the squiggles on this last wave and if that happens I simply WAIT for a form/proportion to show up. Remember, it’s PARABOLIC right now so it is hard to count …but in the context of being on the right side of the market … would definitely look to take profits at the first sign of a weekly signal reversal candle. so, if it’s hard to count then, perhaps go back to the normal scale?
6. How about bearish divergence on ALL of the DAILY, WEEKLY, MONTHLY? (remember his is real time so I’m not sure if it is present or not)
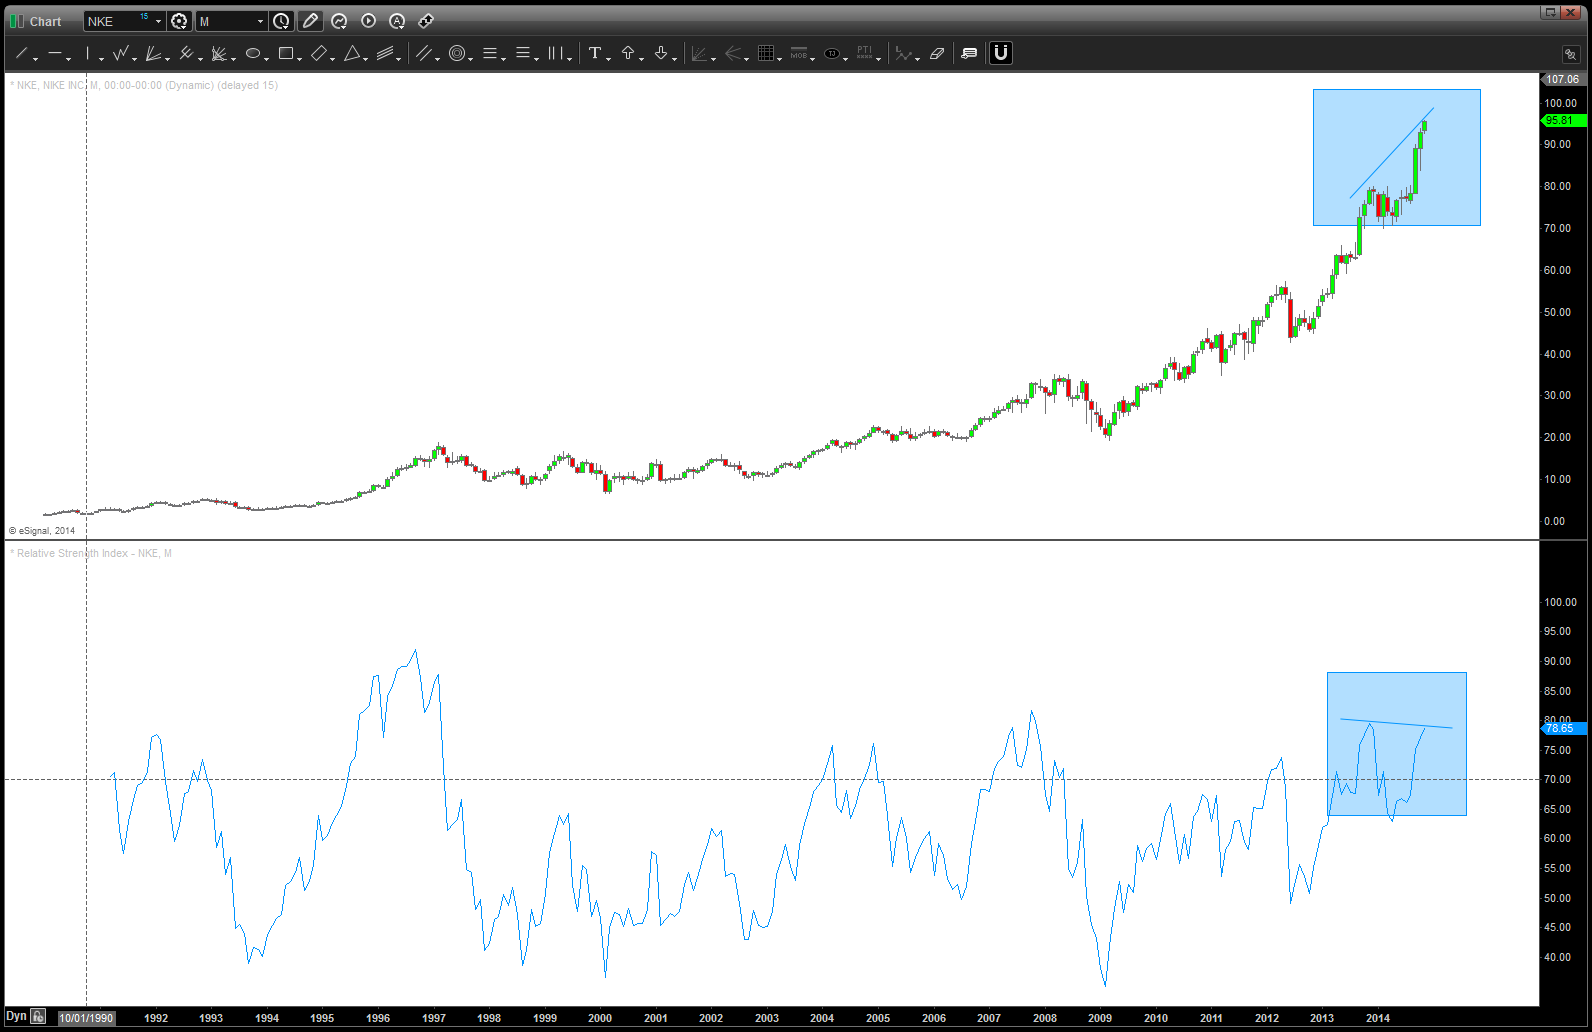
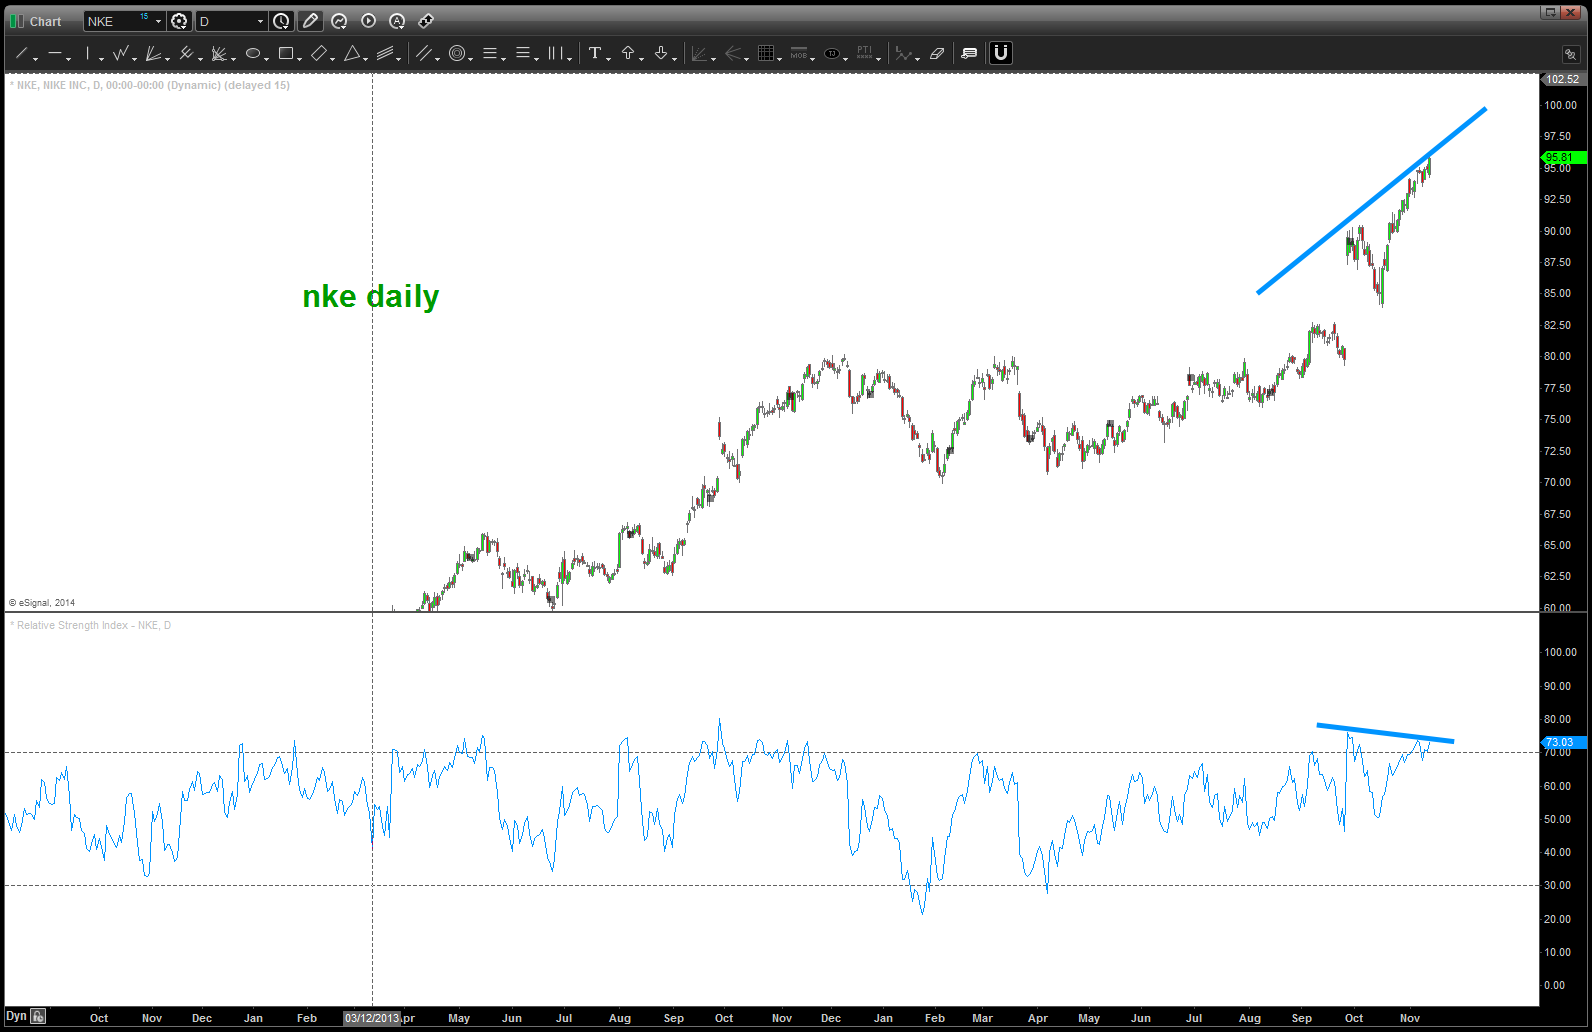
It’s kind of present but not screaming at me ….
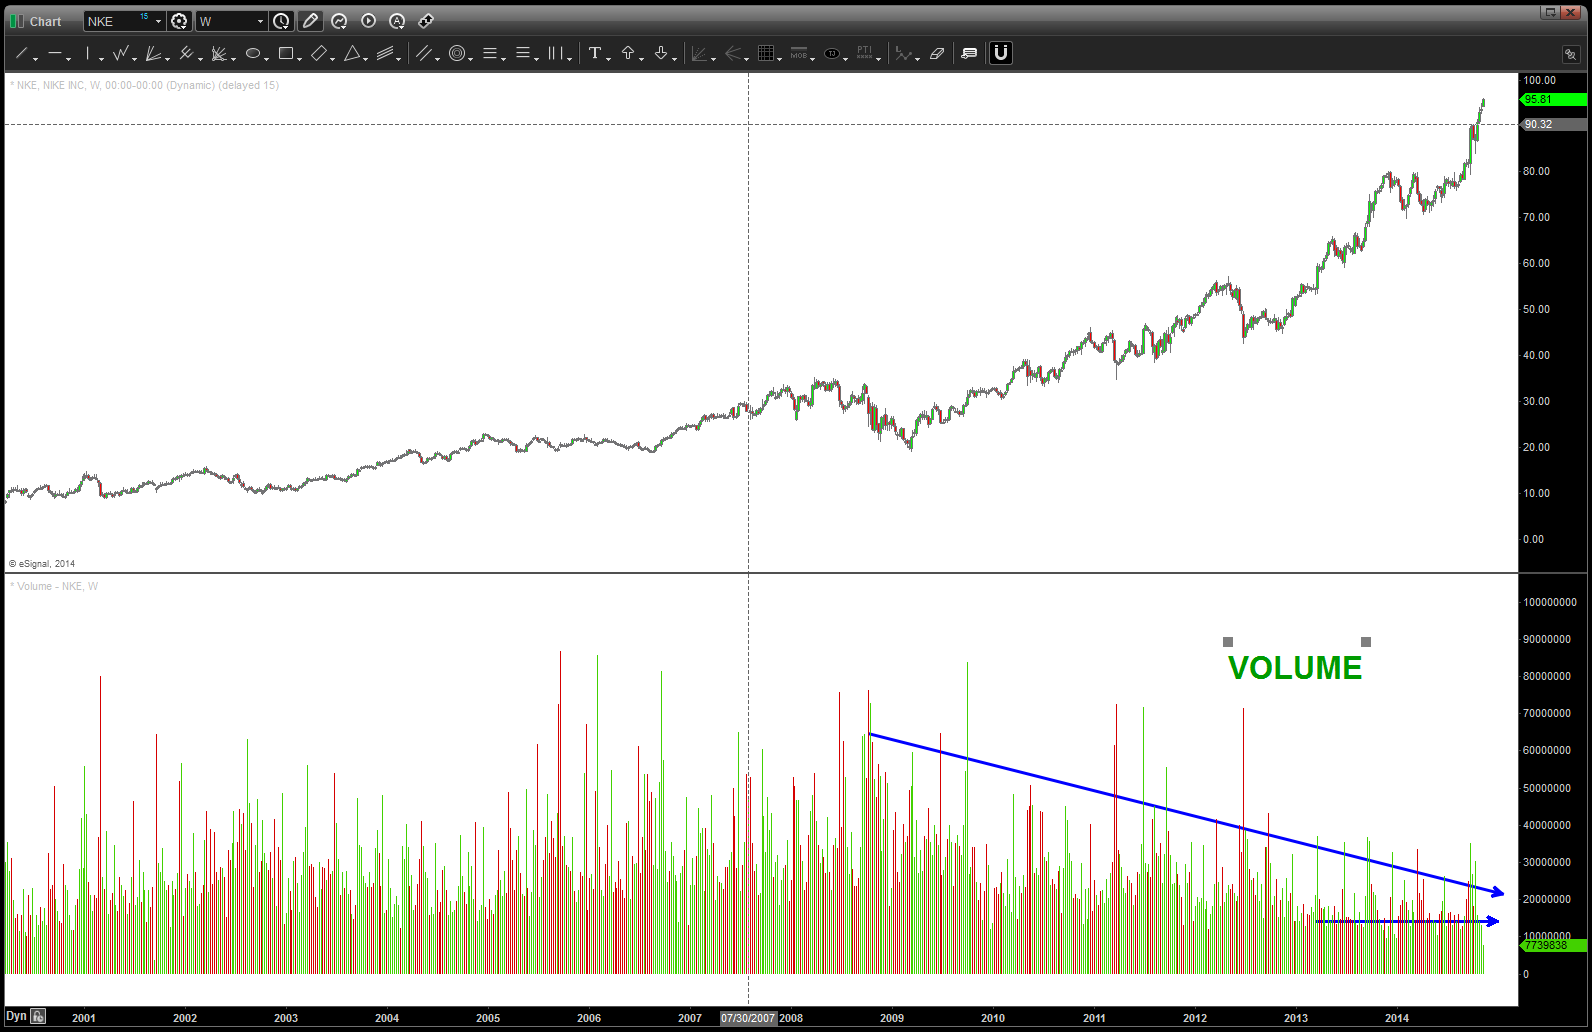
7. take a look at volume – it’s holding in there but note the steep drop off the last 4-6 weeks. hmmmmm
8. one last … threw a 50 day simple moving average on their to look for “reversion to the mean” – basically are we at an extreme from the median of the 50 day? YES ….
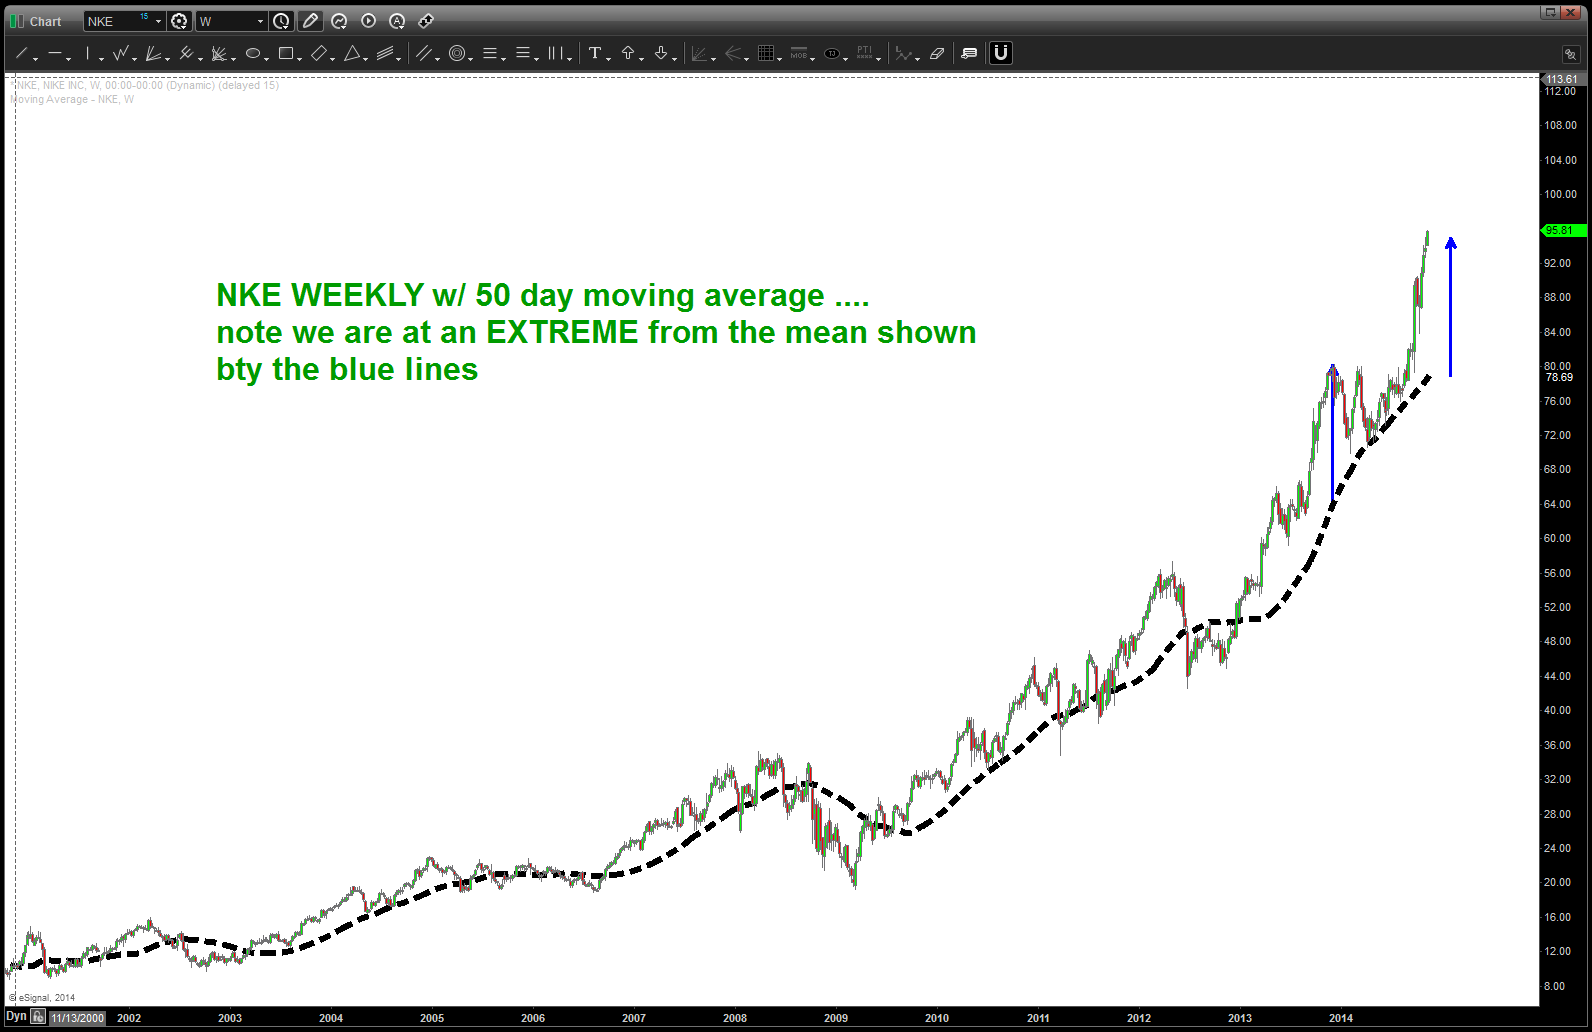
so, in conclusion, we are parabolic and another 10% move up – really quickly – is not out of the question. Believe the first hint of a SIGNAL REVERSAL CANDLE (weekly) would be time to take profits and, remember this is 3 of 5 (if my count is correct) so I will be looking to BUY NKE after the inevitable pull back in any parabolic.
questions to me.
Bart
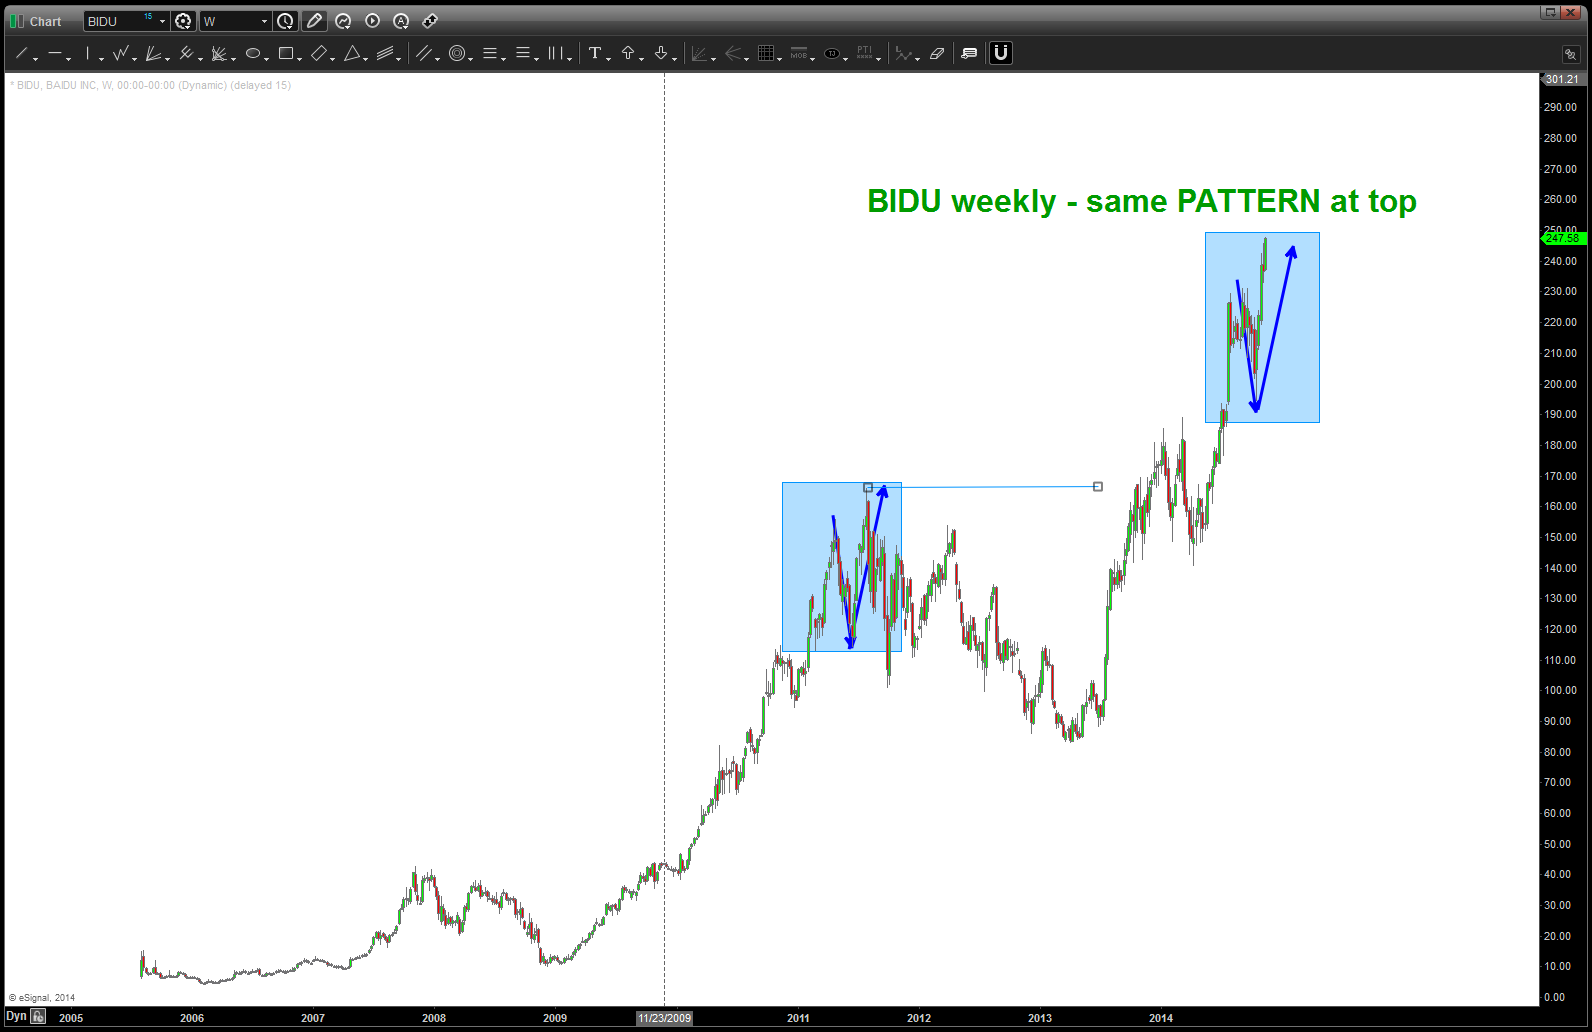
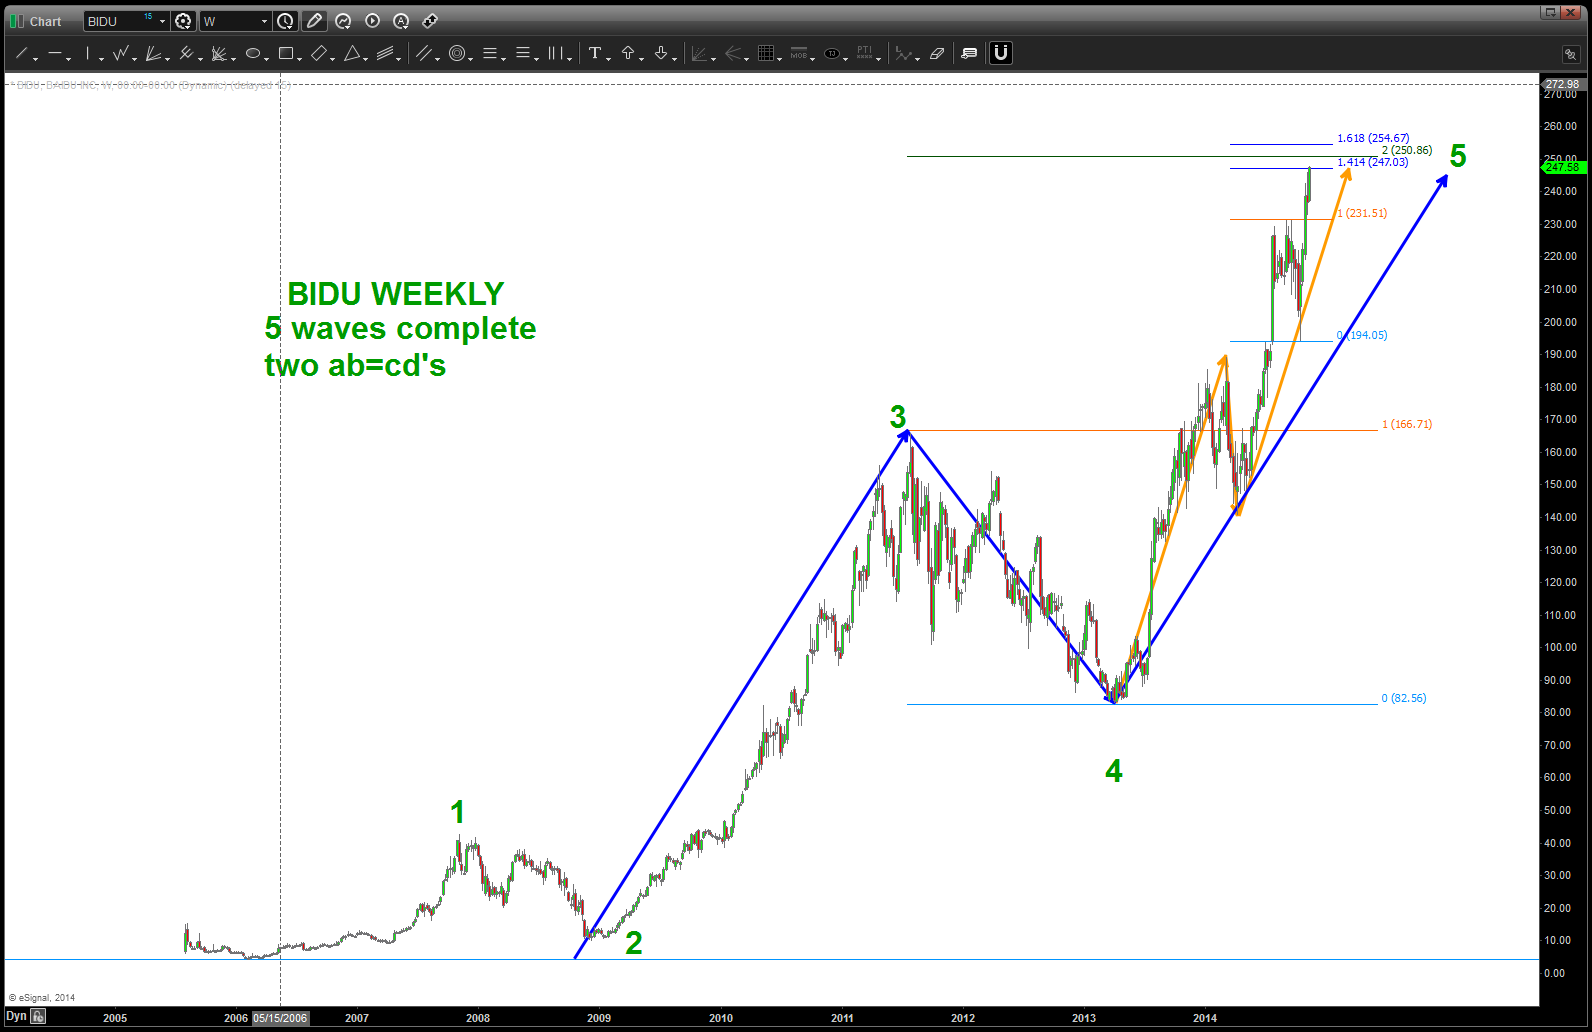
BIDU follow up
Posted on November 11, 2014 Leave a Comment
11/11/2014
was too early on this count, as you can see below. Now, we are approaching some very stiff resistance as shown. another target is 295. all that being said, still believe we are in the 5th wave advance here ….
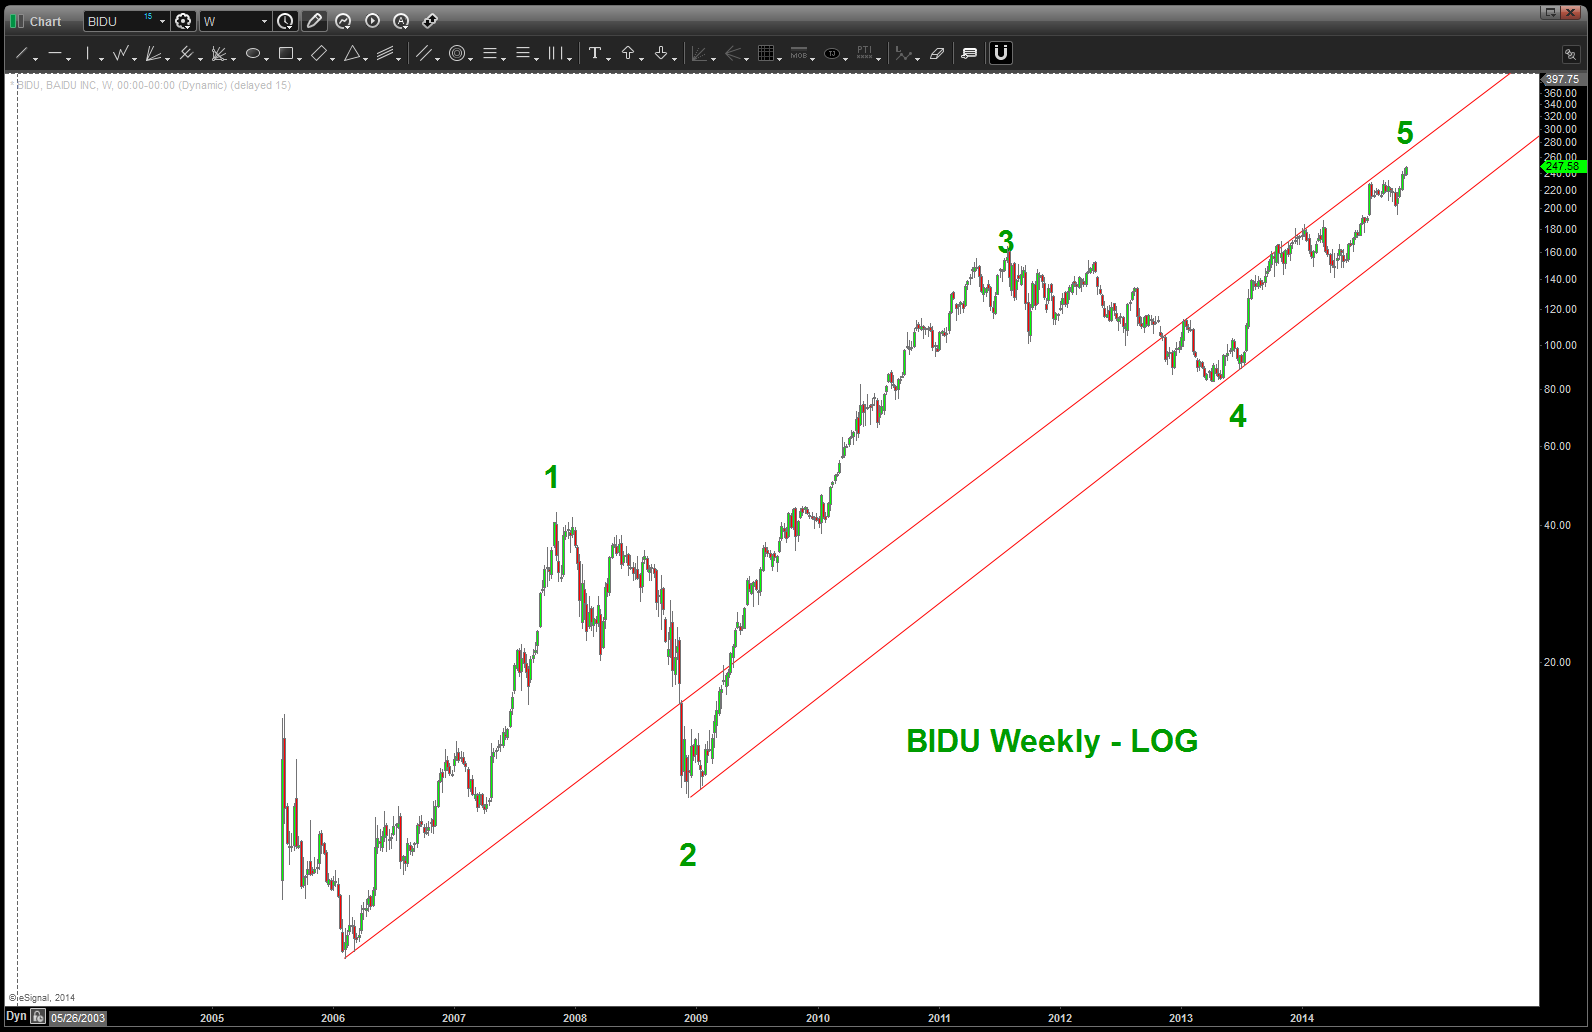
03/31/2014
CLIFF NOTES: very strong probability that a 5 wave advance is complete on BIDU
Here’s the last look at BIDU working on a 188 target for wave 5: https://bartscharts.com/2013/10/21/the-ray-charles-count-on-bidu/
Updated chart:

Aussie vs USD bottom in place?
Posted on November 9, 2014 Leave a Comment
The Aussie has been correcting for a while and, folks, the move down from 1.100 ish certainly appears to be corrective. What does that mean? We are “at” or “near the beginning of a multi year advance that will take out the high July 2011. Here’s the monthly picture …
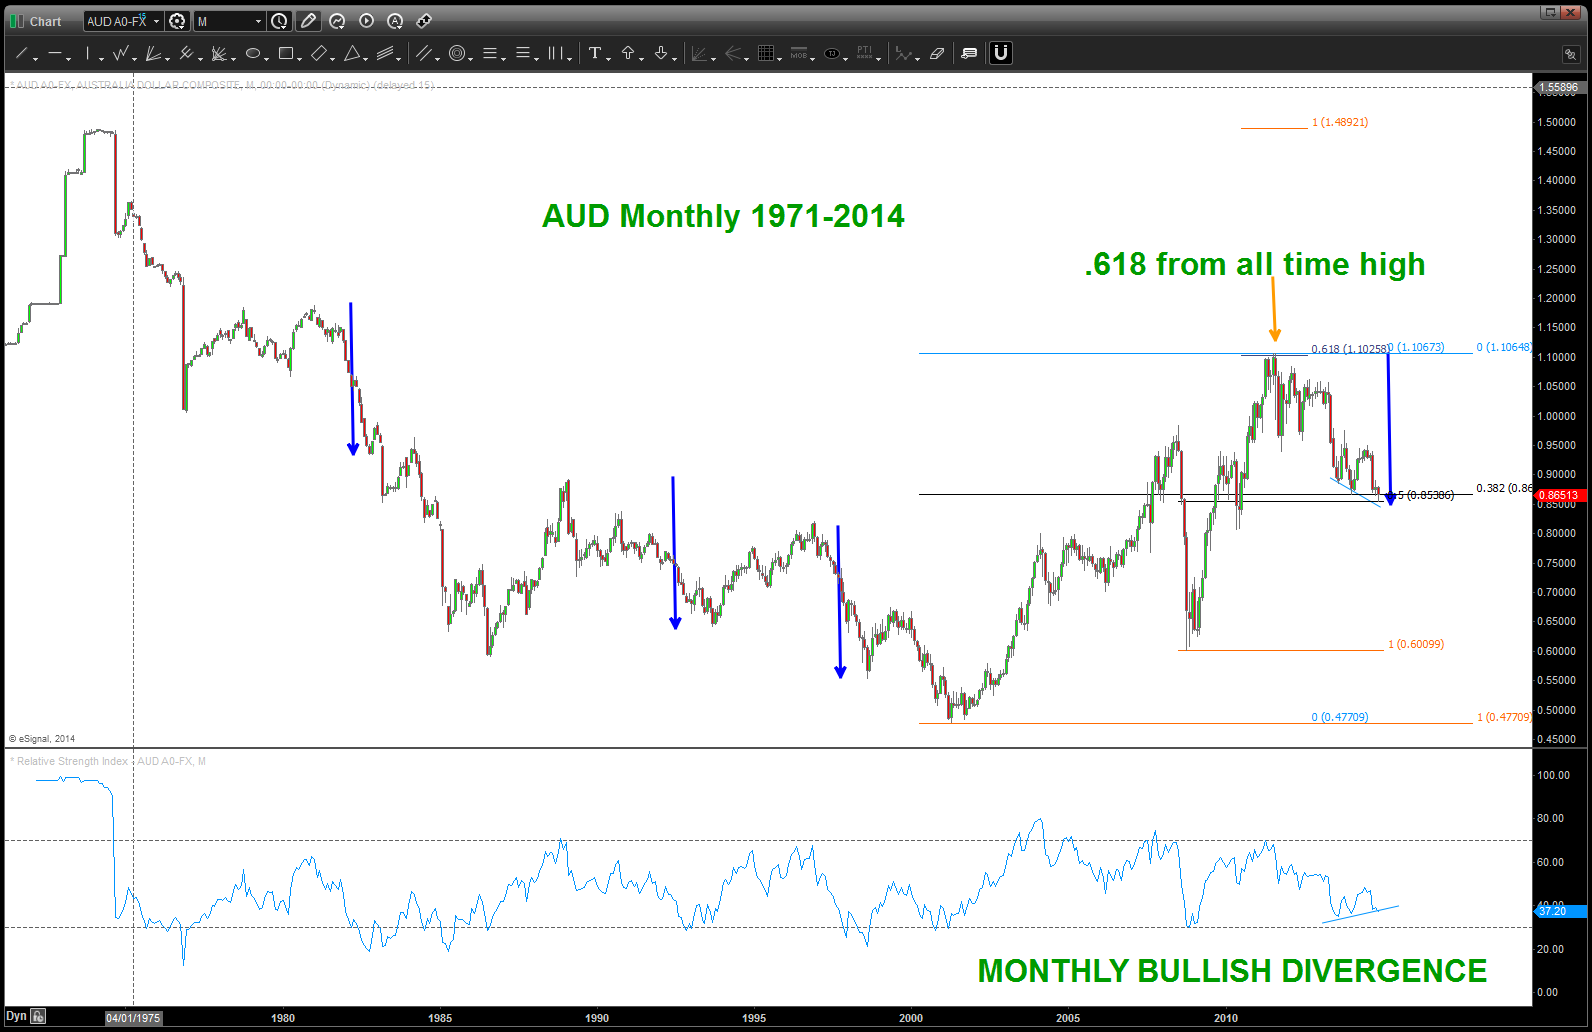
TILT … everyone is talking about US Dollar strength – yes, but they are talking about the dollar index which the Aussie isn’t even a part of it. Or if it is the weight is negligible so in this case we have to take this pair as a single entity – not a weighted index.
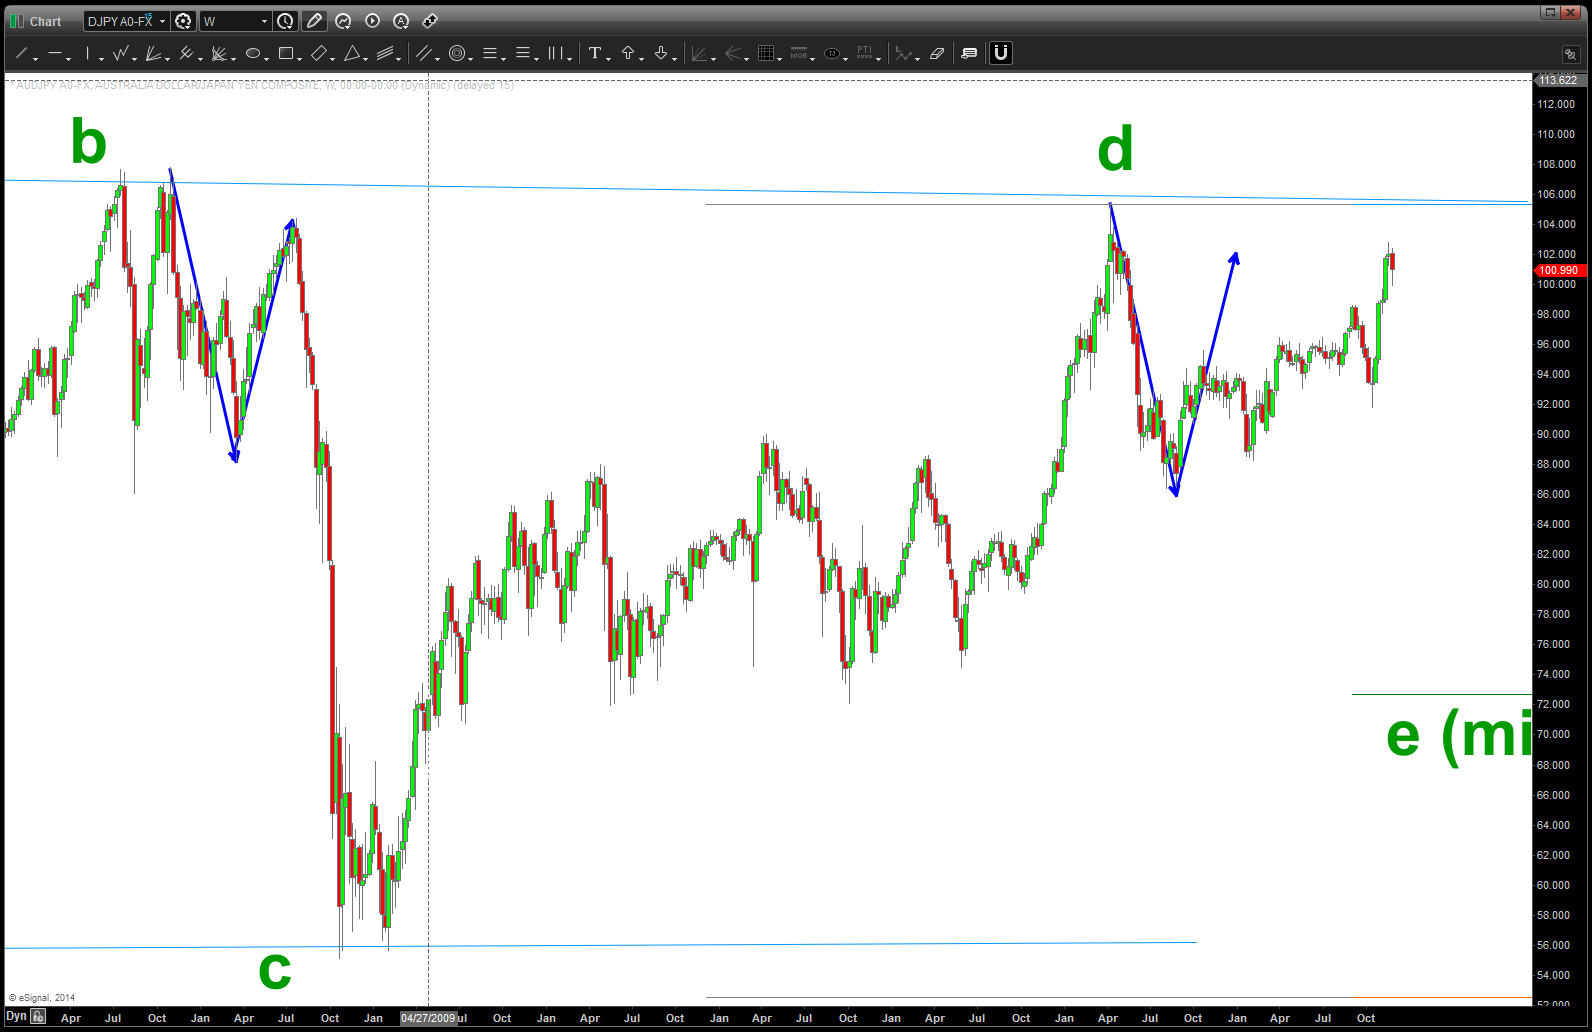
here’s the weekly:
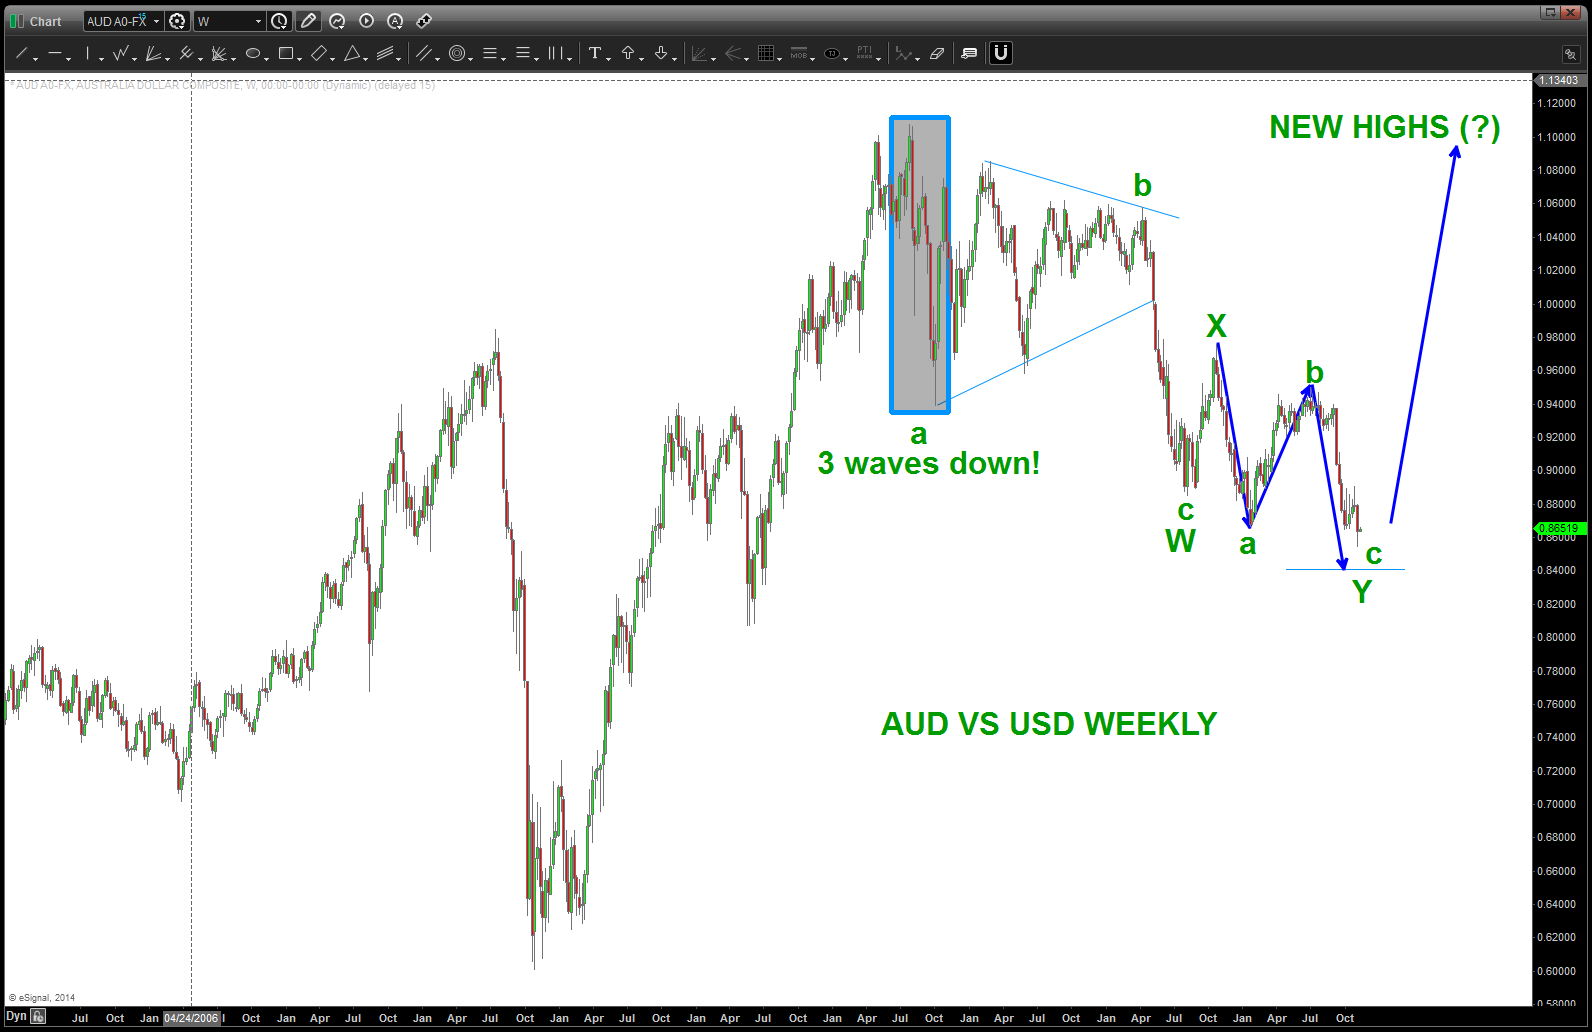
note the 3 waves down … that is the key. it was not a 5 wave movement. has this correction been complex – yes. But it’s falling right in line w/ a double three labeled w,x,y.
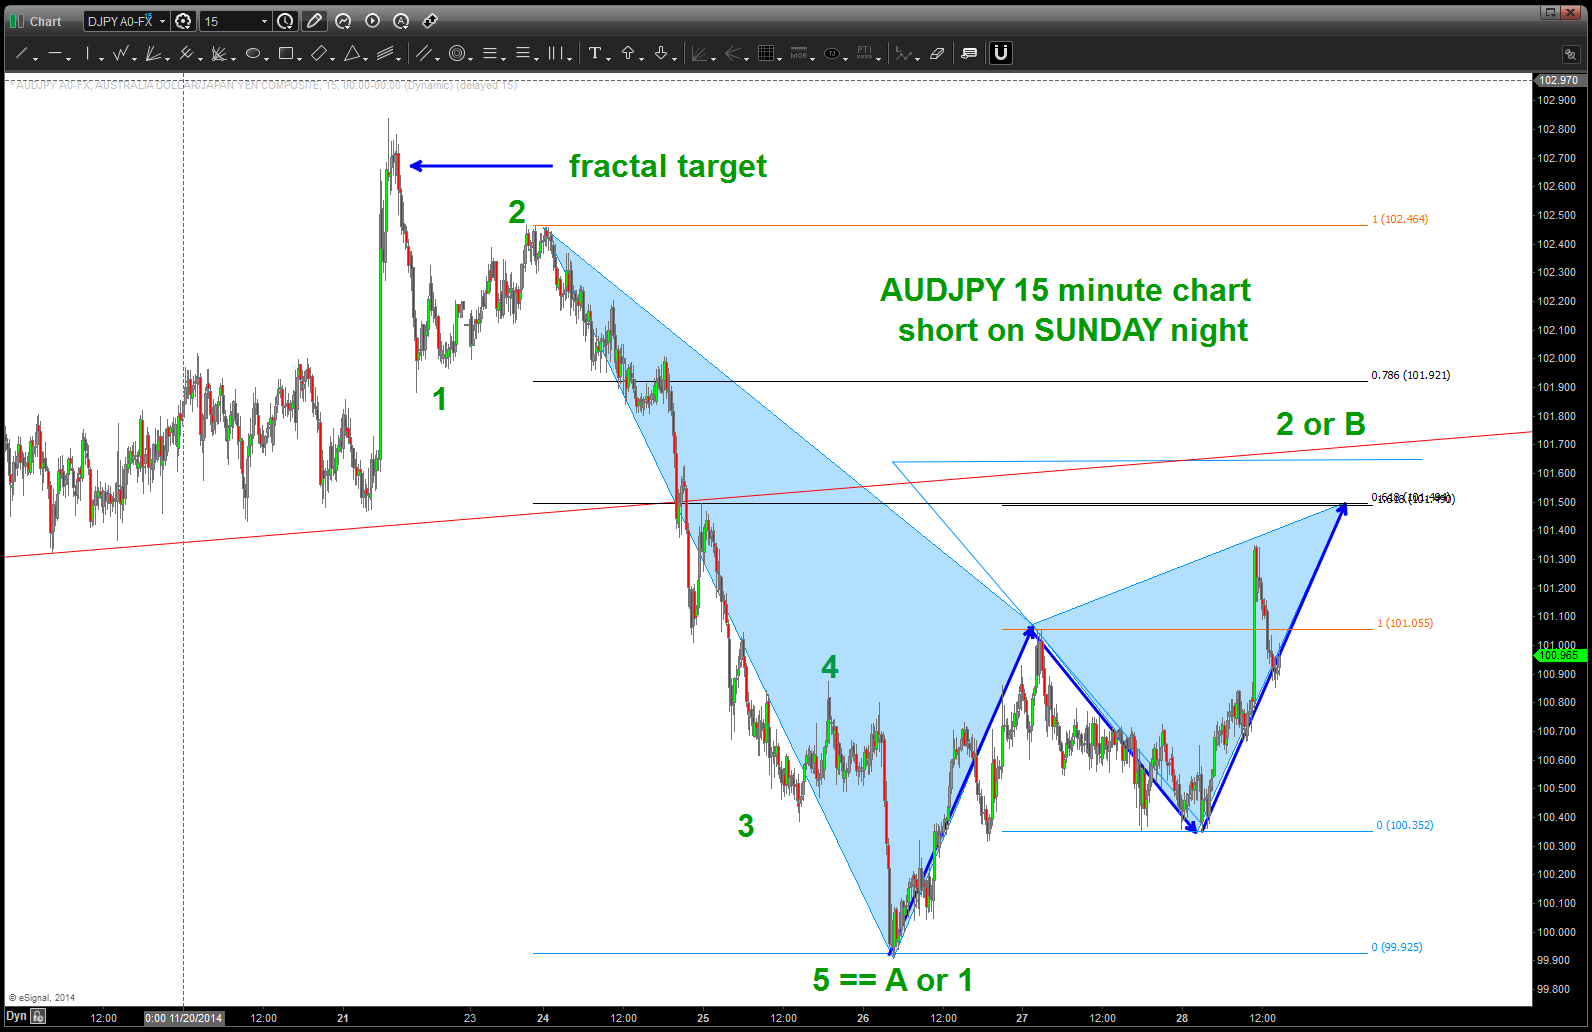
and, the daily, shown below, just completed 5 waves down. While it would be perfect symmetrical three drives to a bottom is we go down and attack 8400 – there is a good case to be made that a low is in place. we’ll have to wait for an intraday pattern to appear …
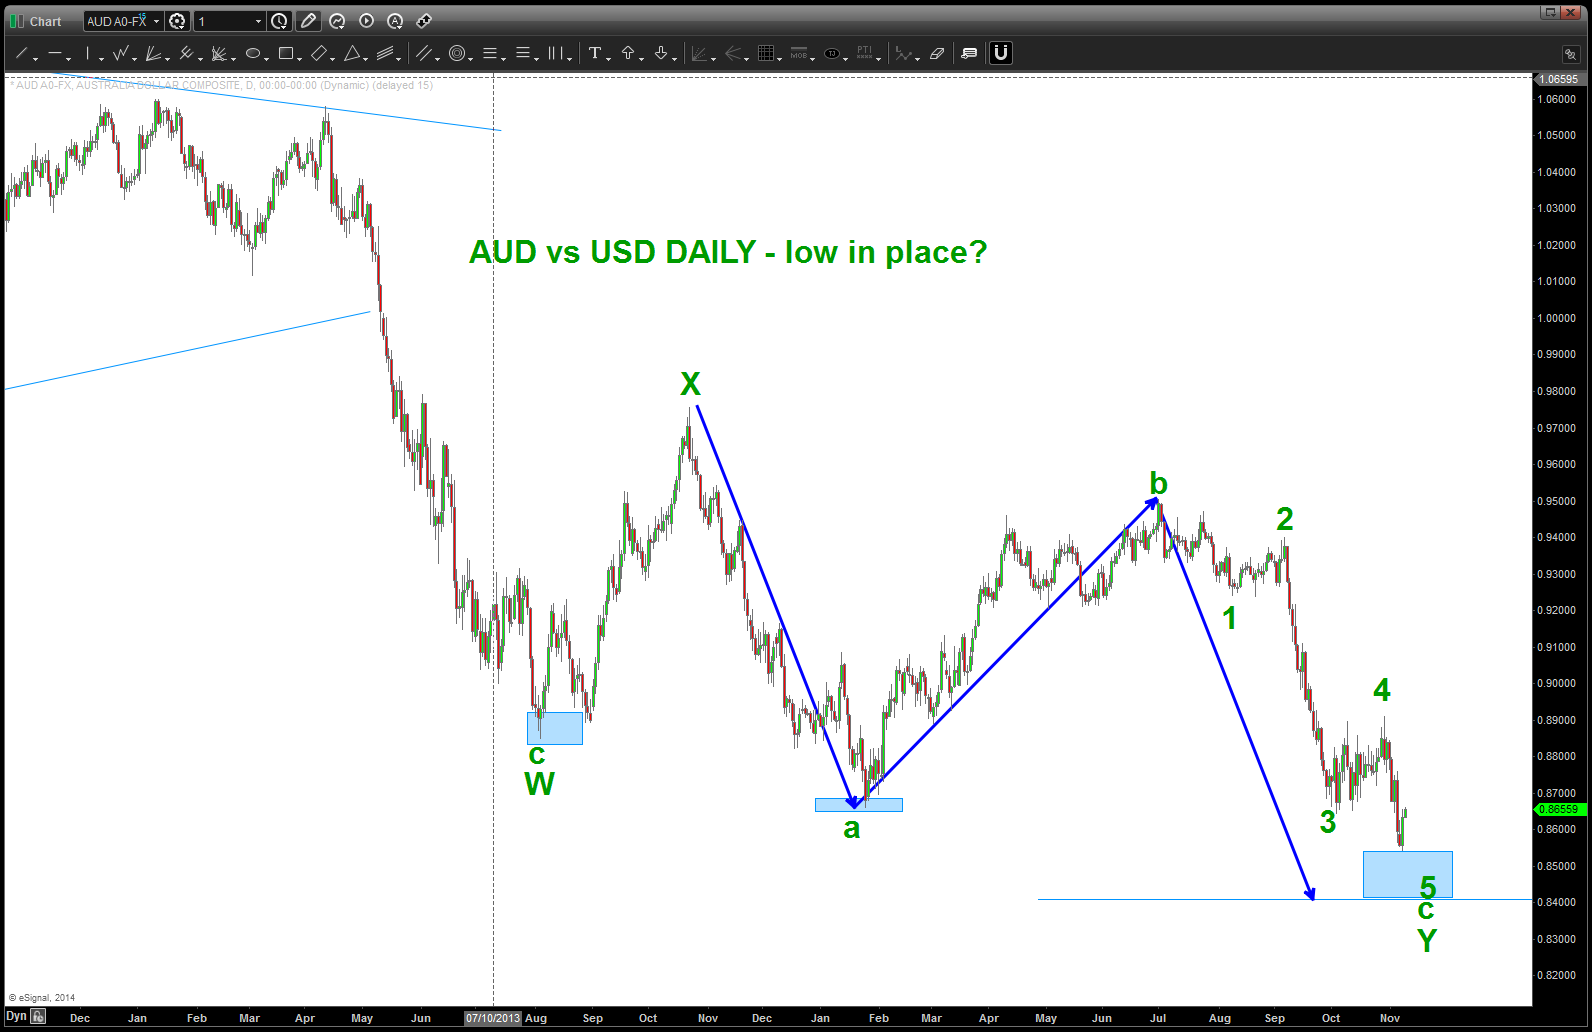
and finally, we’ll see the move down on a 60 minute chart is a clearly defined 5 waves.
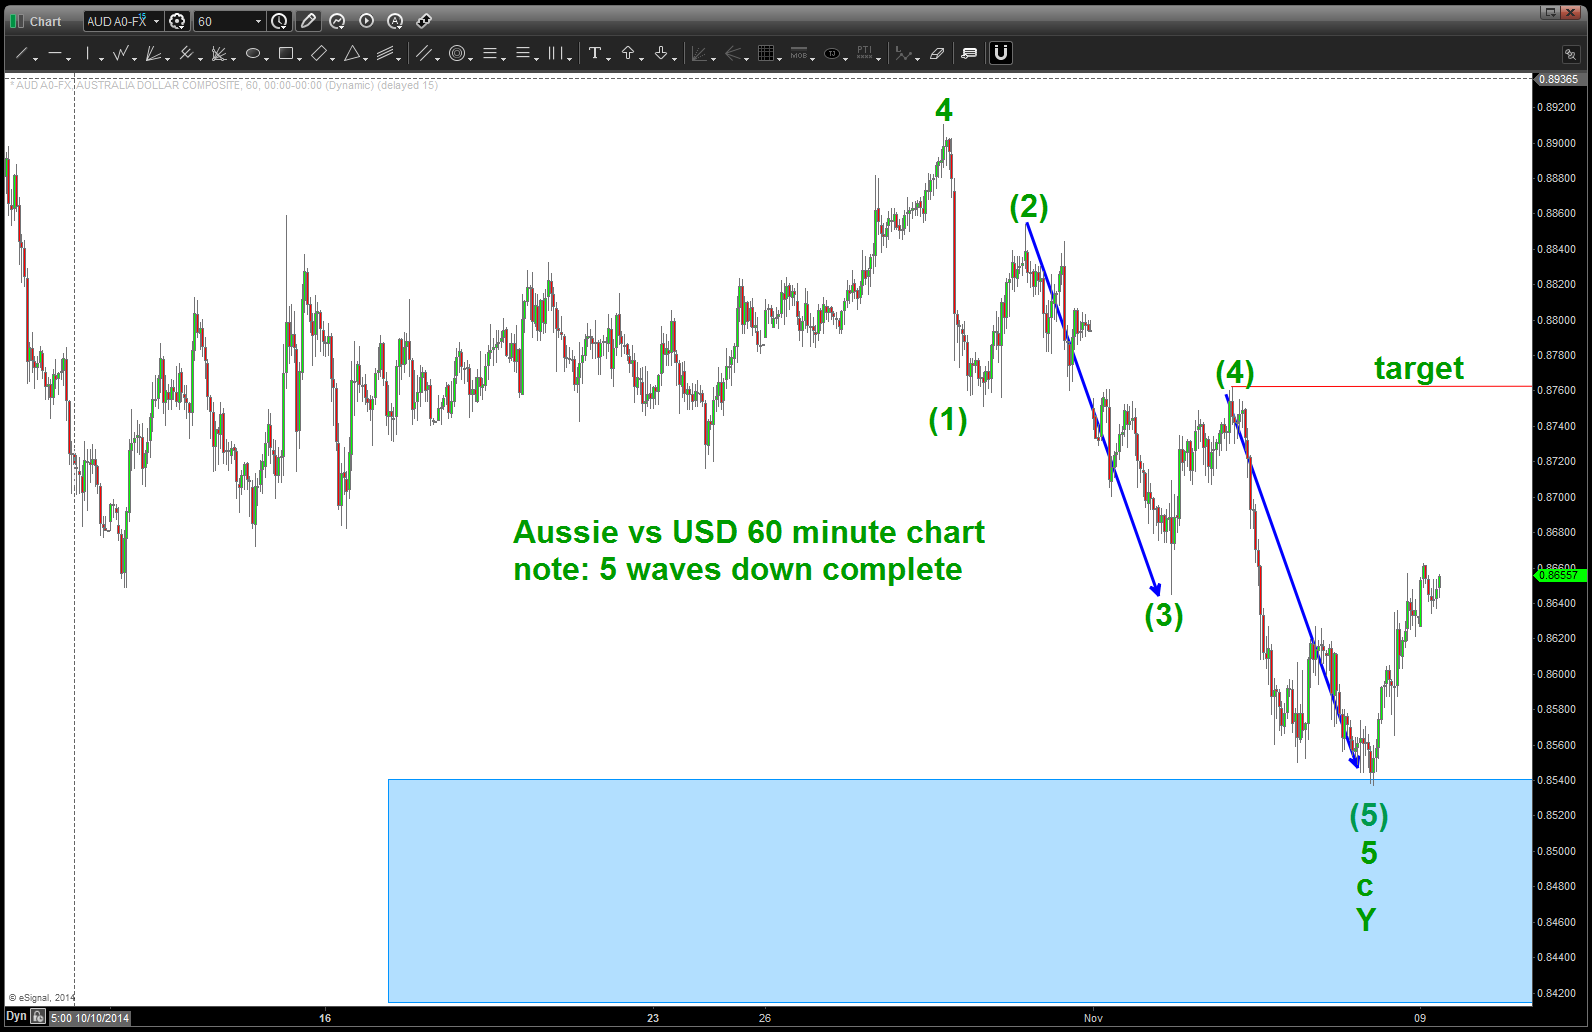
so … there ya have it.
what to do? Well, our thesis is we are beginning a multi year move to take out the old highs from 2011. IF THAT IS CORRECT THEN WE ARE IN the first stages of the advance. the first move up (wave 1) will complete and then wave 2 will come and, more than likely, w/ a vengeance because everyone thinks the “old trend” is in play. That’s the BUYING OPPORTUNITY and price should never go below the low that was formed last week.
stay tuned …get ready to rumble.
Bart
