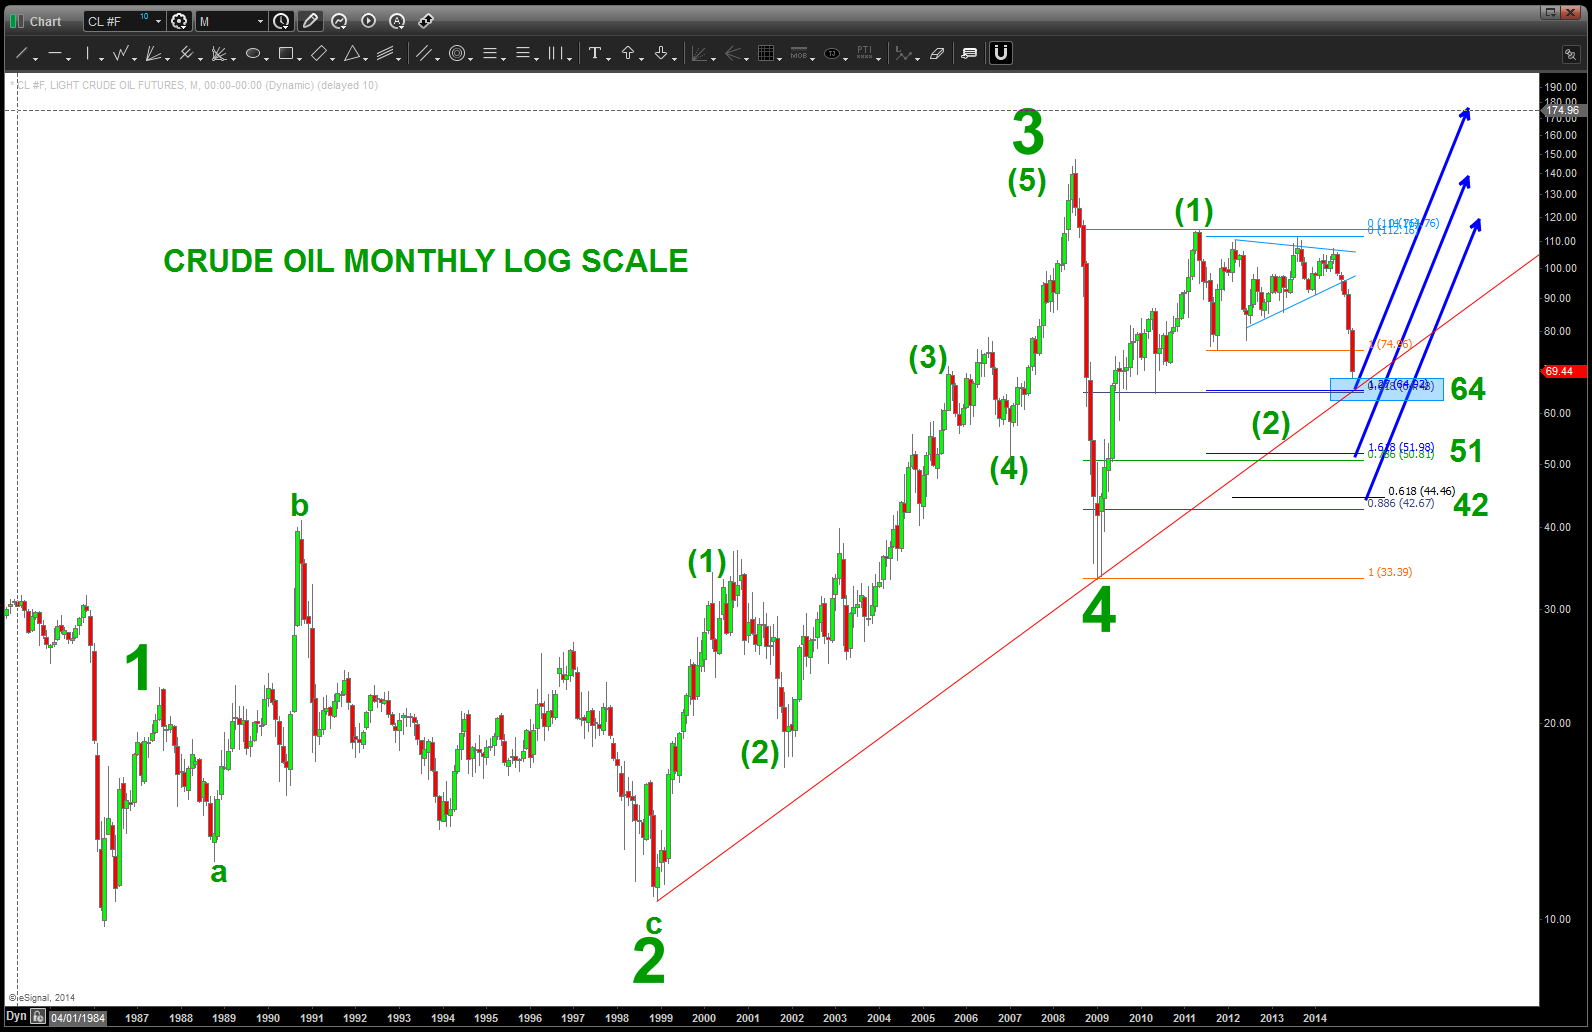
the case for $170 oil ….
one chart – the only thing wrong w/ this chart is the length of the data. “wish” I had longer time frame oil prices. however, based on that I put together this count.
rules:
- 2 can’t go below the origin of 1: check.
- 3 can’t be the shortest: check
- 4 can’t go below 1: check
thesis, this move in oil is a C wave and is certainly acting like it.
why not step in and BUY at 64 OR wait for a nice pullback since, as shown below 67 might have done it. (NOTE: PRICE = TIME today for the 67 level)
What if … what if this count is correct? K A B O O M ….
the case for BULLish OIL …perhaps?
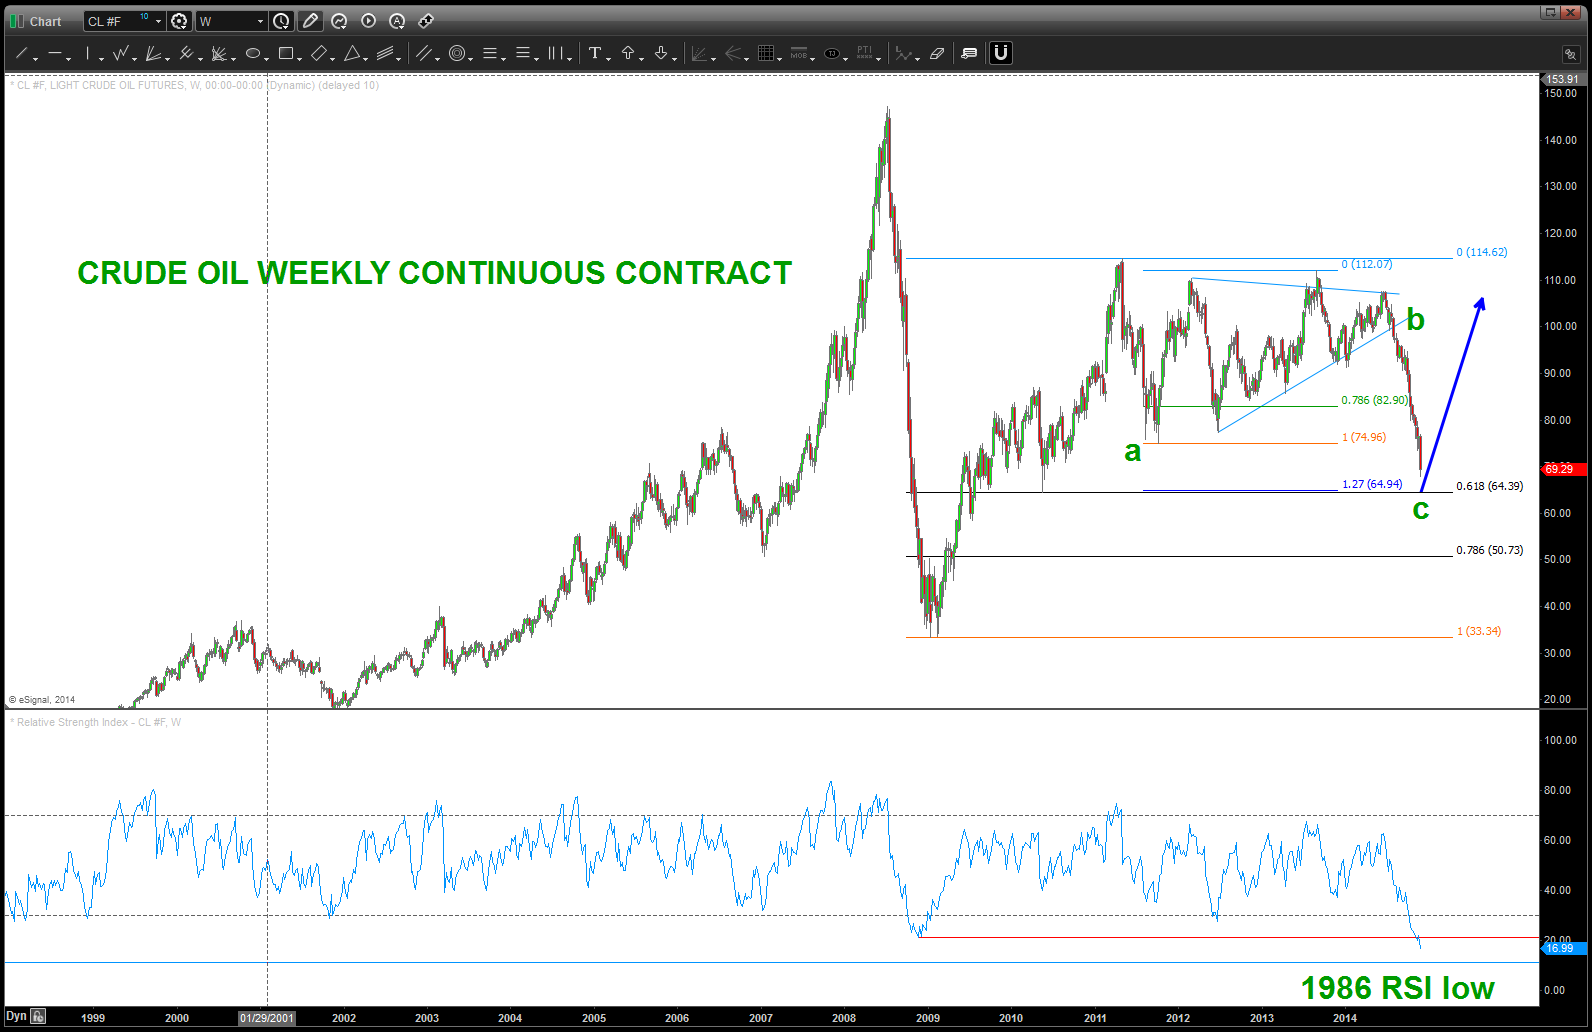
RSI ALMOST AT EXTREME
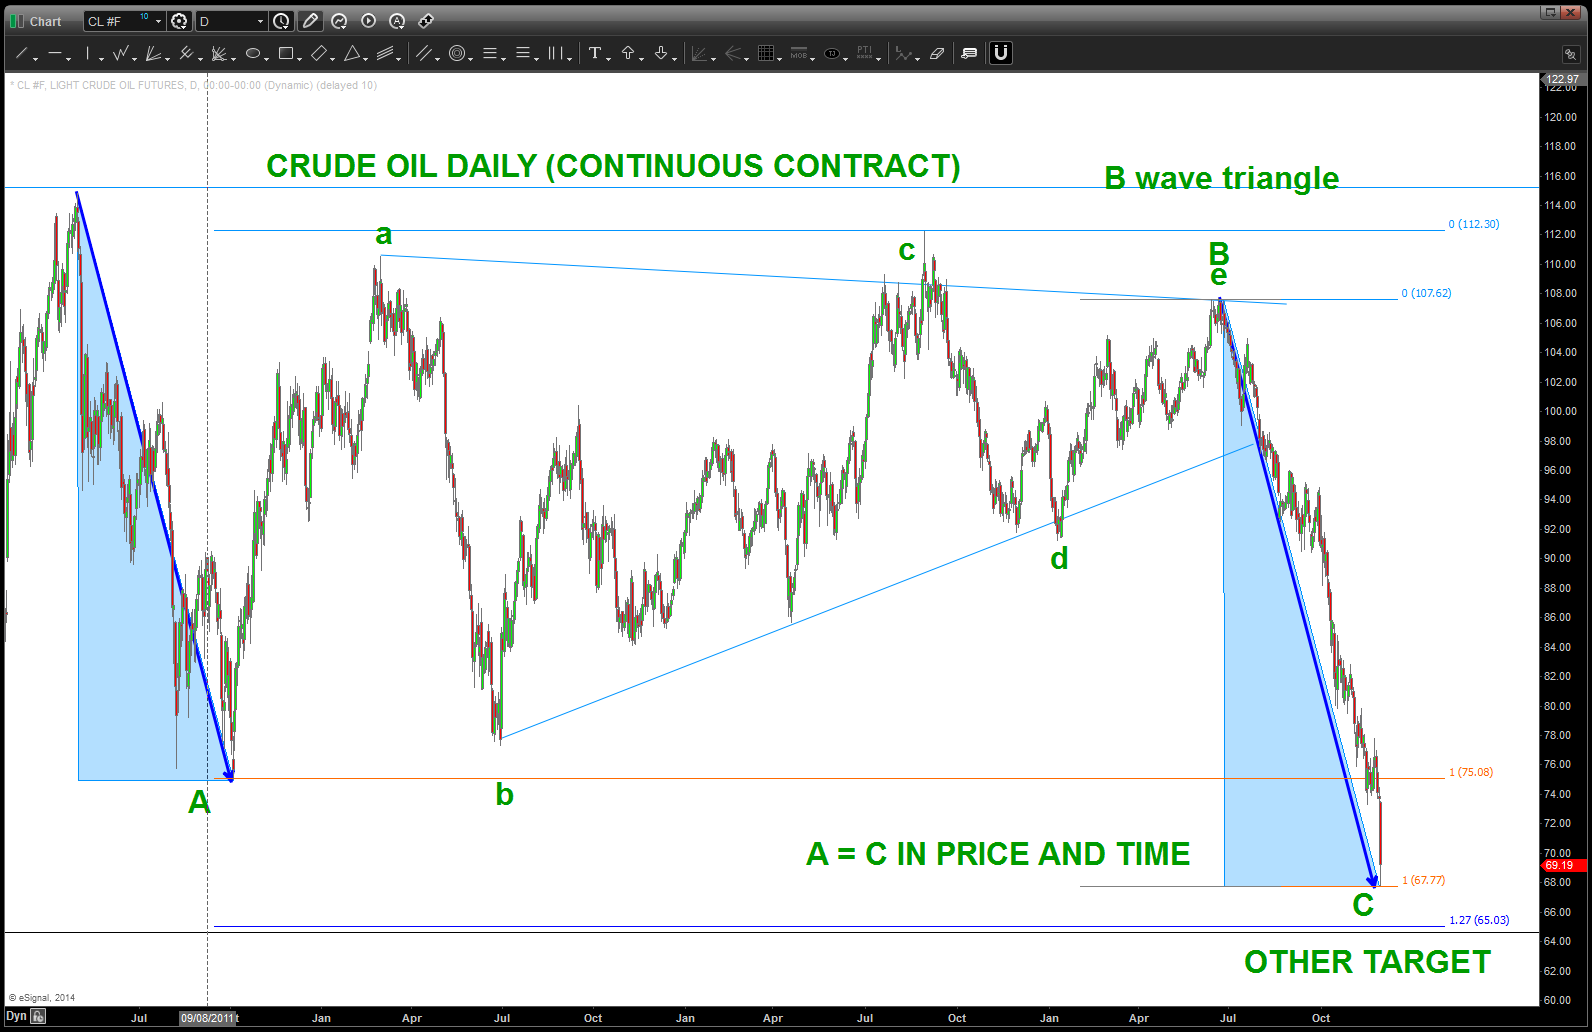
A=C IN PRICE AND TIME – TODAY
