US STEEL – back to the neckline complete
Posted on October 17, 2014 Leave a Comment
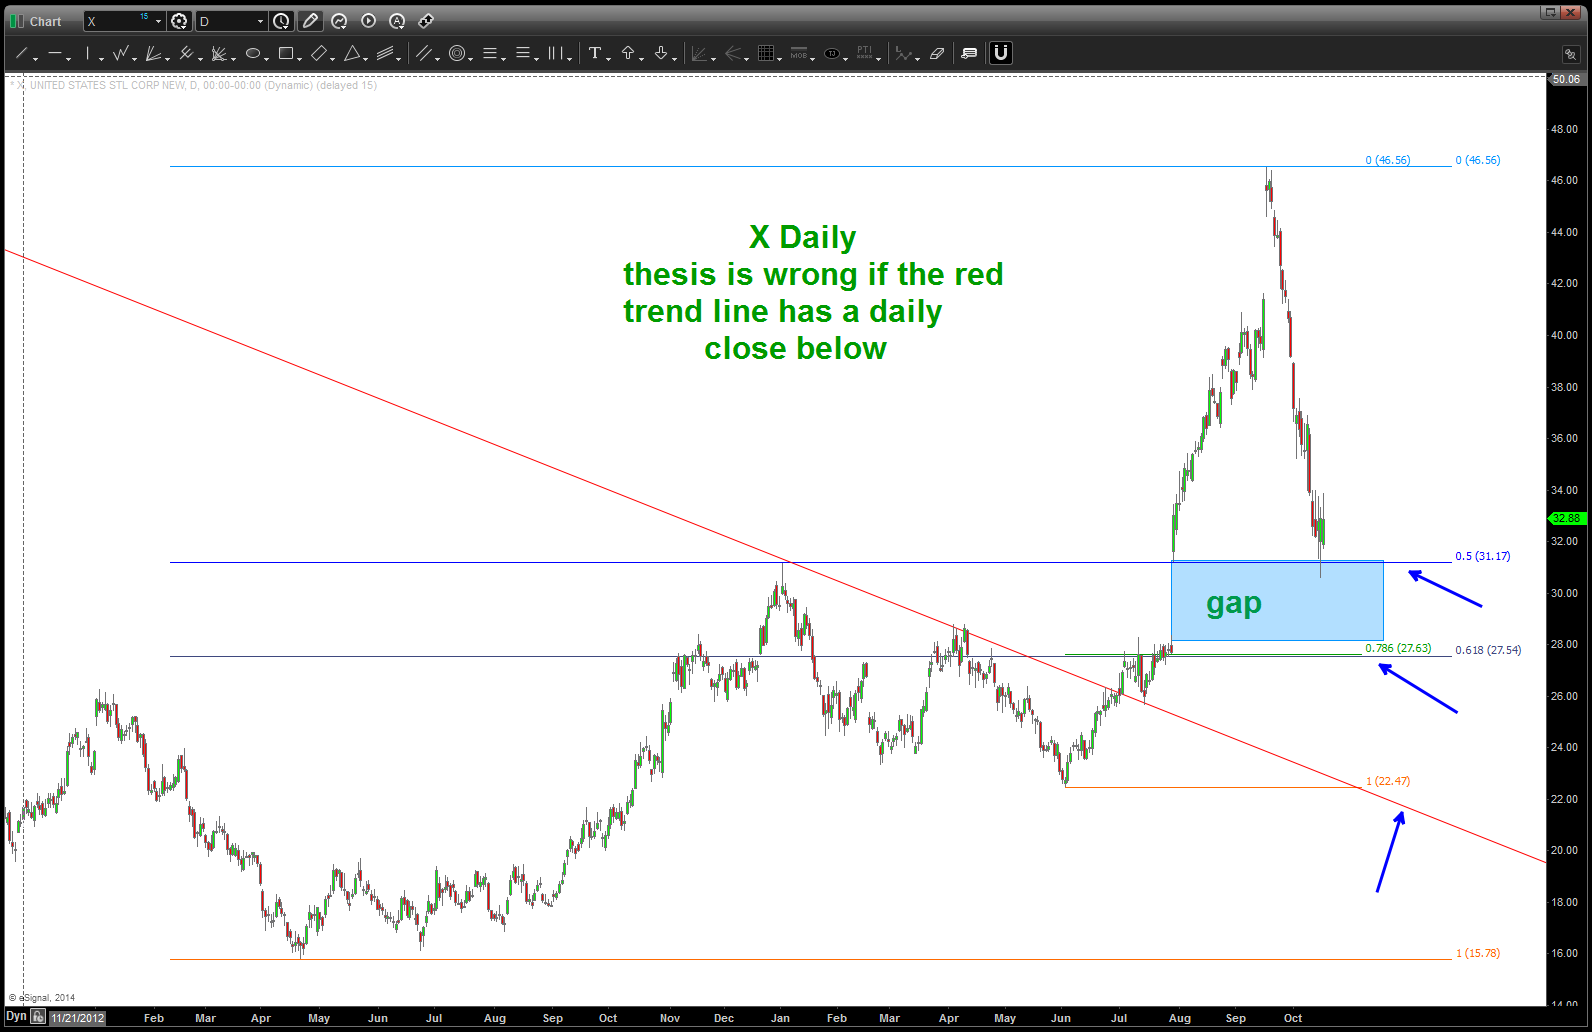
US Steel – X has gone back to the neckline. Anywhere in the zone of 27-21 should begin another advance. Am wrong if we get a daily close below the red trend line.
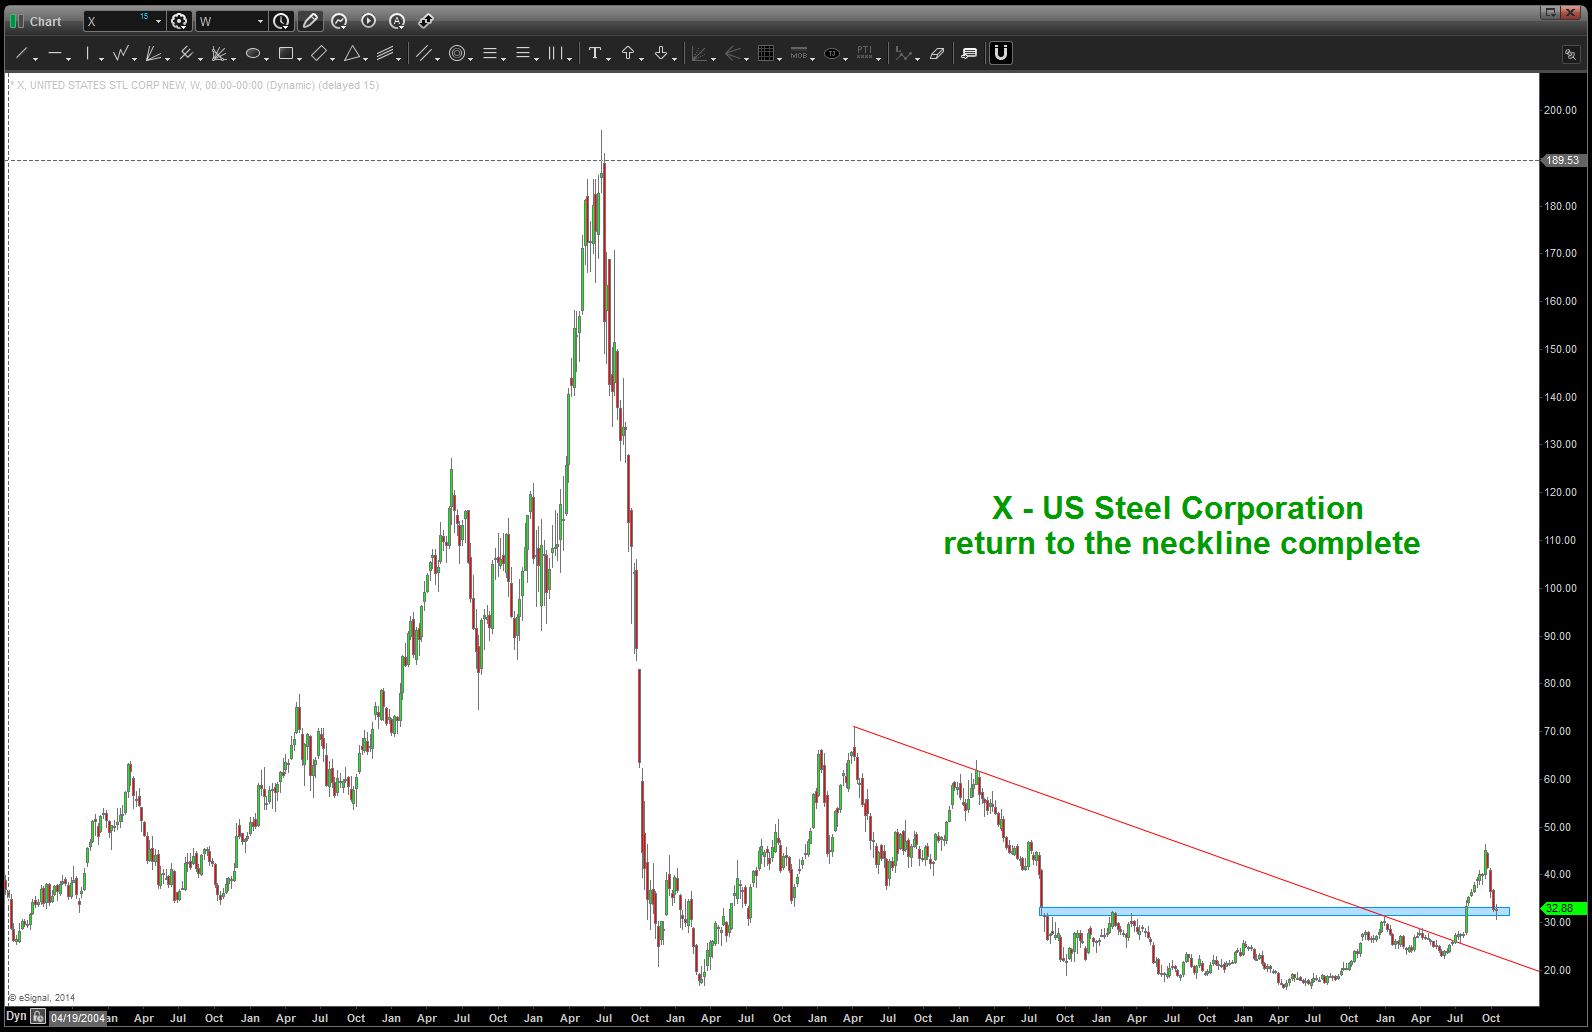
CLIFF NOTES: believe this breakout in X is real and it “should” come back down to highlighted areas for another BUY.
X
who’s negotiating for PCLN?
Posted on October 13, 2014 Leave a Comment
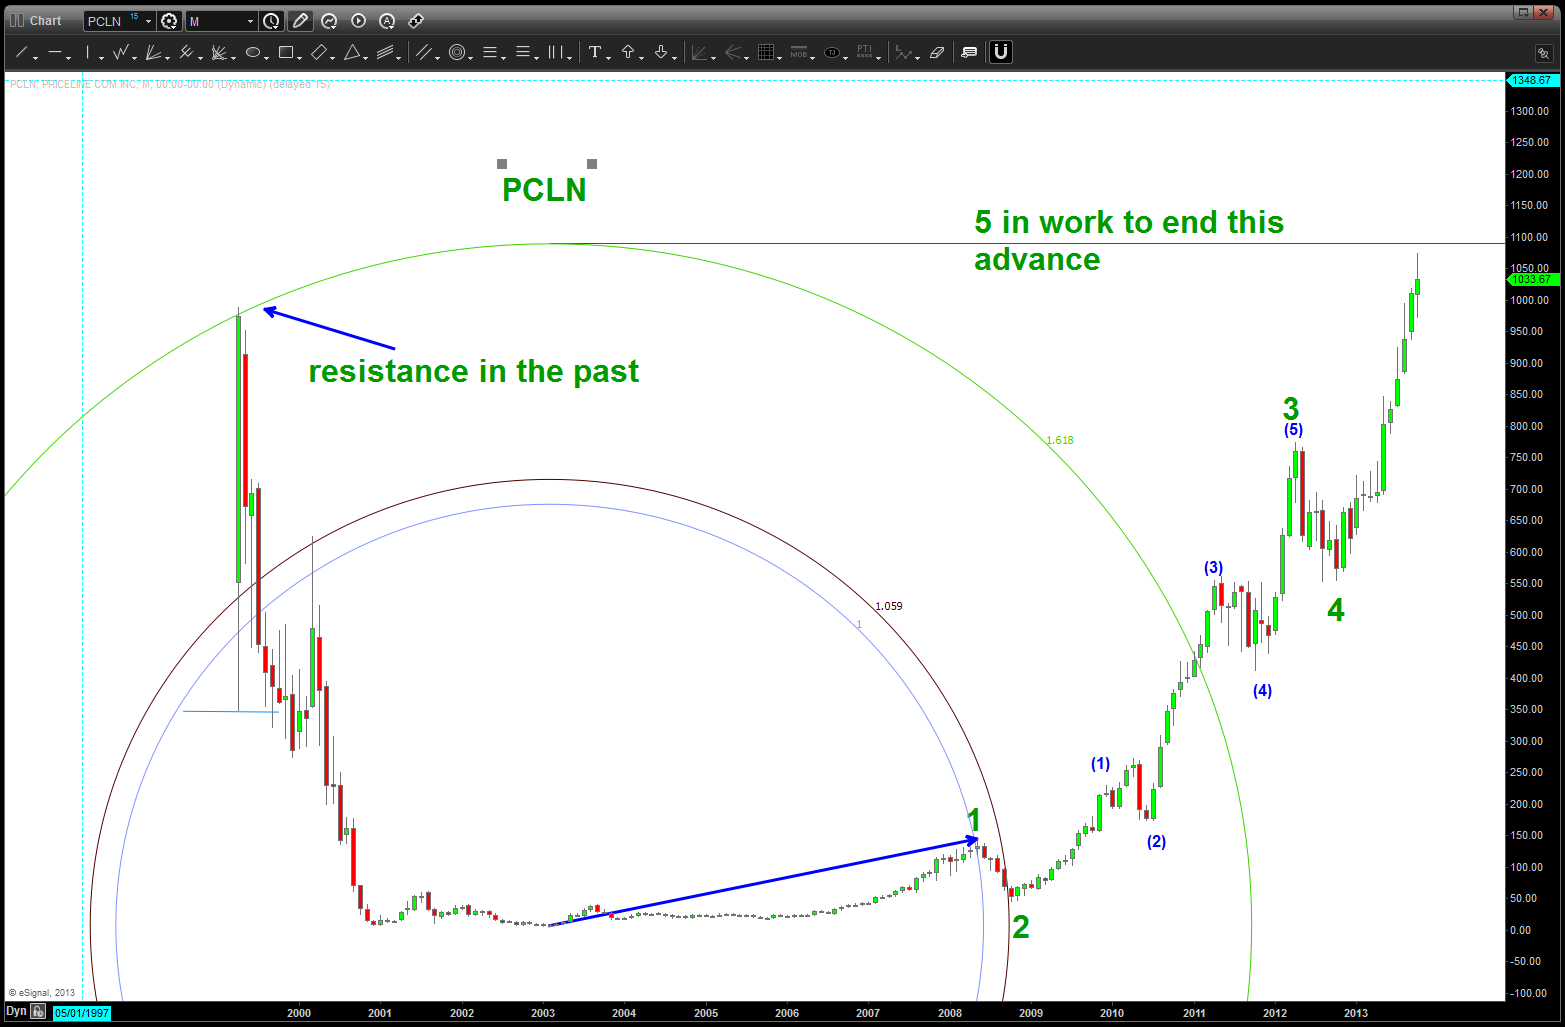
PCLN – 5 waves are complete and the first AB=CD appears at 1039. Then 988 as former resistance ….these levels are KEY to the continued bull run of PCLN. An amazing run … however, it’s not a far stretch to say that 5 waves are complete. If so … we should see 550 over the coming year.
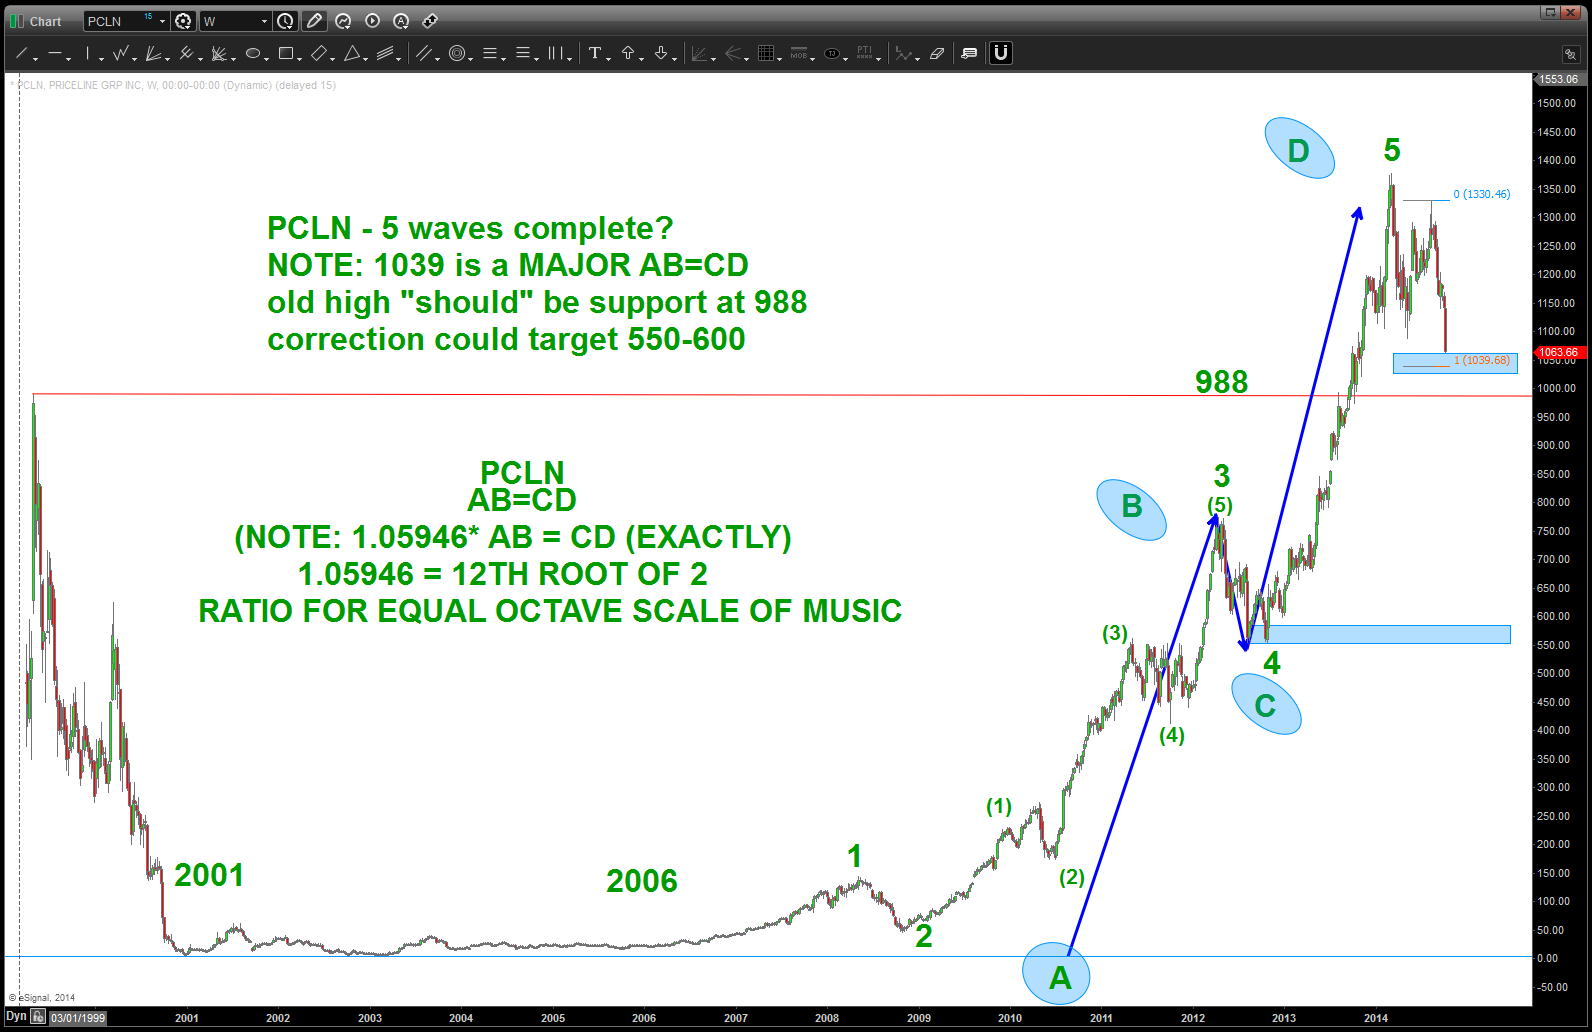
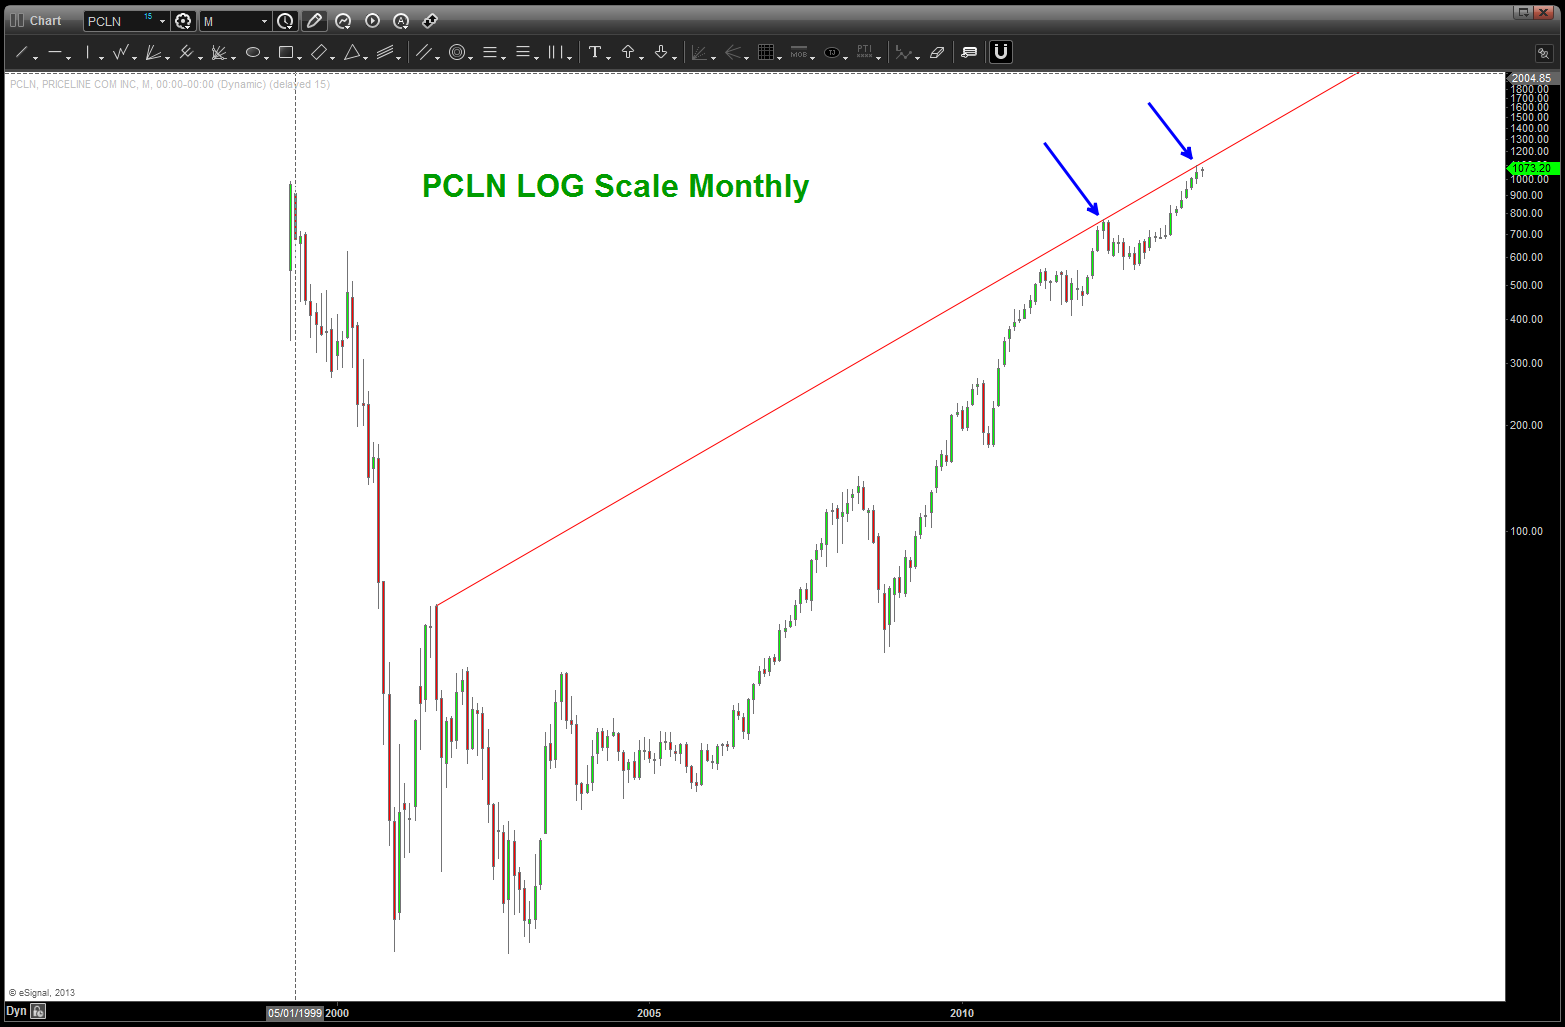
PCLN … amazing advance but one that is at/nearing an end for now.
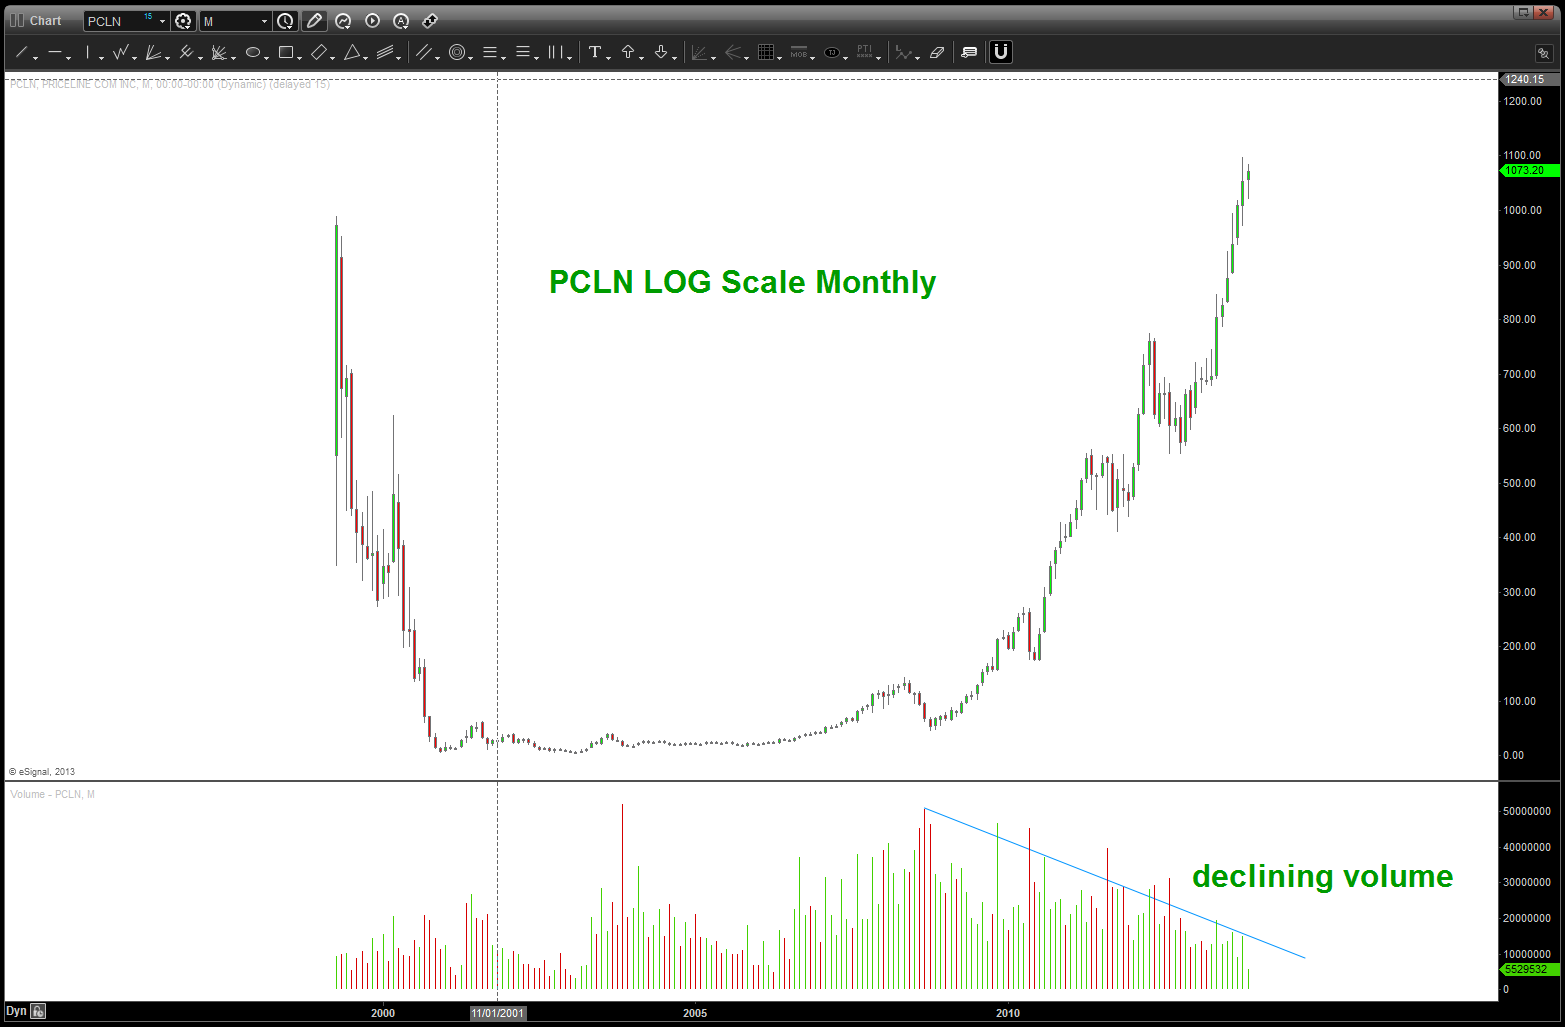
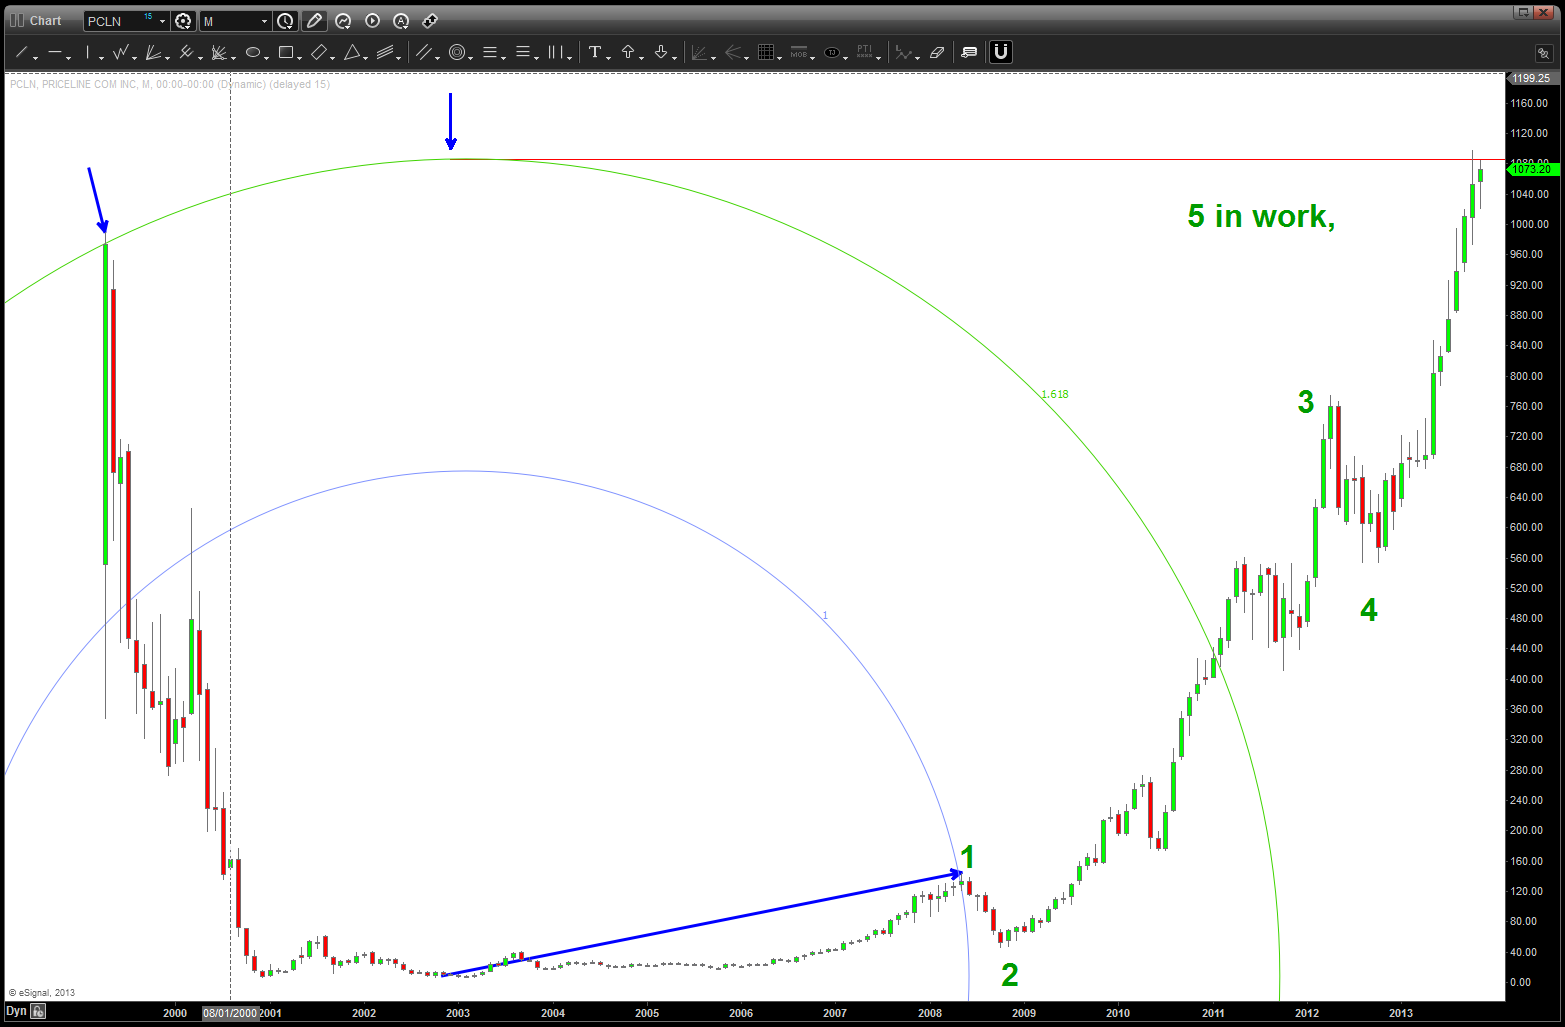
a clear wave structure is in place that makes this current move up equal to a 5 on declining volume. also, it’s parabolic so don’t get to overzealous and short up in here – however – take not of my TSLA post, AAPL posts, etc to see how amazing parabolic moves are to the UPSIDE and how they get balanced by moves to the downsides that are equal and opposite w/ intensity. In my lifetime, I have never seen a parabolic move that rock and rolls to extreme highs and then digests/distributes and pauses and then takes off again…they all crack, hard.
ratio’s are really powerful
Posted on October 10, 2014 Leave a Comment
been blogging a BUNCH about the importance of the XLP / SPY ratio. Why? Well, EVERY turn since 2000 has been nearly exact to the ratio turning up or turning down. here’s the chart:
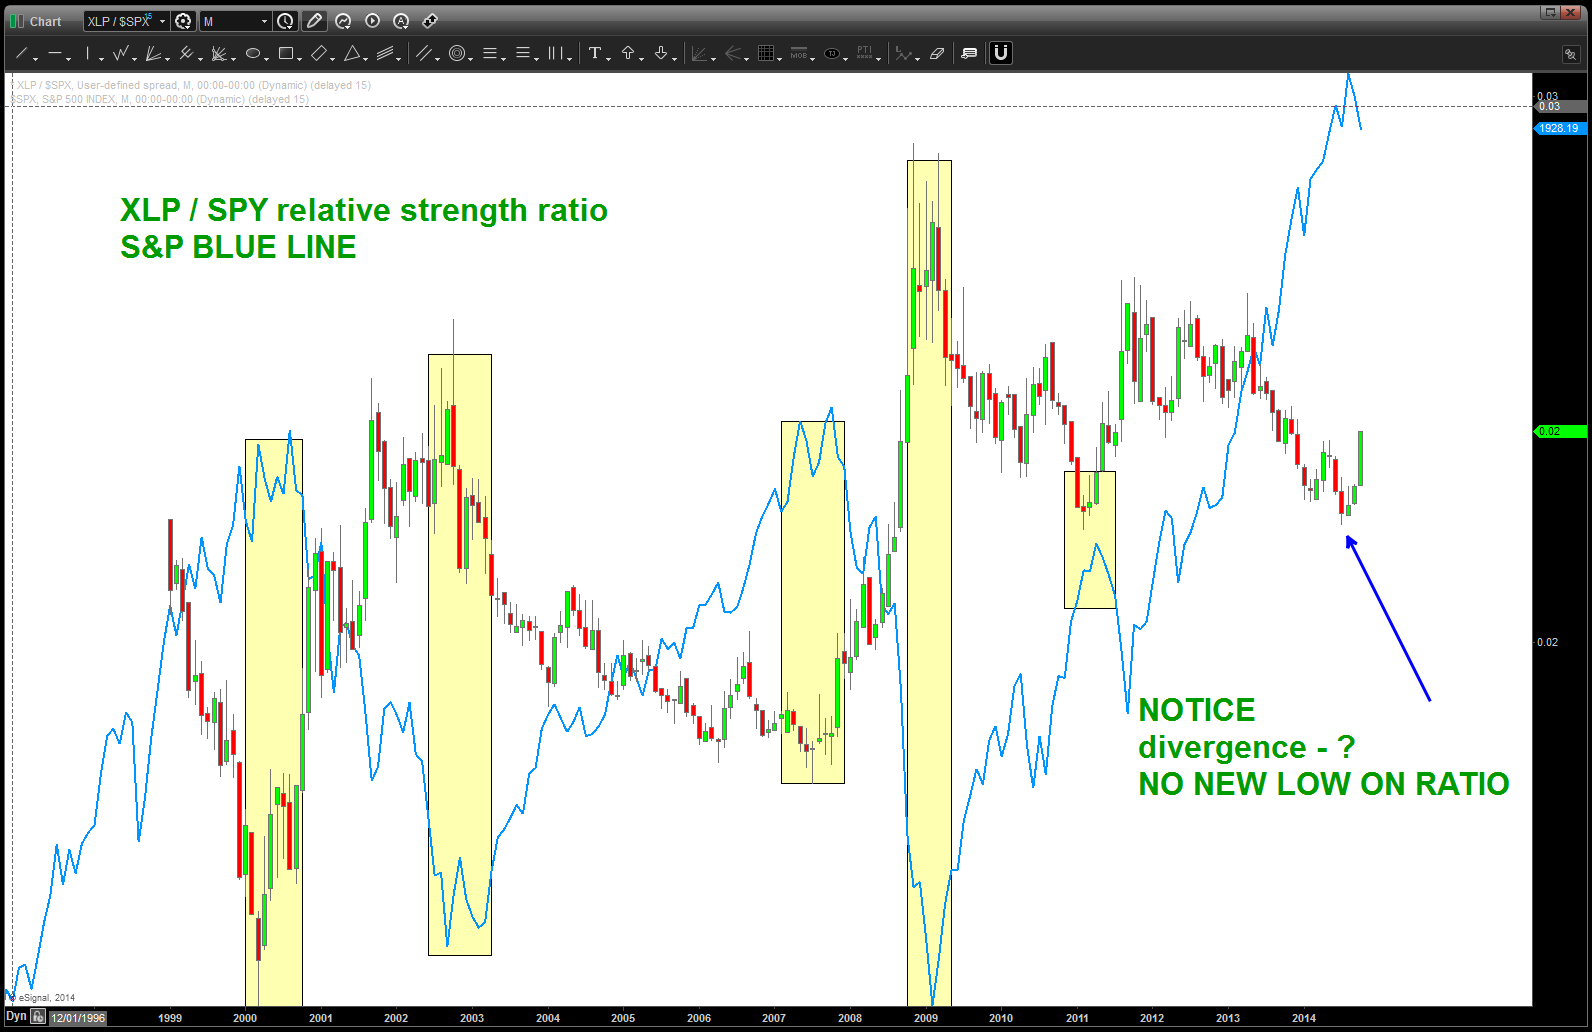
XLP / SPY ratio w/ S&P overlaid on top of it … NOTE divergence since 2012
folks, it doesn’t get much better than that … the CANDLES is the ratio of XLP / SPY. The BLUE LINE is the S&P 500. the chart time frame is monthly. EVERY PIVOT IN THE STOCK MARKET HAS BEEN A CORRESPONDING PIVOT EQUAL/OPPOSITE in the ratio. (move up in stocks equals move down in ratio and vice versa)
why is this important … well, check out the VIX and the ratio
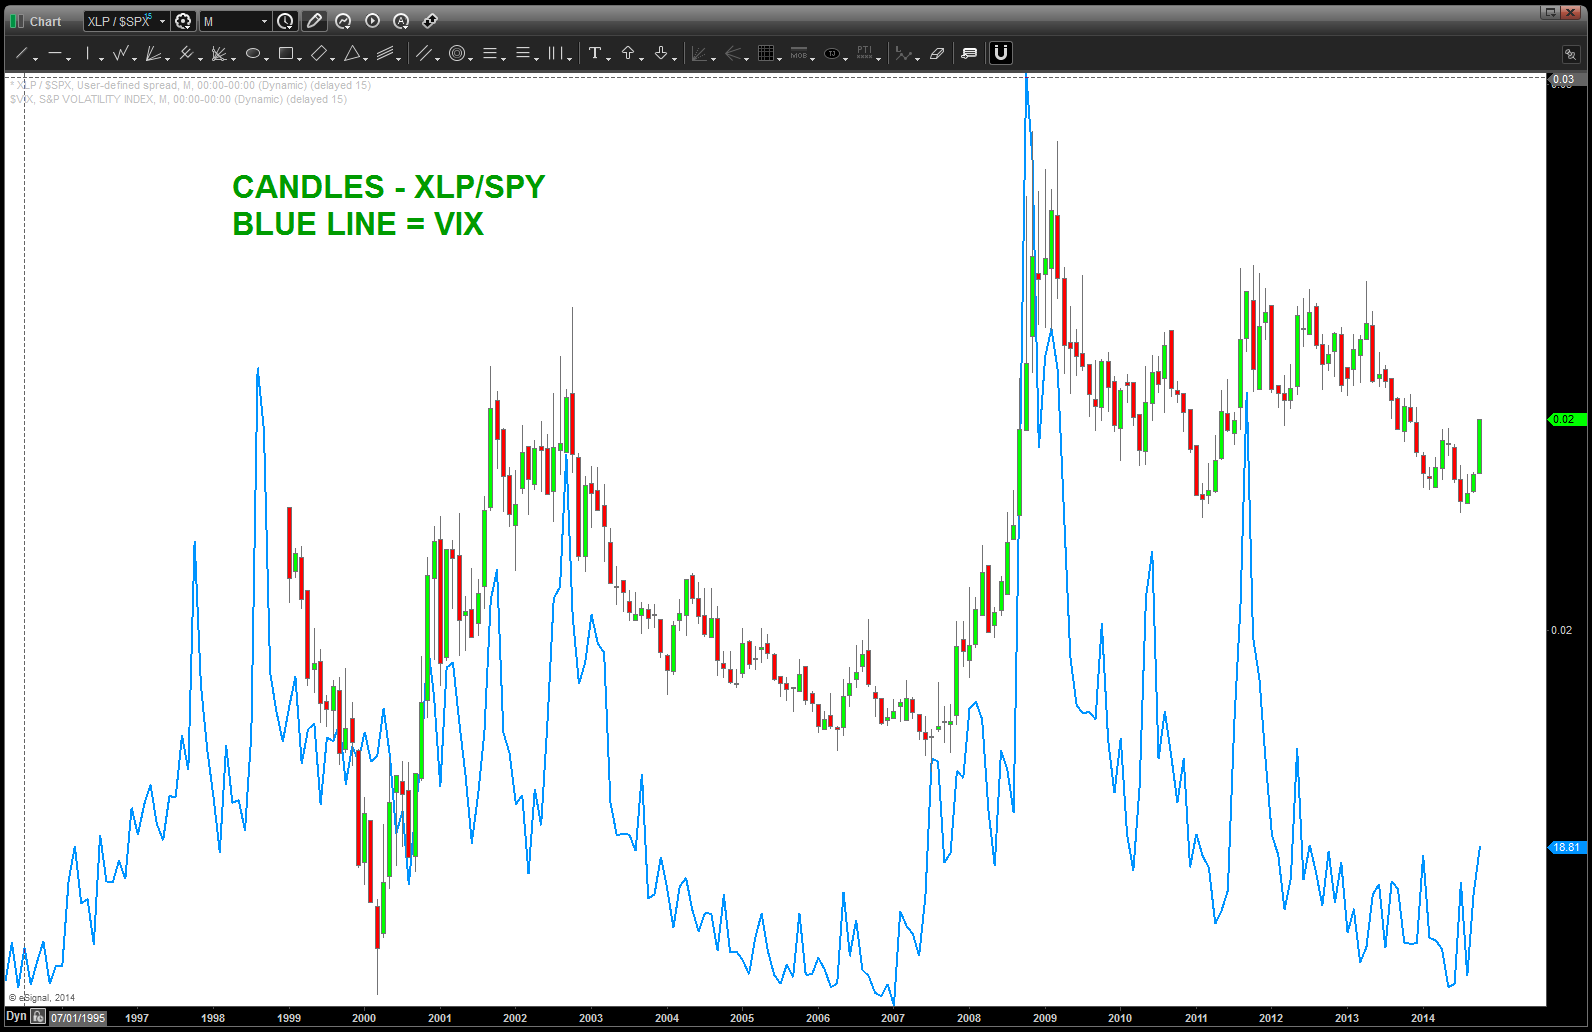
XLP / SK&P w/ VIX overlaid on top of it
here’s the deal — RATIO ANALYSIS is a unique look into the key hole of the INSTITUTIONAL rotation … and, my take is the ratio should have been sreamcing down while the S&P ripped to new highs. IT DID NOT … that has been something I have tried to resolve for almost two years …
now, why is this low so important in the ratio? well, take a peak at the RSI BULLISH support zone below:
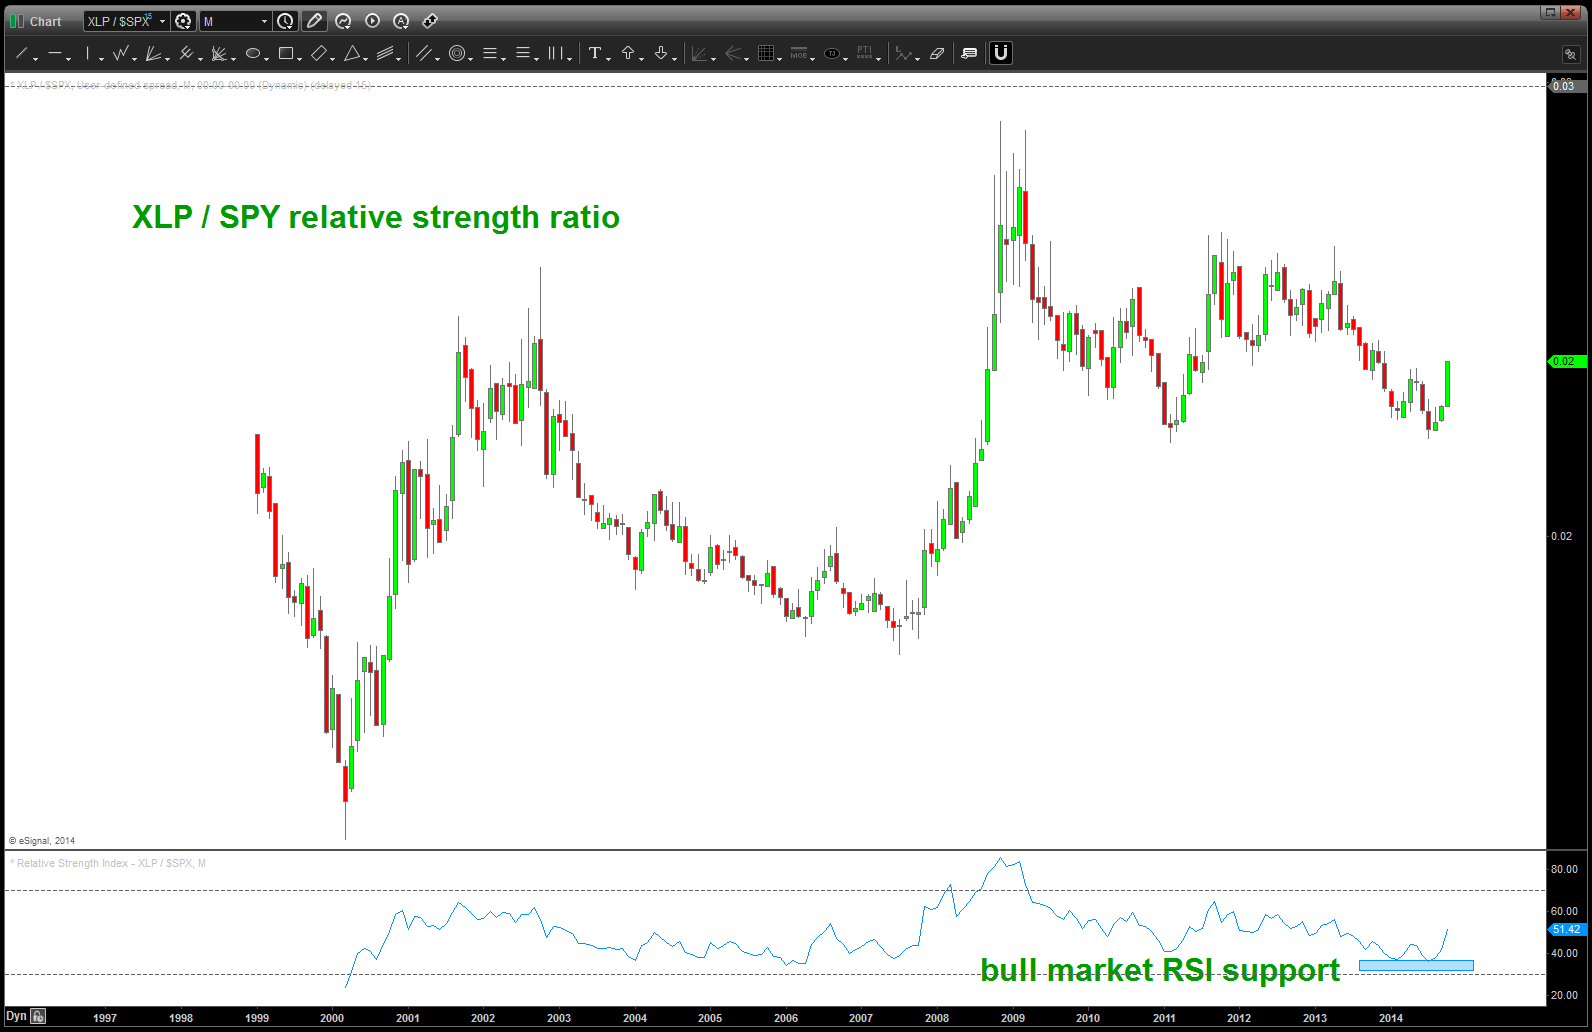
XLP/SPY ratio found support on bullish RSI zone
and, then you could have this as your count …

a POTENTIAL count for the XLP / S&P which shows higher
so, let’s review:
- the CHARTS show
- when the XLP/S&P 500 ratio pivots so does the market …
- we had a very noticeable divergence in the ratio and the S&P 500 as the S&P 500 screamed to new highs
- we have shown that the VIX pivots w/ the ratio
- we have shown the ratio is at bullish RSI support zone …
all the above tells me 1) volatility is here to stay, 2) expect pressure on the equities and 3) I could and might be completely wrong and that’s OK!
make it a great weekend and rock on, ok?
Bart
WYNN Polarity Principle
Posted on October 5, 2014 Leave a Comment
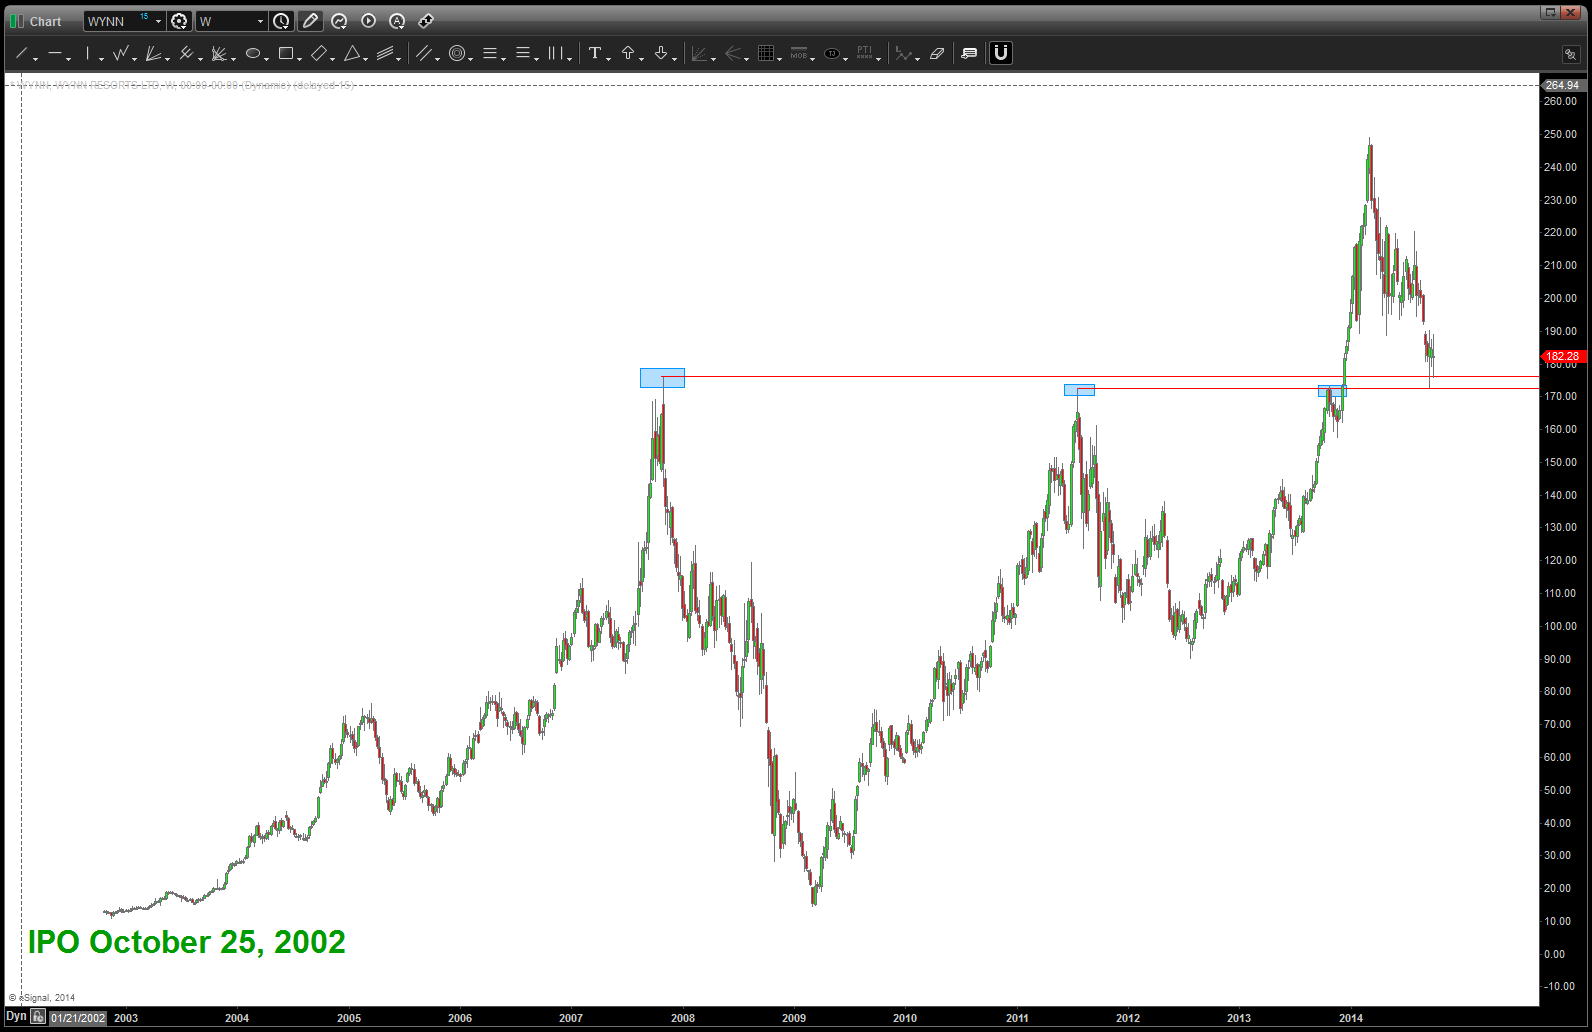
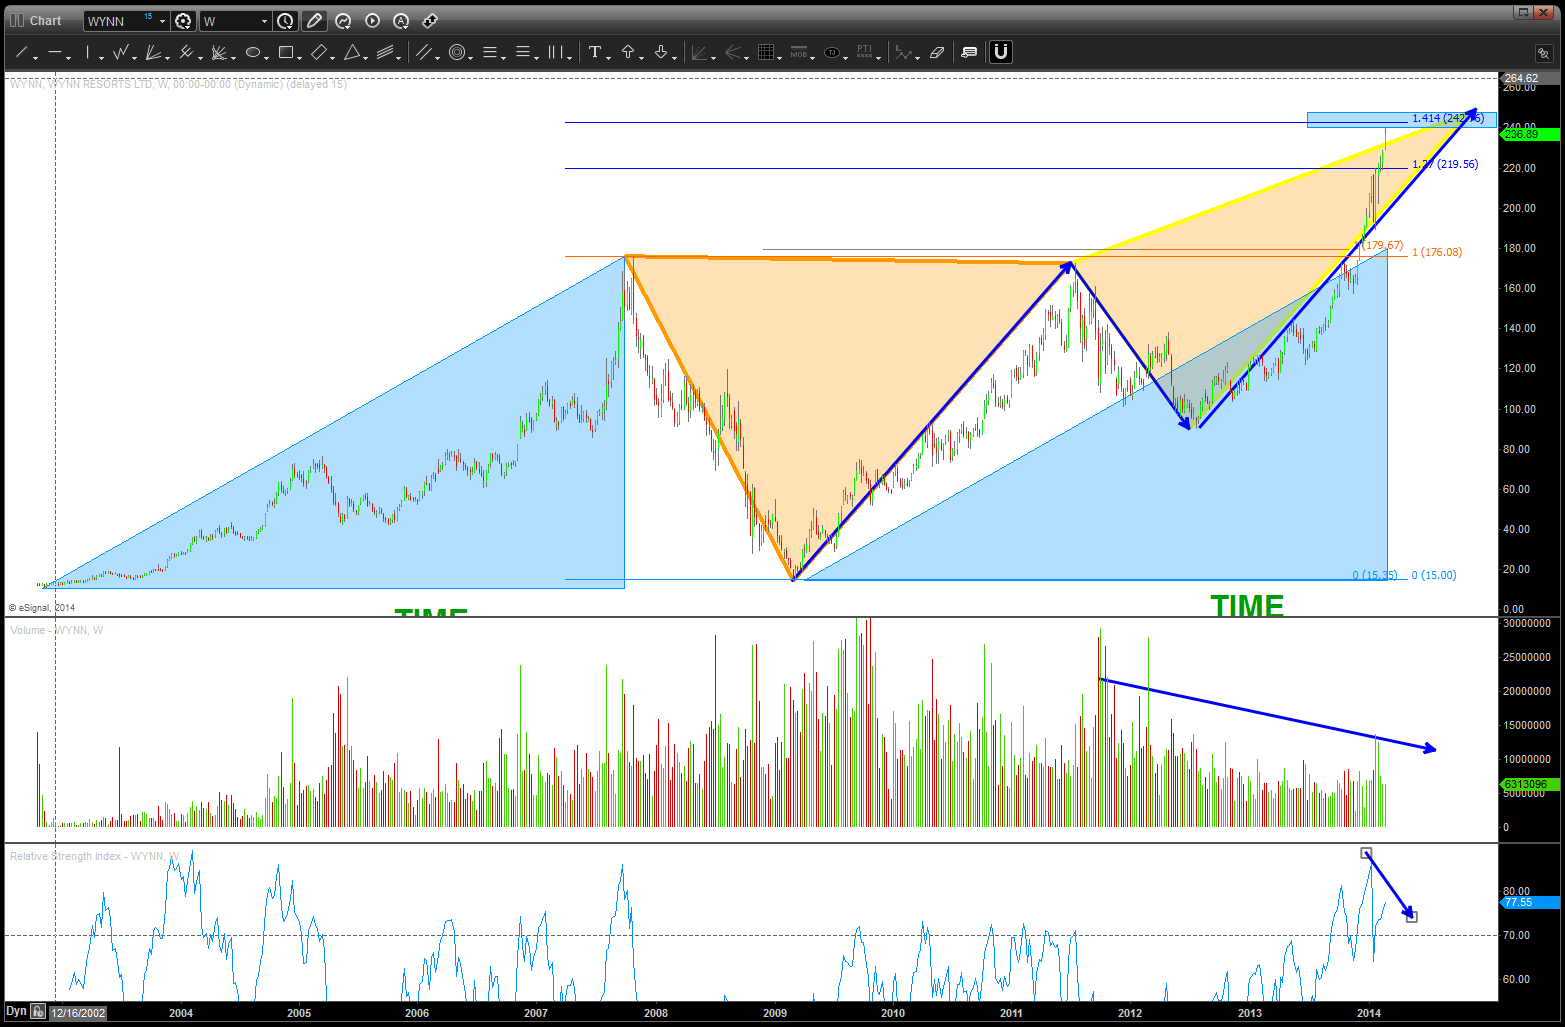
WYNN is at crucial support. Note, the highlighted blue areas were former resistance and we have found support in/around 175 as expected.
I am showing the post below for a couple reasons:
- NOTE, we tried in/around this area once the pattern had completed from the IPO. THE PATTERN FAILED … so, w/ sound money management a loss was taken.
- After that, another alternate target was found w/ very nice price and time symmetry and it has worked.
- WE DO NOT KNOW WHICH PATTERNS WILL WORK but WE DO KNOW THEY GIVE US AN EDGE!
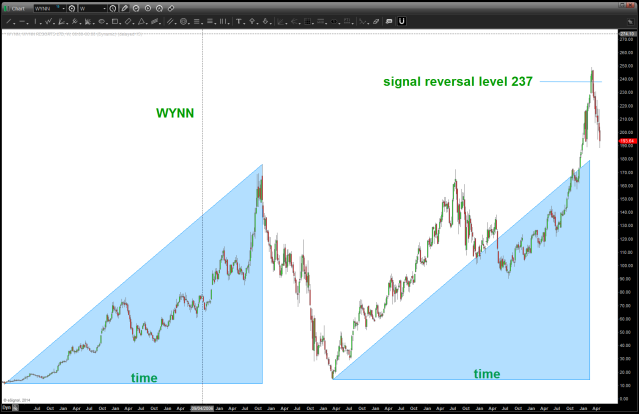
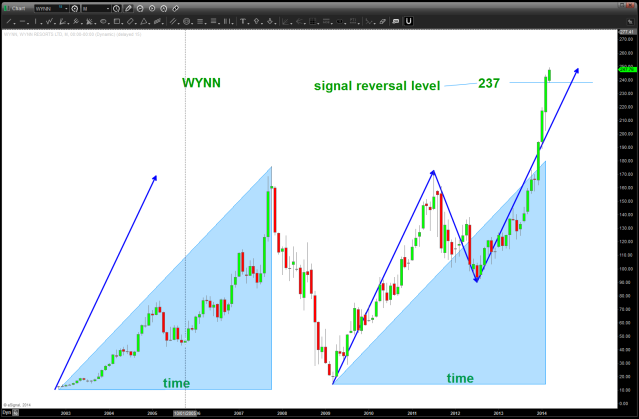
Here’s a set of charts on WYNN that show the swings …
WYNN polarity
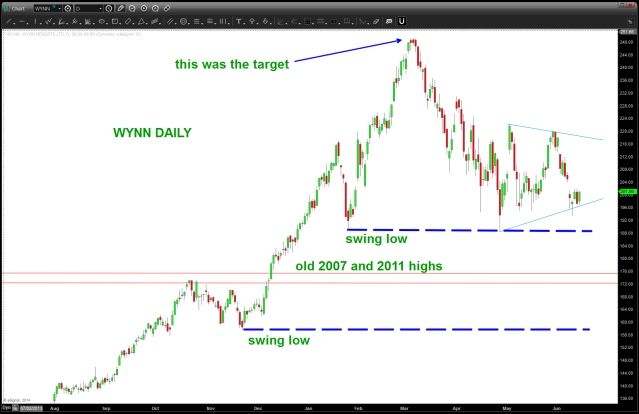
if we lose this level to the downside, then this is a big deal.
rock on, ok?
Bart
CLIFF NOTES:
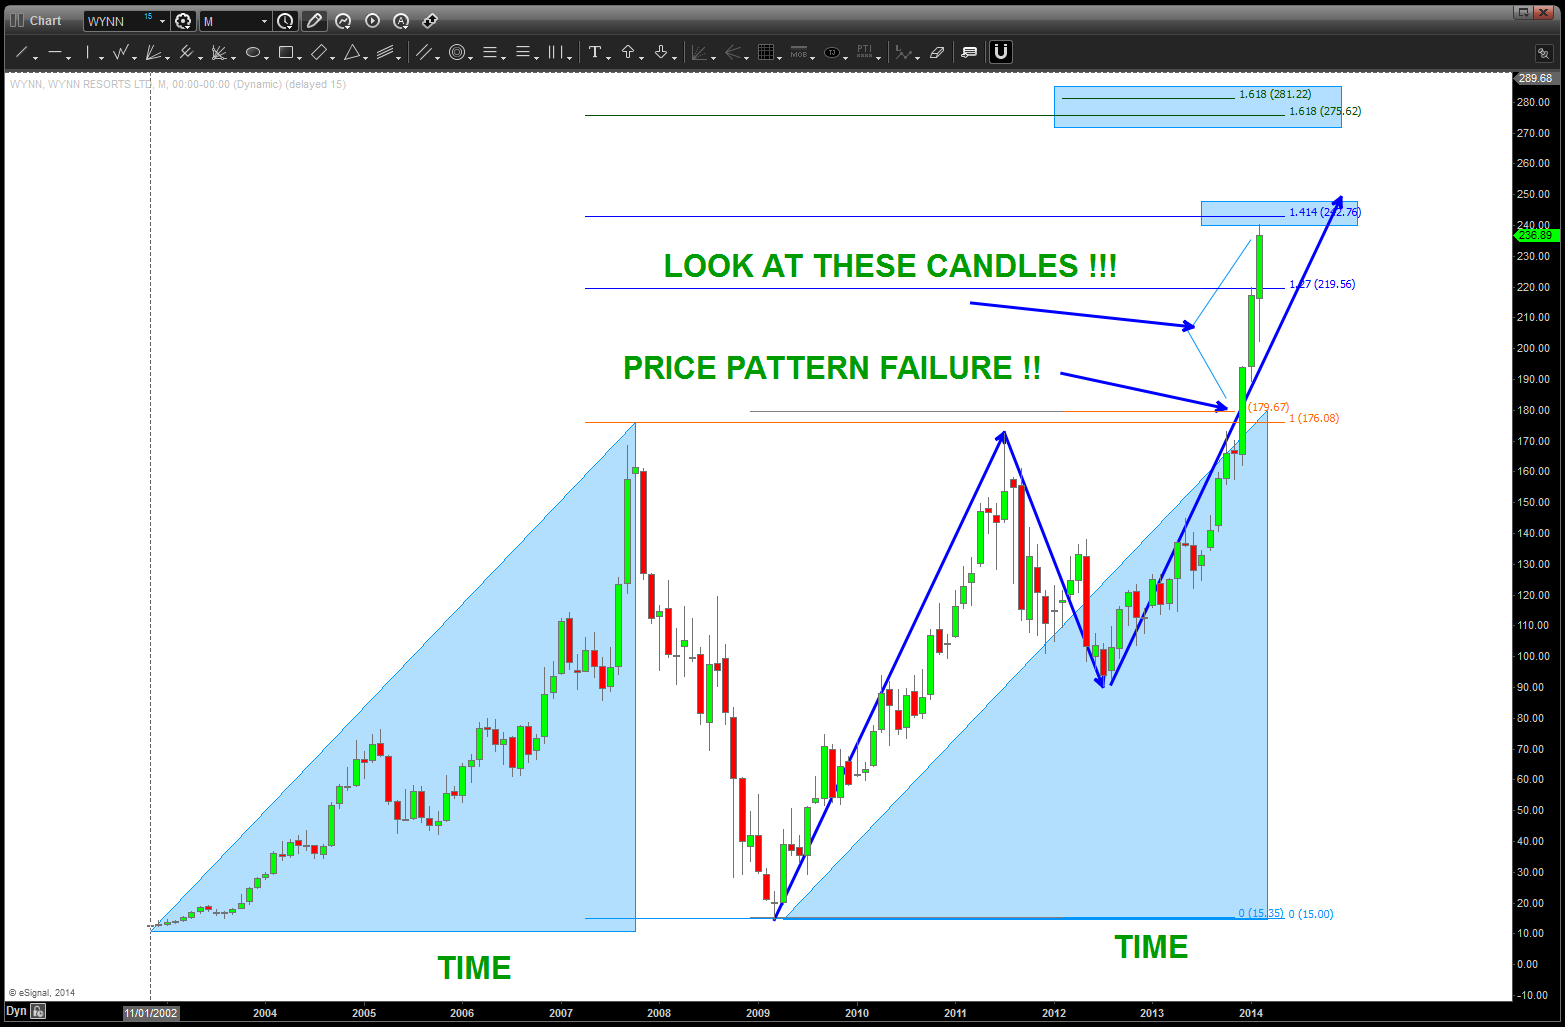
- the PATTERN from the IPO was crushed….
- recent 3 month candles are HUGE!
- the patterns shown are BEARISH.
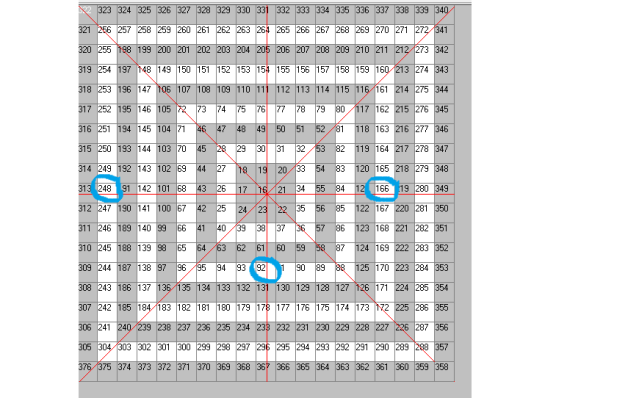
- FOR MY FELLOW CHART PEOPLE: the PATTERN in price was defeated, however, the PATTERN in time is MARCH. We’ll know…soon what will happen.
- THESIS: IF WYNN keeps going HIGHER so will the stock market (bullish) HOWEVER, if people are BUYING a company that makes its living on speculation, tourism and “it didn’t happen here” Vegas — then isn’t it a contrarian indicator that this ENTIRE rally since 2009 is a house of cards? We will find out — soon.
WYNN “slaughtered” the PATTERN at/around 180 w/ a vengeance …. KABOOM!
Folks, it didn’t even whimper at a pattern that had it’s genesis from WYNN’s IPO …
So .. I asked myself, what the heck does WYNN do? Here’s the summary of the stock that people are buying:
“Wynn Resorts Ltd. develops, owns and operates destination casino resorts. The company operates through two segments: Las Vegas Operations and Macau Operations. The company provides hotel rooms and suites; table games; slot machines; a race and sports book; and a poker room of casino gaming space, including a sky casino and private gaming salons; casual and fine dining in food and beverage outlets; spas and salons; lounges; and boutiques. “
Full disclosure — I have stayed at the WYNN and, well, it’s amazing … if you get the chance, spend the extra bucks and do it. Well done, amazing service, first class! So, here’s the rub. WYNN, no matter how much net worth you have, is a choice and the last 3 months candles are the STRONGEST in the history of this stock. So, again, what am I missing? Sure doesn’t feel like the roaring 20’s right now or even the euphoria rolling into 2000.
Folks, this defies convention … when this puppy is hit by Sir Issac Newton, watch out below ….
WYNN … seriously?
IWM today PRICE equals TIME
Posted on October 3, 2014 2 Comments
would like the market to rally into October 8, 2014.
recommend wait on IWM … if your a perma BULL this was a fantastic area to get long based on the PERFECT PATTERN.

PRICE = TIME on IWM
JPM Voo Doo
Posted on October 3, 2014 Leave a Comment
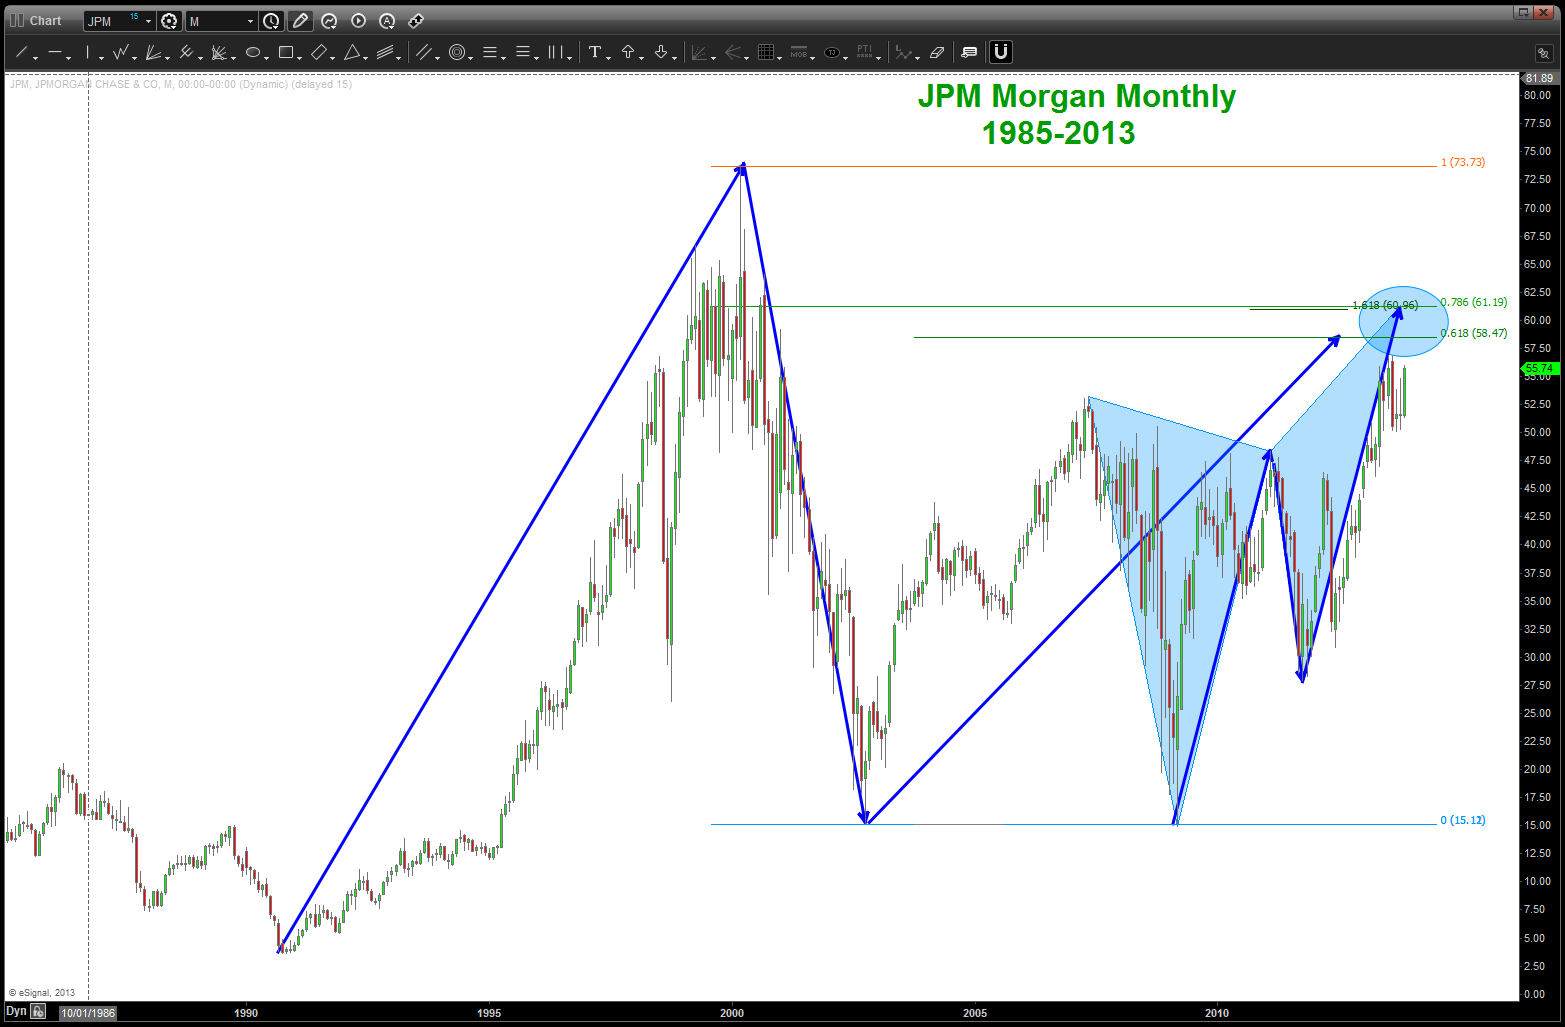
Folks, almost a year ago this pattern was ID’d on JPM … pretty crazy hugh? here’s the updated chart – pattern appears to be hanging in there. any daily close above, say, 63 would be a pattern failure IMHO.
again, before hitting the sack, it simply amazes me that I can sit here in my home office w/ a computer drawing lines and come up w/ a NUMBER that the market will respect. Just checked and the average daily trading volume is roughly 10MM shares a day. folks, I don’t know but that’s a lot of shares …
so, for whatever reason, way before it ever got to the NUMBER 61, a simple PATTERN RECOGNITION dude ID’d the pattern and pointed it out ….
whomever is BUYING or SELLING those 10MM+ shares/day decided to stop BUYING at/around that EXACT number …
yup, pure VOO DOO …
let me know if you want to push the I believe button ….
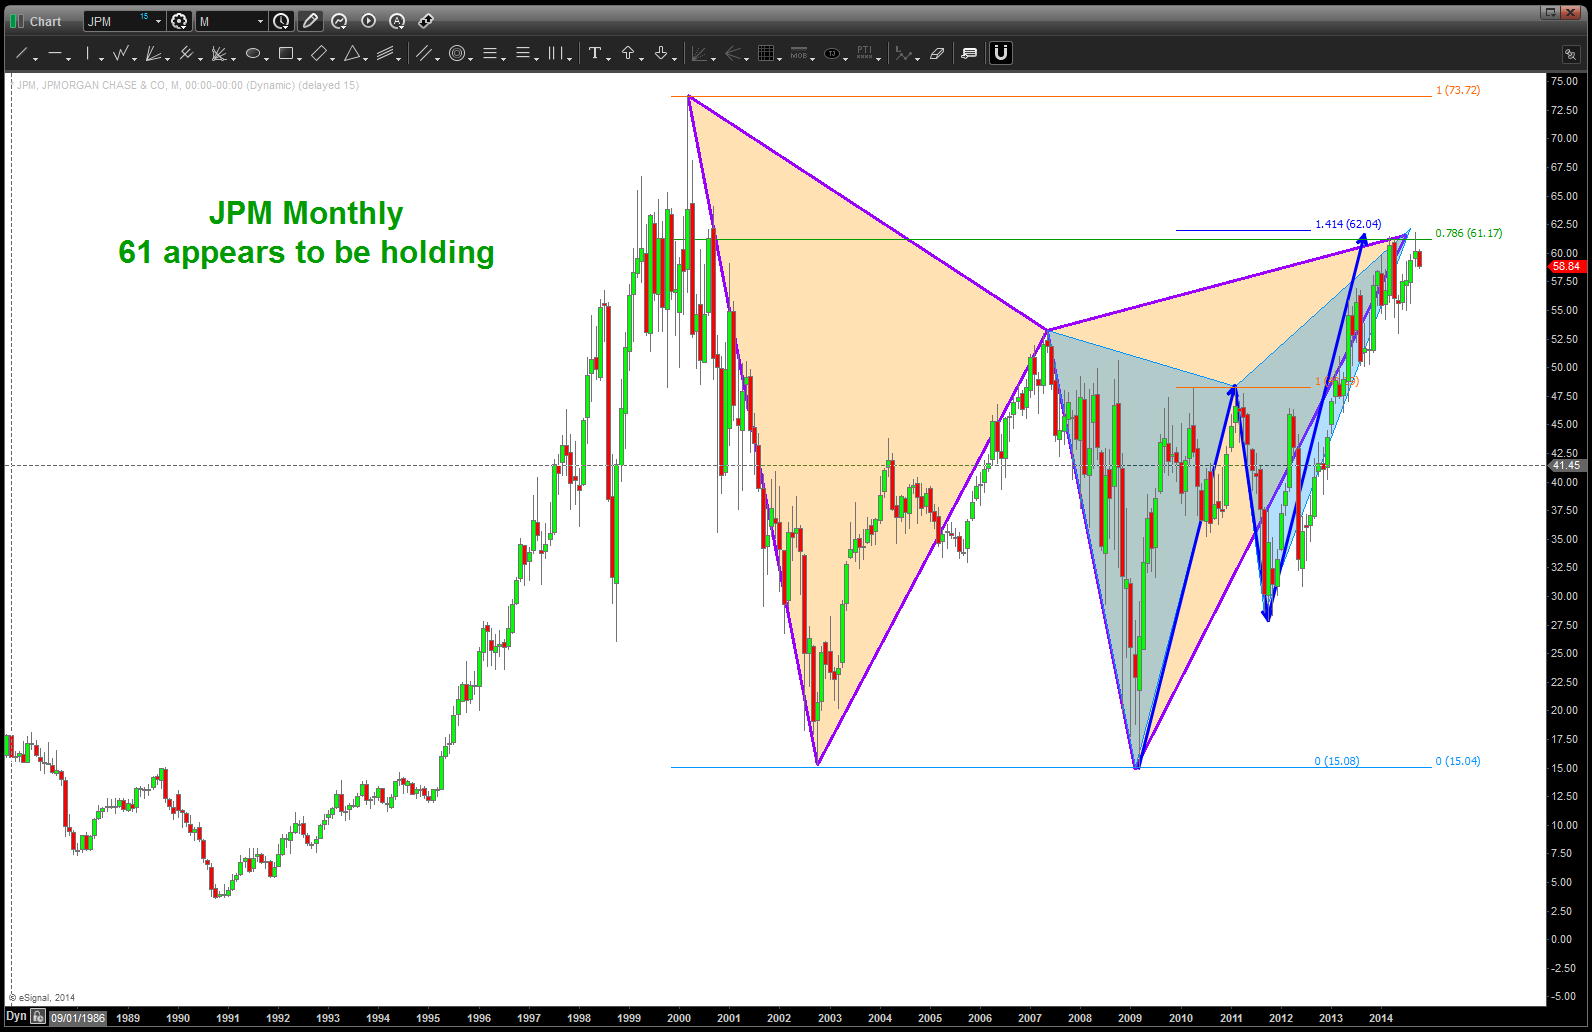
JPM P A T T E R N hanging in there …
one last chart .. actually presented this chart at the MTA’s annual symposium and it’s the EXACT LOW (real time) of the JPM low in 2009.
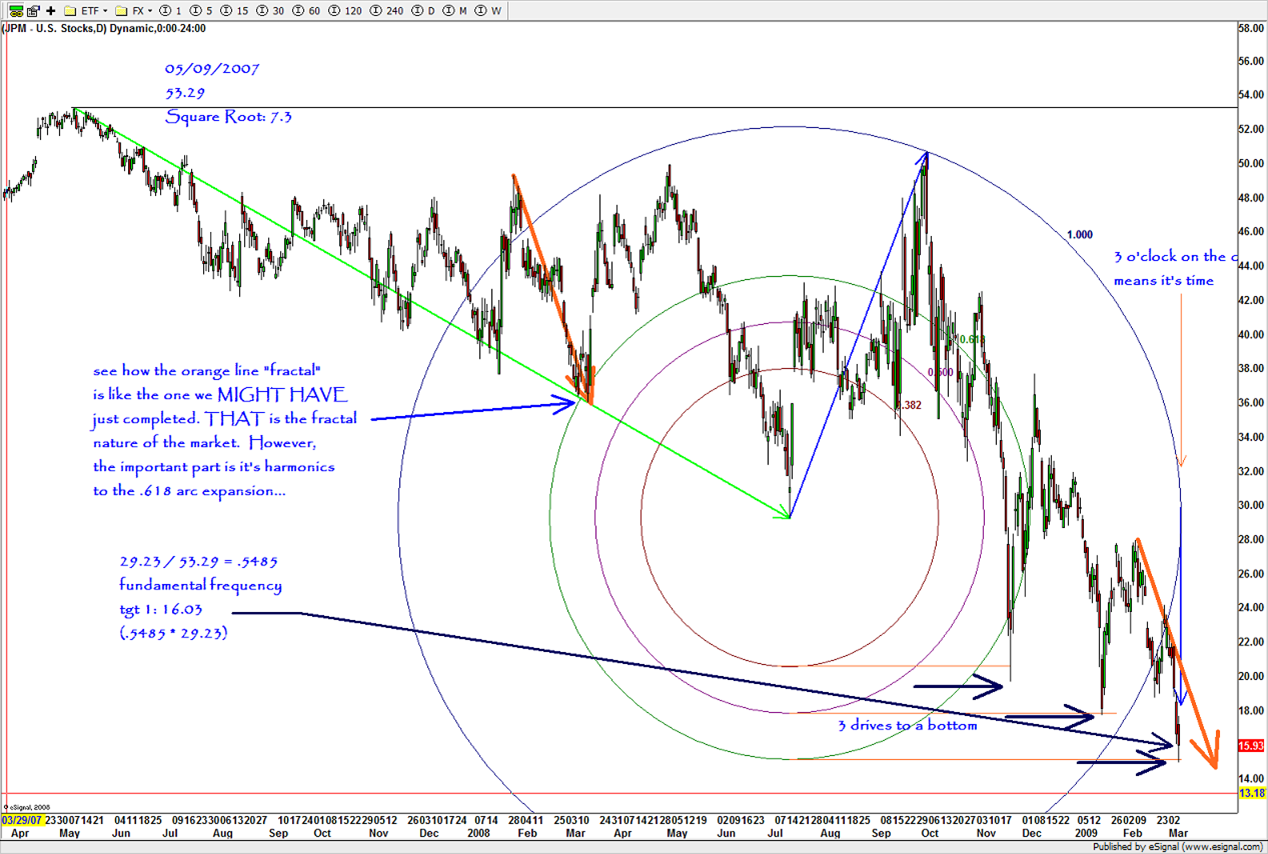
chart presented at MTA
11/19/2013
JPM sell pattern
Crude Oil … a potential roadmap
Posted on October 2, 2014 Leave a Comment
10/2/2014: we are at a very crucial junction w/ regards to Crude Oil. the big picture is resolving and, quite frankly, I’m not sure which BIG directional move to favor so i’m just going to TRUST the PATTERN that might have completed today. There’s an interpretation on IF the patterns works AND if the pattern doesn’t work but either way, believe we have a “line in the sand” so to speak from which to draw our conclusions and watch for confirmation in any direction. That’s why we are technicians – let PRICE and TIME be our guide.
today we have a very nice 3 drives to a bottom w/ a butterfly pattern that hit almost exactly and a rather nice INTRADAY pattern completed. we DO NOT have a DAILY signal reversal candle. that will not happen until we CLOSE above 93 on a daily basis. here’s the chart:
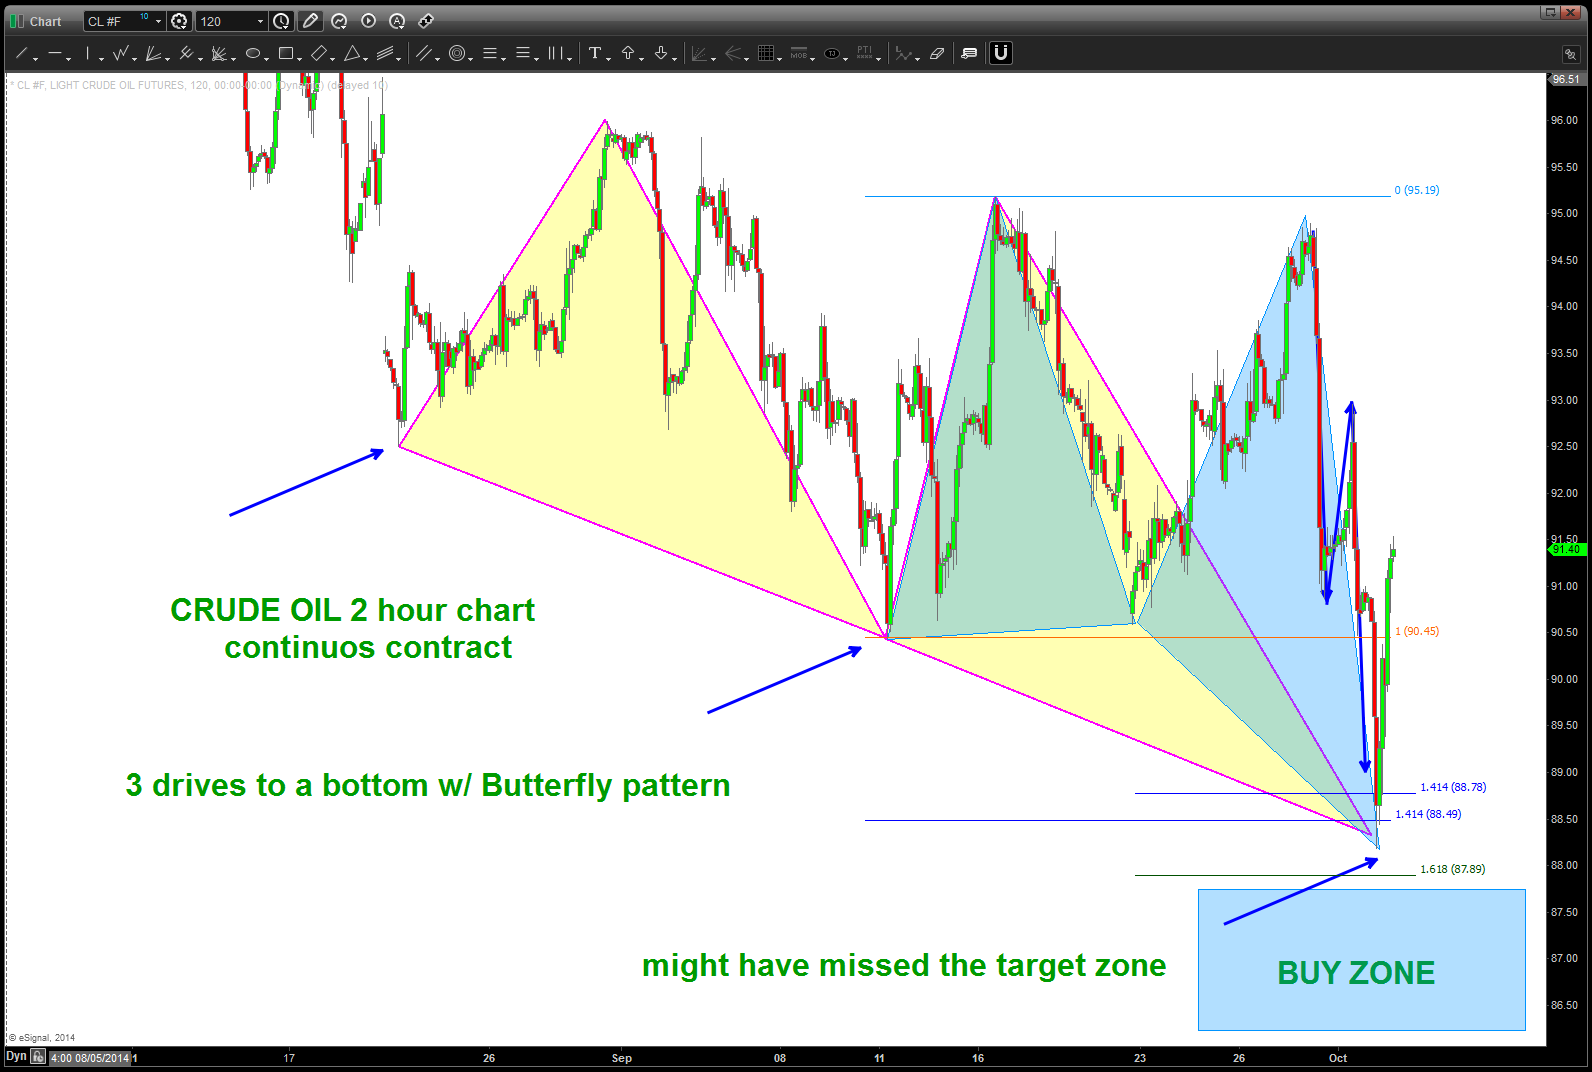
Crude Oil Intraday Patterns completing
as you can see it didn’t go all the way into our BUY ZONE so it still “might” fail into that area but based on today’s action …. not sure the probability is in our favor. here’s the math behind the daily set-up:
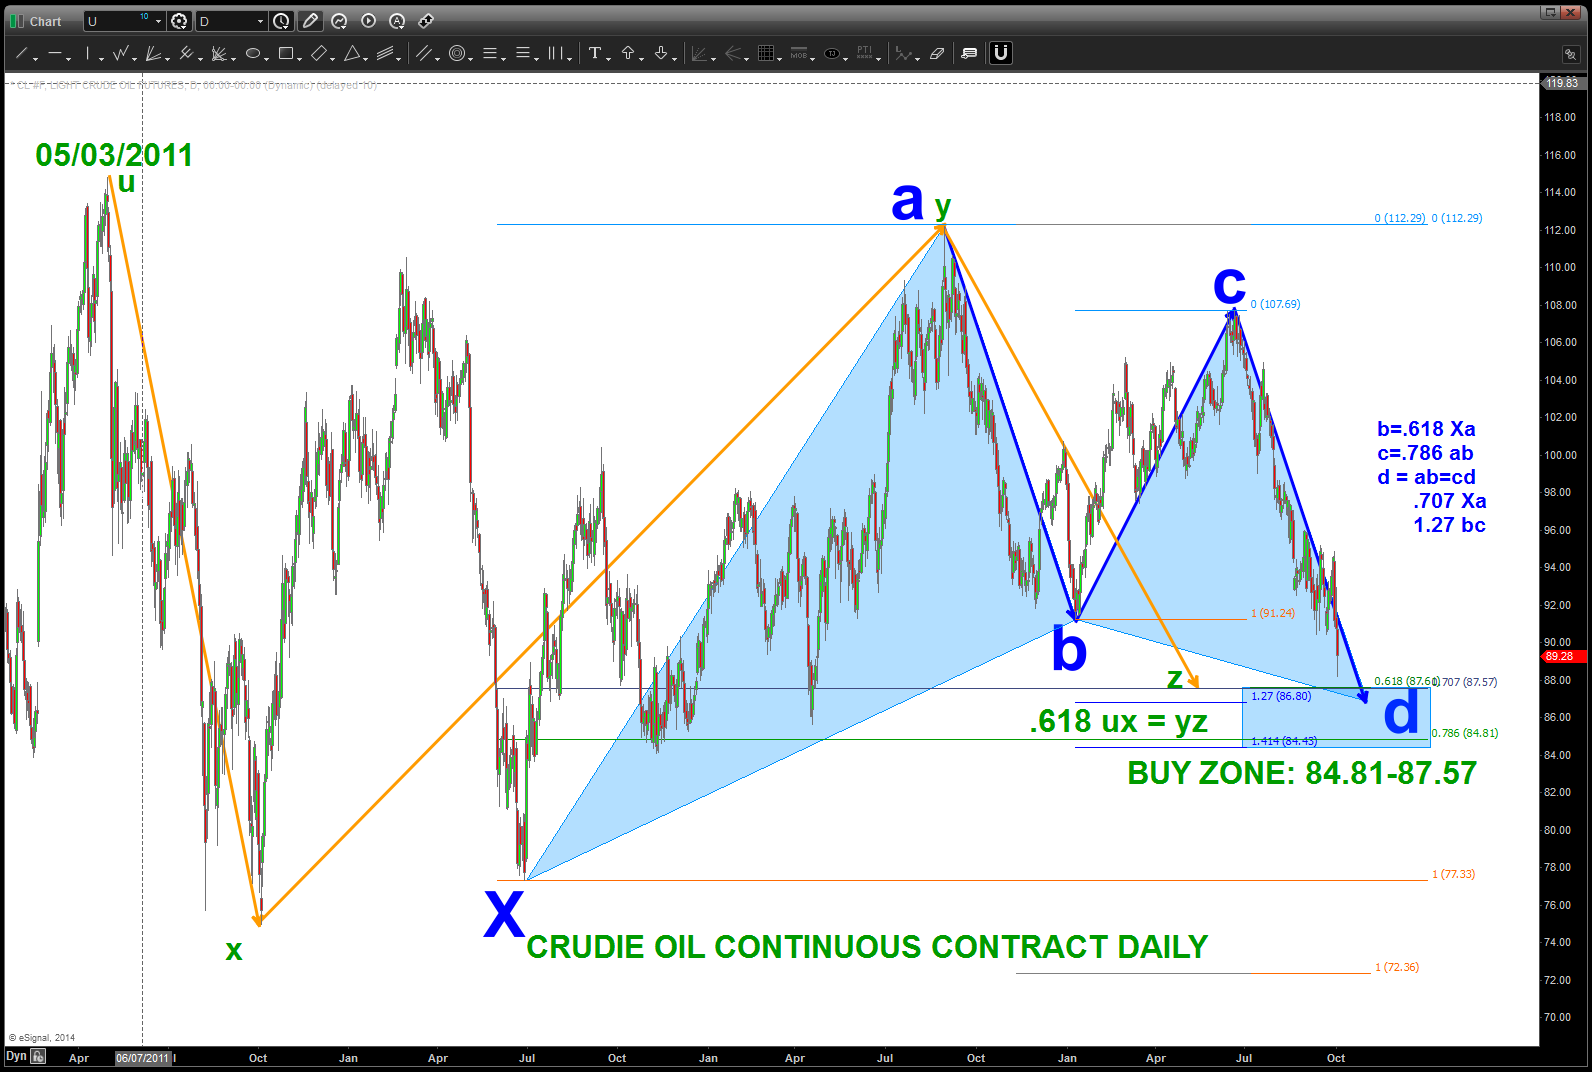
Crude Oil Daily Pattern
w/ those patterns as our backdrop why is the area we are in “now” such a big deal? well, for those of you trained in Elliott Wave theory we are finishing the 5th wave of contracting price action. that contraction is “usually” named a triangle and can be labeled a,b,c,d,e. In the context of the BIG PICTURE this level is EXTREMELY IMPORTANT because it’s my conjecture that from this area we are either going to 1) move to new highs to ultimately attack 200 OR 2) crash and burn into the low 20’s. YUP … that’s what I’m saying and based on longer term patterns, that’s what the picture presents.
here’s the long term play for both the bulls and the bears. I will present each chart and then provide some commentary …
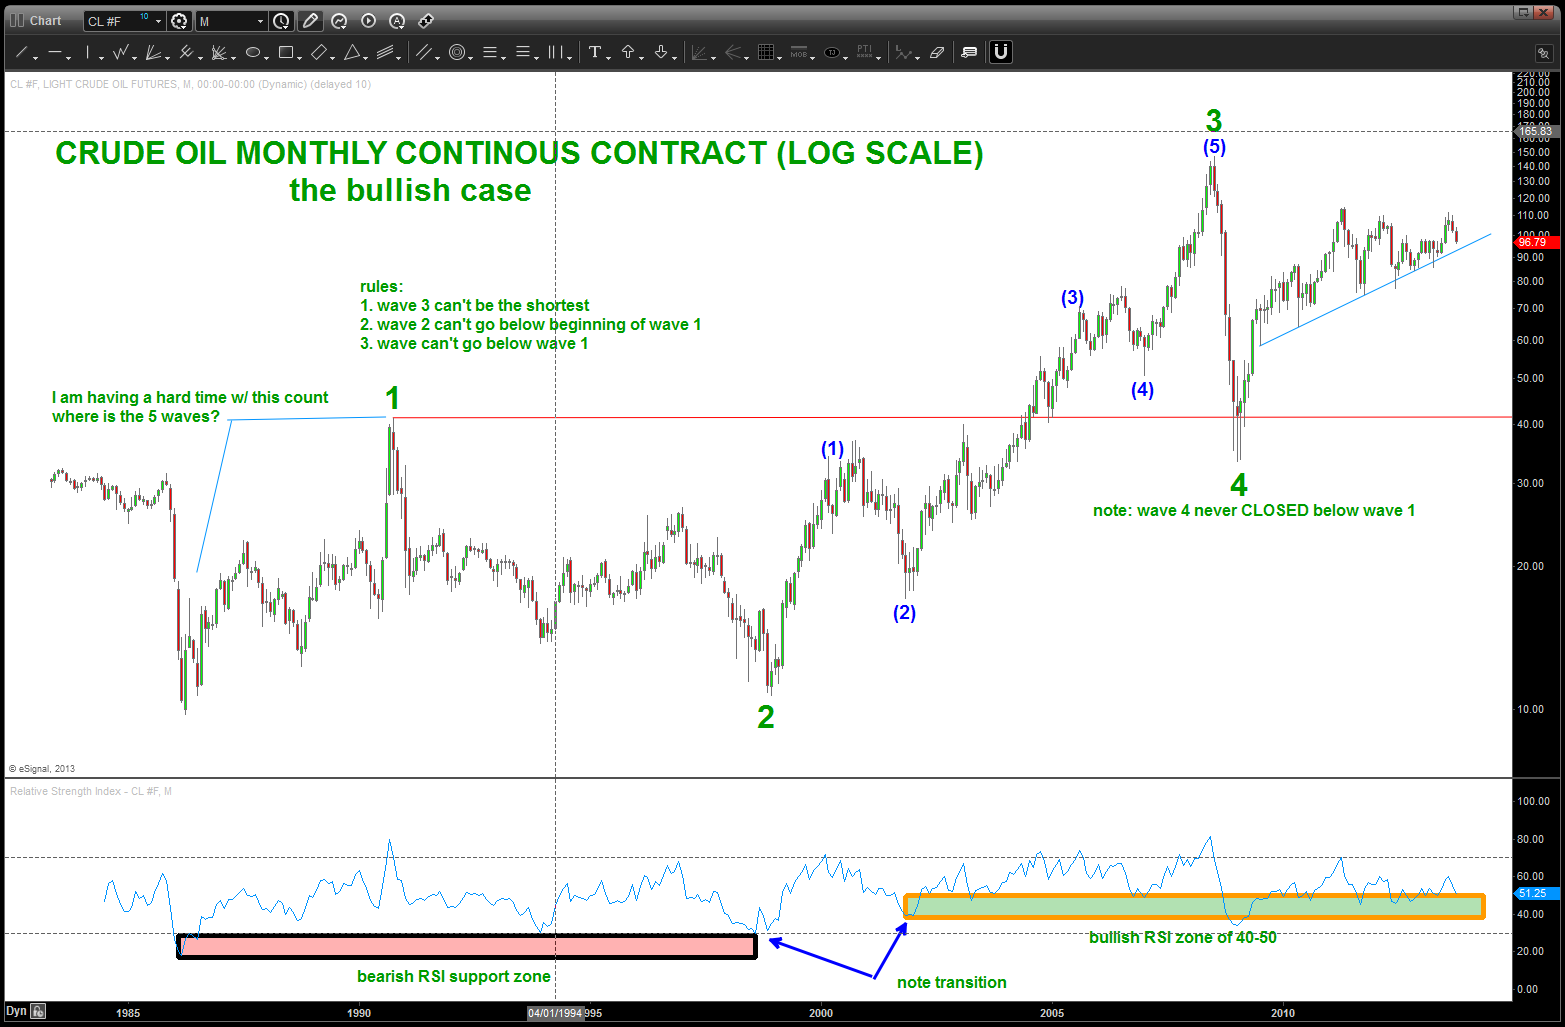
THE BULL CASE:
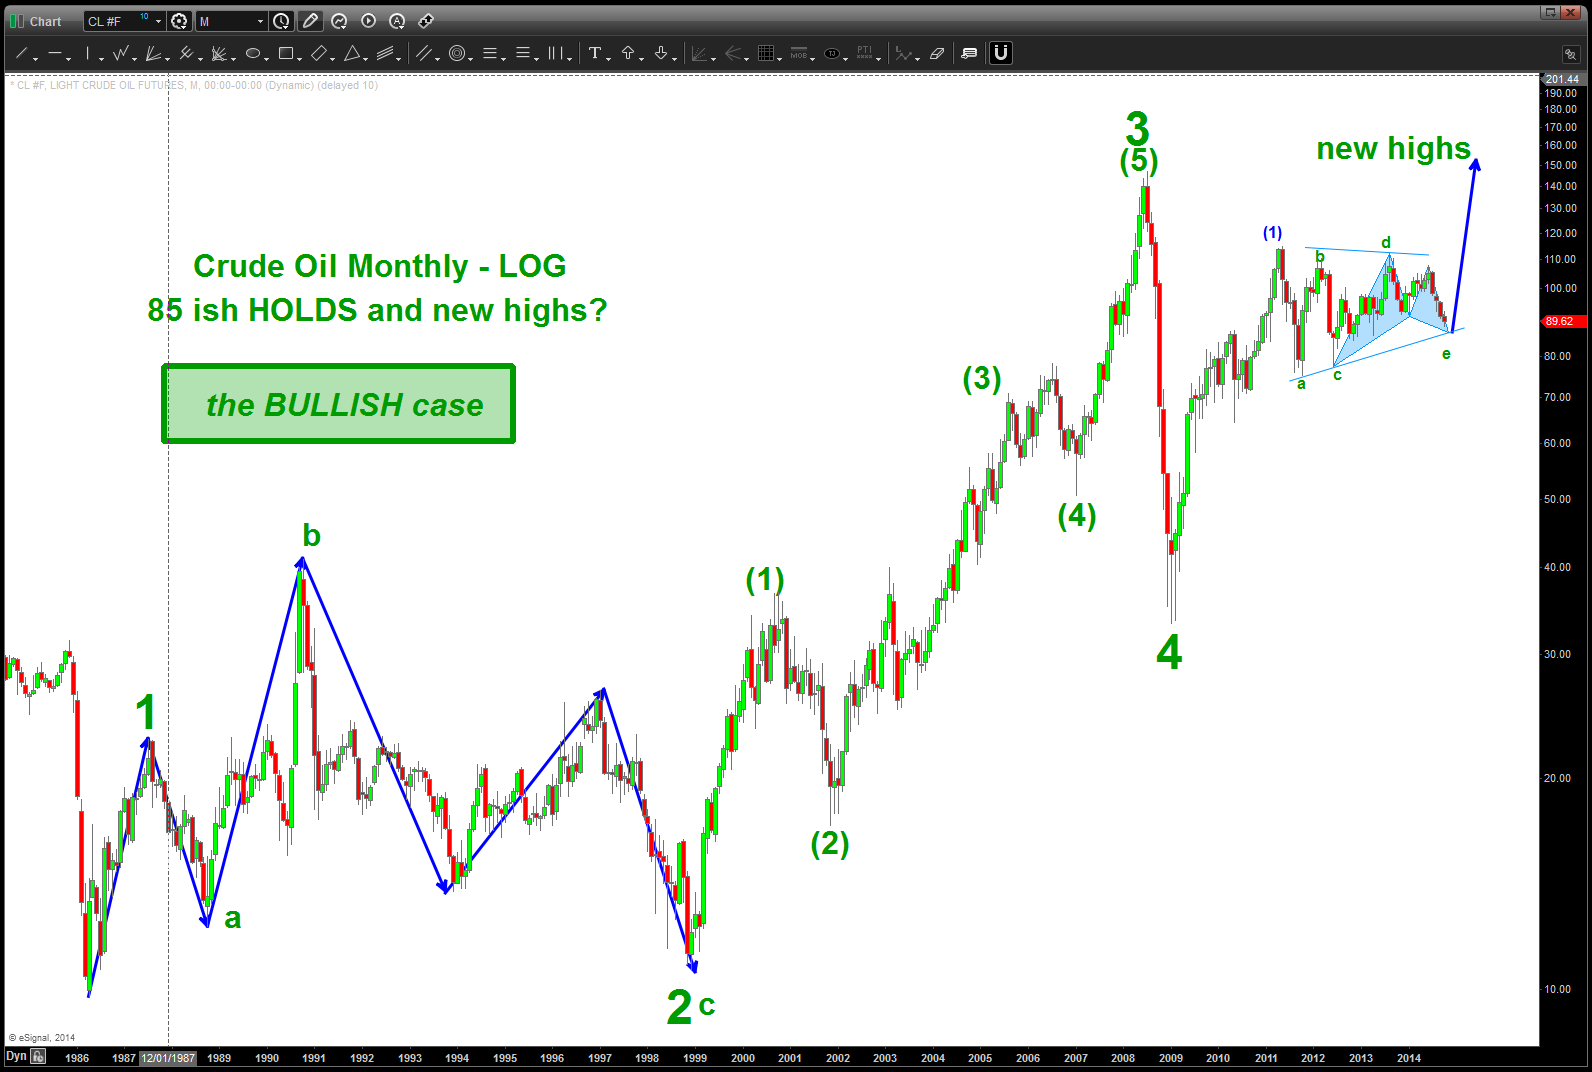
Crude Oil the BULL case)
Here’s what we know:
- using LOG scale helps see the moves move clearly. this is a log scale of the crud oil monthly continuous contract
- the move from 10-149 was a clear 5 waves UP.
- the correction labeled 4 DID NOT go below 1
- 3 is not the shortest
- 2 does not go below the beginning of 1
- folks, that’s a valid count.
- now, what I don’t like is the TIME distance of the c-d leg of the triangle. it just doesn’t “look and feel” right ….
- so, on the BULLISH side of the house we have a BULLISH buy PATTERN that completed today or a little lower that represents the end of a triangle (e)
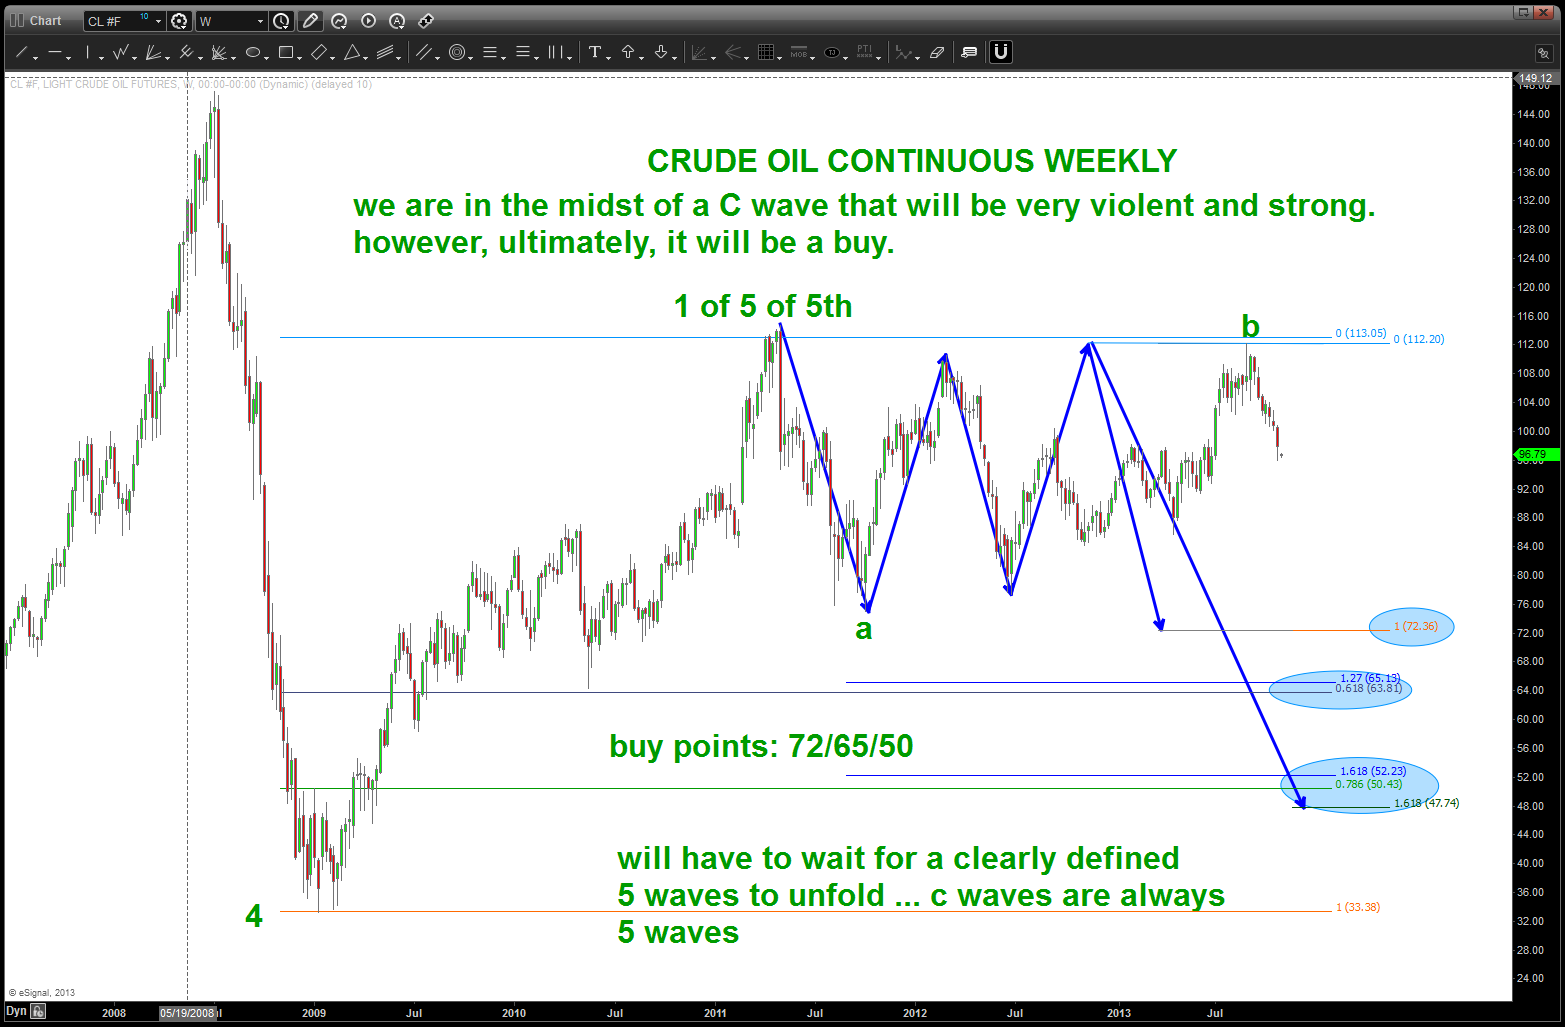
THE BEAR CASE:
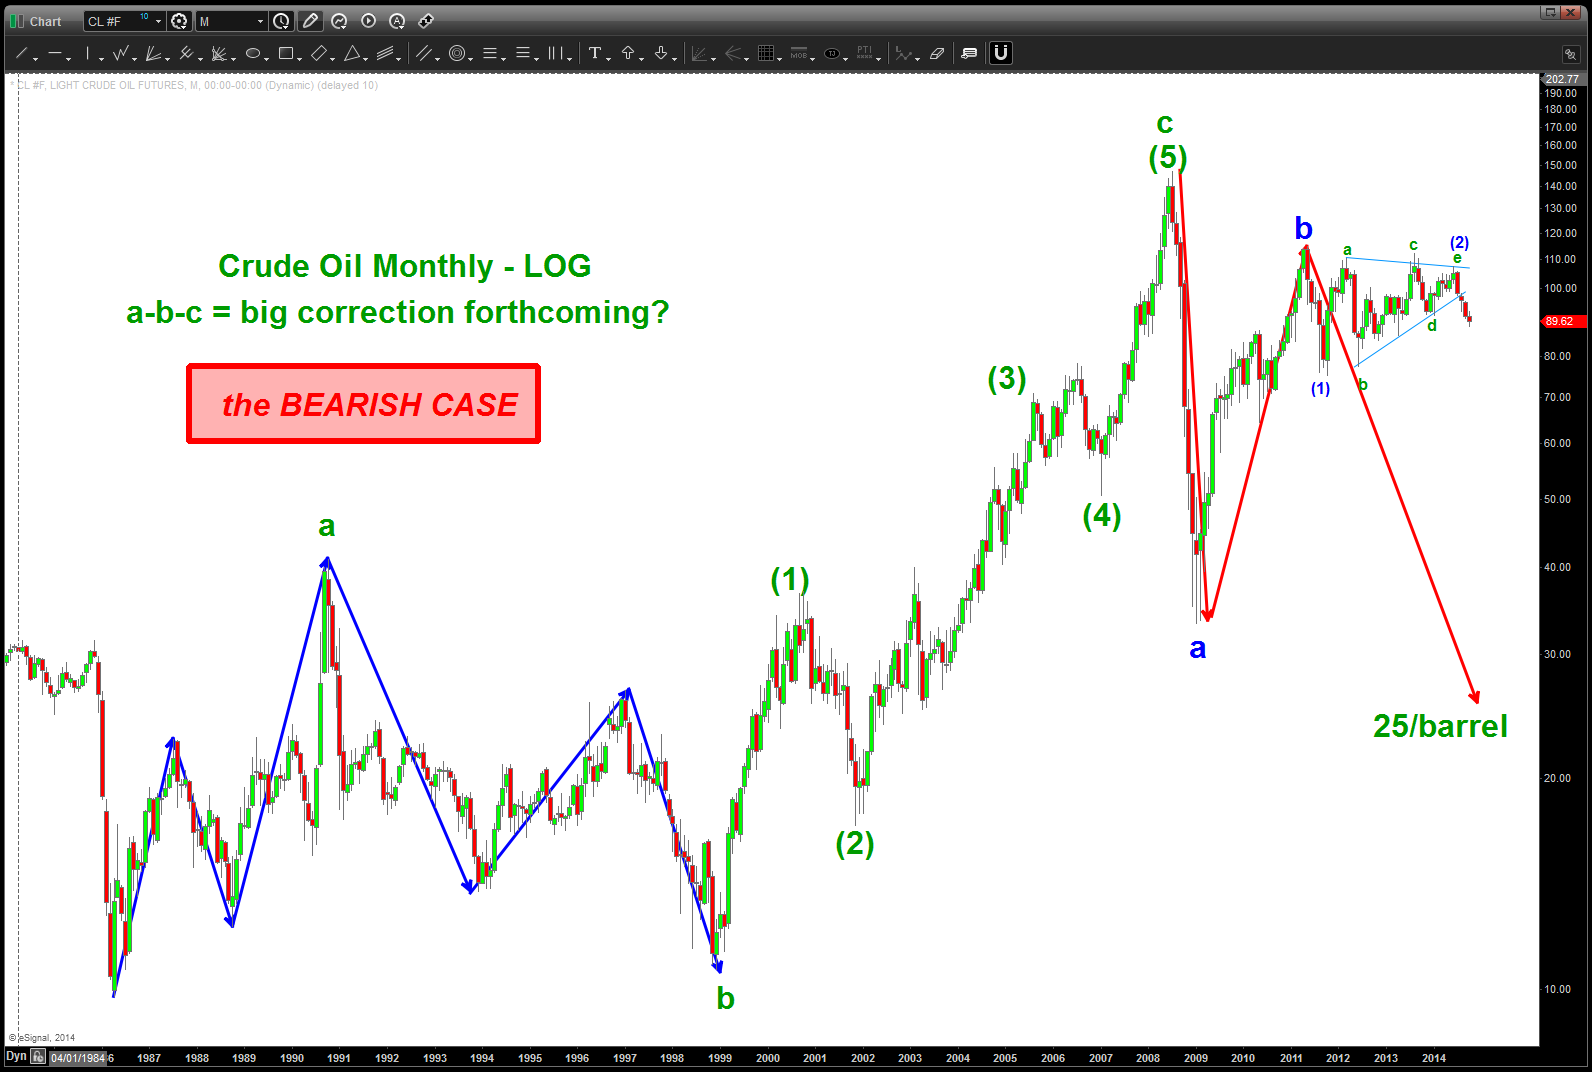
CRUDE the BEAR CASE
Here’s what we know:
- using LOG scale helps see the moves move clearly. this is a log scale of the crud oil monthly continuous contract
- the move up from 10-49 was a clear 5 waves UP
- the primary a and b waves are 3 waves and the c wave is 5
- folks that’s a valid count
- the triangle sure looks better from a look and feel perspective ….
- for a to equal c (doesn’t have to but usually does) this move down could reach all the way down to 25/barrel.
one last, here’s a chart of the XLE / SPY. we just broke some crucial trend line support … hmmmm
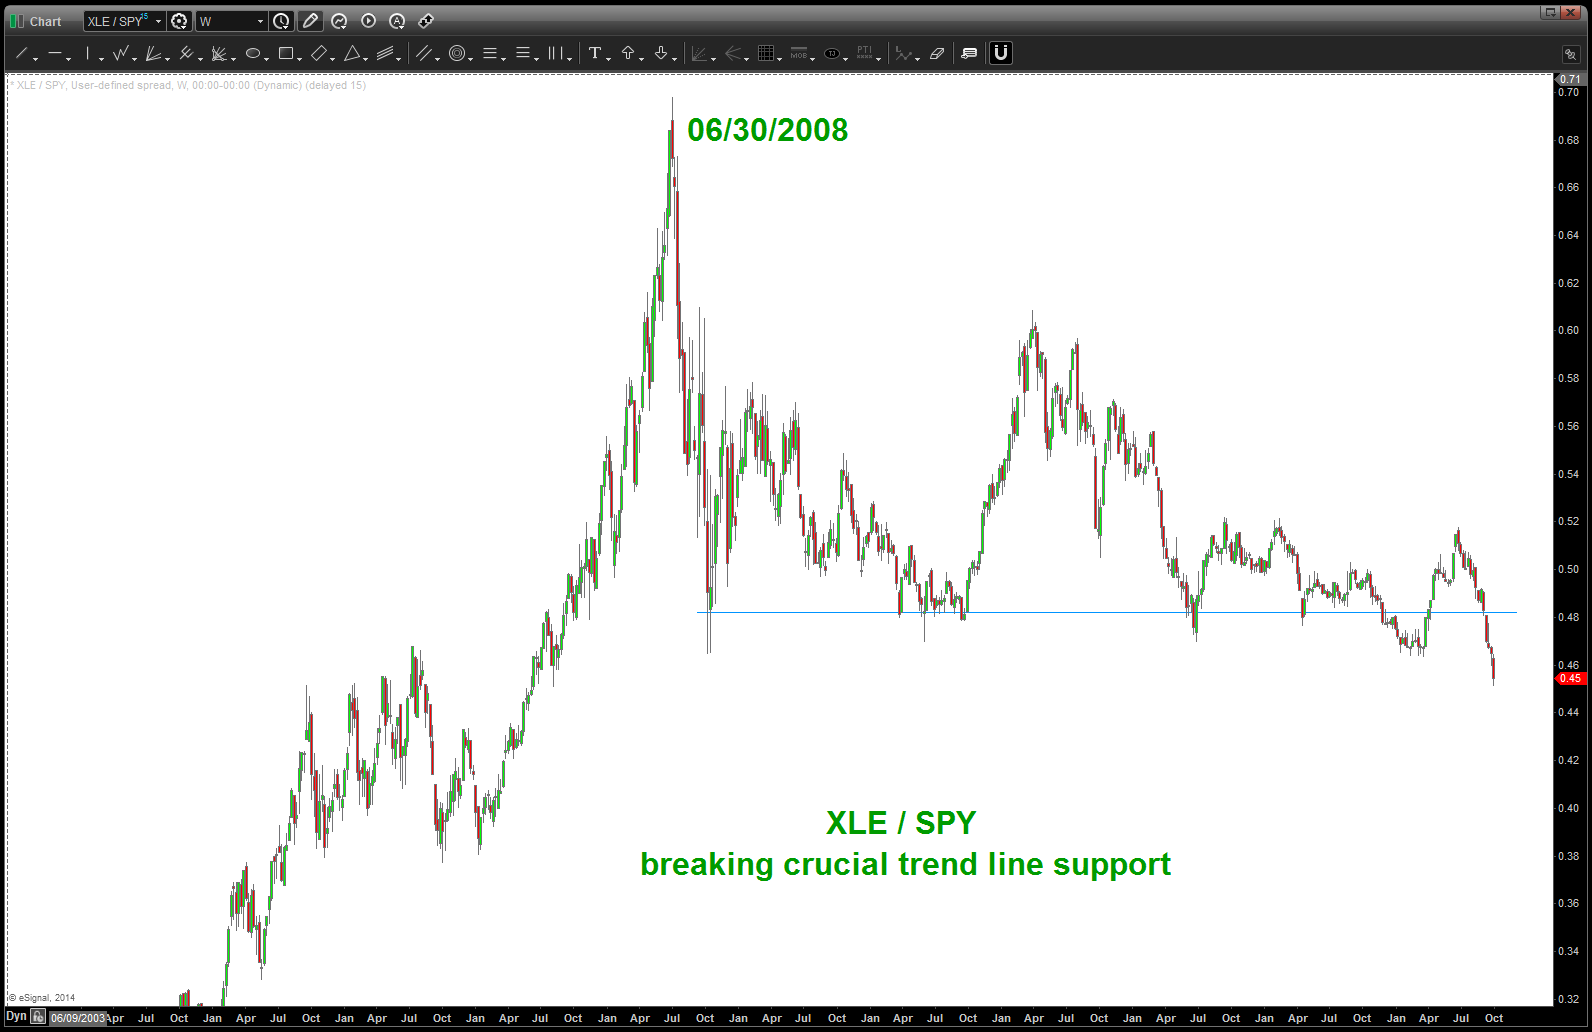
XLE / SPY
wish I had longer chart data as that might help resolve the conflict on the bullish vs bearish case. right now … well, we have a pattern that has been hit or about to be hit and, well, let’s see if it works or not. I HAVE NO IDEA OR OPINION EITHER WAY … but it will help provide a road map once it resolves and that’s kind of cool, I think (?)
rock on, ok?
voo doo man out — B
10/31/2013: I enjoy this chart, not only for the amazing dynamics of the math and harmony but … I’ll tell you in a minute
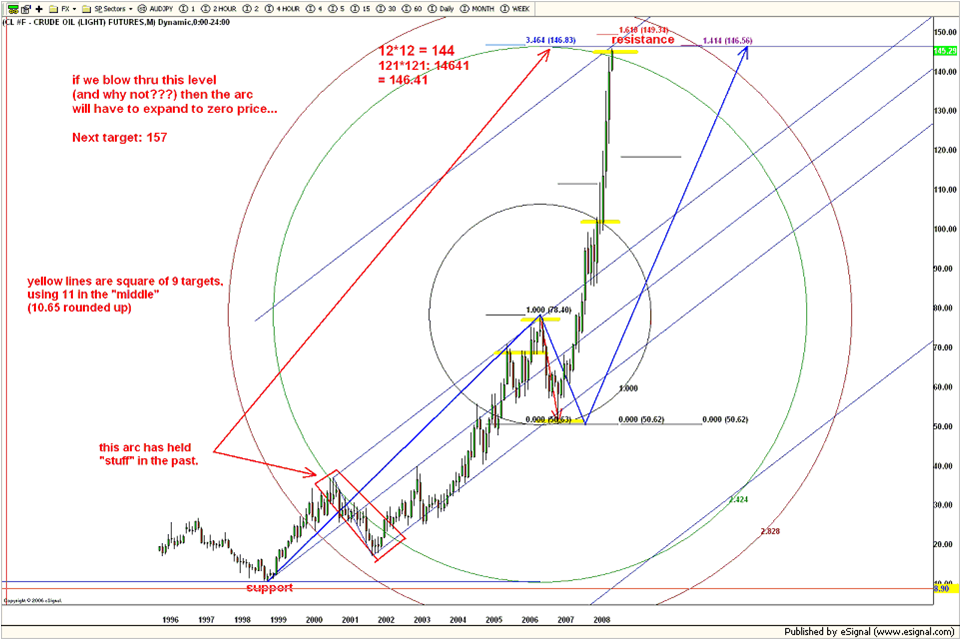
Exact high on crude oil …
here’s why – it occurred on my birthday! 🙂 July 11, 2008 was the high on crude …
anyway, I have to admit that this scenario I am putting out on the blog is, perhaps crazy, but it’s an interpretation that you can pay attention to or not … the one thing I DO NOT LIKE is that first move up from one ….it sure looks like only 3 waves and, well, that can’t be right BUT in the context of the picture it fits so I am going w/ it. the other thing is wave 4 can’t overlap the end of wave 1 and well, technically, it does go threw there for a bunch of months but NEVER closes below so I’m working w/ that one also .. subjective interpretation so to speak.
so, below are the pictures that I”m working w/ … the thesis is we have a very powerful C wave in oil down that has just begun and one that will, ultimately need to bought – perhaps 6-9 months from now … enjoy.
a POTENTIAL count
do yourself a favor – push the I believe button! ($IWM)
Posted on October 1, 2014 Leave a Comment
10/1/2014: funny how it all works out … the below is copied from a post that I did on 10/21/2013 – a year ago. a PATTERN was appearing in the zone of 113-120 and it sure looked like a doozy. I wrote “or I’m going into gardening” because I was, honestly, laughed at for even thinking the almighty IWM would stop. well, news flash, I guess in the end the issue is I DO NOT THINK. I just point out PATTERNS and they work or they don’t …
so, anyway, I wish I could publish this anonymously because, well, I don’t want this to be about me making a good call or a bad call. spend some time on my site and you’ll see some AMAZING PATTERNS at work. have I DEFIED HUMAN NATURE and DONE THE WORK – yes. someone would say to an obsessive degree but if your going to go down the path of trusting the vibrations, music and PATTERNS to work and, as a technician TAKE EVERY INDICATOR OFF YOUR CHART then you better well darn understand the underlying thesis of why this works – works being defined as letting you manage risk. I do so that’s cool …
but again it’s about the PATTERNS …
so, I’m not trying to cause any issues or anything but can someone who is a fundamentalist please tell me how a 1.618 price projection and a 1.68179 extension and a bunch of numbers originating from 34 and being on the same axis caused EVERY high so far in the IWM? Or, just leave it to the standard answer Voo Doo.
Either way, here’s my challenge. If you are a fundamentalist, take a modicum of time and studying technical analysis. If your a technician looking to take it to the next level, give me a call or drop me a line. But first … take EVERYTHING off your chart and simply “trust” price and time and the fact they will make PATTERNS!
Here’s the updated chart …
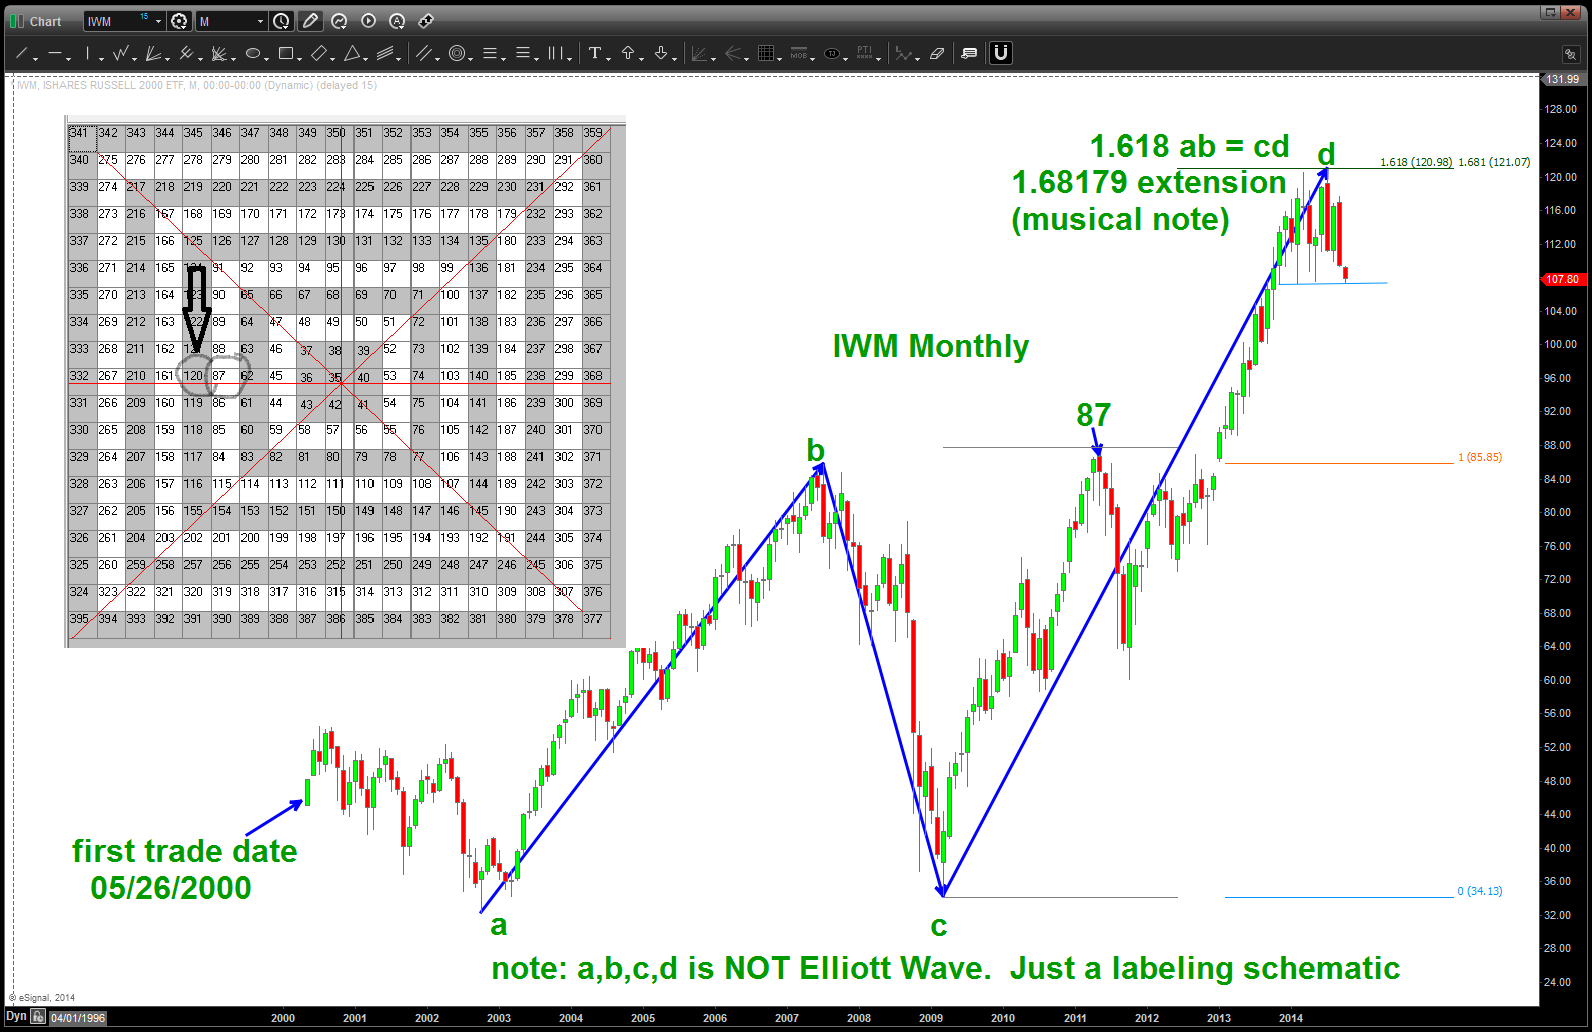
IWM
10/21/2013: the “zone” of 113-120 should be very strong if not the “top” for a while … if this pattern fails, I’m going into gardening.
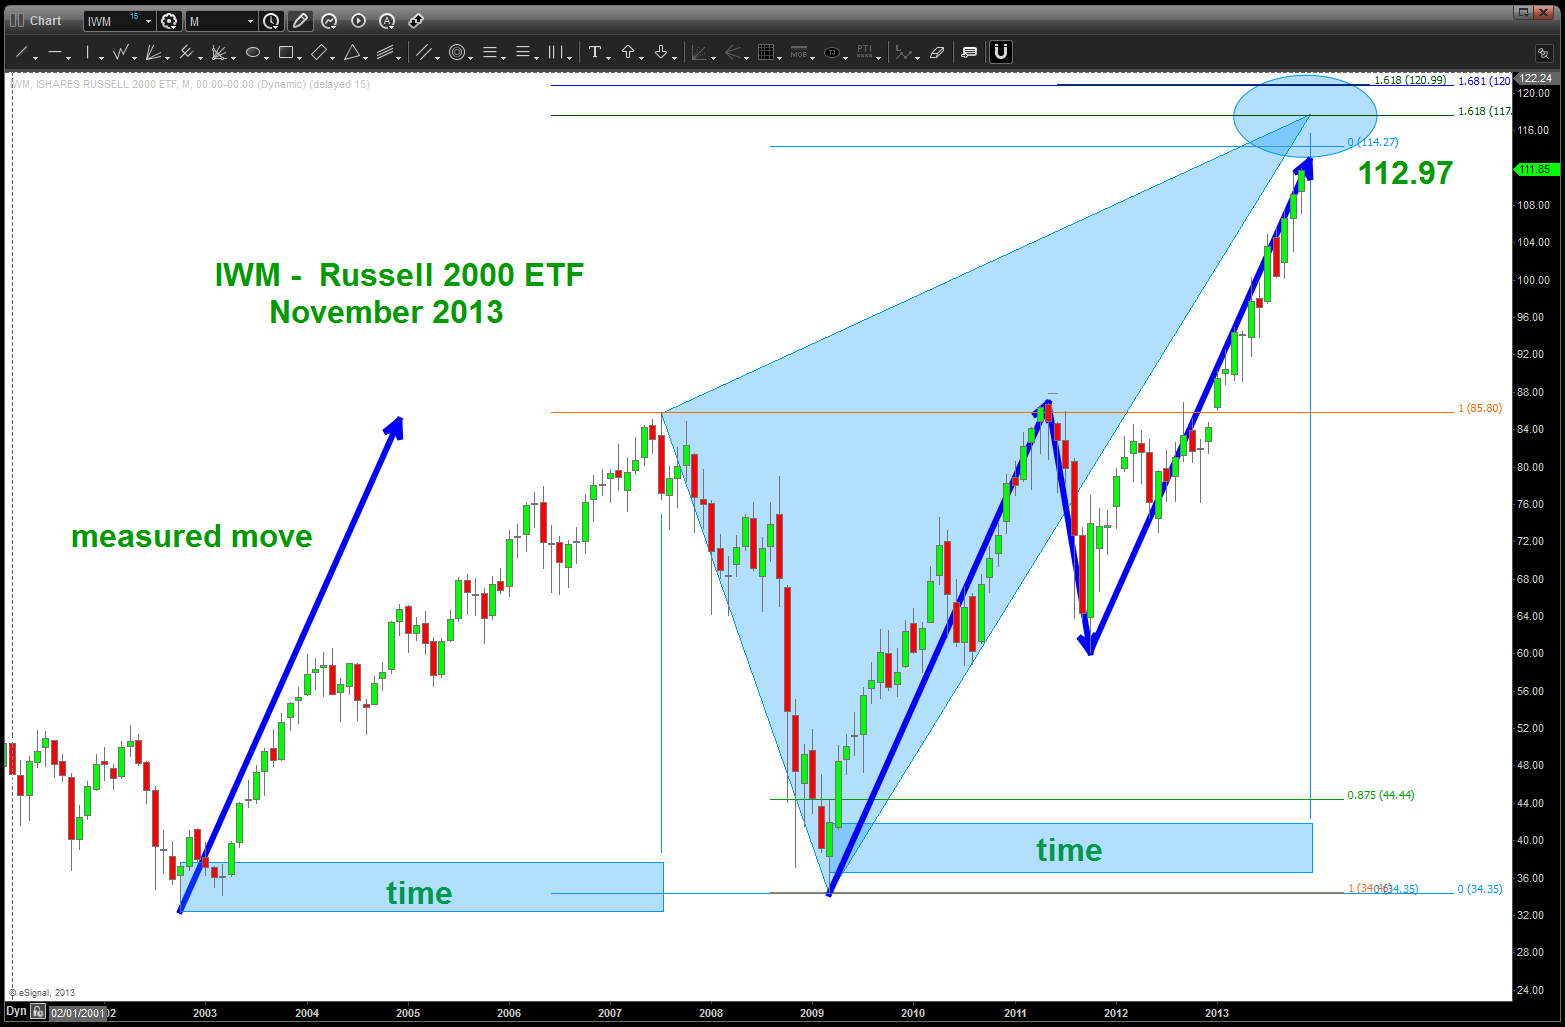
IWM
Let’s look at the LOONIE ..
Posted on September 30, 2014 Leave a Comment
we discussed the importance of the oil service index a while ago – https://bartscharts.com/2014/04/01/loonie-the-dollar-and-the-oil-services-index/ – w/ regards to the Loonie vs USD.
what we see happening now is an important level being hit on the Oil Services Index:
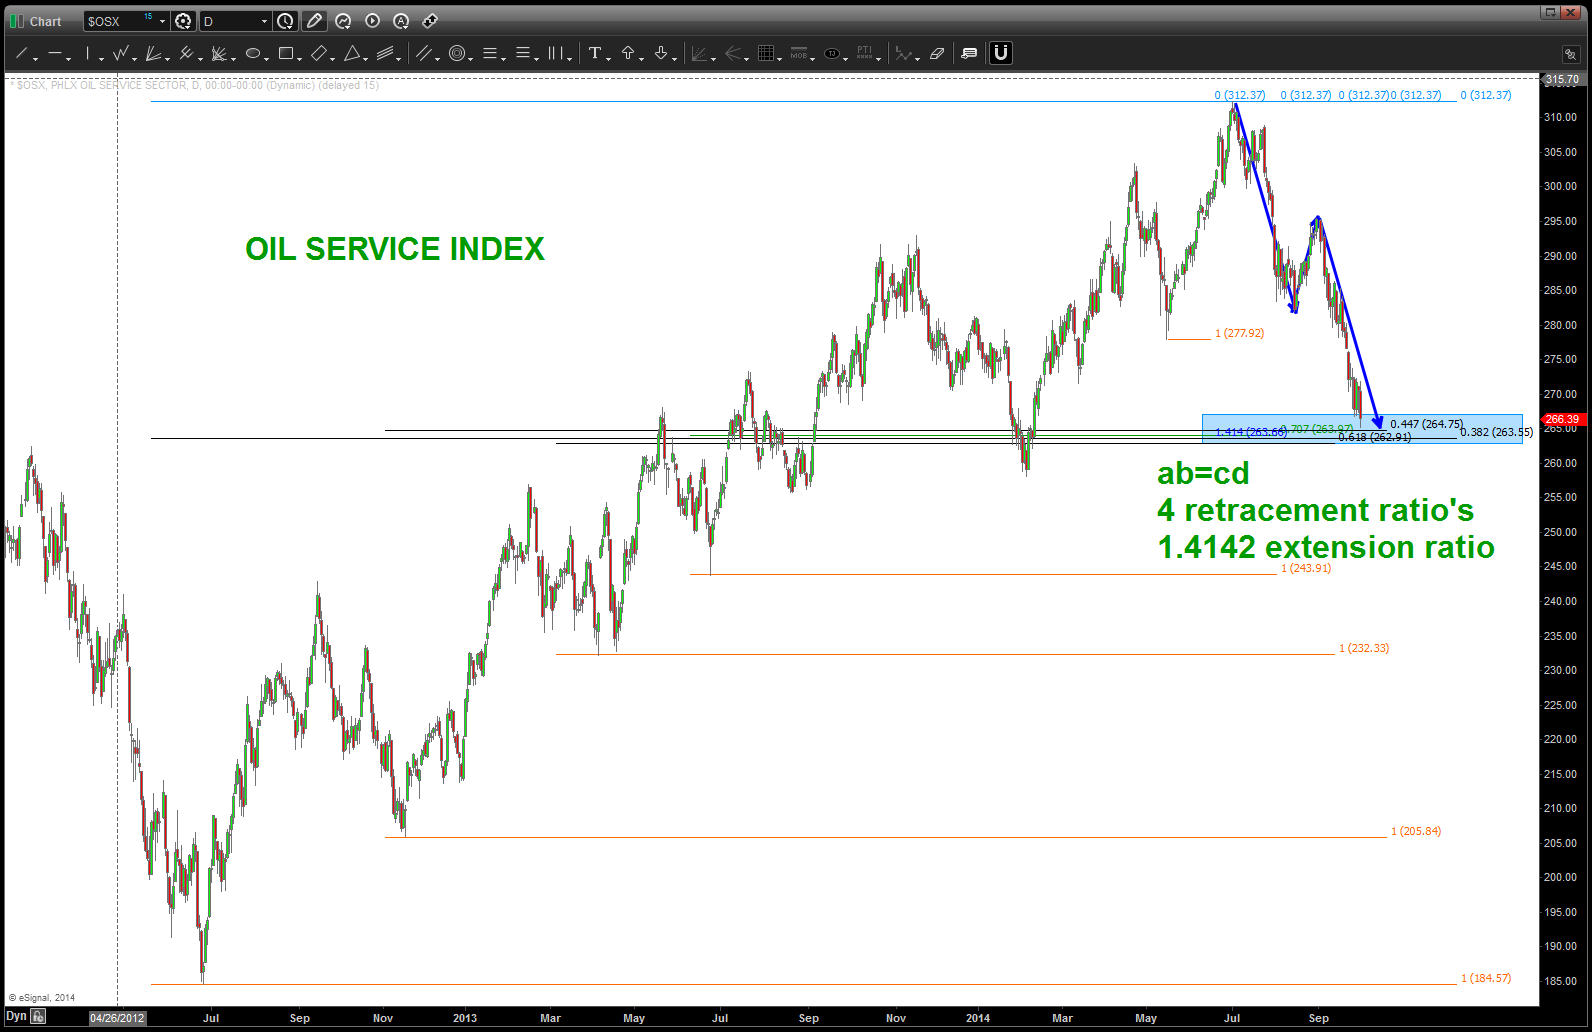
OIL SERVICES INDEX support
why is this important? Well, the USD has been on a tear vs the LOONIE and while the ultimate forecast is for this to continue we think this initial move of the dollar vs the LOONIE is ending (see CAD charts from this post: http://marketfy.com/product/advance-pattern-recognition/blog/1191/view/58856/ ) and we expect a pullback on the Dollar vs the Loonie that, after a 3 wave sequence, should be bought. here’s what we also know … if that level on the Oil Service Index is lost, then the USD “should” continue to surge, Oil will more than likely be defeated at the pattern shown in the last post and well we’ll just go back to the drawing board.
what does the Oil Service Index have to do w/ the LOONIE vs USD? Well, a picture paints a thousand words …
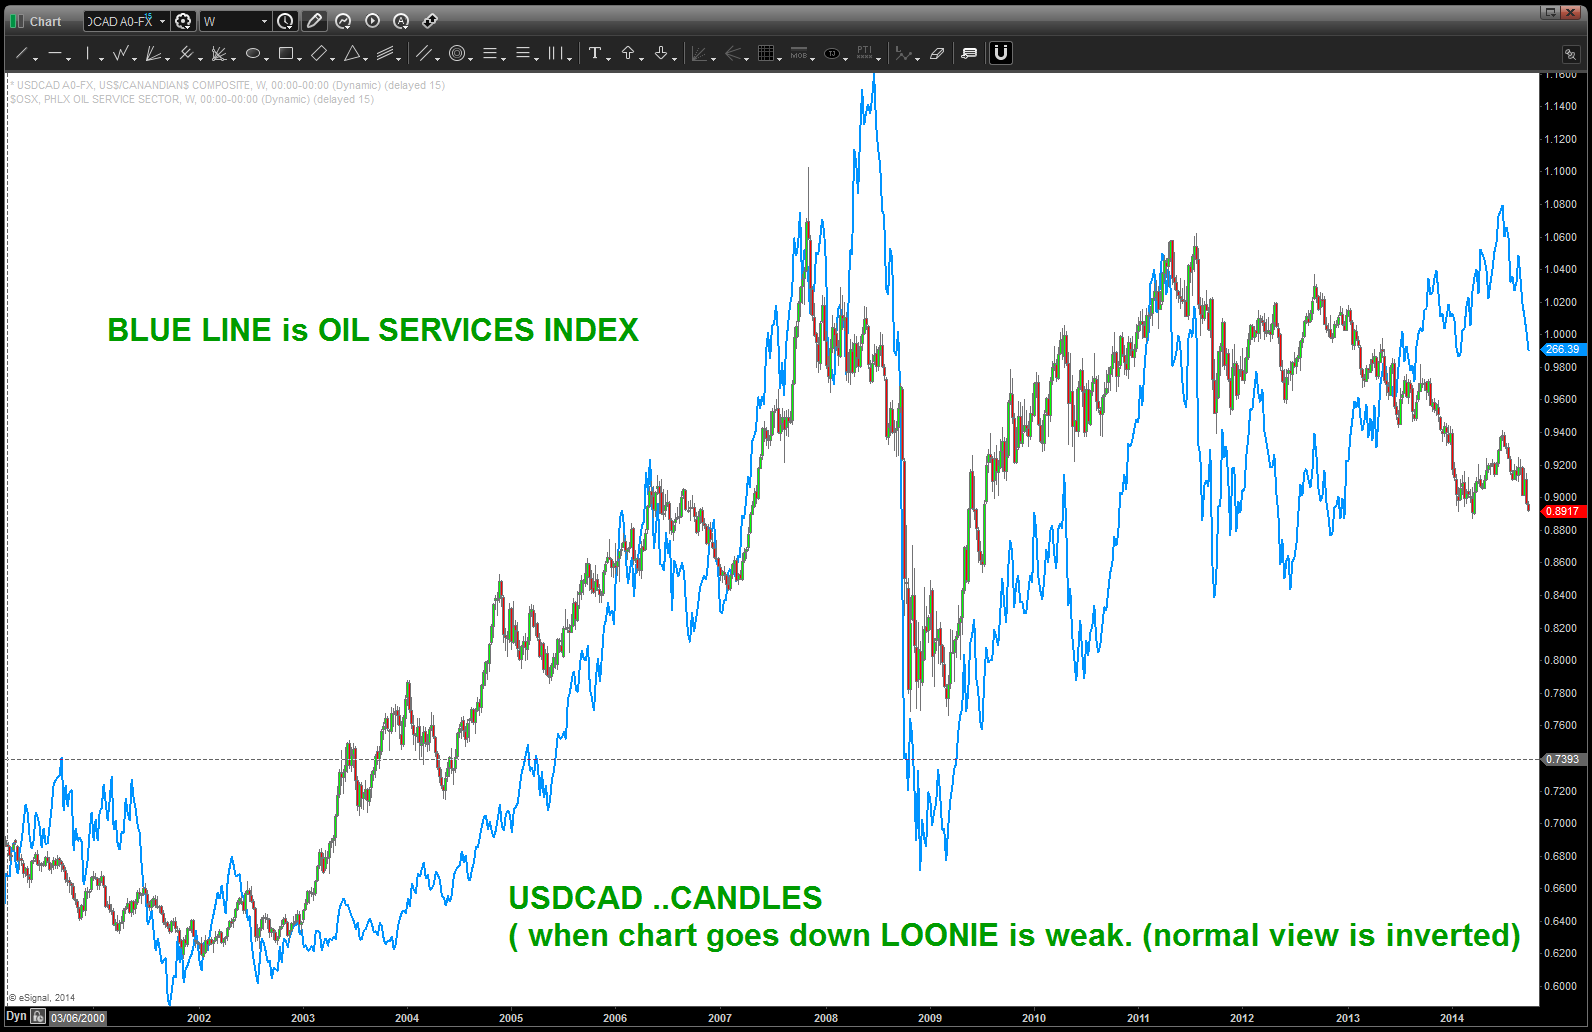
LOONIE and OIL SERVICES INDEX
let’s talk Crude Oil ..
Posted on September 30, 2014 Leave a Comment
man today was a blast, hugh?
ebola, dudes attacking the white house, ISIS, Russia, Hong Kong Riots … let’s make life easy and watch the patterns!
look at this amazing BUY appearing on CRUDE ….for us pattern recognition dudes/dudettes we could care a less till 84-87 is targeted.
rock on, ok?
B
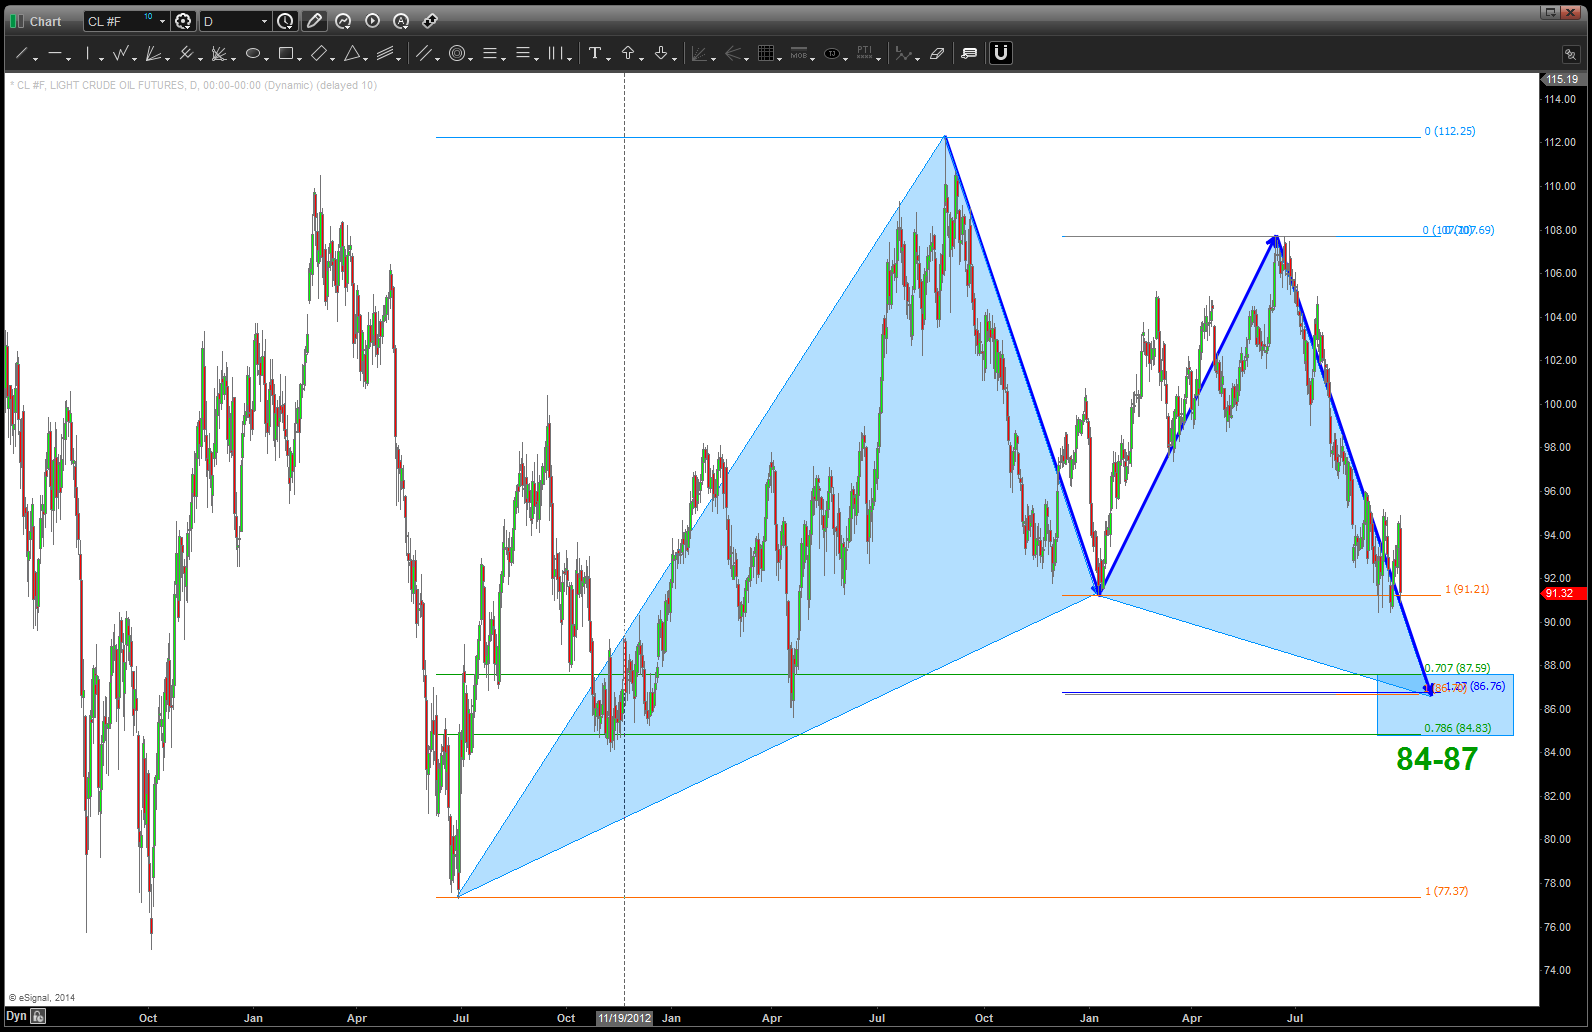
CRUDE BUY
