been busy working w/ the Marketfy.com platform
Posted on September 30, 2014 Leave a Comment
been busy on marketfy.com
http://marketfy.com/product/advance-pattern-recognition/blog/1191/
rock on, BART
YHOO important PRICE and TIME target hit (intraday)
Posted on September 29, 2014 Leave a Comment
so, did a post about the Alibaba ($BABA) fever and full expected that upper target up/around 48 to get tagged and then some selling to come in … well YHOO had been pounced lately (roughly -15%) and now we just completed an intraday SELL pattern as shown here:
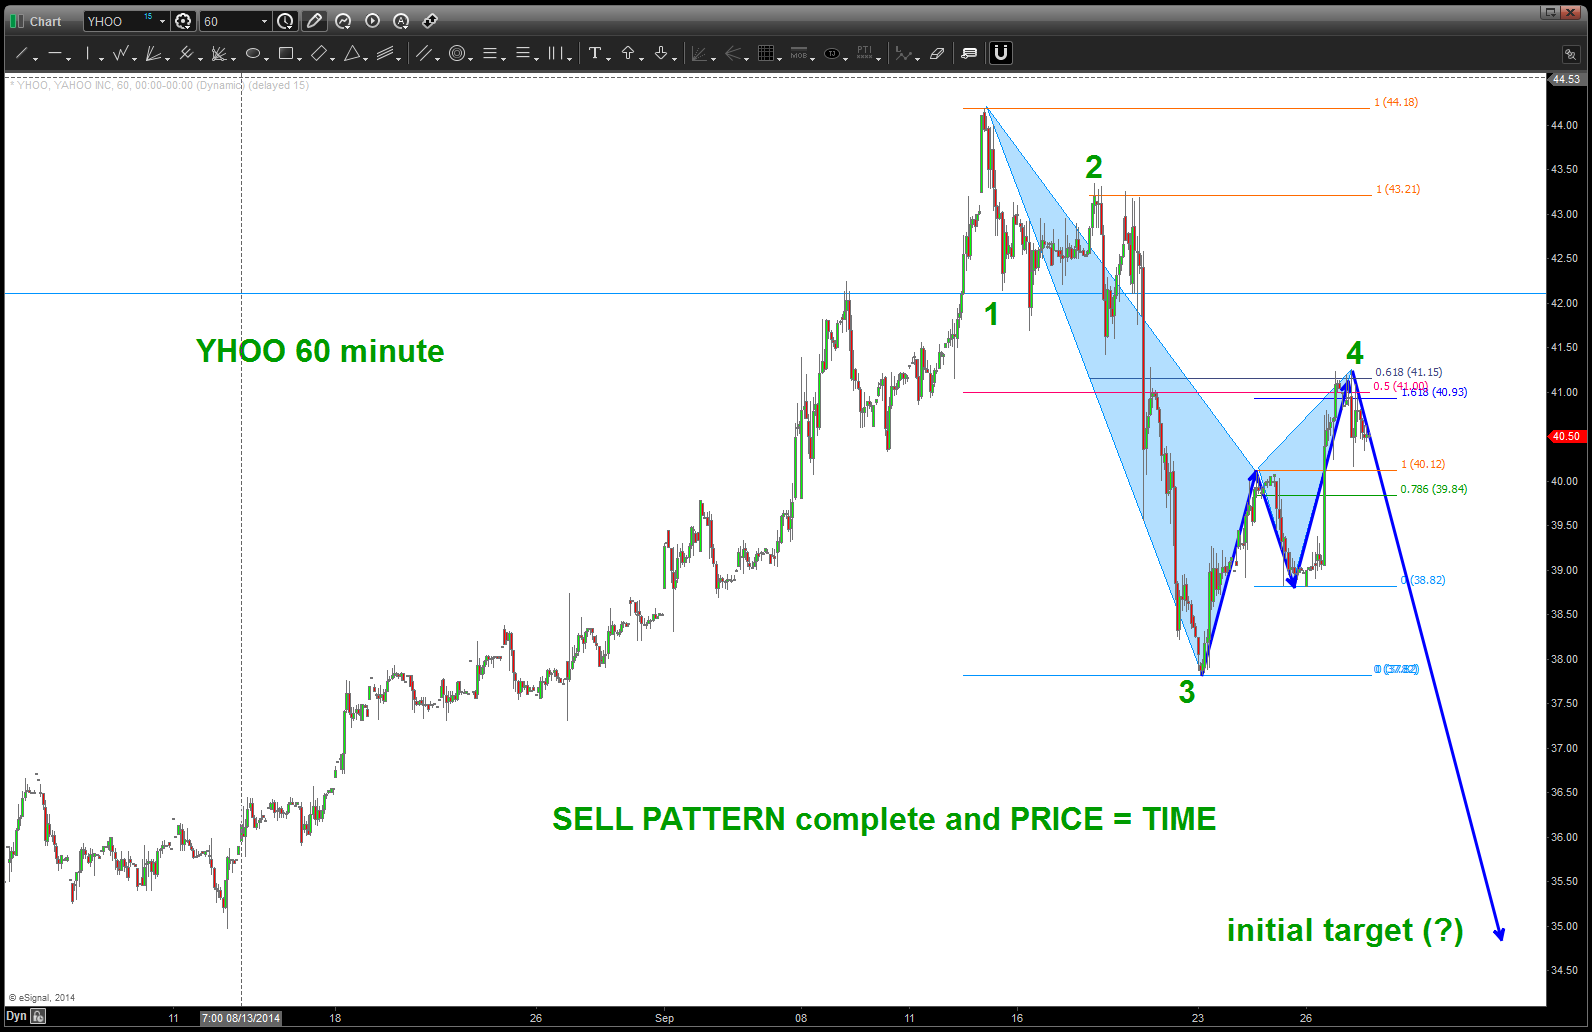
YHOO SELL PATTERN
so, here’s the daily pattern that hit …
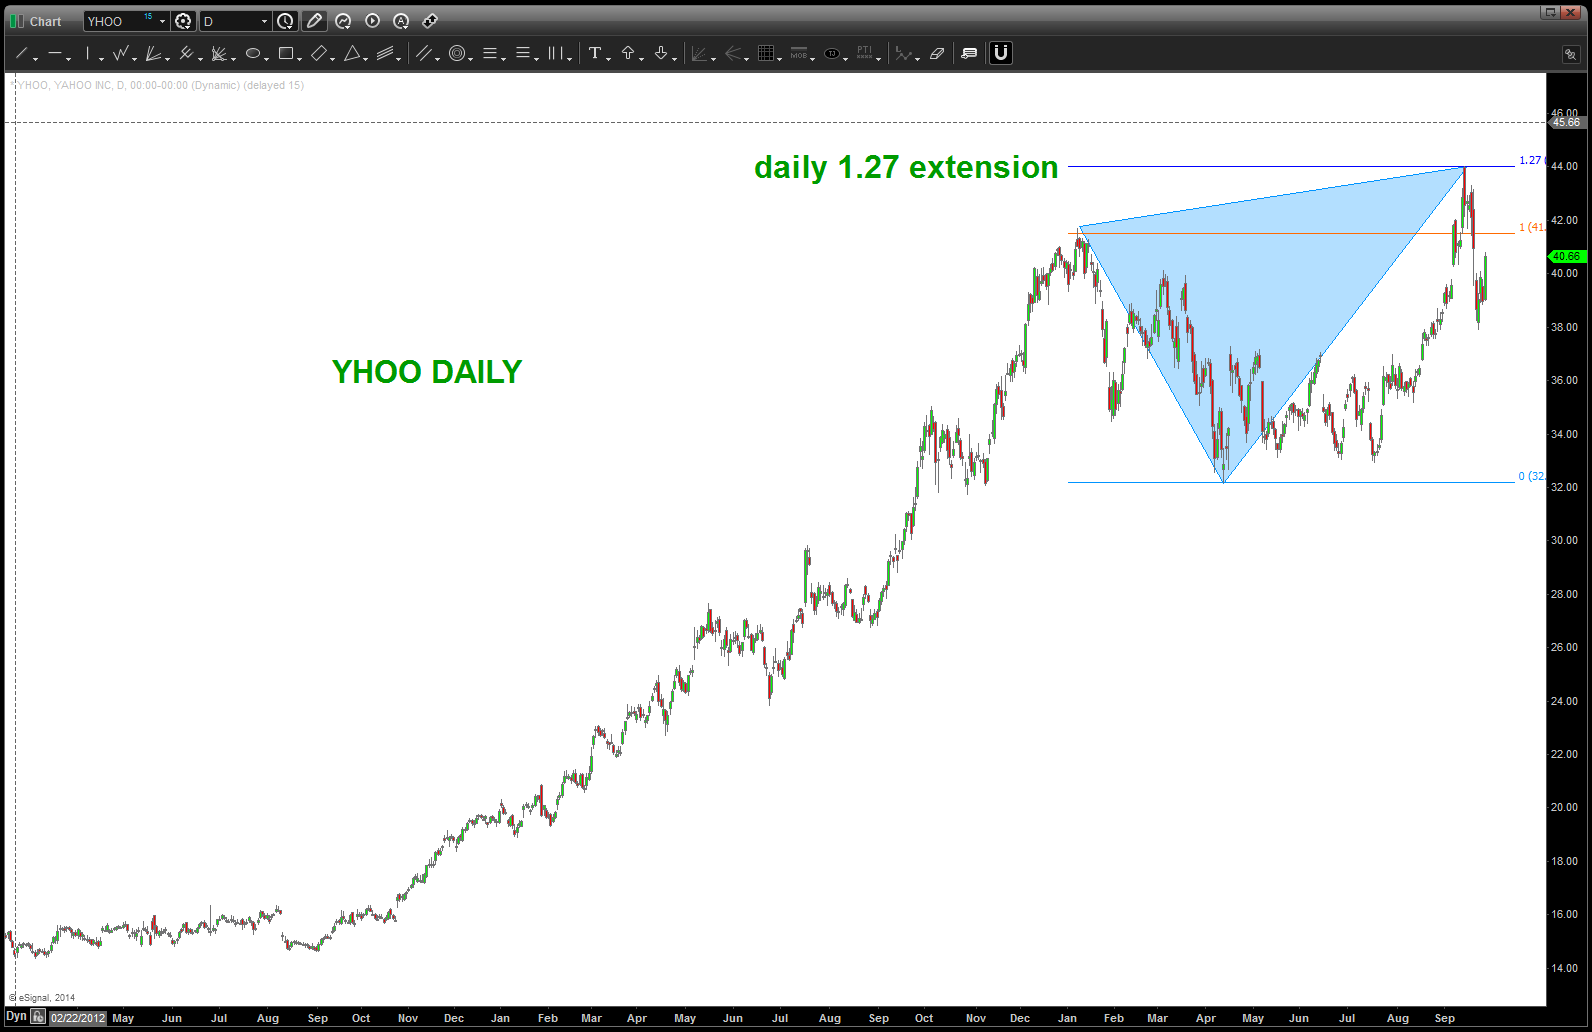
YHOO DAILY 1.27 pattern into Alibaba IPO
in conclusion, need to watch this level very closely for weakness. if YHOO continues up w/ strength then it might capture the upper 48 target posted here:
let me know if you have any questions.
Bart
SeeItMarket contribution on Palladium and Nazzie .. KEY
Posted on September 28, 2014 Leave a Comment
hope everyone is having a great weekend!
Bart
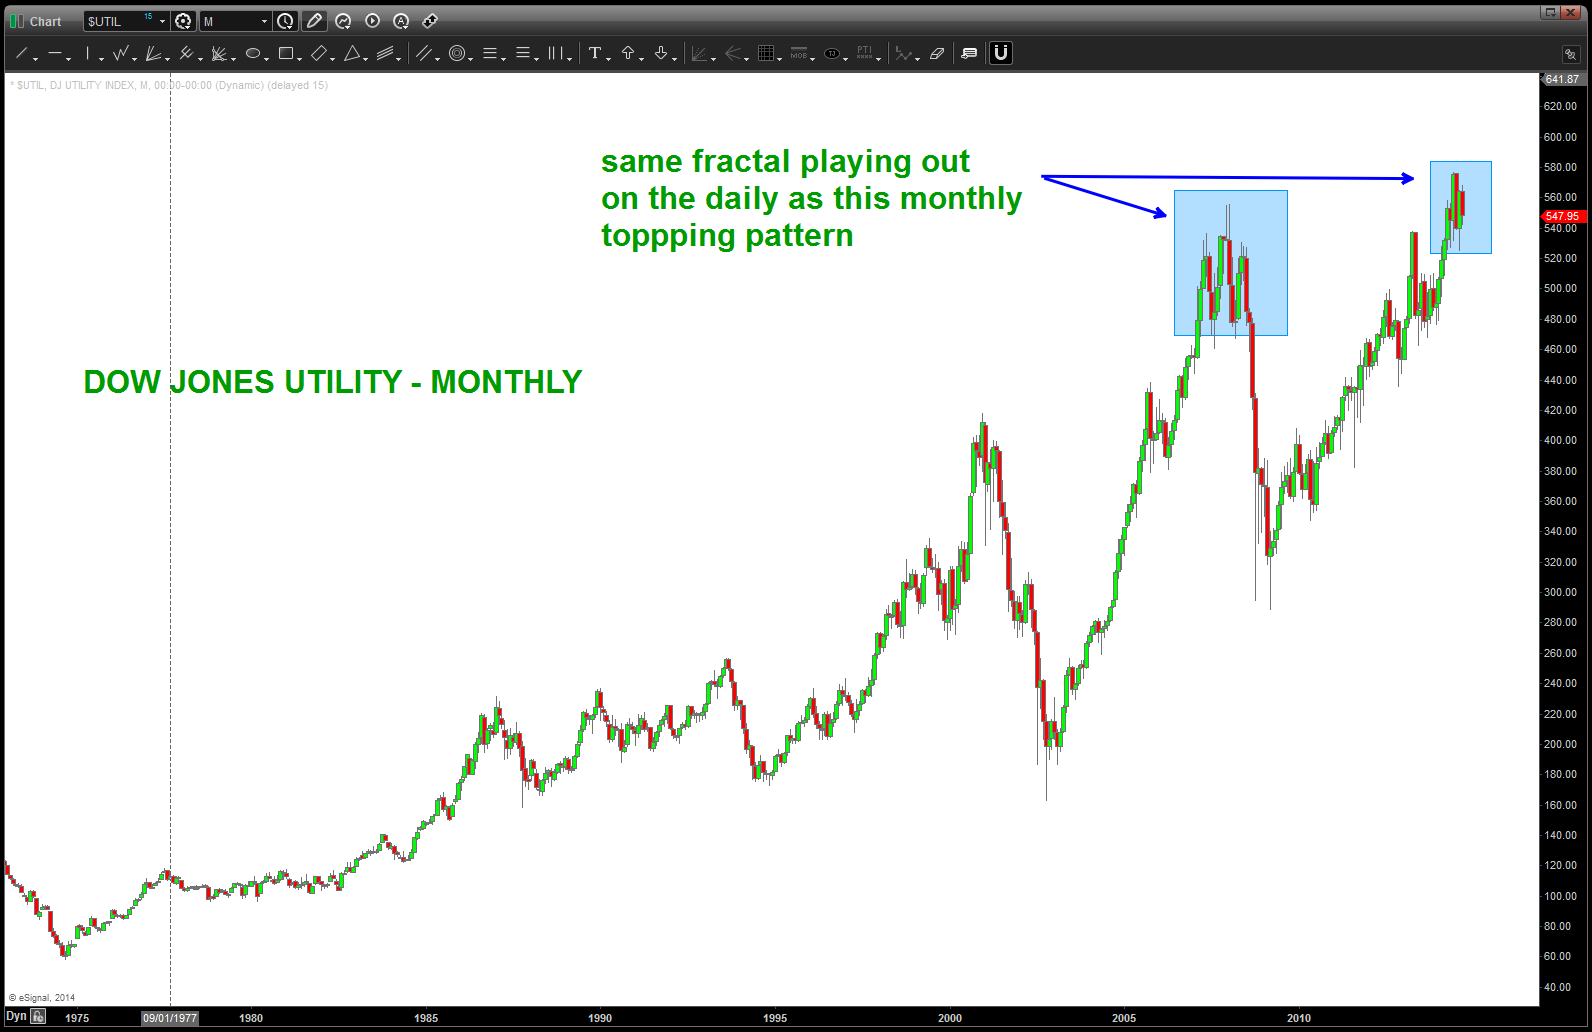
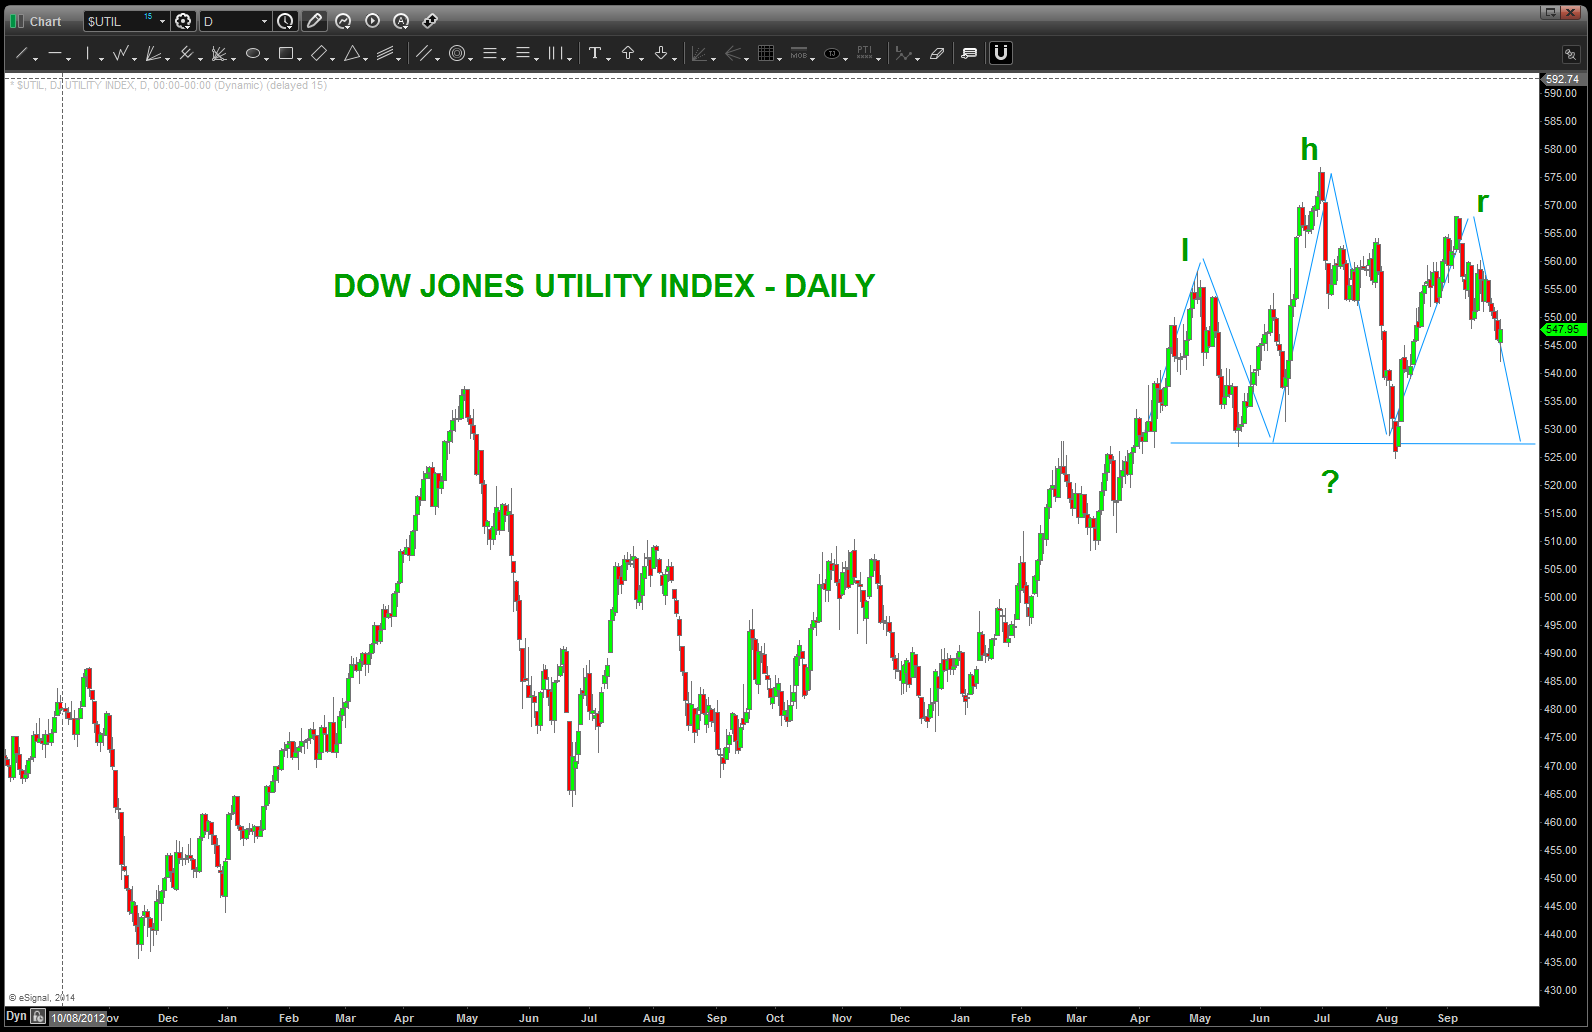
why the DJ Utility Index formation is important
Posted on September 28, 2014 1 Comment
back in April 2014 (https://bartscharts.com/2014/04/19/dow-jones-utilities-long-term-1942-price-pattern/) we ID’d a long term pattern that was completing. the market subsequently went up into Jun/Jul and hit the target. now it appears we “might” be carving out a Head and Shoulders Daily topping pattern. Note, this same pattern came into play on a MONTHLY basis during the 2007-2008 time frame.
the reason we are watching this closely is because of the presence of this long term topping pattern that has hit and held, thus far.

Square Out Post at www.seeitmarket.com
Posted on September 26, 2014 Leave a Comment
here’s my most recent post at http://www.seeitmarket.com – http://www.seeitmarket.com/sp-500-eurusd-square-outs-time-price-align-13794/
make it a great weekend
Bart
Schumpeter’s wave of Creative Destruction just starting in Germany … short surf is UP!
Posted on September 25, 2014 Leave a Comment
Voo Doo principle: a pattern appeared and at the PRECISE level the BUYING STOPPED and the SELLING took over … believe it? or not?
Here’s what I do know:
- ANYTHING can and will happen …
- YOU DO NOT NEED TO KNOW WHAT IS GOING TO HAPPEN NEXT TO MAKE MONEY
- There is a random distribution between wins and losses for any given set of variables that define an edge … (MY edge is PATTERN RECOGNITION)
- An edge is nothing more than an indication of a higher probability of one thing happening over another …
- EVERY MOMENT IN THE MARKET IS UNIQUE
- Thank you Mark Douglas for Trading in the Zone.
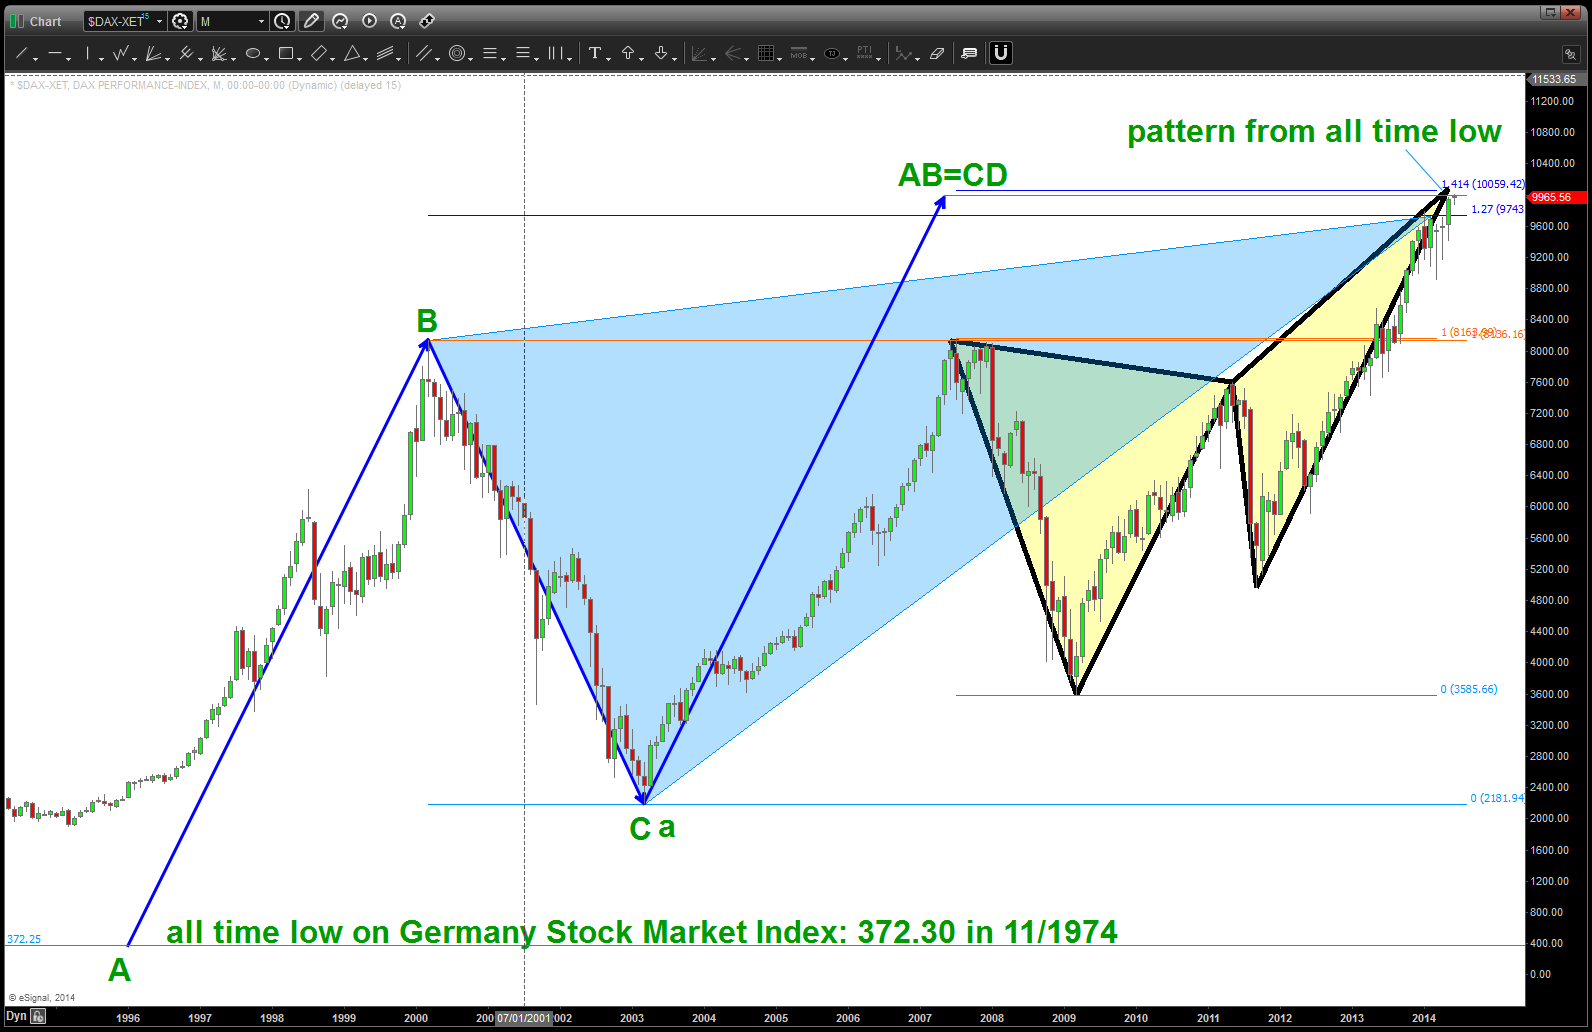
Here’s what I SEE w/ regards to the German Dax – PATTERNS are complete across long time frames. IF (the big IF) these patterns work (they sure seem to be) THEN it is very bearish.
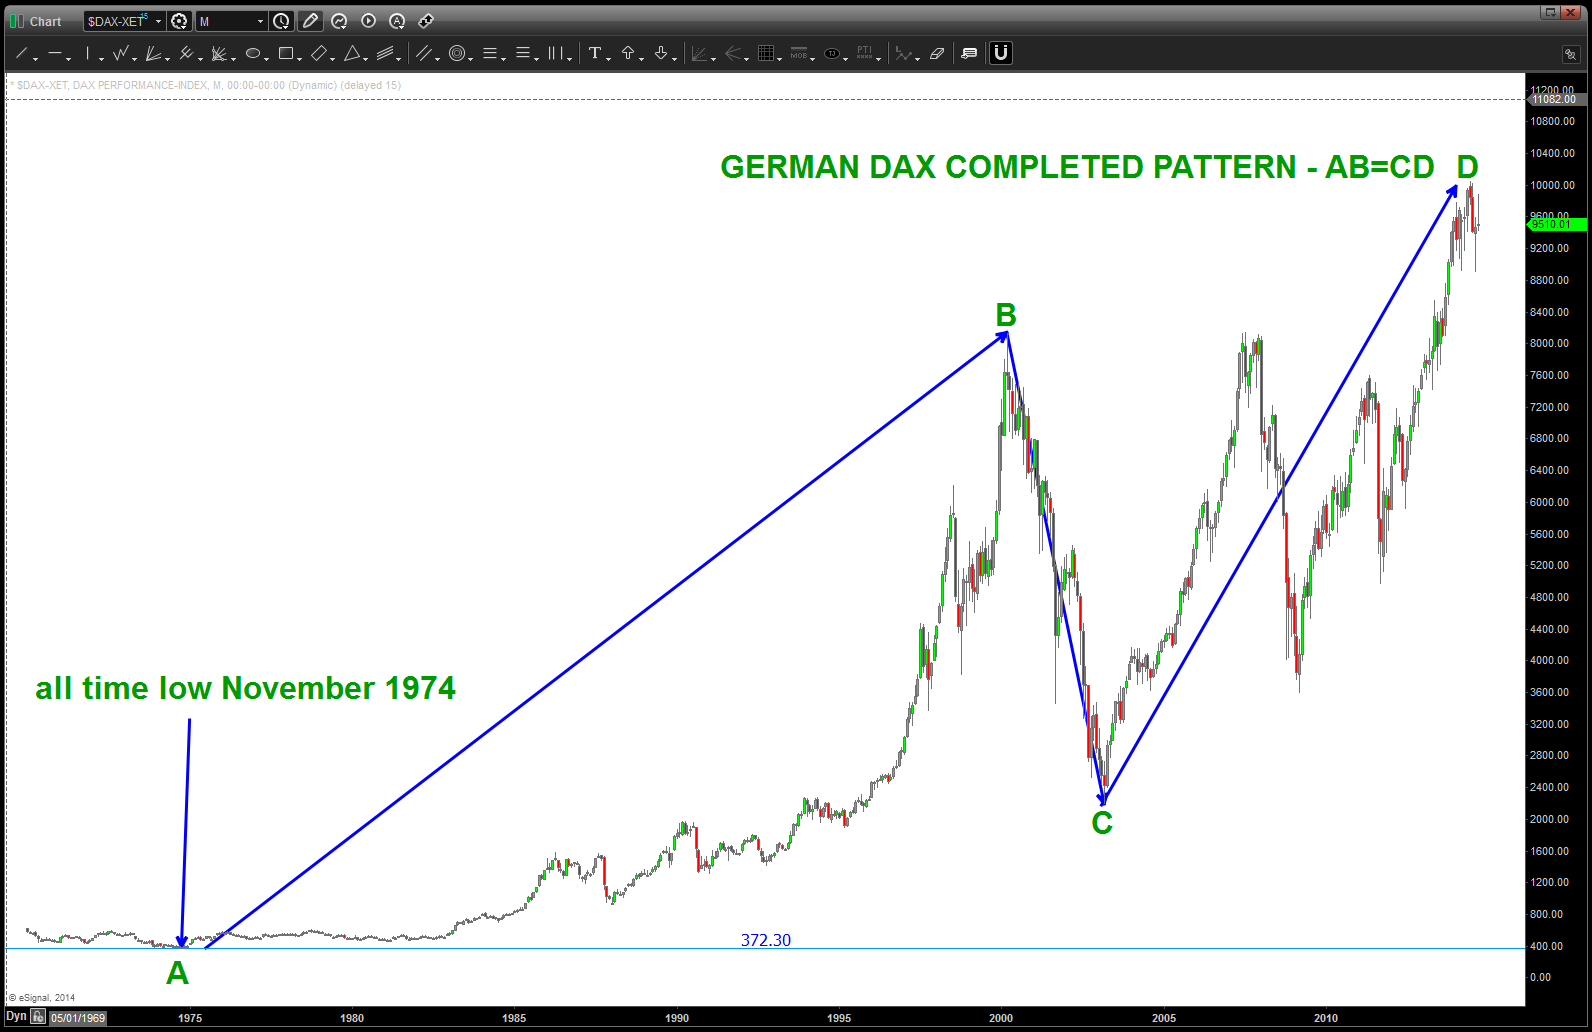
GERMAN DAX Monthly AB=CD from all time how to all time high – COMPLETE

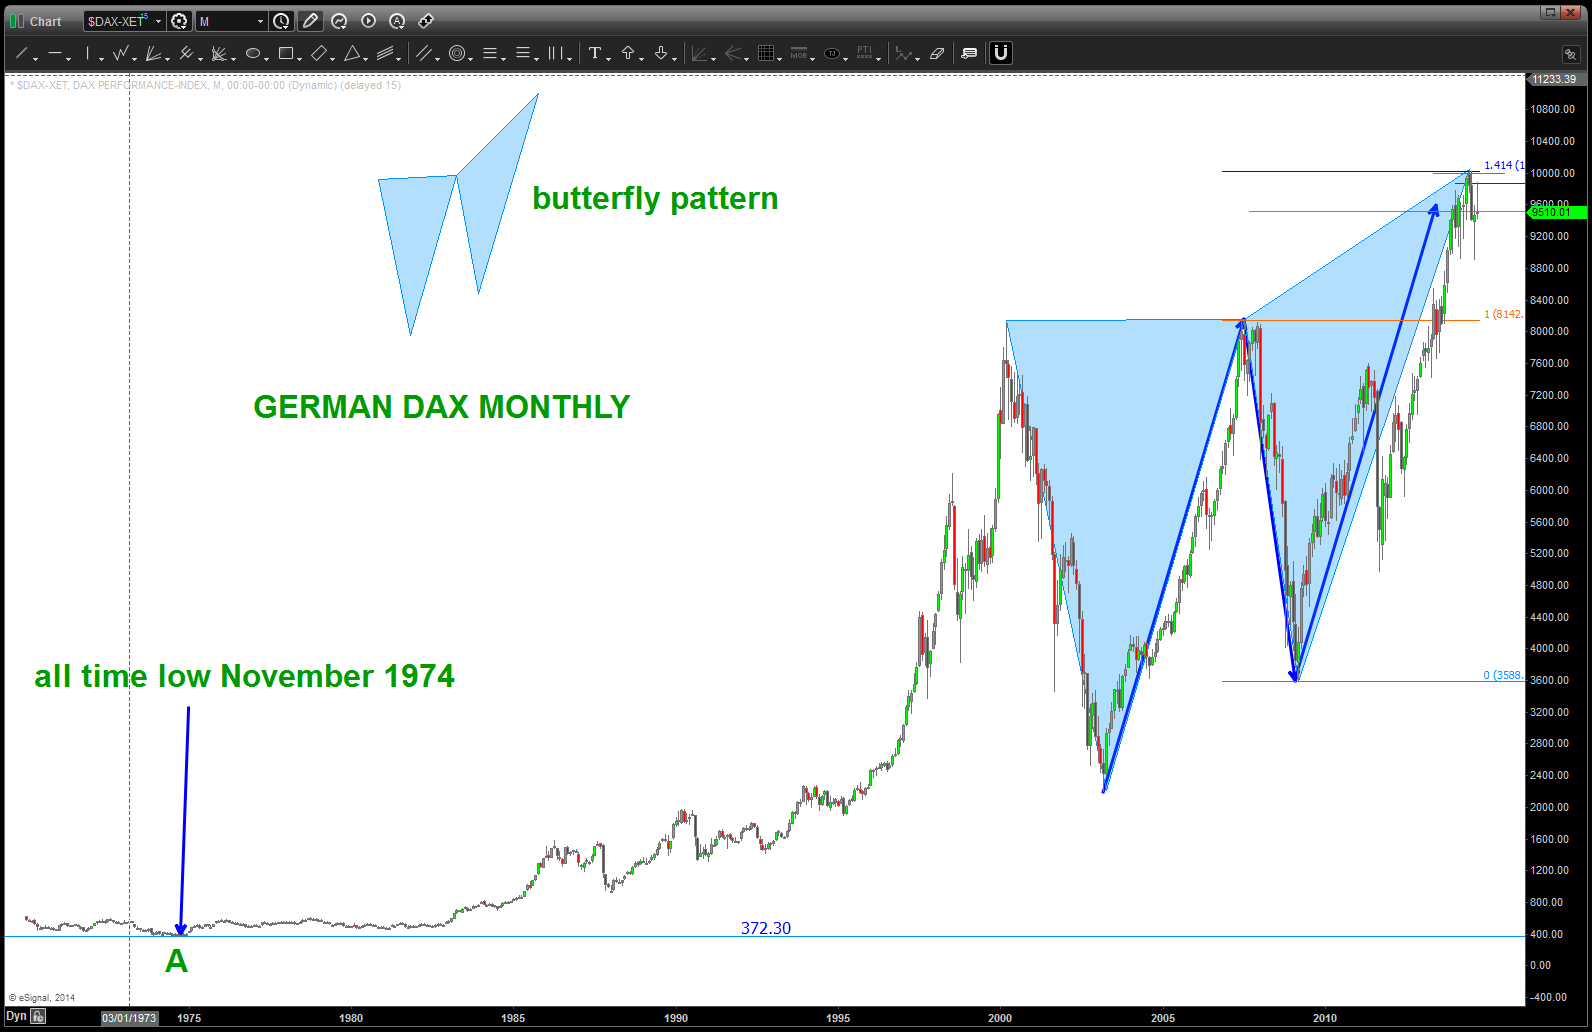
Butterfly #1 on German Dax
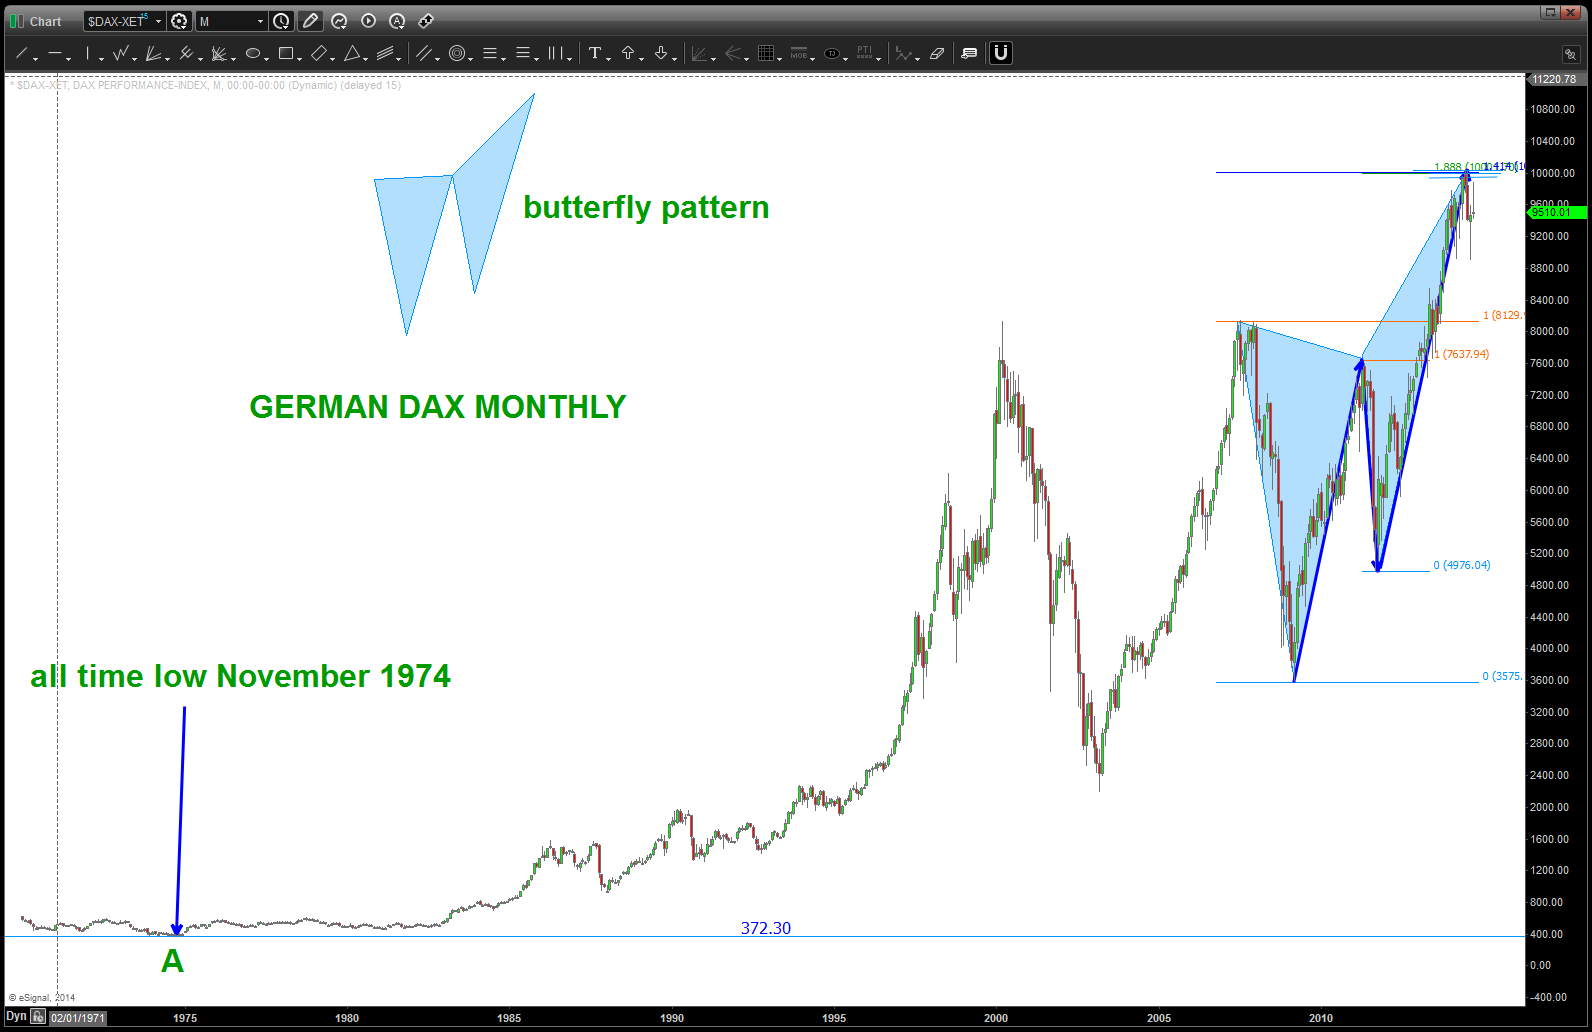
butterfly pattern MONTHLY GERMAN DAX number 2
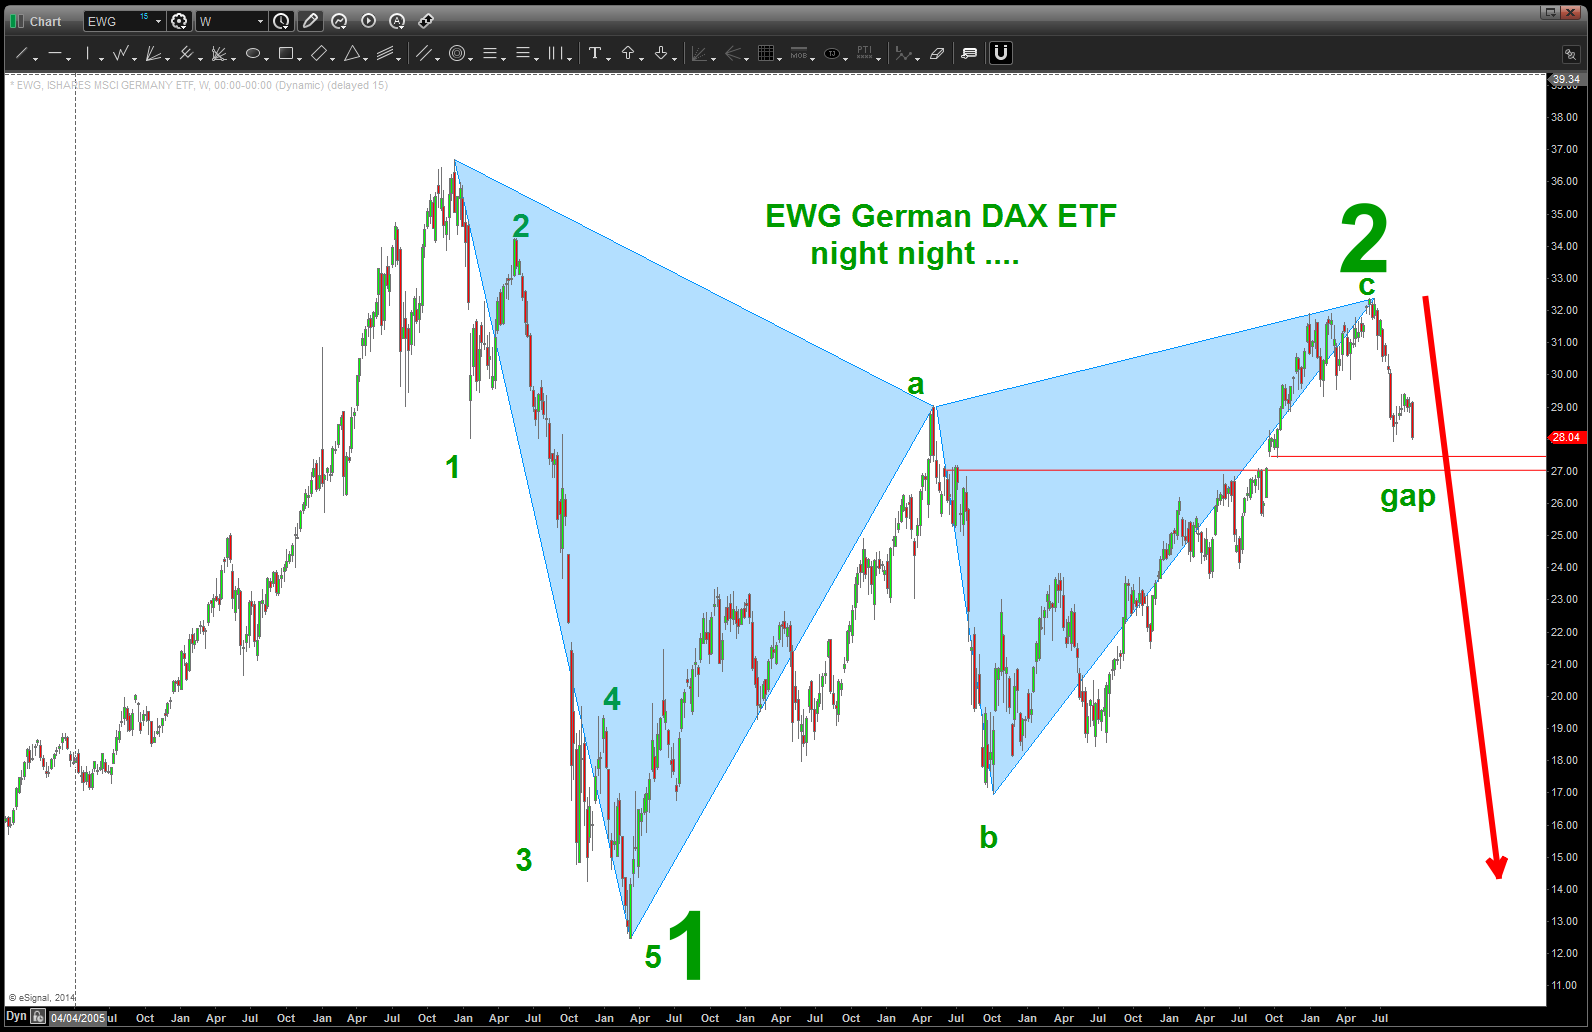
EWG ETF for German Dax
and, here’s the ETF w/ the “SEE PATTERN APPROACHING” back in December 2013
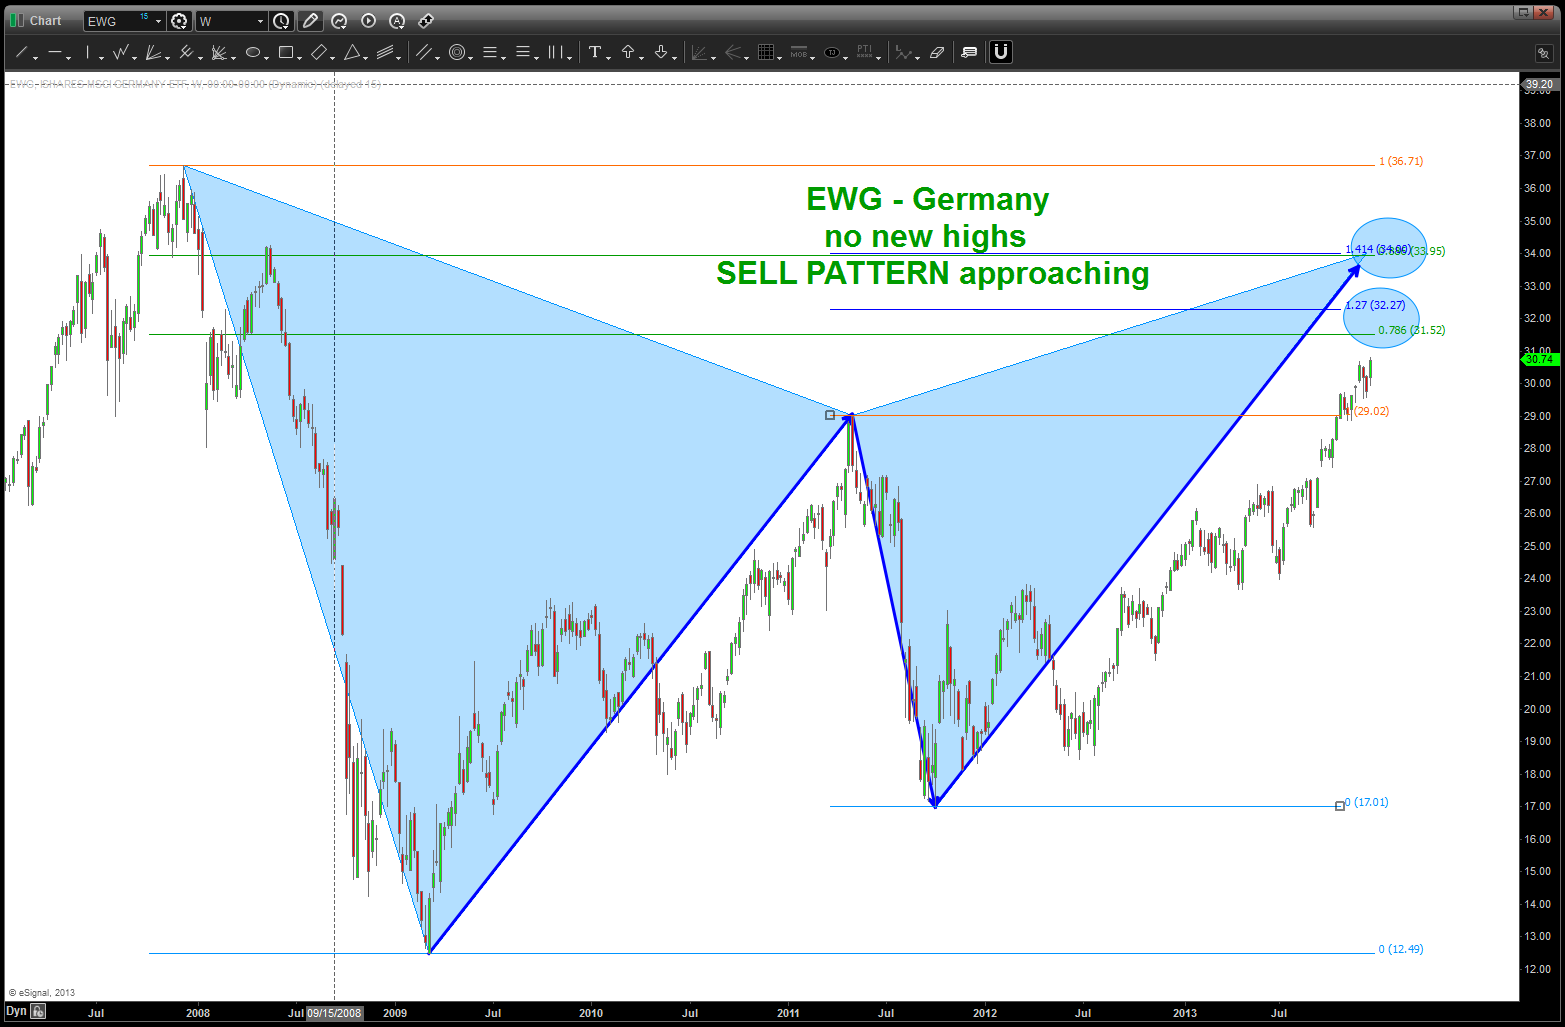
the SELL PATTERN approaching
CLIFF NOTES: as I’ve said for the past 6 months (it hasn’t even been a year blogging!) this is a PATTERN RECOGNITION blog. And, guess what … we have ANOTHER PATTERN from an all time low. Here’s the pattern …
German Dax
EURO and 138 …
Posted on September 24, 2014 Leave a Comment
usually try to stay away from blindly buying or selling the .618 retracement … that number is the usual first introduction of people using leading indicators and sometimes it works and sometimes it doesn’t and people eventually say “hogwash” and run away from these techniques — GOOD! however, when we have projections or overlapping patterns then I get interested in this level. here’s the .618 retracement overlapping patterns:
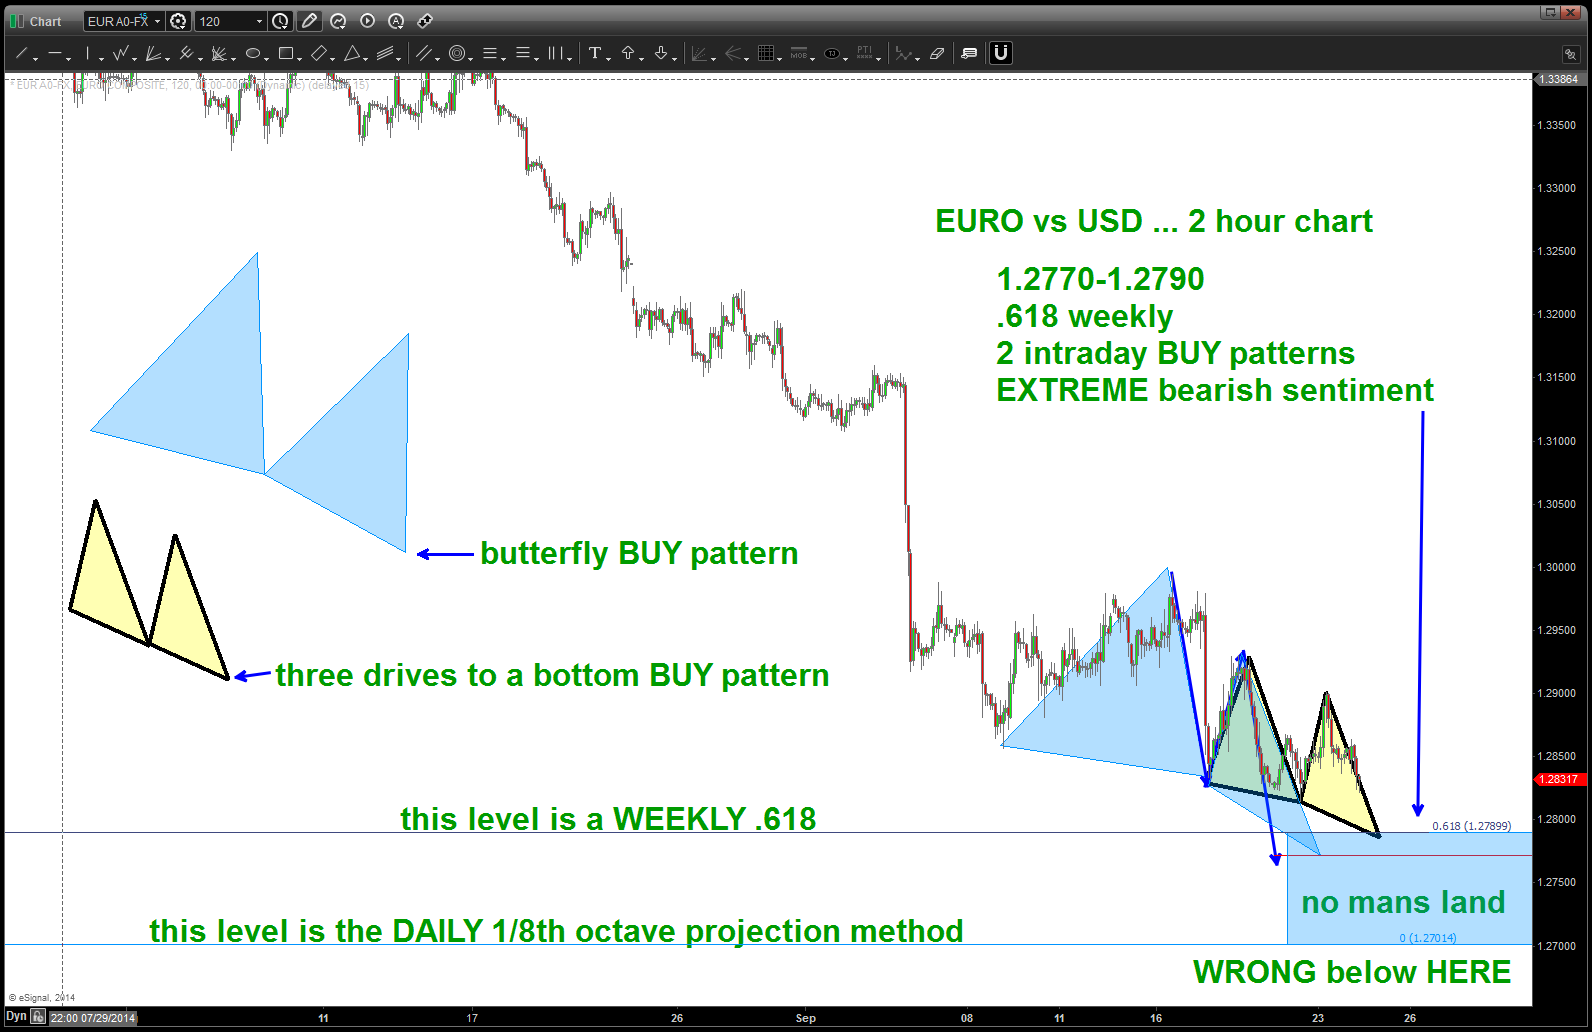
overlapping patterns into .618
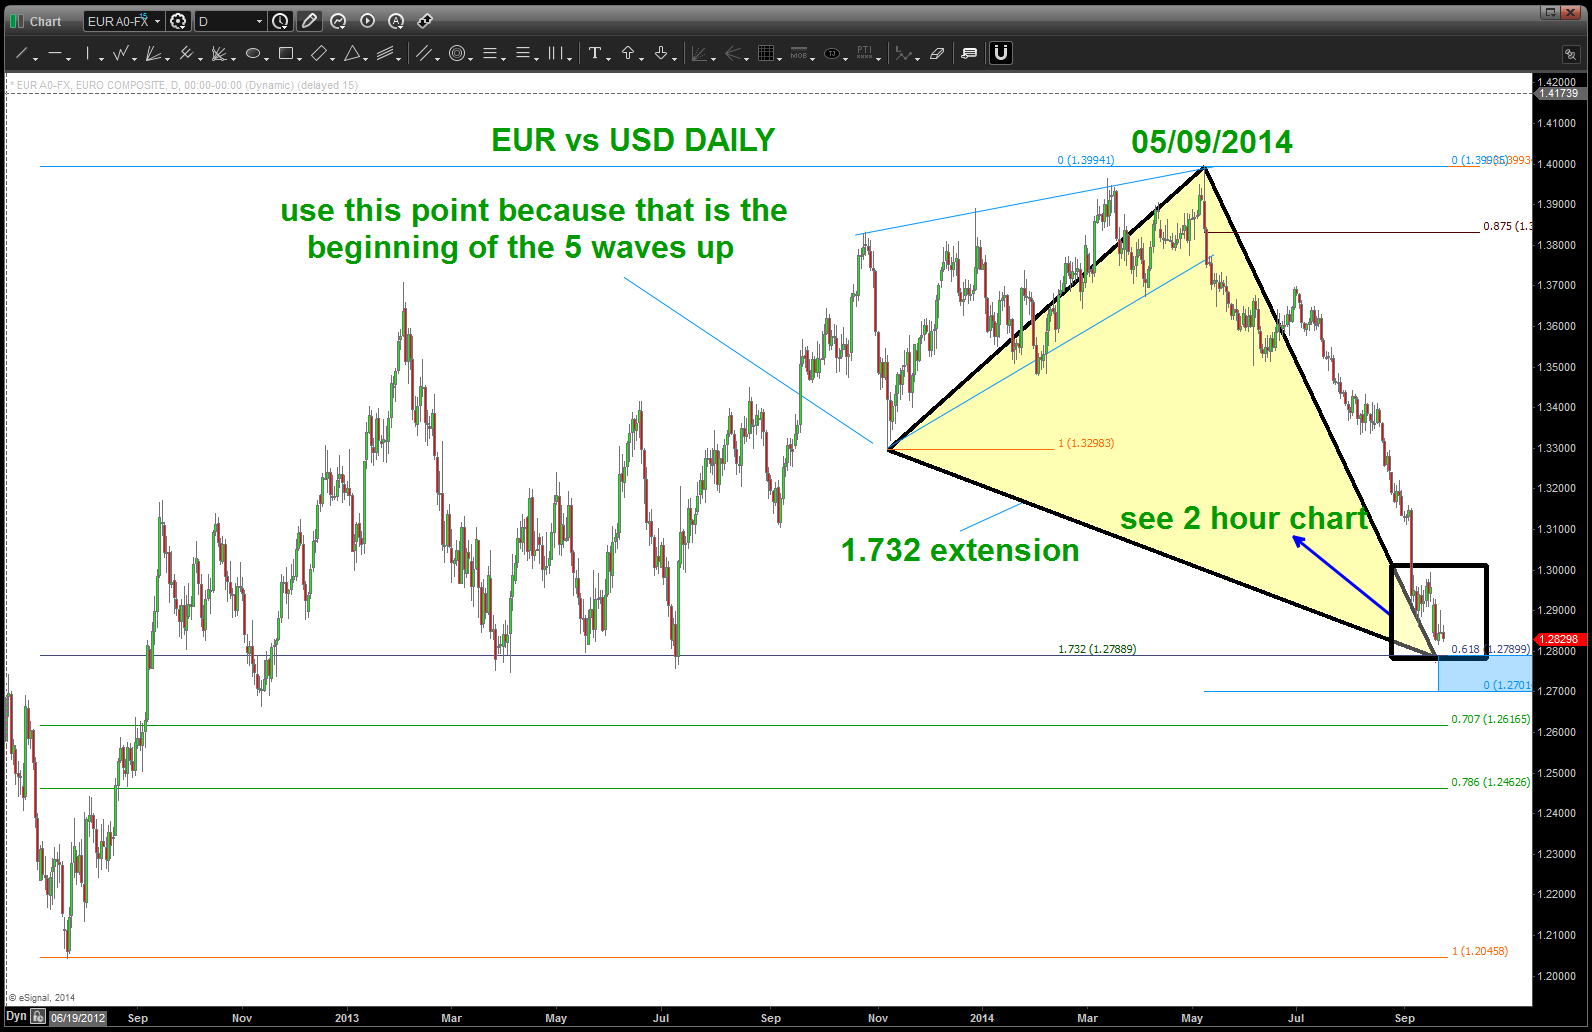
Daily EURO look
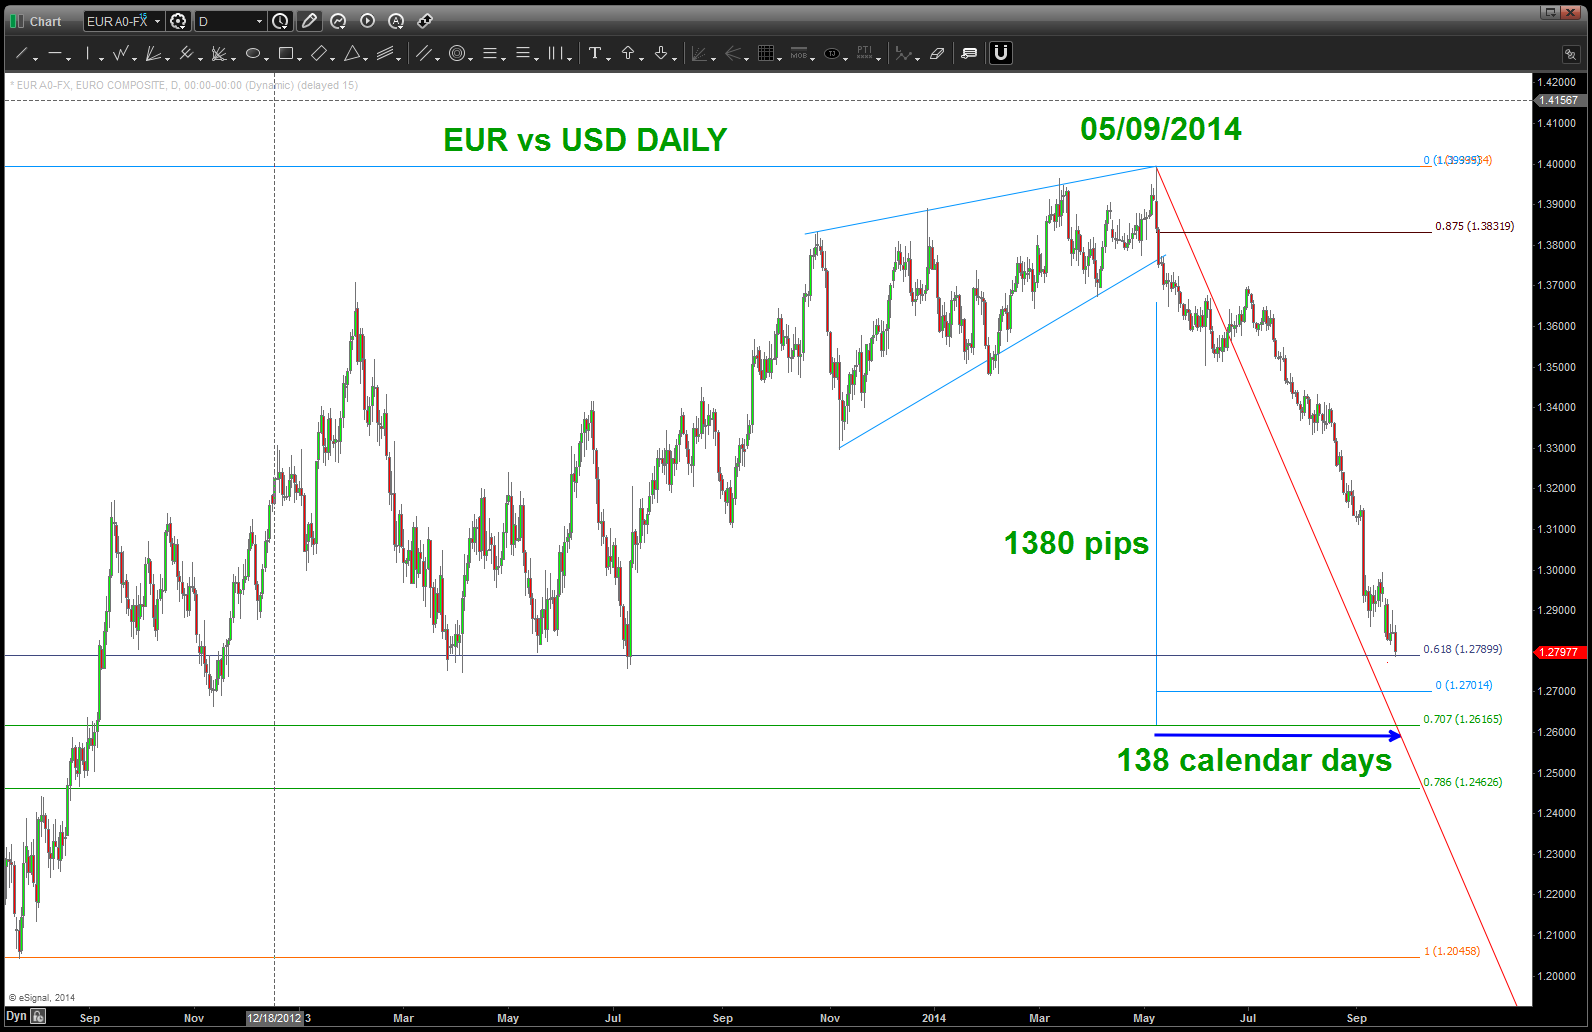
here’s where the 138 gets interesting ….
1) the Euro vs USD, believe it or not, has been down 138 days. and, having seen my past posts on the 66.6 months for the S&P and 1920 days since the low and the concept that PRICE equals time then if we do a calendar day count from the last high on the EURO on May 09, 2014 we get 138 days. How do we convert that to PRICE in the FX ? Well, we really don’t care about decimal points in the world of vibrations .. we care about the NUMBERS so convert like this:
- HIGH was 1.3989 or 1.4000 (work w/ me people)
- 1.4000 = 4000
- 138 days = 1380 (also pretty close to 1382 or 1.382)
- 4000-1380 = 2620
- 2620 = 1.2620
- 4000 square root = 63.25
- (63.25-12)^2 = 1.2626
so, not trying to be a hero here BUT back when the dollar was at 79 I was recommending the BUY … but now, everyone and there brother is lighting up the twitter universe, CNBC, Yahoo Finance, Marketwatch and blah blah around the DOLLAR DOLLAR and the bearish sentiment for the EURO is massive … a perfect time for the EURO to bounce ….
Carving out a bottom folks … and, while I remain extremely bullish on the dollar am expecting the classic 3 wave corrective movement so … am going to let the .618 or .707 (square root of 2 – 1.4142, 1/1.4142 = .707) level prove it and then look for an OPPORUTNITY to BUY the pullback that SHOULD be a classic 3 waves …
EURO and the number 138
revisiting the XLP/SPX ratio … AGAIN
Posted on September 23, 2014 Leave a Comment
folks, bringing this up, again, because this divergence is MONSTROUS.
in order to show the divergence and how something is “not quite right in toon town” I’ve actually inverted the ratio to show the S&P 500 on top this time. t
the only reason is it shows the amazing divergence present .. when you look at the chart below notice the perfect synchronicity between the S&P500 and the S&P500/XLP. but notice around 2011, the dance breaks up … that’s a big deal to me and while it’s true you obviously can’t fight the fed and it’s different this time what I believe it tells us is the “smart money” has stayed in staples or haven’t jumped into this amazing bull market as much as anyone thinks.
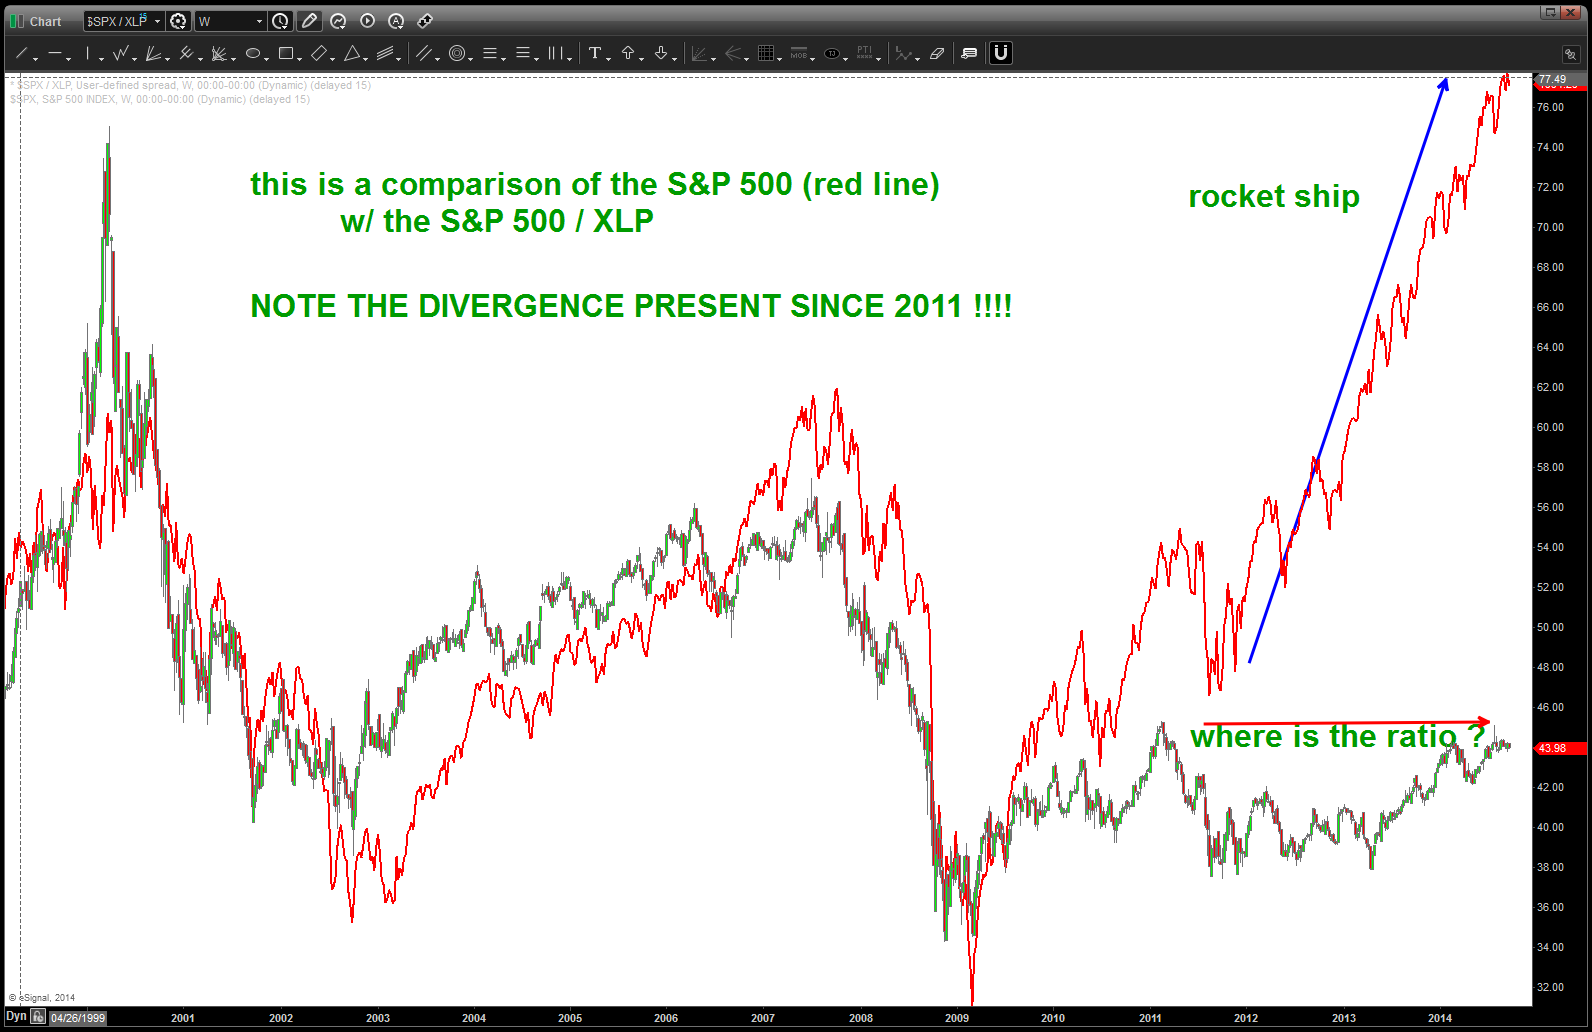
notice the divergence!
now, here’s the same ratio but this time we have the STAPLES has the numerator … note, when this ratio BOTTOMS the S&P 500 TOPS and when this ratio TOPS the S&P 500 bottoms. EXACTLY … the theory is the institutions move in/out of “defensive” names during times of volatility so we expect the relative strength of the XLP’s to increase during bear markets / sell-offs (the ratio goes up) and decrease during bull markets/rallies (the ratio goes down)
the ratio HAS NOT GONE DOWN during the past 2 year rally phase … tells me the institutions have kept their powder dry.
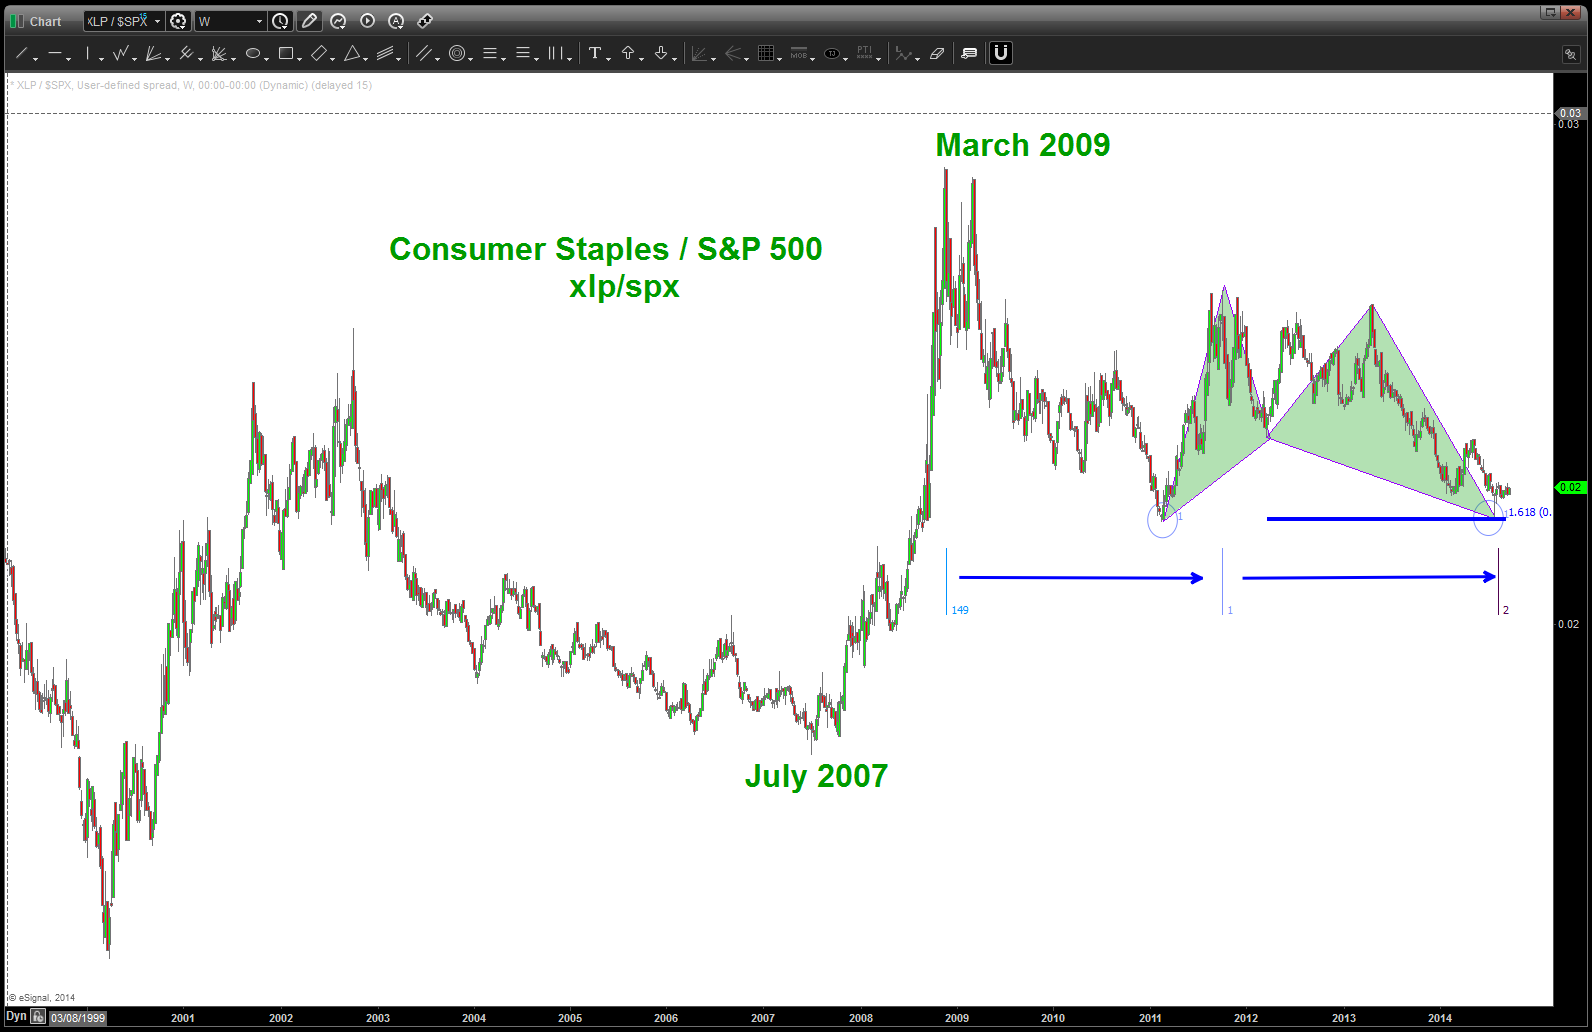
XLP / SPX – note divergence and NO NEW LOWS on the ration ….
just a matter of TIME …
IWM it’s almost been a year since our warning
Posted on September 22, 2014 Leave a Comment
9/22/2014 – the IWM has been getting a lot of news lately and well it should. just wanted to point out the below charts that warned of 113-120 being very stiff resistance if not a TOP back in November of last year … sure looks like distribution but, knowing nothing of the fundamentals I will reiterate over and over and over and over (get the picture) on my blog that’s it’s simply a PATTERN. Sometimes they work, sometimes they don’t. Manage the risk ….
note the same fractal present as 2007 .. still believe the 108 handle will be key to supporting either the bulls or the bears …

IWM WEEKLY
11/26/2013: the “zone” of 113-120 should be very strong if not the “top” for a while … if this pattern fails, I’m going into gardening.
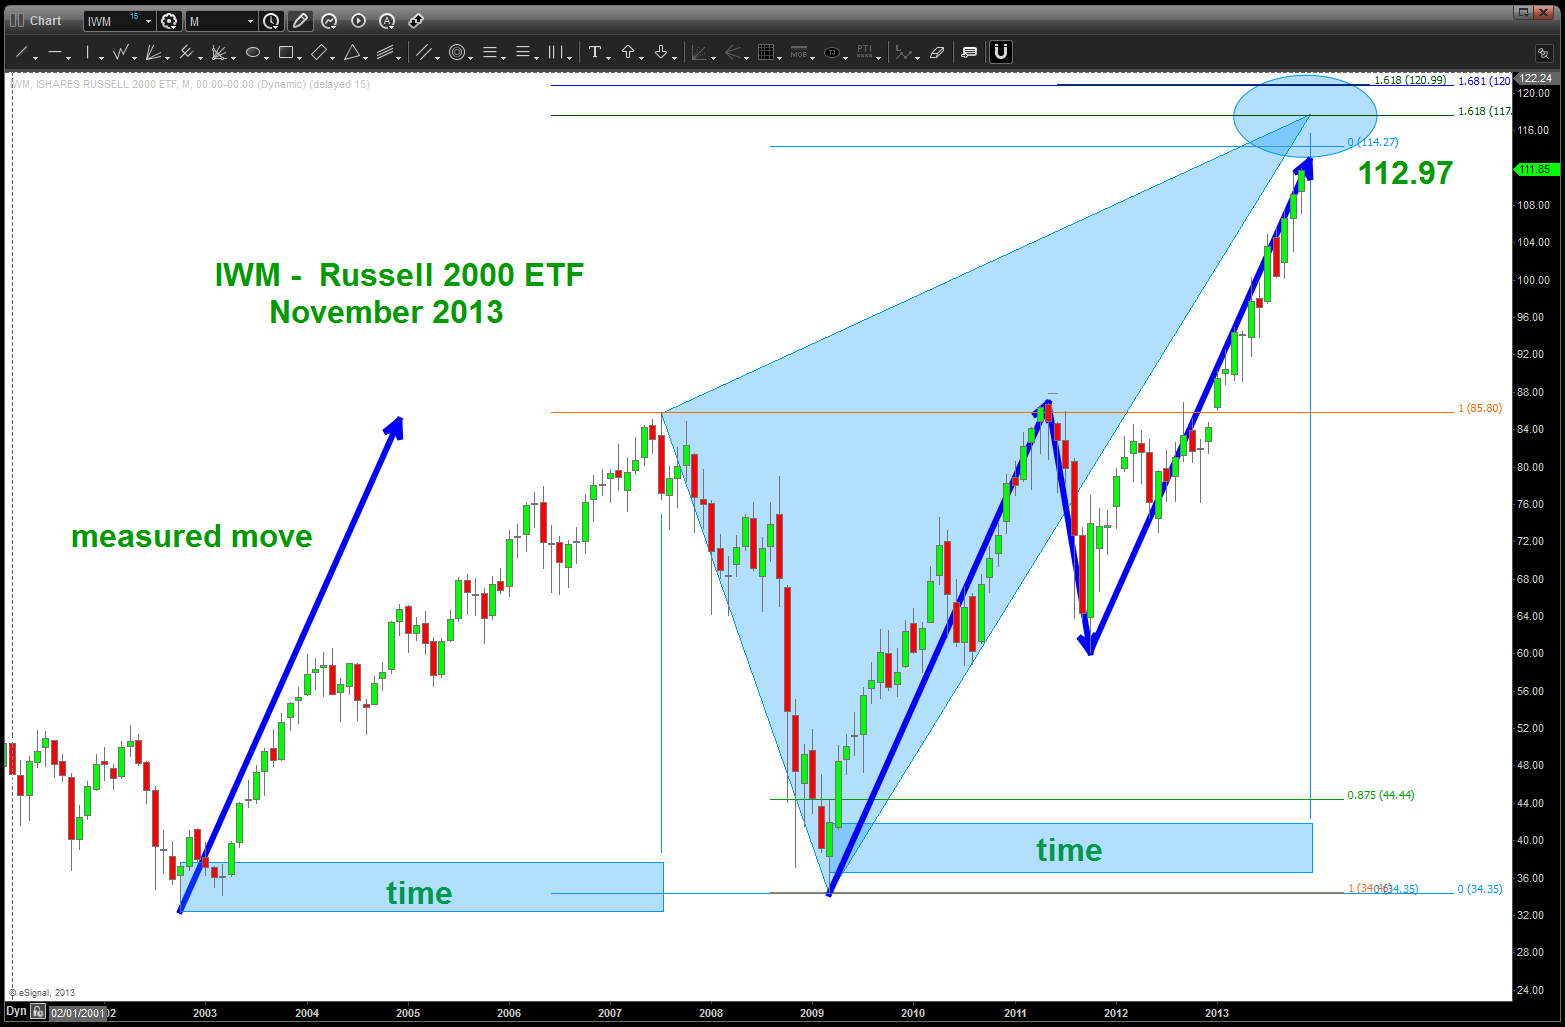
IWM
$BABA and Ripley’s Believe it or not …
Posted on September 19, 2014 2 Comments
folks, this is the largest IPO in history AND it’s got the beat of music to it and, hopefully, the charts below will prove it .. if you don’t believe it, that’s cool. you might not believe me, but these initial “geometric seeds” will be responsible for EVERY future turn in this stock …!
as soon as $BABA opened I went to the charts to watch the action ….if you go back on my twitter feed you’ll see I said look for turns in around 90 minutes. WHY? well, folks, defy the human condition and do the work … PRICE equals TIME and TIME equals price. at major turning points THERE IS ALWAYS A CORRESPONDING RELATIONSHIP with a TIME AND PRICE confluence. the HARD part is that it is either EXACT or it’s a multiple of 1/1oth, a square root or music and geometry but, trust me it is there … period.
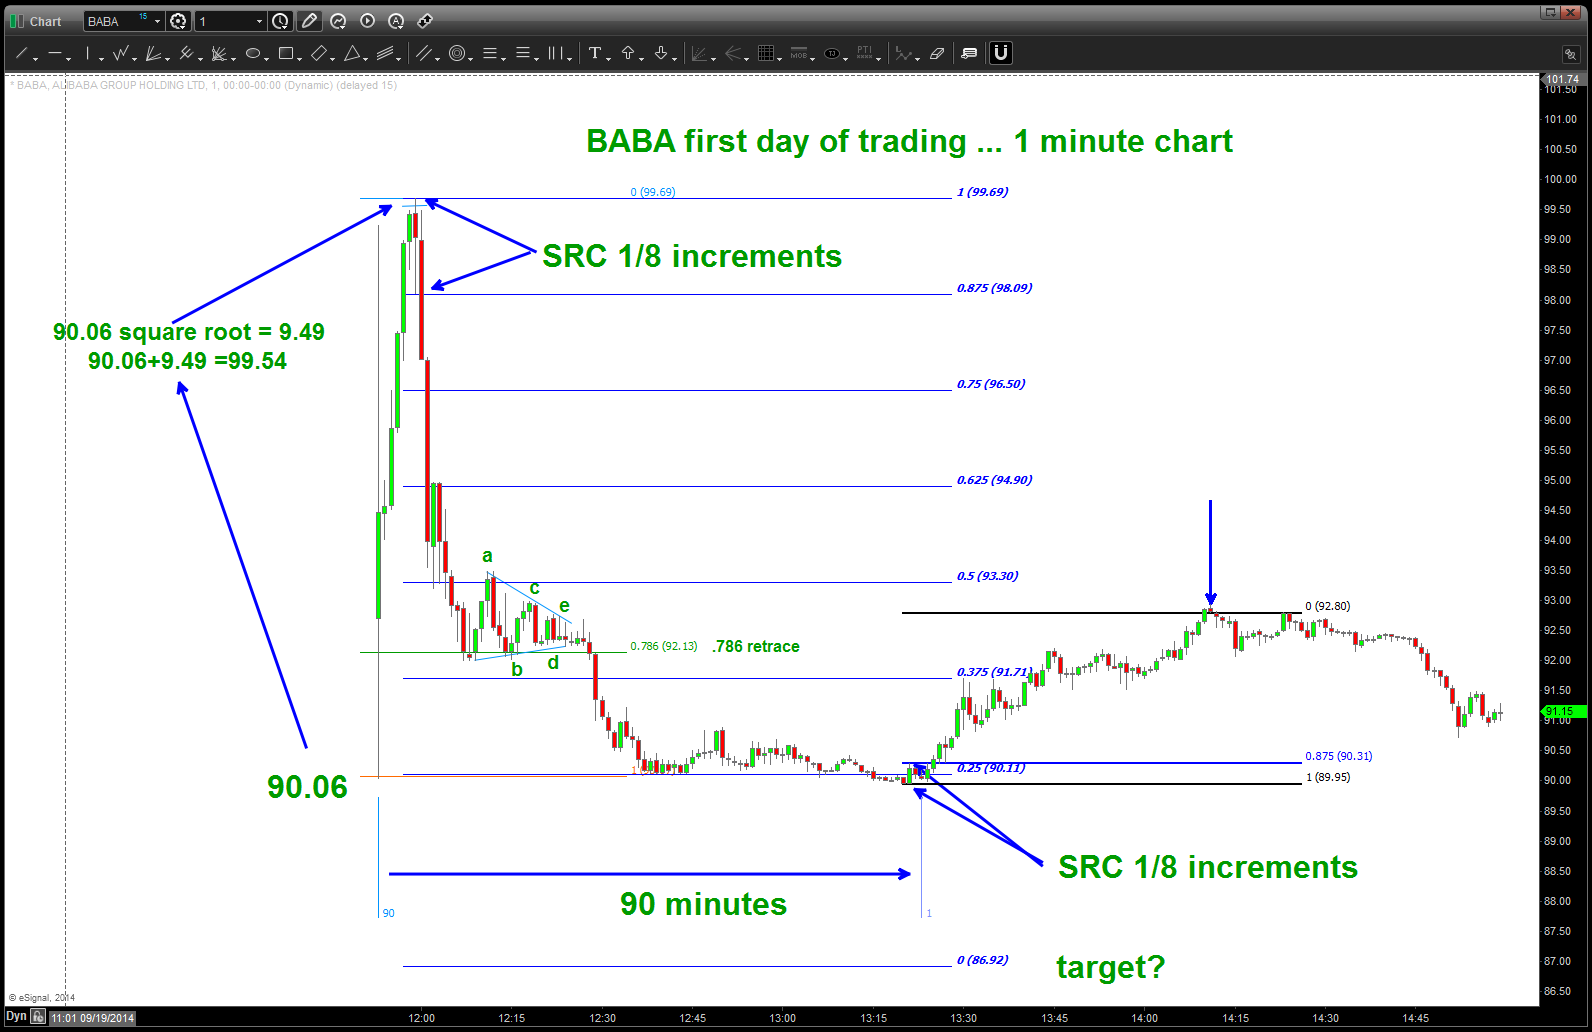
in the chart below there is a lot going on …
- the open was 92.65 but during the trading minute shown a low 0f 90.06 was made….the chart tells me.
- Square Roots and their inverse are at the root (pardon the pun) of ALL CYCLE WORK.
- this is based on music.
- the frequency of string is directly proportional to the SQUARE ROOT of it’s tension … and/or equal 1/square root of it’s length.
- there you have it — square roots and 1/square roots. THAT IS THE KEY TO EVERYTHING …
- now, if we take the square root of 1.618 we get 1.27. if we take 1/1.27 we get .786. That is NOT a fibonacci number … it’s an inverse of a square root of the golden mean … see?
- the frequency of string is directly proportional to the SQUARE ROOT of it’s tension … and/or equal 1/square root of it’s length.
- this is based on music.
- Square Roots and their inverse are at the root (pardon the pun) of ALL CYCLE WORK.
- if we take the square root of 90.06 = 9.49 and add them we get 99.54. THAT WAS THE HIGH TODAY OF BABA (ok we missed by 18 cents but you get the picture)
- now we start down and use our simple yet very powerful projection method, taught to be Mike Jenkins, of 1/8 increments of the signal reversal candle. (SRC)
- SRC – is the candle that takes out the candles that either makes the high or the low …
- now we have used blue horizontal lines to show the horizontal levels of the 1/8 increments DOWN …
- note price went thru the .5 (4/8) but bounced up from the .786 retracement and was resistance
- note price went to 1.25 (1/8) and hung out there until ….OF COURSE, 90 MINUTES AFTER THE IPO THE MARKET INFLECTED.
- so, once a SRC is made we PROJECT up and do the same thing, but this time up (the black lines). Note the BLUE ARROW. The SRC was the reason for the resistance …
Now, here’s the hard part … on this 1 minute chart we have 90,99,92 as PRICE components and those numbers are going to spin out their own cycles …our inflections will occur when multiple time cycles that have spun out from today all come together … that’s the hard part, keeping track of them.
I’m going to be interested in September 30th …
- the square root of 90.06 = 9.49 and, well, PRICE = TIME = DEGREES.
- So, something might move 9.49 degrees and if a PATTERN in PRICE is present then perhaps we’ll have a trade.
- just like we project PRICE 1.618 or 1.27 or equality we can do the same thing w/ things that move in degrees.
BABA first day of trading
additionally, below, you’ll see what we’ve shown before — the angle of ascent or descent is key to deriving the true trend lines. in this case we had a 88 degree move up and guess what … the market bottomed 88 minutes after the first trade. YES, that’s a coincidence … (?)
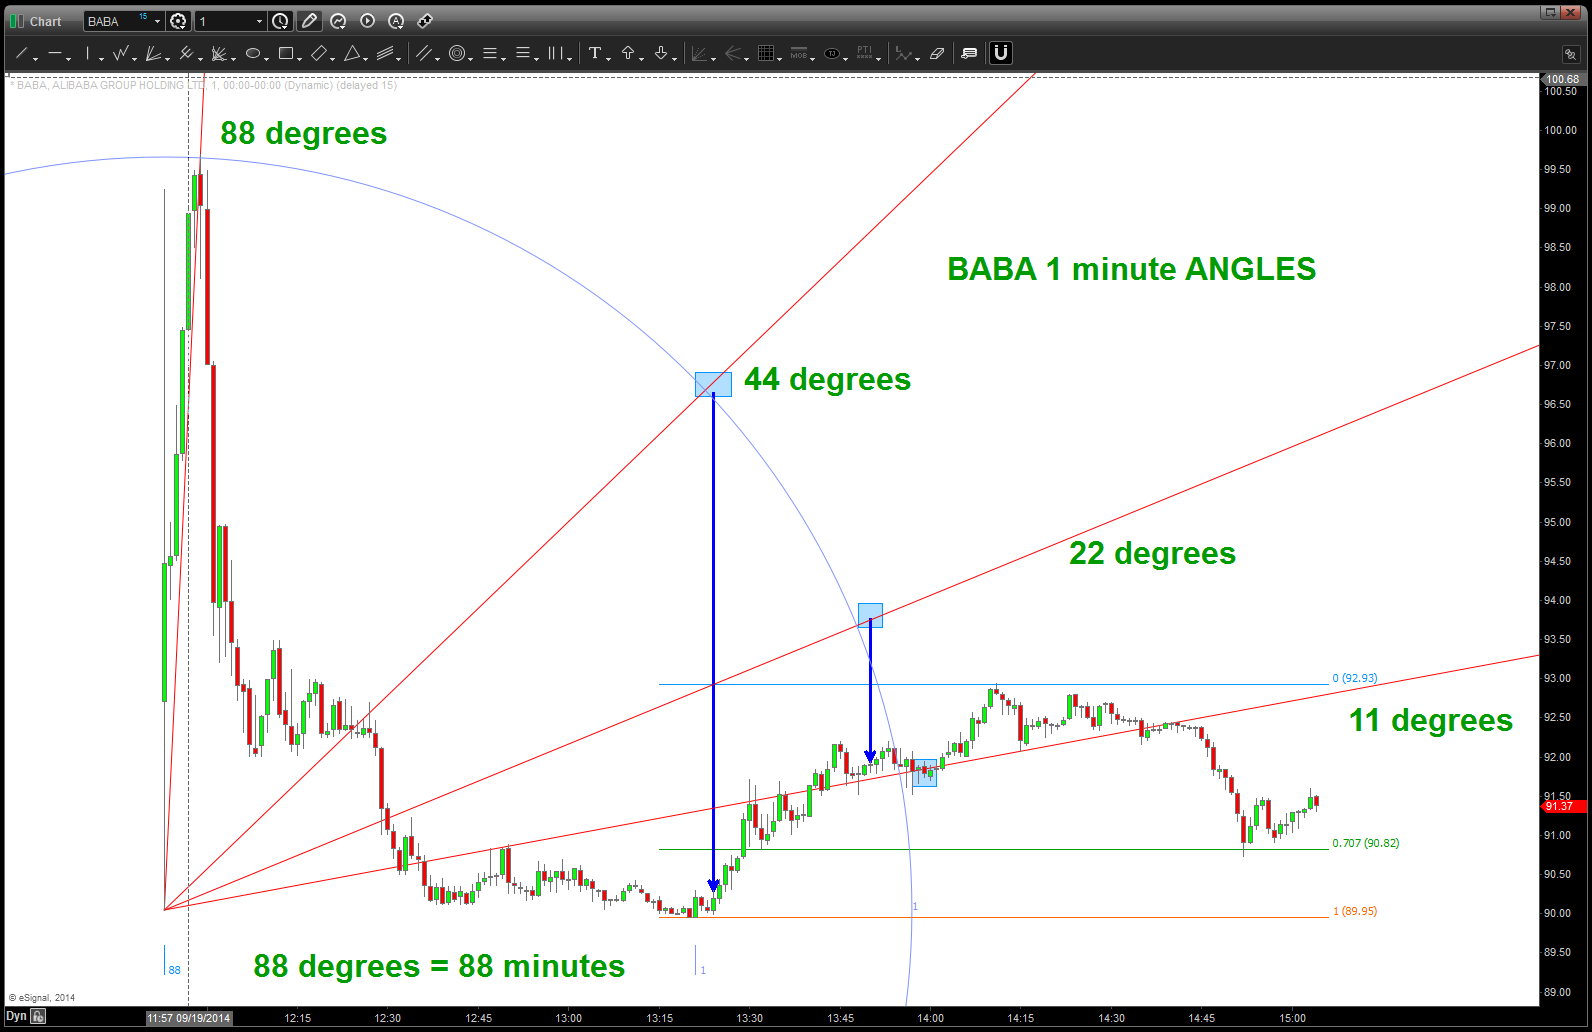
BABA angles …
one last … note the chart below. THIS FIRST INITIAL IMPULSE MOVE UP WILL BE THE ROOT OF ALL FUTURE TREND LINES AND ANGLES …
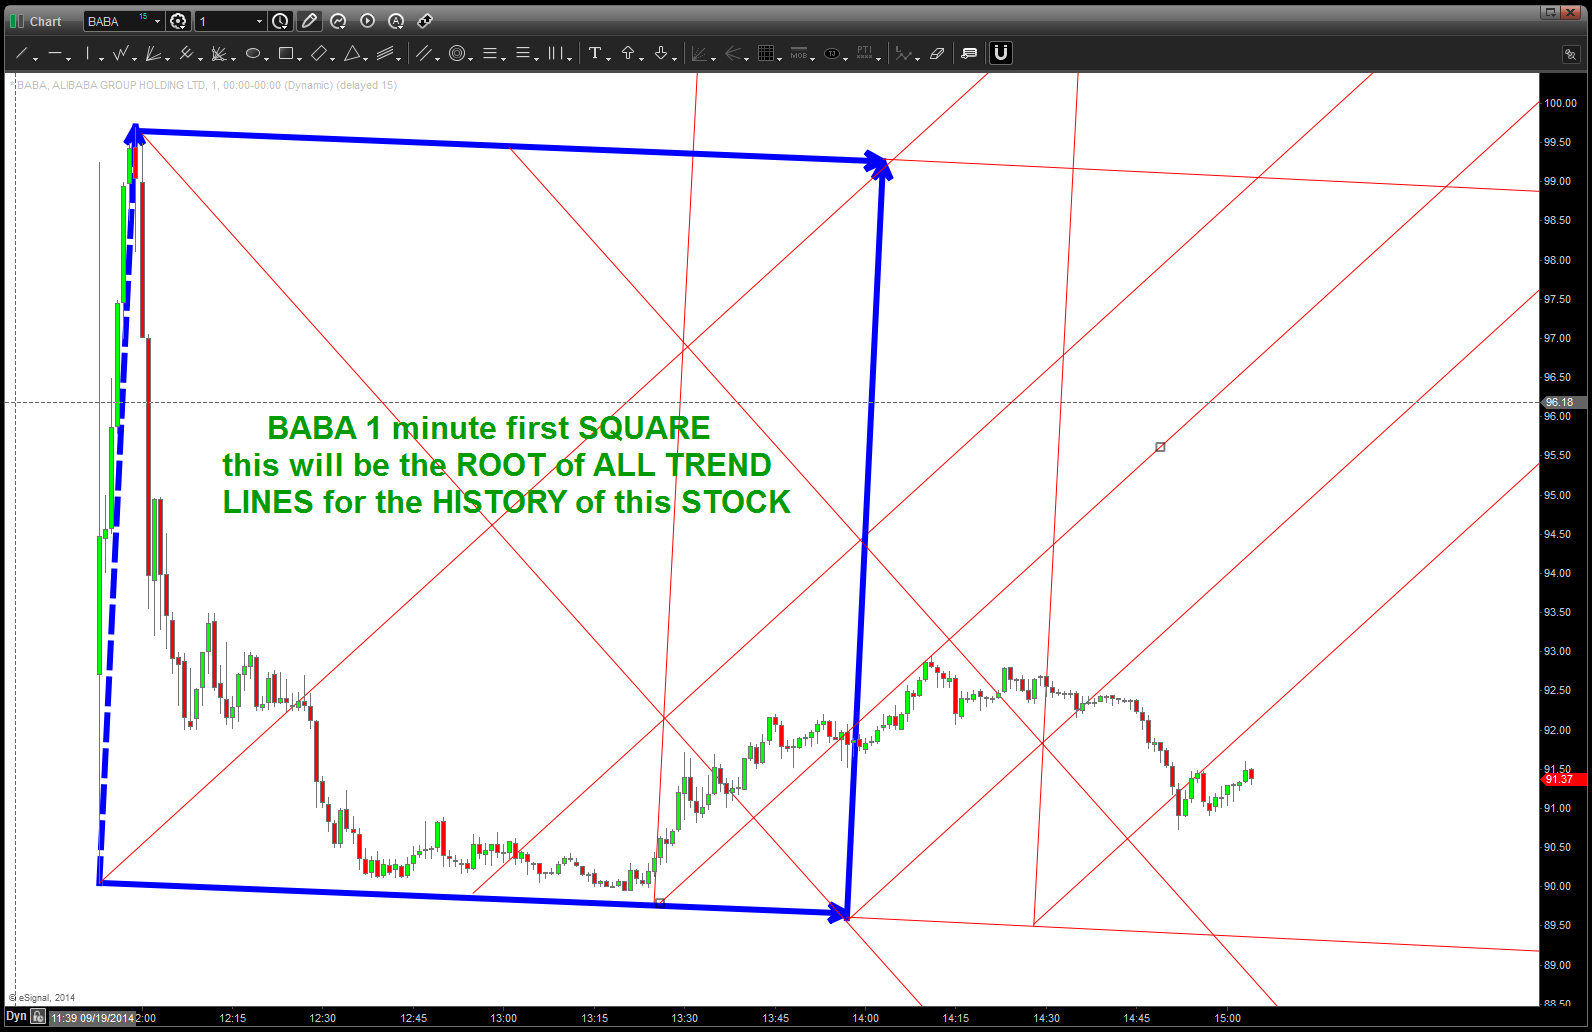
THE BABA square
ENJOY THE WEEKEND .. what an amazing country we live in and what an amazing story for the $BABA team …
rock on, ok?
