Carrier Aviation Strike Planning and Investing …
Have seen the recent TWEETS by my friend and fellow blogger JC about Gasoline Futures and, while I don’t trade it, I am interested in it so I thought I would give it a shot … let’s face it, I owe JC a lot because he got me blogging a little over a year ago. Now, gasp, I have around 250+ people who check out what I say. One day … it’s will be 2500 and then another 25,000. So, this is pretty cool …
Before I throw some Voo Doo on the page I’m going to address some of the recent flow on TWITTER about risk and how, your not going to be right every time .. period. That’s why I have found the holy grail. PATTERNS tell you where your WRONG every time! 🙂
People sometimes ask me – how right are you on your calls/trading?
Me: “100 percent”.
Them: “You can’t be right 100% of the time.”
Me: “100% of the time I have defined my risk and know where I’m wrong”
- if they don’t get it … they don’t trade
- if they do get it, then a meaningful conversation or, at a minimum, a drink or four follows.
So, why is investing/trading like Strike Planning? Because you spend TONS of time and cover the most MINUTE details and plan every thing to the SECOND and guess what? When you launch … EVERYTHING changes. I mean everything … I’ve been known to “hold court” at a happy hour or three and I could fill hours telling you some of the craziest stories about how the PLAN CHANGED as soon as wheels were in the well …
How is this like investing? Well, as your going to see below, some considerable time and brainpower was/is spent on Gasoline futures … a gameplan has been developed and it will be followed BUT INVARIABLY the ENTIRE DARN THING IS GOING TO CHANGE!
Here’s the key …
“Adapt and Overcome !!!” – the true saying of Naval Aviation
Natural Gas:
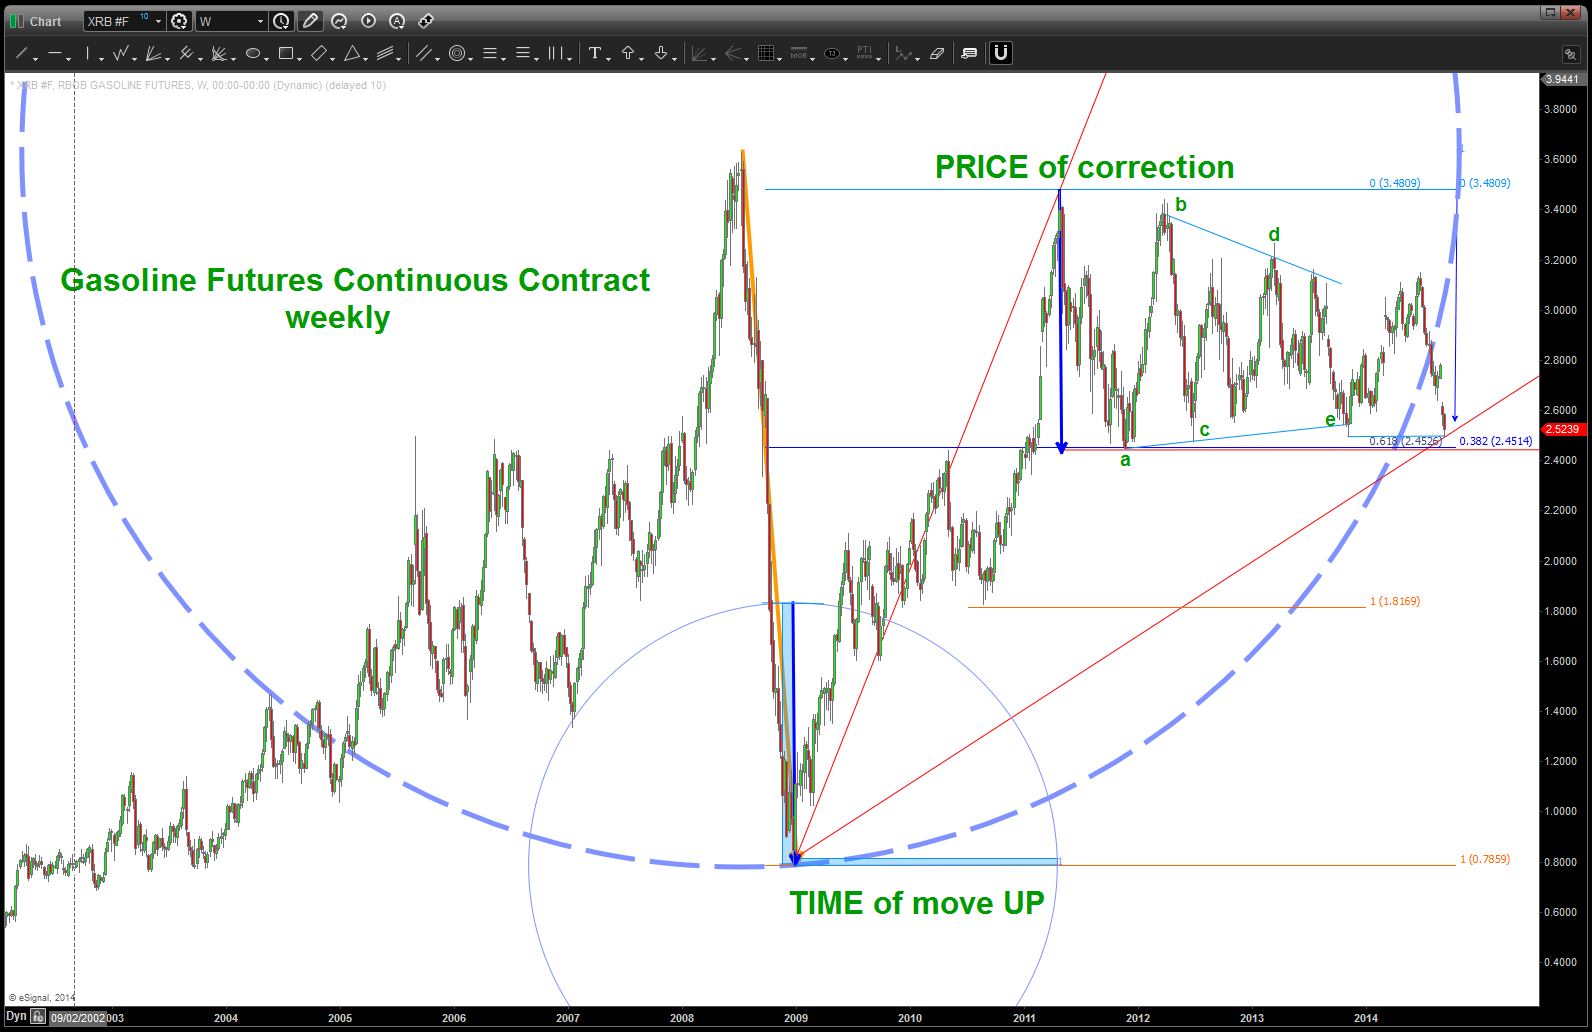
- IF we are going up THEN a case can be made that we have finished a triangle (labeled a,b,c,d,e w/ light blue trend lines and that is a continuation pattern)
- THIS IS WRONG if the most recent swing low of today goes any lower on close. If the triangle is complete, then the move up was 1 and this move down is 2 and according to the rules … 2 can’t go below 1.
- We have 3 reasons why the 2.455 held … retracements and “TCB” Taught to me by my mentor, Mike Jenkins, the TCB takes the TIME of the move up and converts that to the PRICE of the correction.
- One last, take note of the bold/dotted blue/grey arc. As you can see, the BIG MOVE DOWN was pretty violent (orange arrow) by using that move down as a radius, we can swing an arc and then use the 3 o’clock position as TIME which will represent the pyschology of that big move down has been digested and it’s time to go back up. Depending on the thickness of the bar and exact geometry it can be very powerful. All were trying to do is say it’s either “now” or “soon” that the move DOWN has been digested in TIME …
Nat Gas BULLISH case
Now, go down to a daily and the KEY HERE IS THE MOST RECENT HIGH at 3.1500 WENT UP TO THAT HIGH! Folks, that’s a classic B wave (3 waves in a B wave) and what follows is a devastating 3rd wave. IF this analysis is correct then the C wave of the A-B-C correction should be ending here/now. (note it’s exactly 2.71828 *a which is the natural log and basis of the pyramid geometry – I digress)
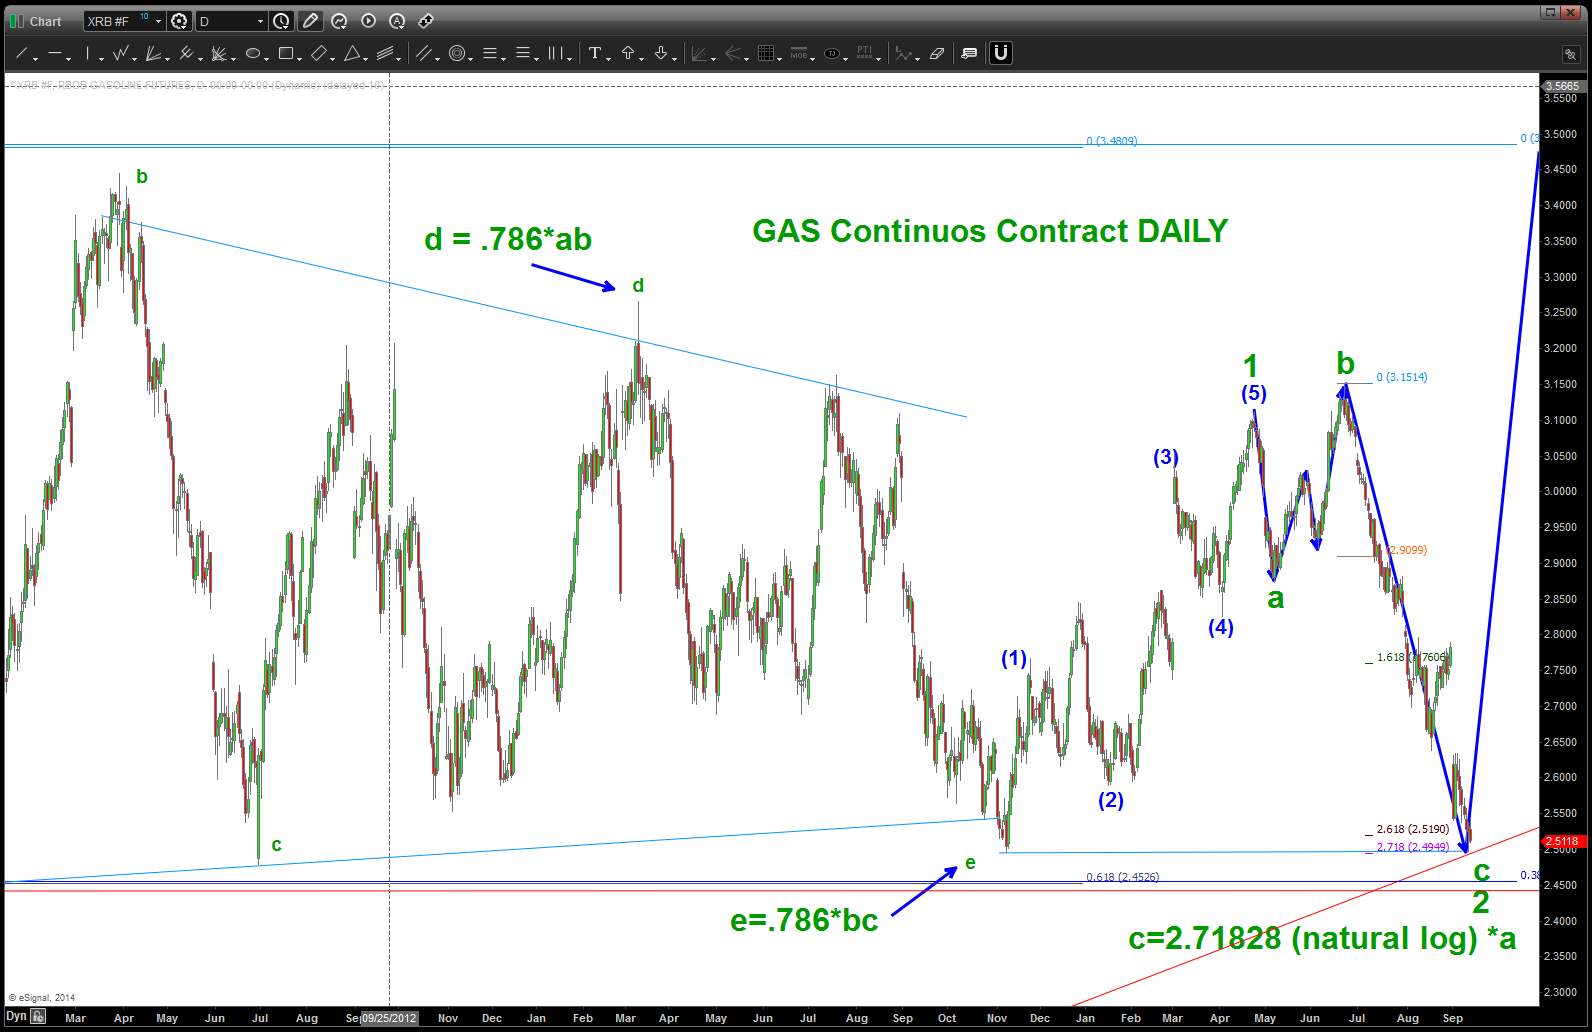
GASOLINE FUTURES continuous contract – DAILY
so, what’s going on down in the trenches ..? here’s the 5 minute chart –
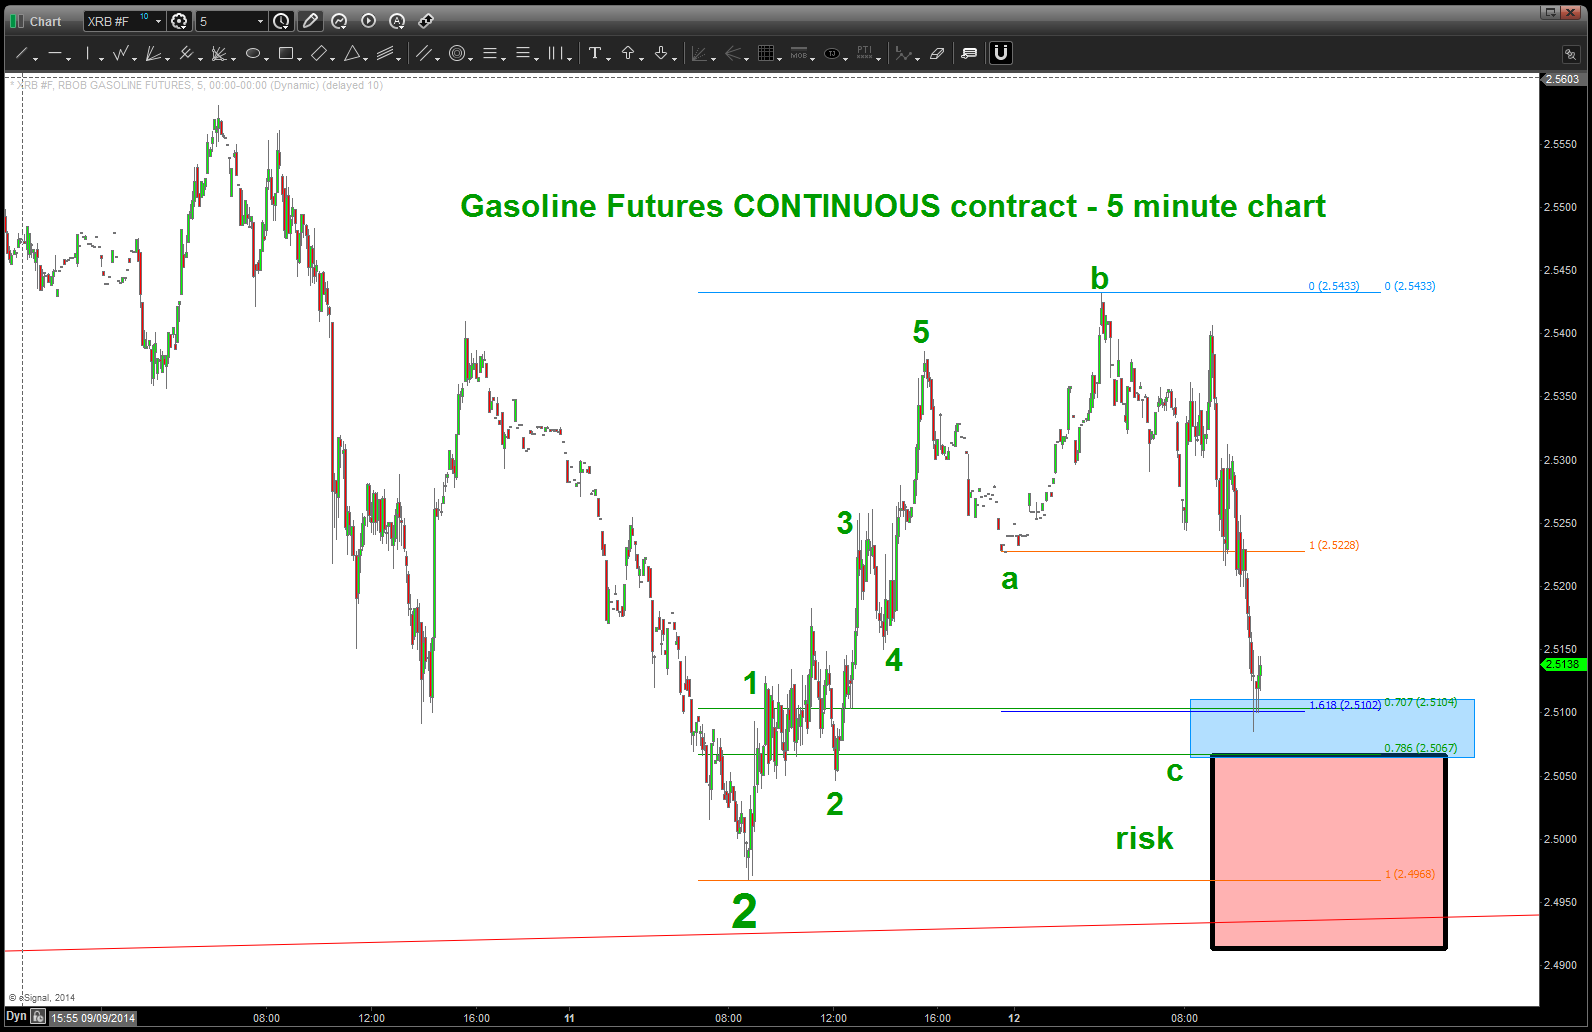
5 minute chart
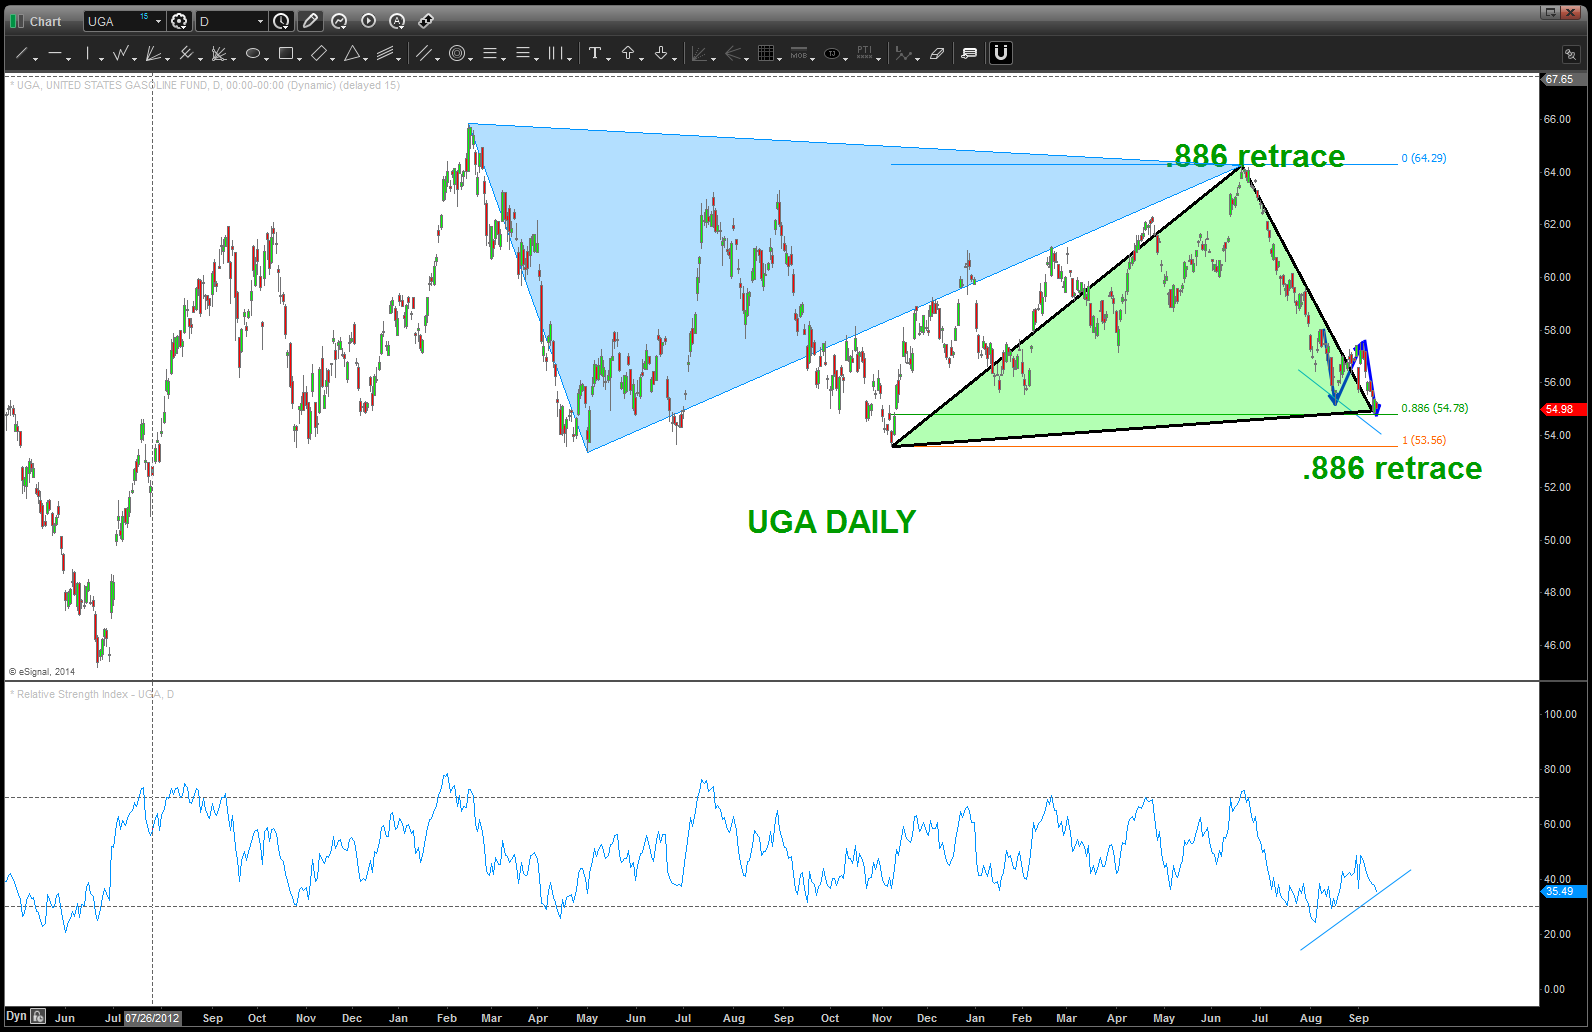
UGA DAILY
there you have it … a red box of risk. take it or not ….but either way, as soon as you enter the market, everything is going to change because every market moment is unique.
rock on, ok?
have a good weekend …
PS — this could be totally wrong and, well, that’s OK w/ me because we have defined the risk. Do you think this aircrew expected to be flying along, hanging out and have his WSO eject and leave him w/out a canopy? Probably not … 🙂

buy me a martini and I’ll tell you the story on this one …

Awesome. Always know the downside going in and the upside will take care of itself.
THANKS Guido! Make it a great weekend … do you remember that canopy falling off?