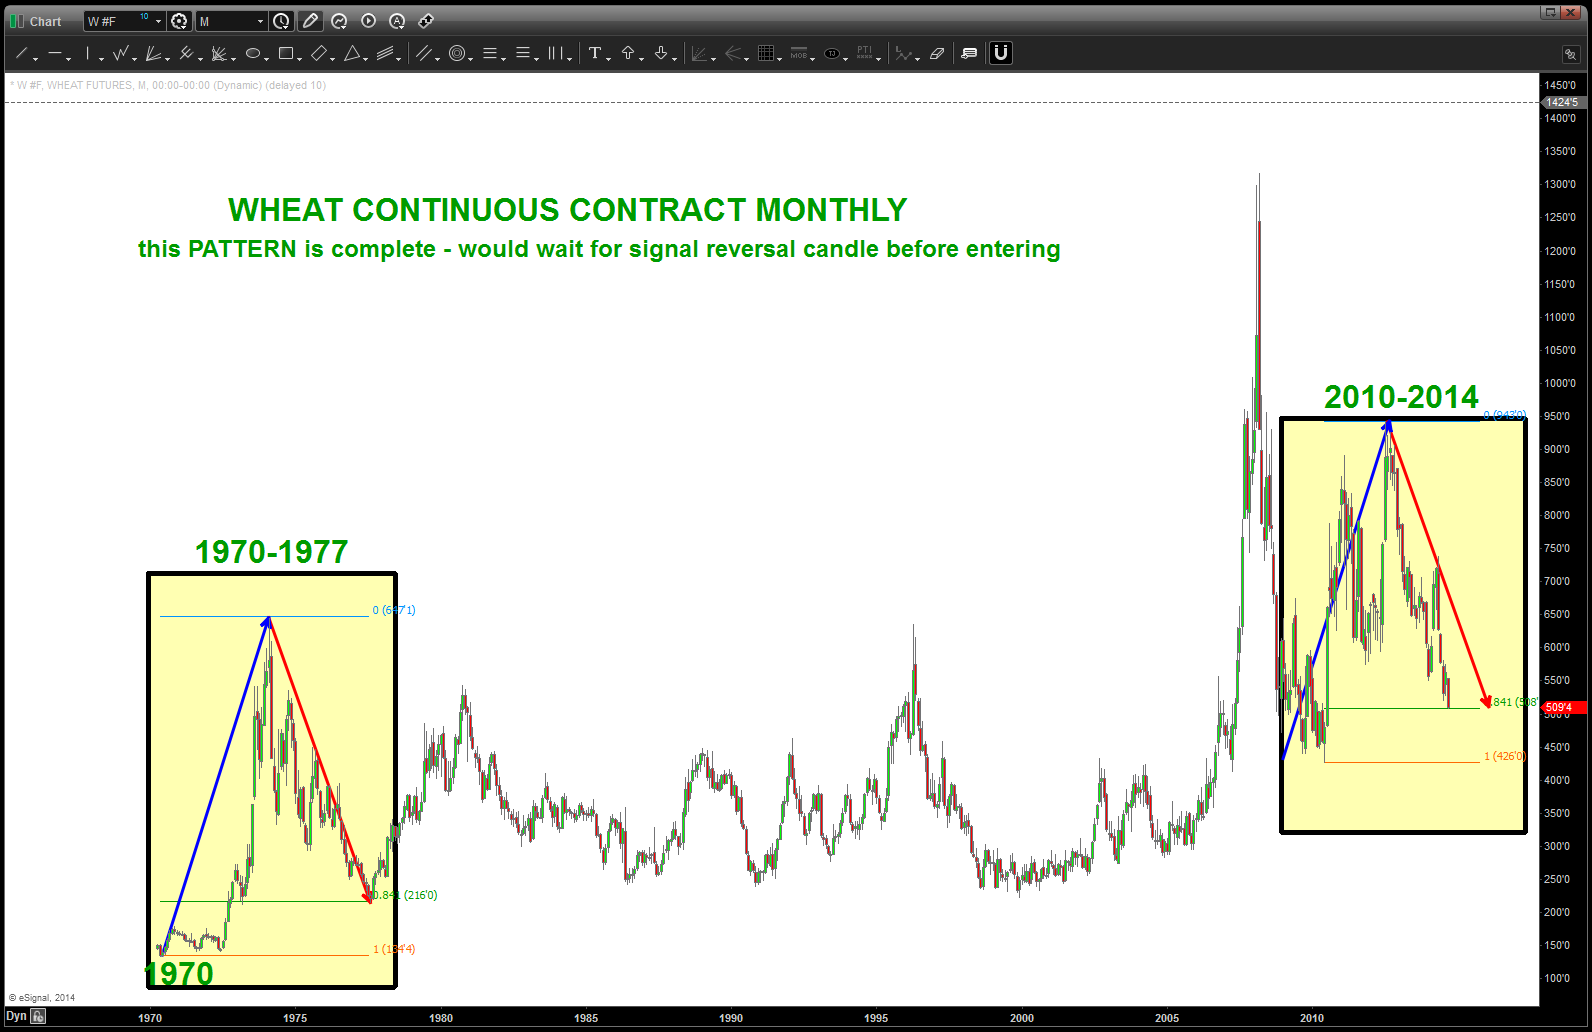
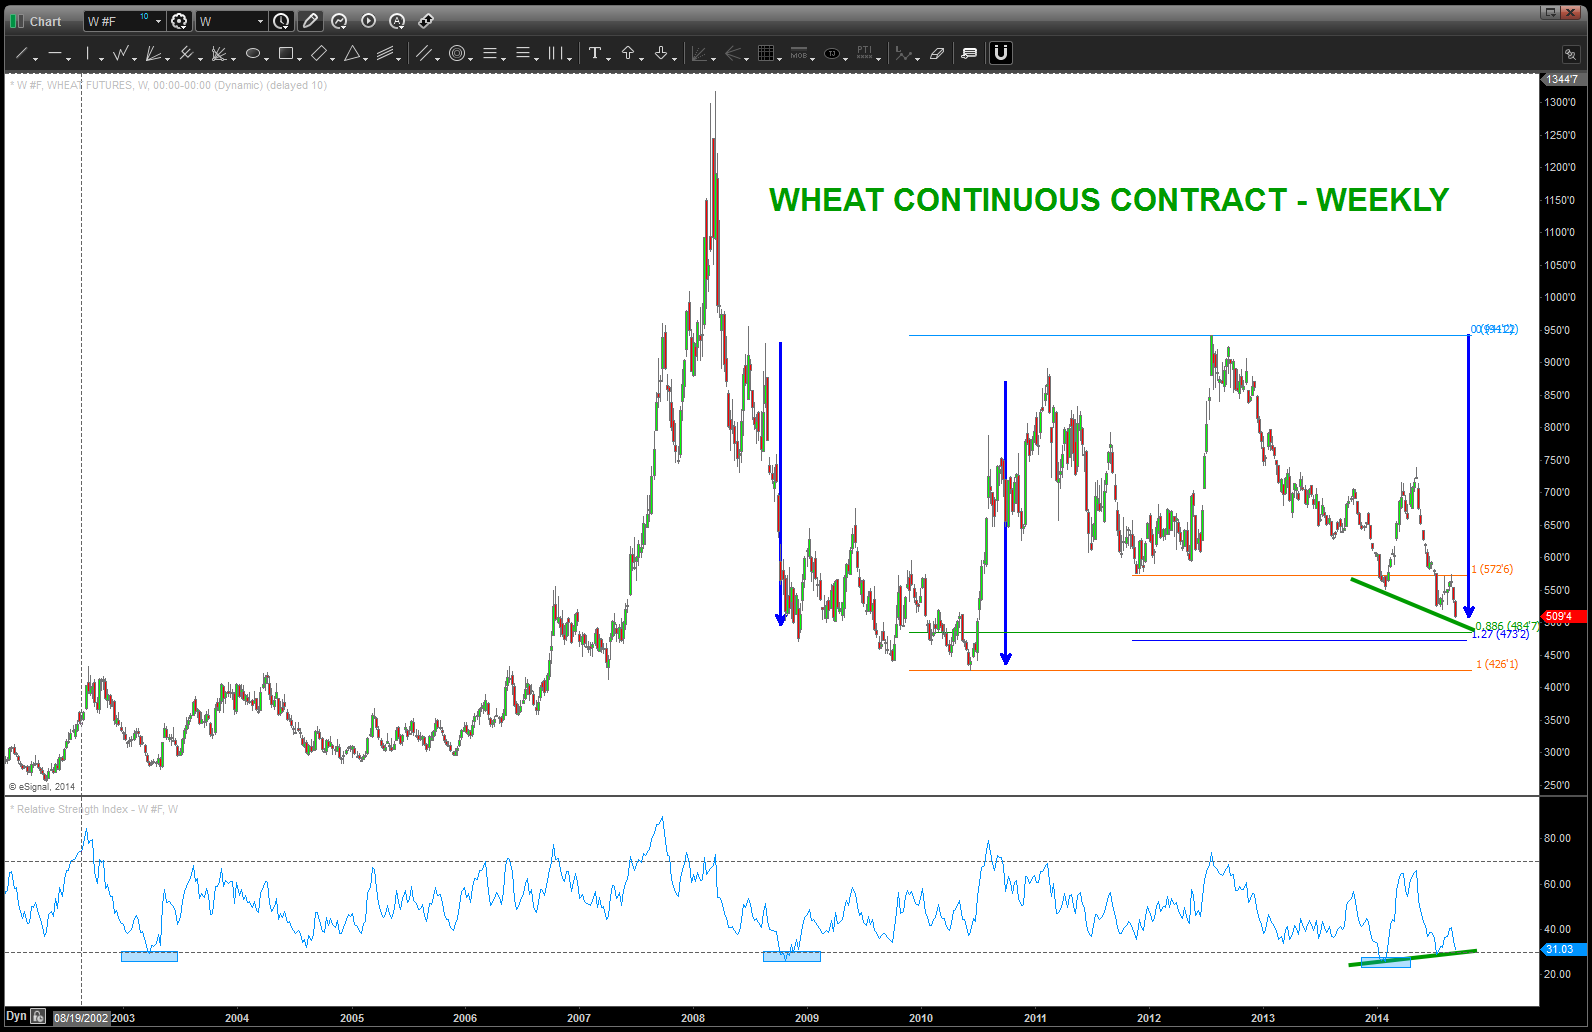
Wheat – pattern from the 1970’s complete
CLIFF NOTES: charts below show the SAME PRICE PATTERN from 1970 is complete … we do have some pretty BIG candles going into the level so “waiting” and letting the market prove it is advised. That being said – we have bullish divergence on a weekly basis and we have a PATTERN complete so put on your radar screen. If we go thru 473’2 then believe this PATTERN is toast.