why we need to watch the Japanese Yen …
Posted on November 8, 2014 2 Comments
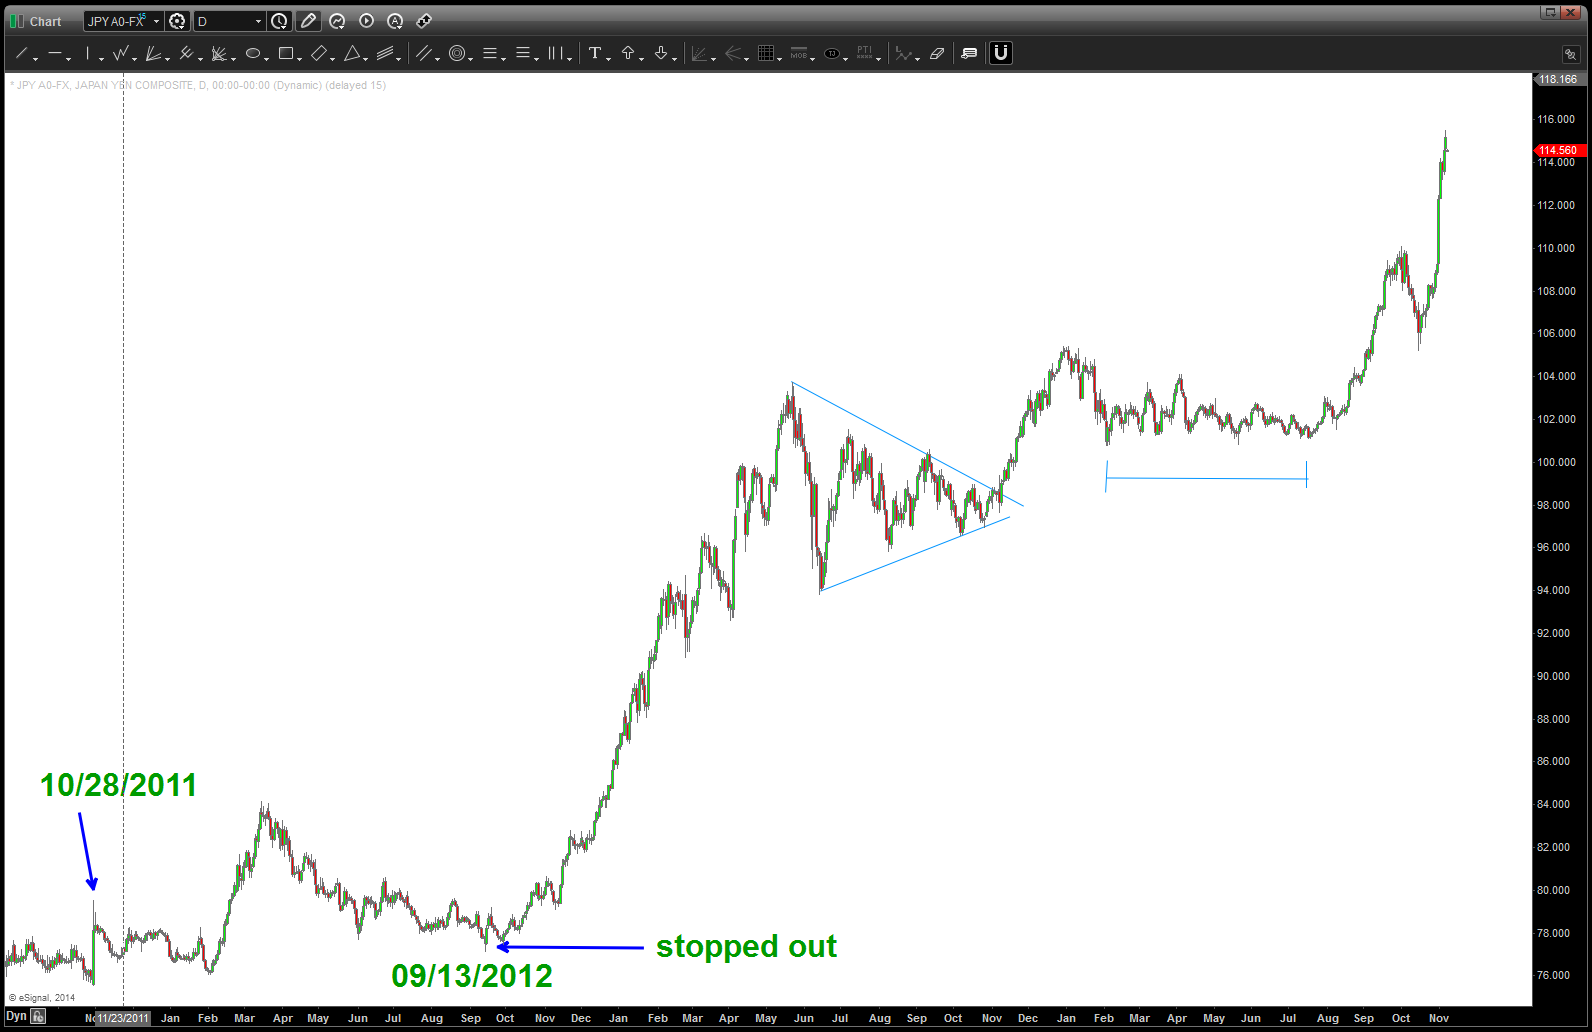
full disclosure … check out this chart below. this is where I was stopped out of a LONG USD vs the JPY.
this game is really hard, if you make it. As my mentor and friend Larry Pesavento says – “trading/investing isn’t hard, but it sure isn’t easy.” I was pretty cocky 7-8 years ago when I was sitting in Larry’s trading room. I asked him “what do you consider a good month?” He sat back, looked at me and stared me directly in the eyes and said “if I make 1 cent.” I laughed … little did I know that one sentence was the most profound statement I would here ….. no kidding.
so how do you get in this move … ? well, you WAIT for the opportunity to come to you. If you look at the line in the sand – 10/28/2011 – you’ll see the “SEED DNA” that started this move. The entry to get in the move occurred roughly a YEAR later …. the triangle shown below was 6 months in the making. the consolidation was 6 months in the making …
so, let’s take a step back and simply allow the YEN to come to US.
where are we now?
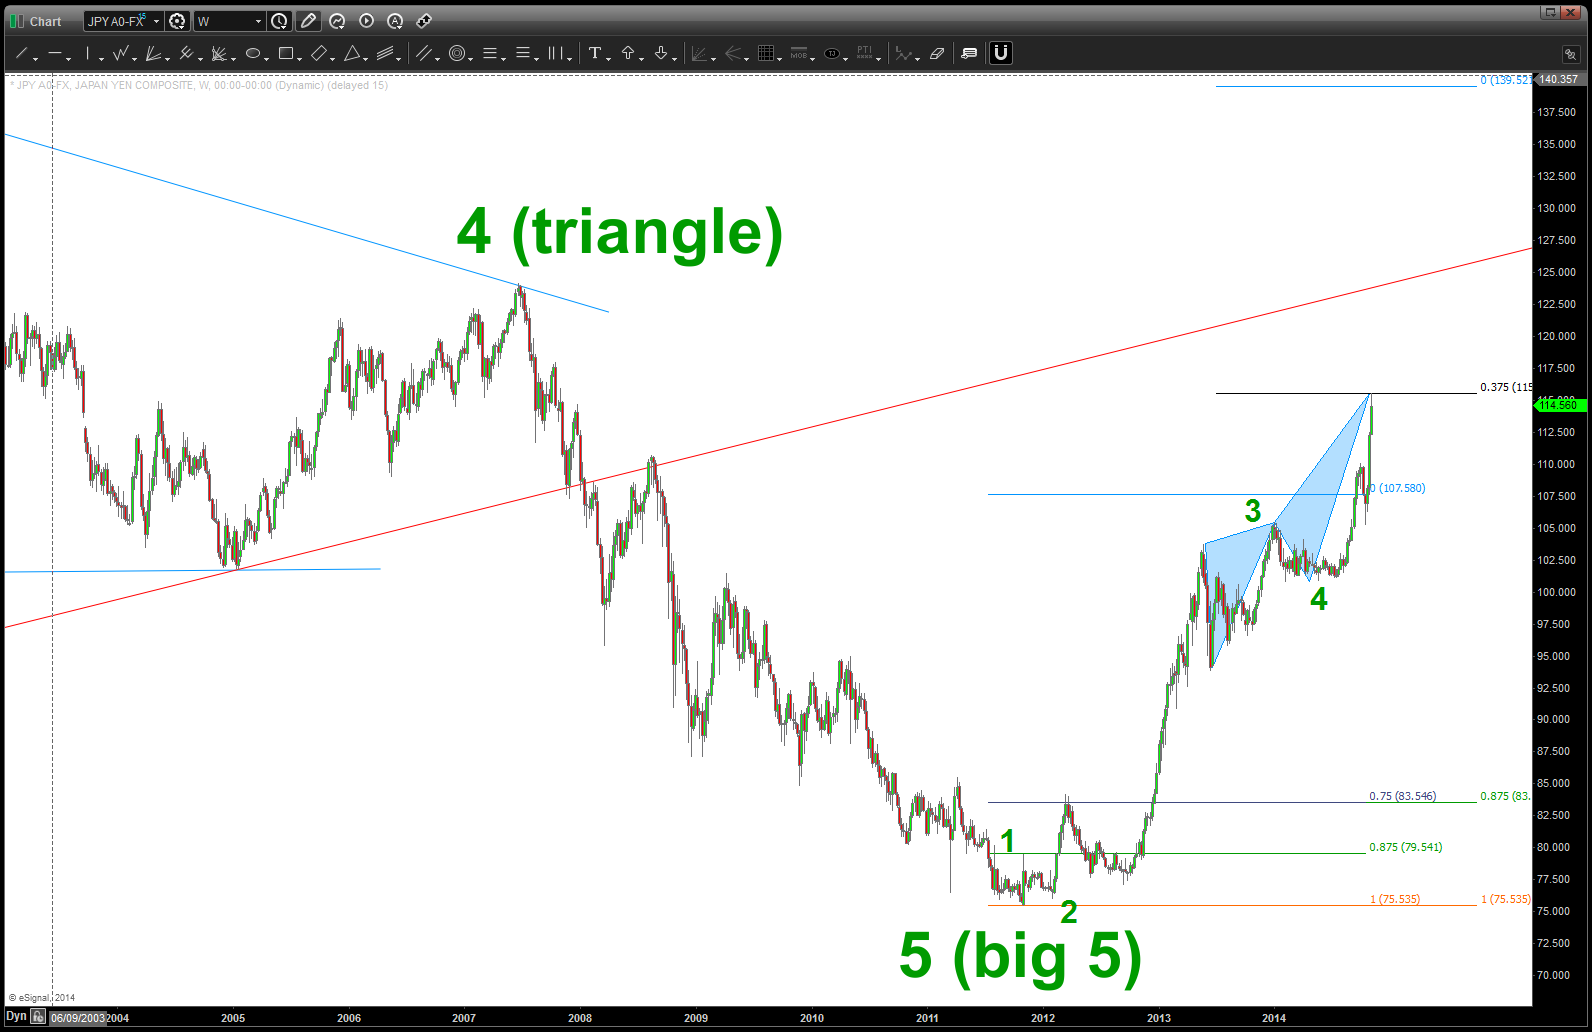
- the low on 10/28/2011 was a big old 5 waves down from the HIGH in 1972. We have TONS of room to go ….
- sure looks like we are in the 5th wave of the first wave UP in this market. So … I just can’t go LONG $$$ vs JPY yet. Have to wait ….here is the picture
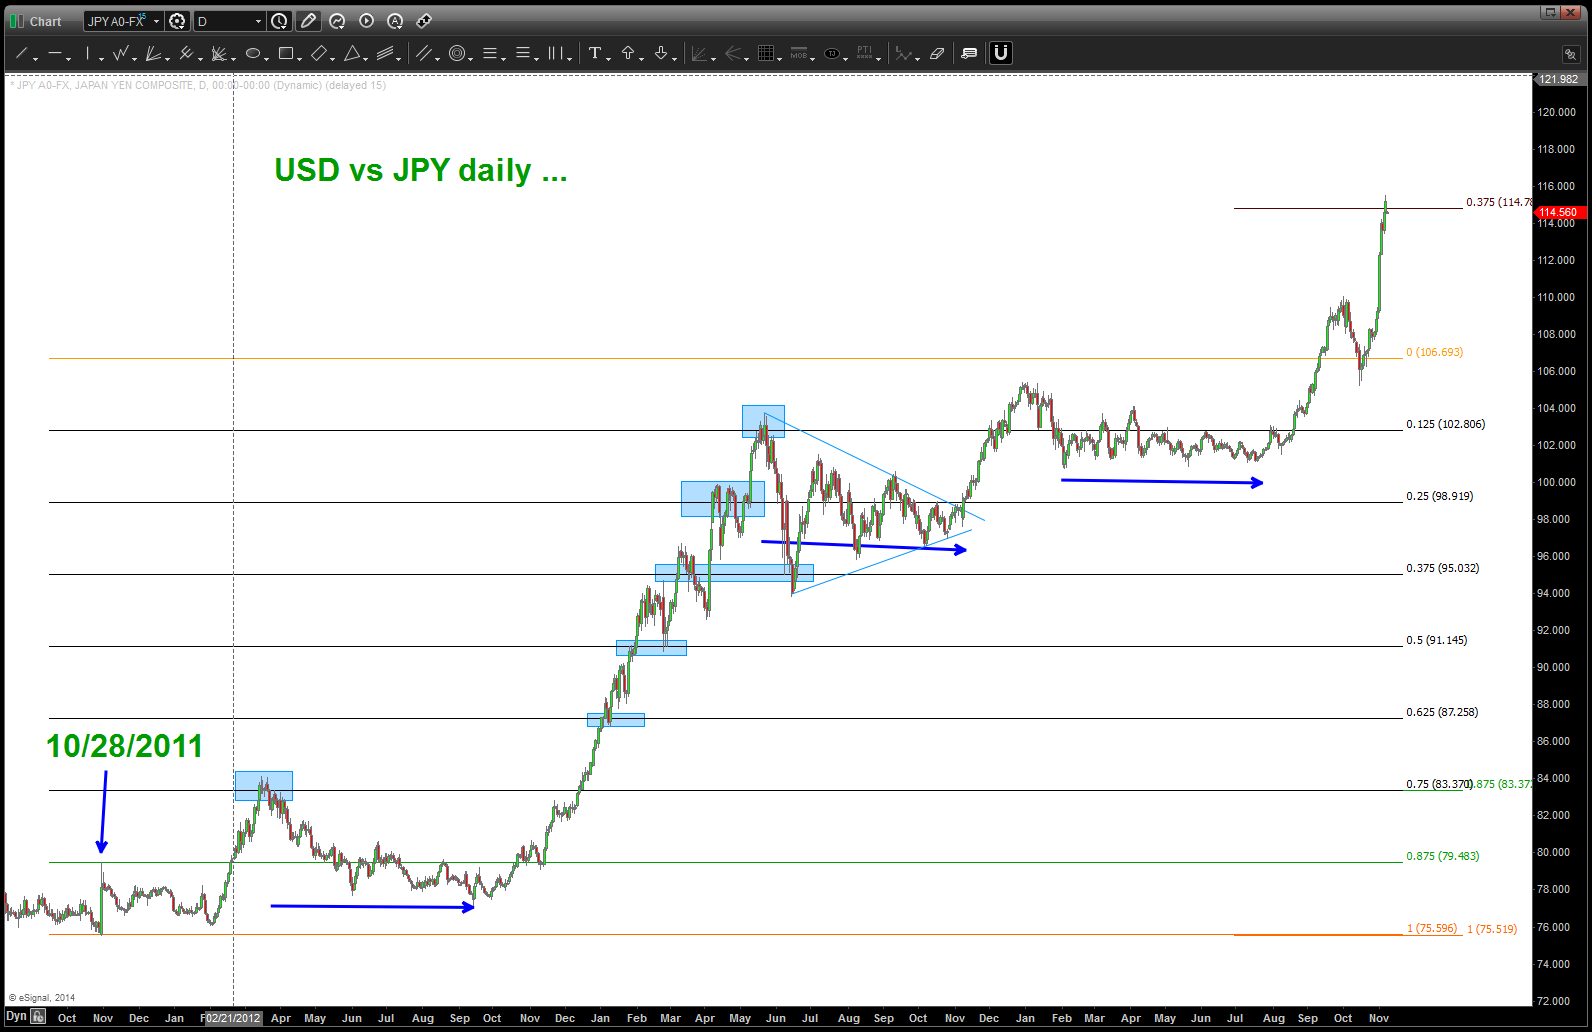
I see a 5th wave in progress w/ some serious thrust telling me this 5th wave is going to extend. Note, used the POWERFUL technique of the 1/8 subdivision (work w/ me – it’s musical and based on sacred geometry) and we just hit the .375 (3/8) subdivision. This was taught to me by Mike Jenkins of http://www.stockcyclesforecast.com) and is one of the most powerful projection techniques out there …
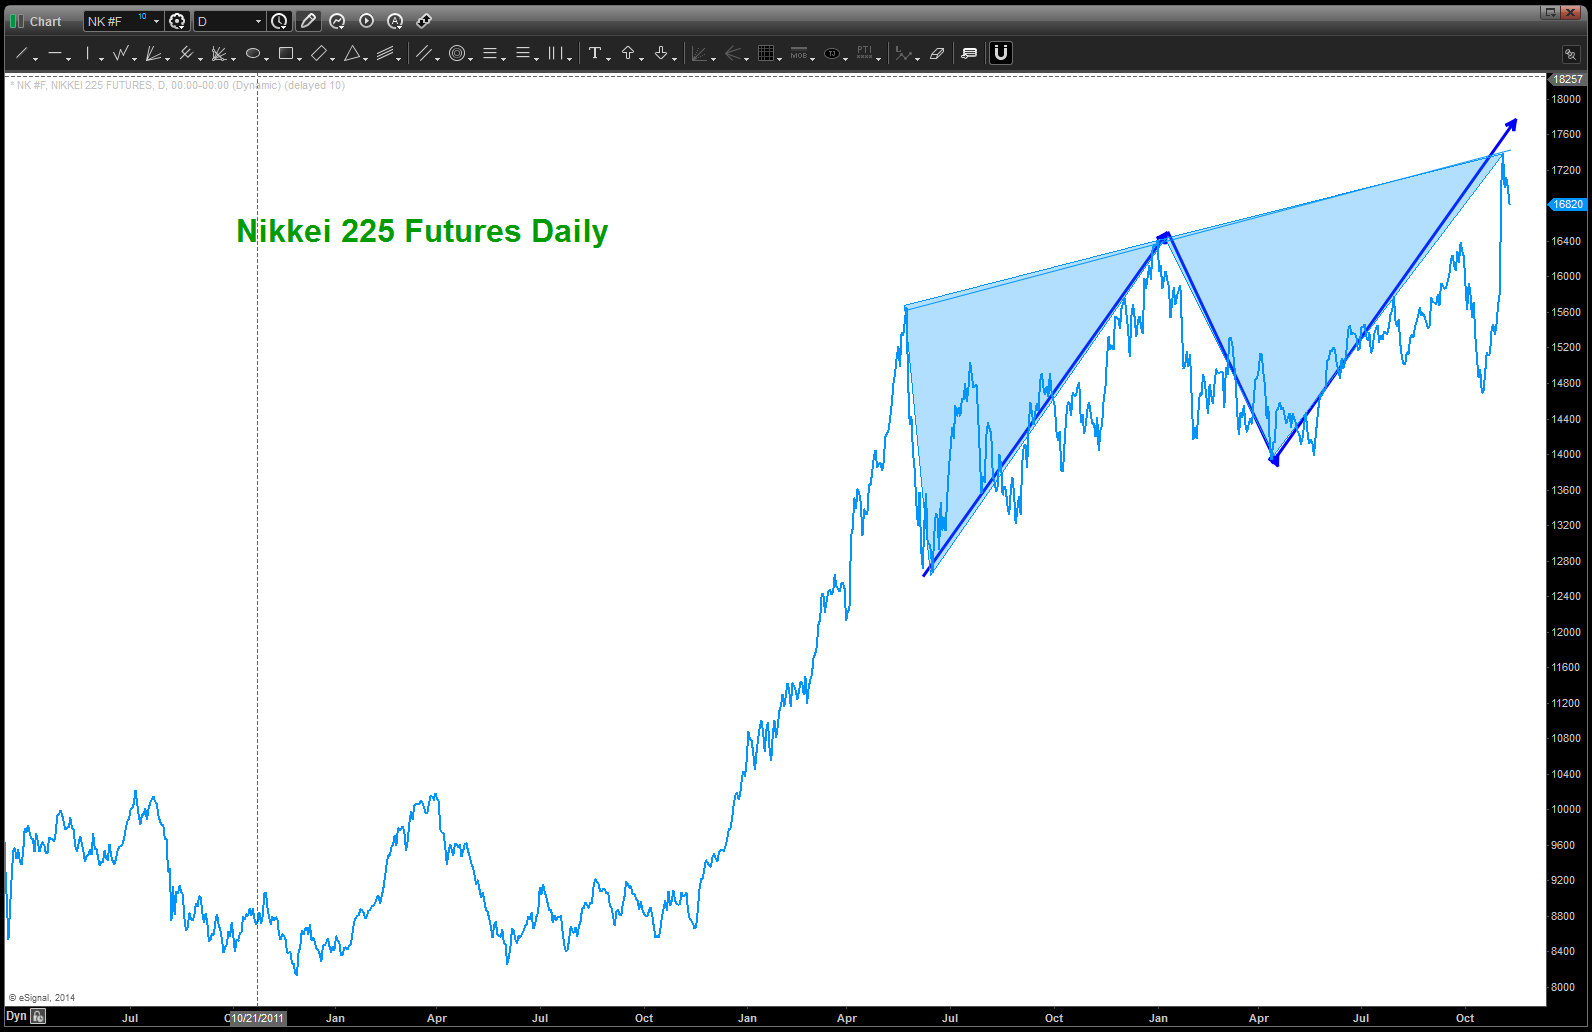
so, now, we take a look at the Nikkei 225 …. a 3 drives to a top is present:
so, why are we doing all this work? Well here’s the cliff notes folks, as described by mentor and friend Larry P:
- Last Friday, the BOJ unexpectedly boosted its annual target for expanding the monetary base to 80 trillion yen from 60 to 70 trillion yen while Japan’s Government Pension Investment Fund, which holds about $1.1 trillion in assets under management, increased its allocation to Japanese and overseas equities to 25% each, up from 12% each, and cut down its domestic bond allocations to 35% from 60%. [BOJ Boosts Japan ETFs]
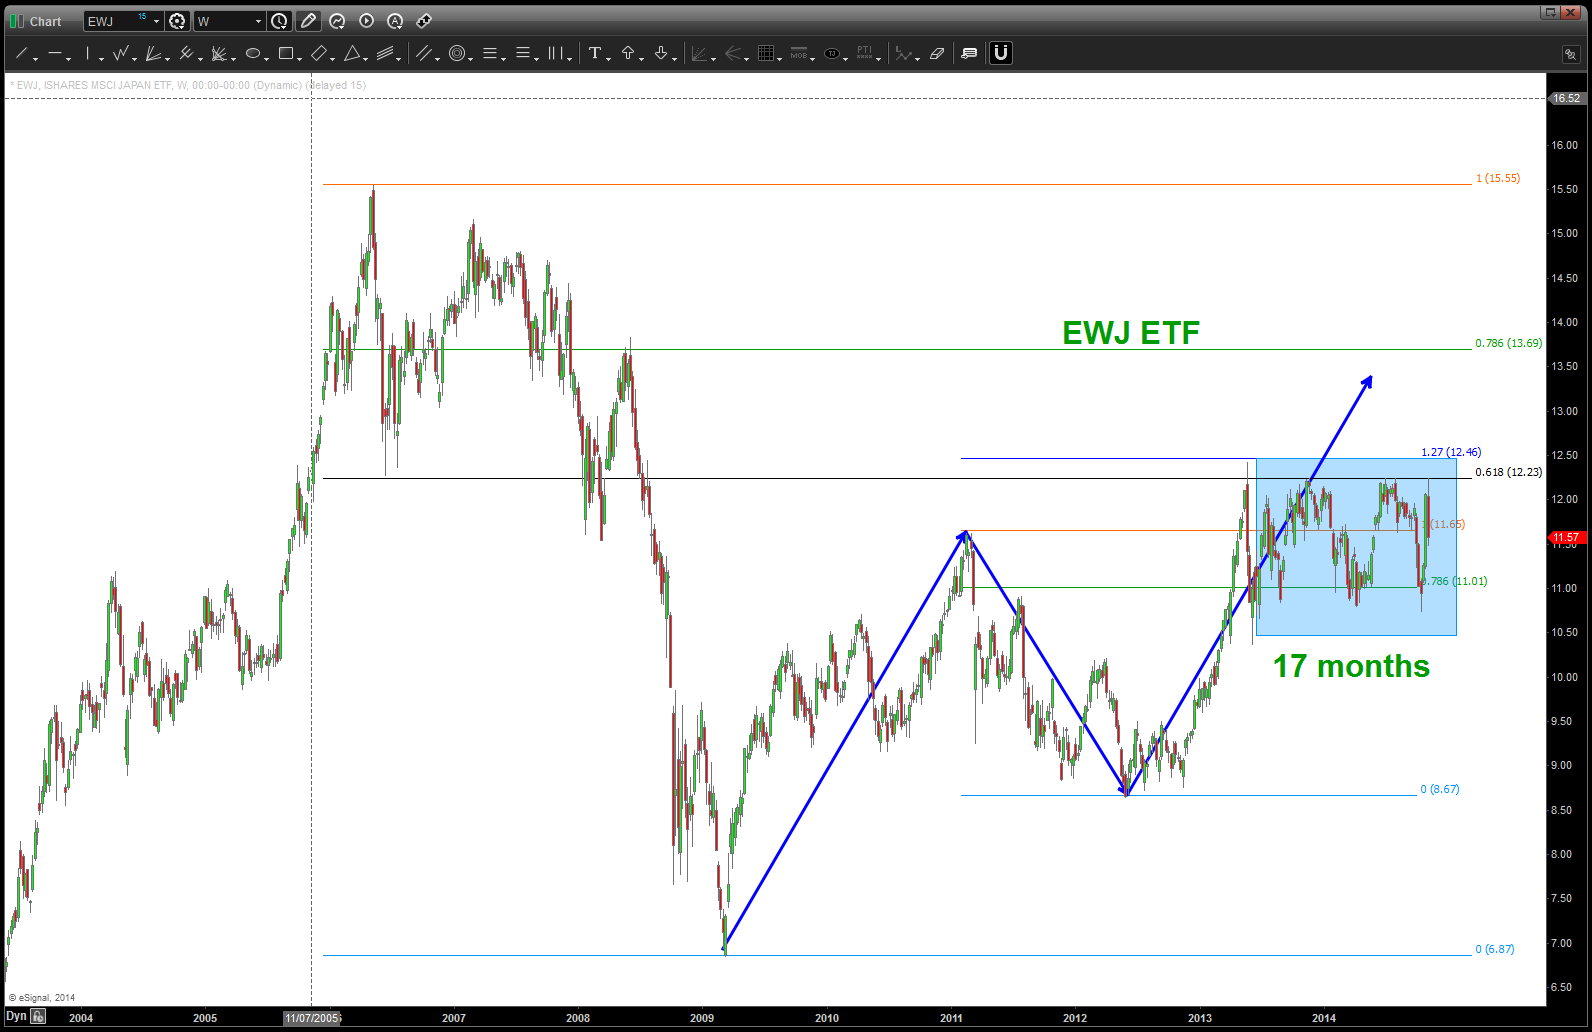
- On their own, each announcement would have been likely to drive some new cash to Japan ETFs. In tandem, those headlines have stoked a massive amount of inflows to an array of Japan ETFs, including the largest listed in the U.S., the iShares MSCI Japan ETF (NYSEArca: EWJ ) .
- Since last Friday, EWJ, the largest single-country ETF, has added nearly $560 million in new assets while volume has frequently been triple or quadruple the daily average, according to BlackRock data.
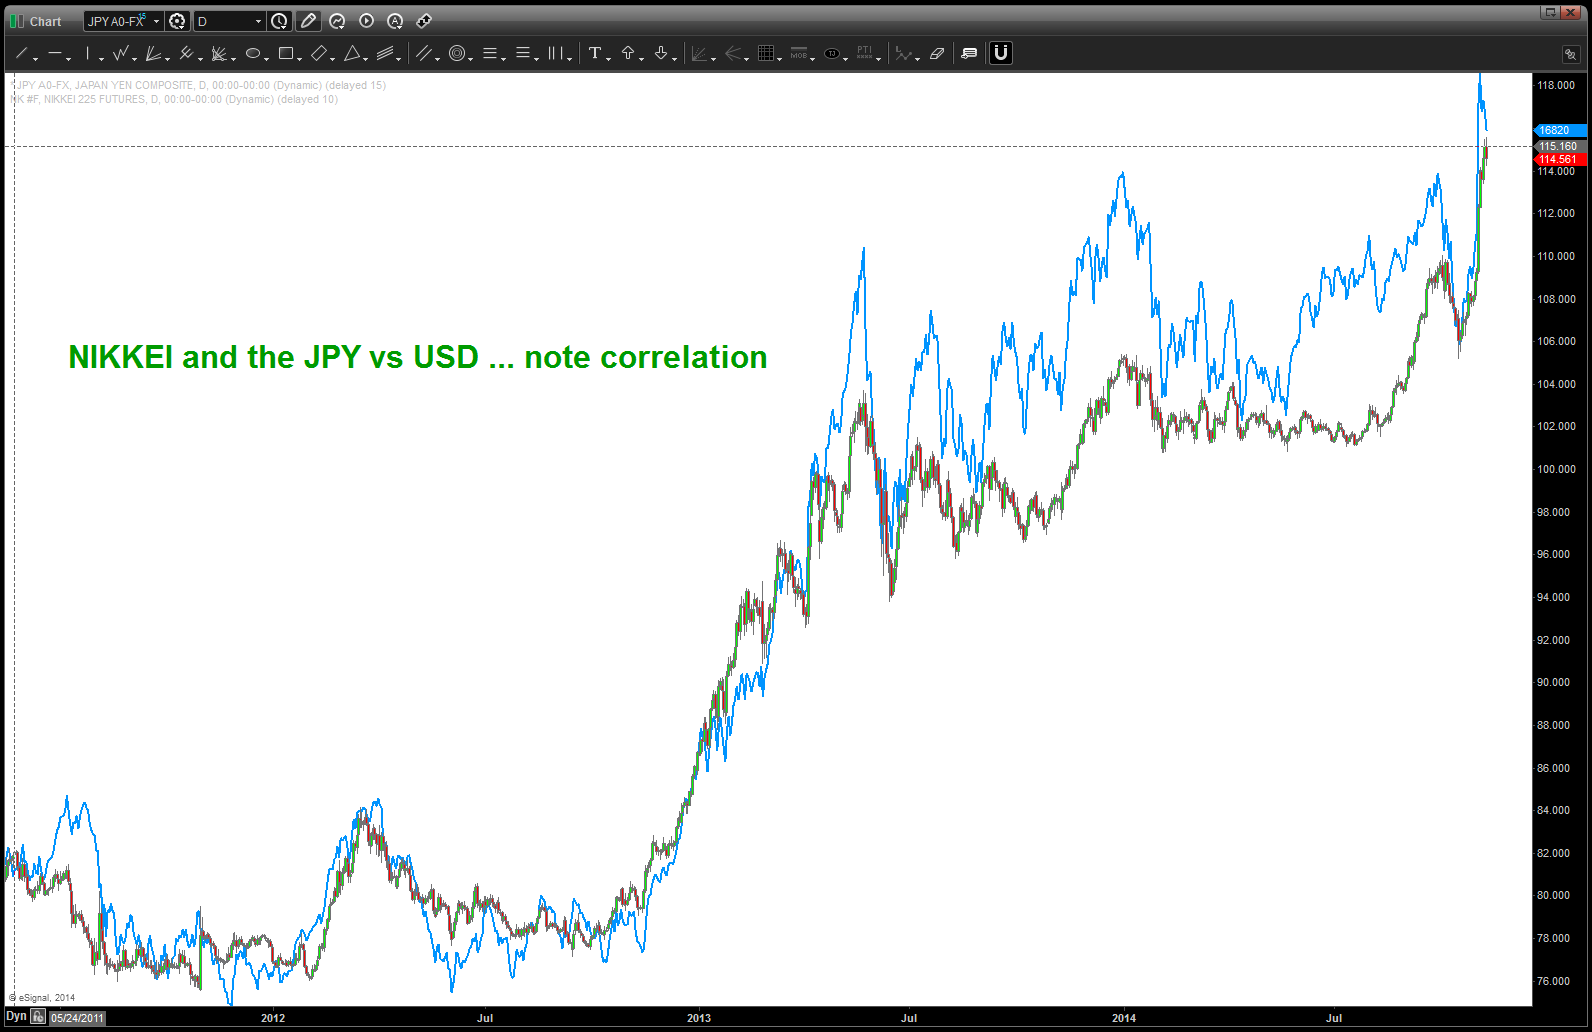
- This unprecedented move places the Japanese people in a precarious situation. Should this SELL OFF it most probably will bankrupt the country. Frankly, nothing surprises me these days but something happened very unusual in the Japanese market this week. Immediately following the announcement the ETF for Japanese shares E WJ spiked up as the Nikkei Dow was rising. Then after one day it collapsed and went below the September lows.
- This is highly unusual because this should correlate about 90% of what happens with the Nikkei Dow. Everyone that bought these ETF shares is now at least 10% or more underwater and as you can see by the three drive to a top pattern in the Nikkei Dow on the long-term weekly charts it can get quite scary from these levels.
Folks … batten down the hatches. The BOJ went “all in” and the outcome (I DO NOT know which way it will go) will be incredibly important on the global stage ….
continue to make it a great weekend …
Bart
OK … just put on ECHOES from 44 years ago – PCLN is DONE
Posted on November 7, 2014 Leave a Comment
an amazing day today … but tired.
a picture paints a thousand words … enjoy ECHOES Pink Floyd as you STUDY the PATTERNS on this short. LOOK OUT BELOW .. (I think)
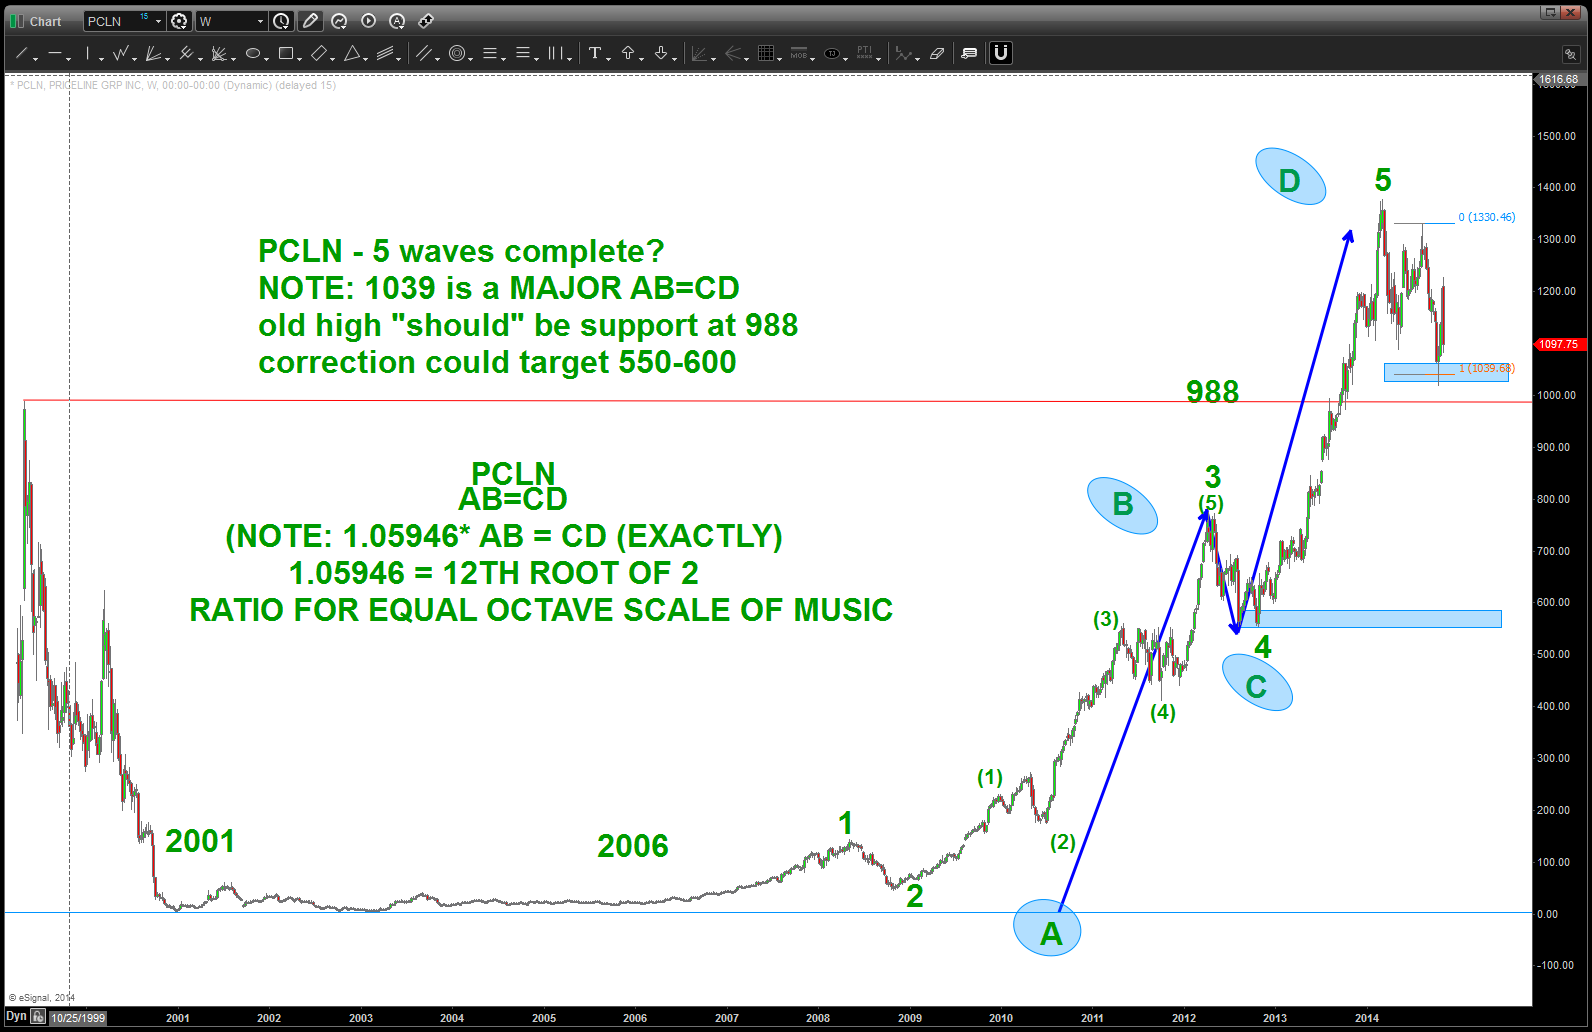
NOTE … weather this is a “c” or “3” w/ regard to this stock – the move developing right now is going to knock your teeth out. just saying …
IWM — checkmate (but crank up Dark Side of the Moon and a glass of wine before reading)
Posted on November 6, 2014 Leave a Comment
IWM …
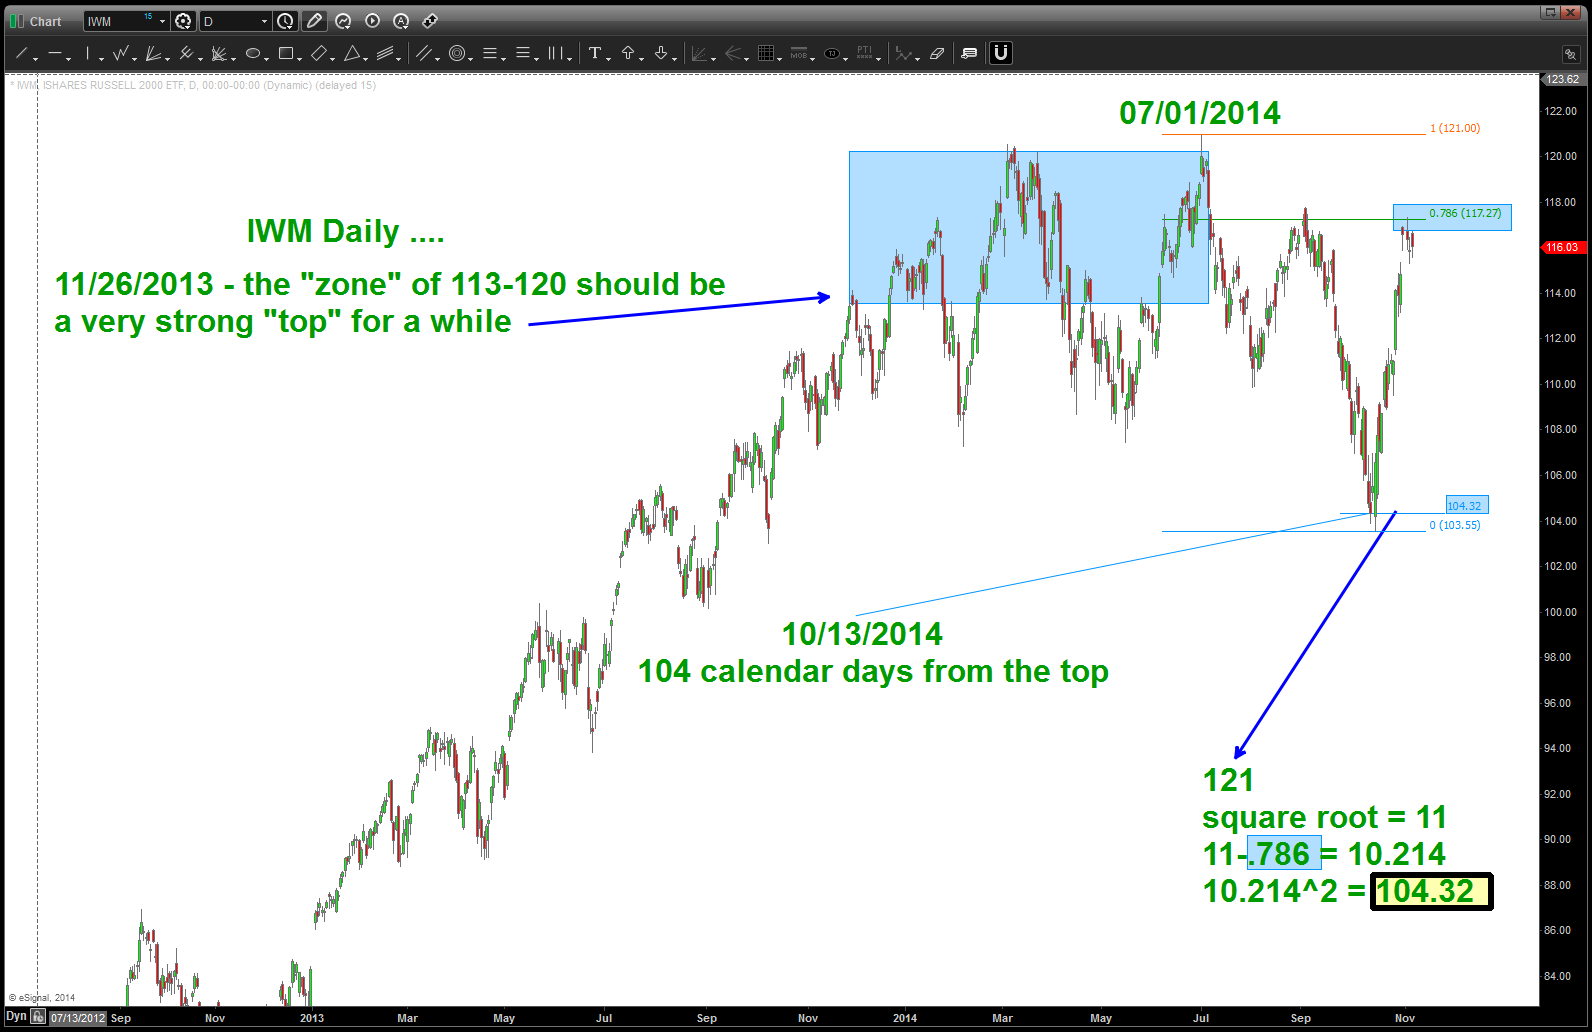
so, in October of 2013 (yes, more than a year ago) I was beating the drum of a very important top forthcoming top/target zone in the IWM. (An ETF of the Russel 2000.) See below the double line area …
The zone depicted from that post in October 2013 is below and , yes, the IWM respected the zone and corrected roughly 12-15%. A “decent” correction so to speak.
so, as of today, as the DOW and S&P recorded new intraday highs, the Russell (and, OBTW, the big daddy $NYA) are stuck at the.786 retracement.
Folks, clear and simple … we are at checkmate w/ regard to the stocks. I’m biased that “the band plays on” and we climb the deflationary ladder of chaos for, perhaps, another year OR we stop in/around here (next week perhaps) and start down w/ a really good and scary shakedown.
but before we try to “guess” what is going to happen next … go put some Pink Floyd on Google Play, pour a glass of wine and just walk w/ me down the musical component of the stock market … don’t try to figure out the WHY or the WHAT and,well, completely throw this away as bullshit if you want.
I don’t care … but the bottom line is the ENTIRE THING HAS BEEN FUCKING PERFECT in regards to the world of music. Bada Bing Bong Boom ….
SQUARE ROOTS RUN EVERYTHING:
.786 … just a number
but one of the most important retracement numbers out there. and, contrary to what people say , IT IS NOT A FIBONACCI NUMBER!
it does derive from 1.618 (which is the golden mean) but here’s the deal … it’s a musical derivation of the Fibonacci based golden mean…why you might ask?

1.618 …
square root = 1.27
1/1.27 = .786.
the frequency of a string is INVERSELY PROPORTIONAL to the SQUARE ROOT OF its weight (length)
additionally, the frequency is DIRECTLY PROPORTIONAL to the SQUARE ROOT of its tension ….
SQUARE ROOTS AND THEIR INVERSES FOLKS !!!!!
so as we look at the TOP in IWM … 121 (hello a NATURAL SQUARE 11*11 = 121) we can see WHY the puppy stopped in/around 104. TILT — HUGH?
121 square root = 11.
11-.786 = 10.214
10.214^2 = 104.32 (PLEASE LOOK AT THE CHART BELOW AND NOTICE THE CLOSES AND OPENS DENOTED BY THE LIGHT BLUE LINE) – THAT LINE IS DRAWN AT 104.
OK Bart … that’s kind of cool. But, for one moment don’t even tell me that it was a 104 calendar day correction from the high at 121….!
- all time high 07/01/2014
- add 104 calendar days: 10/13/2014 – please see the chart.
- folks, that was the EXACT close and the OFF THE IWM went …
so, what the heck does all this mean … as my wife likes to tell me — give me the CLIFF NOTES.
1. this ZONE depicted is a MAJOR pattern from the all time low.
2. the .786 retracement from the 121 high has held the market from going higher
- if we lose this thing to the upside THEN it could cook off in a sling shot parabolic move ..
3. the MATH shown is simply to show that, well, it was PERFECT in PRICE and TIME and therefore the subsequent move up was 1) expected and 2) makes sense.
4. IF LONG – in the context of this amazing run in the Russell 2000 – I would just simply hold it and roll w/ it .. HOWEVER if we break that 104 level then cut it and bail.
5. If SHORT – then watch for a WEEKLY (tomorrow) close above the .786 and if you get a graceful exit on Sunday Night/Monday morning get ready to cut it and get long for a good year or so as this puppy launches.
Last thing … I HAVE NO IDEA WHICH SCENARIO WILL PLAY OUT ….
email me if you have any questions …
I just want to make sure you, my bad ass readers, have a clue as what I’m trying to convey.
At a minimum, you can tell your significant other to leave you alone, put some Pink Floyd on and enjoy a glass of wine w/ some square root stuff ….
B
measured moves are powerful tools and on long term charts they are very useful for forecasting price moves. take a look at the chart below … the BLUE arrows are the lengths of the bull moves in the IWM. appears the current move will converge nicely in/around 113-114. Then, since we are all working w/ probabilities, what do you think the probability is that we find stiff/major/topping (?) resistance in around that area…? if that doesn’t stop it then watch 120-121 … either way we have the POTENTIAL for, at a minimum a 6th month correction?
last thing is some very easy time study … note the TIME it took for the first blue arrow to go up…now look at the TIME of this move that began at 34.
we have a convergence of PRICE and TIME in and around here … just saying.

IWM price and time coming together here/now or soon!
THE silver fractal … you want to study this chart
Posted on November 6, 2014 1 Comment
Fractals … see below for the definition.
In the market, it happens all the time. The same PATTERN in FORM is playing itself out – from a fractal perspective – on a 5 minute chart and on a Monthly. It’s actually pretty amazing to see … trust me, you won’t see them w/ the mess of technical indicators that clobber technicians screens. Clear your chart and sit back and say “show me” 🙂
anyway, this AM, went to LOG scale (very powerful on long term charts to help see accelerating rates of change … and it’s also a very powerful way to see PATTERNS. I saw the corrective move and, well, see the chart below. the SAME FRACTAL corrective pattern is completing.
I am wrong below 12. I like 14 ish.
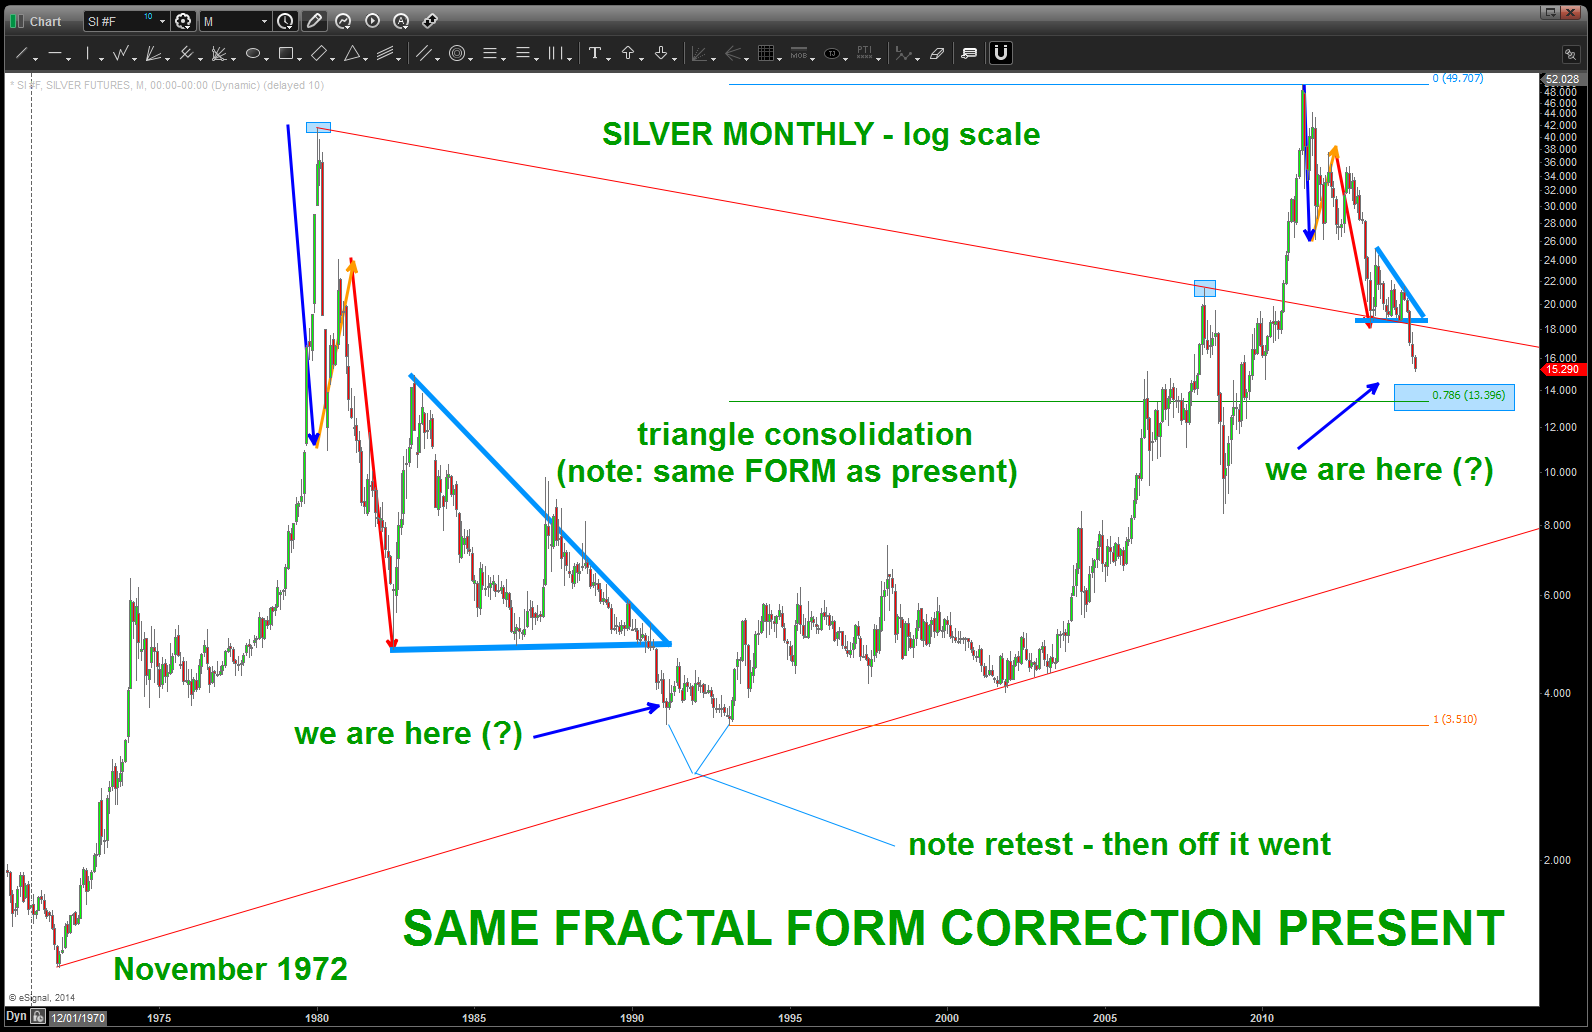
SILVER FRACTAL
I promise this isn’t going to be a mathematical treatise on the math/geometry behind fractals. We’re going to go down the rabbit hole, slightly, in order to 1) get an understanding of what a fractal is and then 2) relate the current market environment using the Down Jones Transports. We could use more, but that would 1) take too long and 2) I ask that you defy human nature and do the work to prove for yourself. I’m more than happy to answer any questions on a separate thread.
This is from http://mathworld.wolfram.com/Fractal.html : “A fractal is an object or quantity that displays self-similarity, in a somewhat technical sense, on all scales. (my bold) The object need not exhibit exactly the same structure at all scales, but the same “type” of structures must appear on all scales. ” For those not familiar w/ Elliott Wave Theory this is where the “form and proportion” comes into play ….

famous fractal picture ..note how from the LARGE to the SMALL the PATTERN repeats!
For the moment, direct your attention to the far right of the picture above. The large object is the beginning of the PATTERN and produces the form/geometry of all the fractals that will be “spun out” to the most infinitesimal scales. If you spend a modicum of time studying the picture you’ll see that the large “seed” pattern to the right is repeated over and over and over ….
Our thesis is, w/in the traded universe of securities, that PATTERNS do exist and they occur on different time frames and scales but, ultimately, these patterns do repeat. W/ an understanding of the mathematical and geometrical properties present, an edge can be produced to put probability in our favor. Remember, an edge is simply a higher probability of something occurring than not occurring. The patterns DO NOT work every time, but over time they do produce and edge. If we can wrap them into the context of the circle of life (fixed income, equities (global and CONUS), FX, commodities) then we can potentially make accurate forecasts of inflection points.
Let’s go back to the picture above … the pattern had to start somewhere. As discussed, the pattern started to the far right. W/in the world of traded securities we use the IPO date or, say, an all time high or low to begin forming the pattern that all smaller fractals/patterns will respect. That is usually from a monthly chart or an .xls spreadsheet w/ the historical data from inception. The patterns that exist in the entire history of this data will, ultimately, make their way to the tick time frame.
So, w/ regard to say the Dow Jones Transports we know that the all time low was 45.59 on 10/29/1896. Additionally, there have been multiple posts over the past couple months looking for the 7580-7620 area to be a PATTERN COMPLETING. This pattern, for all intensive purposes, has completed. And, while it did not hit the pattern level exactly, it did come w/in .003% after 42,281 days. Perhaps slippage, perhaps my lines were too thick … w/ the 5% down day after the level was hit, I’ll say it’s close enough for government work. Here’s the latest post:
The PATTERN that completed was a basic measured move and using the seed of the pattern from the all time low we were then able to REPRODUCE that measured move and PROJECT where this measured move would complete a similar move and produce a PROBABLE area of major resistance. Thus far, the market respected this area.
What does this mean …? Well, again, in the context of the fractal pattern present it means we are correcting a pattern that took 42,281 days to complete. So, the probability of a “large” correction is favorable. HOWEVER, in the context of the history of the Dow Jones Transports this could be an amazing BUYING opportunity but not after a 40-60% percent correction. If we are a day trader or a daily swing trader then this seems catastrophic. However, if we keep in mind that a PATTERN has completed that is 114 years in the making THEN we realize in the history of the Dow Jones Transports a MONTHLY swing low has never been broken. Last thing … this PATTERN could fail to the upside and then, well, it’s off to the races. The power of the PATTERNS is we know, almost exactly, where the pattern completes.
So … PATTERNS exist, some BIG PATTERNS have completed across the circle of life and, not a bullish pattern is present. The probability is that the market will respect these LARGE PATTERNS and cause a correction that in the minds of the twitter/facebook/”have to have it now” world will seem crazy and chaotic. But, if you step back and take a moment to respect the historical context of this moment, you can 1) adjust your portfolio accordingly and 2) be calm and understand that after this correction an even bigger pattern is now being formed which might be and AMAZING BUYING opportunity …
That will be hard to do … when, this time, blood is truly in the streets. It’s all probability ….
Bart
why we should care about Australia
Posted on November 1, 2014 Leave a Comment
the All ordinaries never hit the target SELL pattern and this PATTERN is still valid. the zone of 5760-5835 is the key w/ the old realiable .786 retrace up at 6060 the highest it “should” go if the SELL PATTERN is valid. As you know we NEVER know which one works or doesn’t …
what makes this particularly relevant, in my HUMBLED opinion is it’s correlation to the AUDJPY and the VERY interesting PATTERN that is appearing w/ regards to the AUDJPY. For a review, here is the pattern on the All Ordinaries:
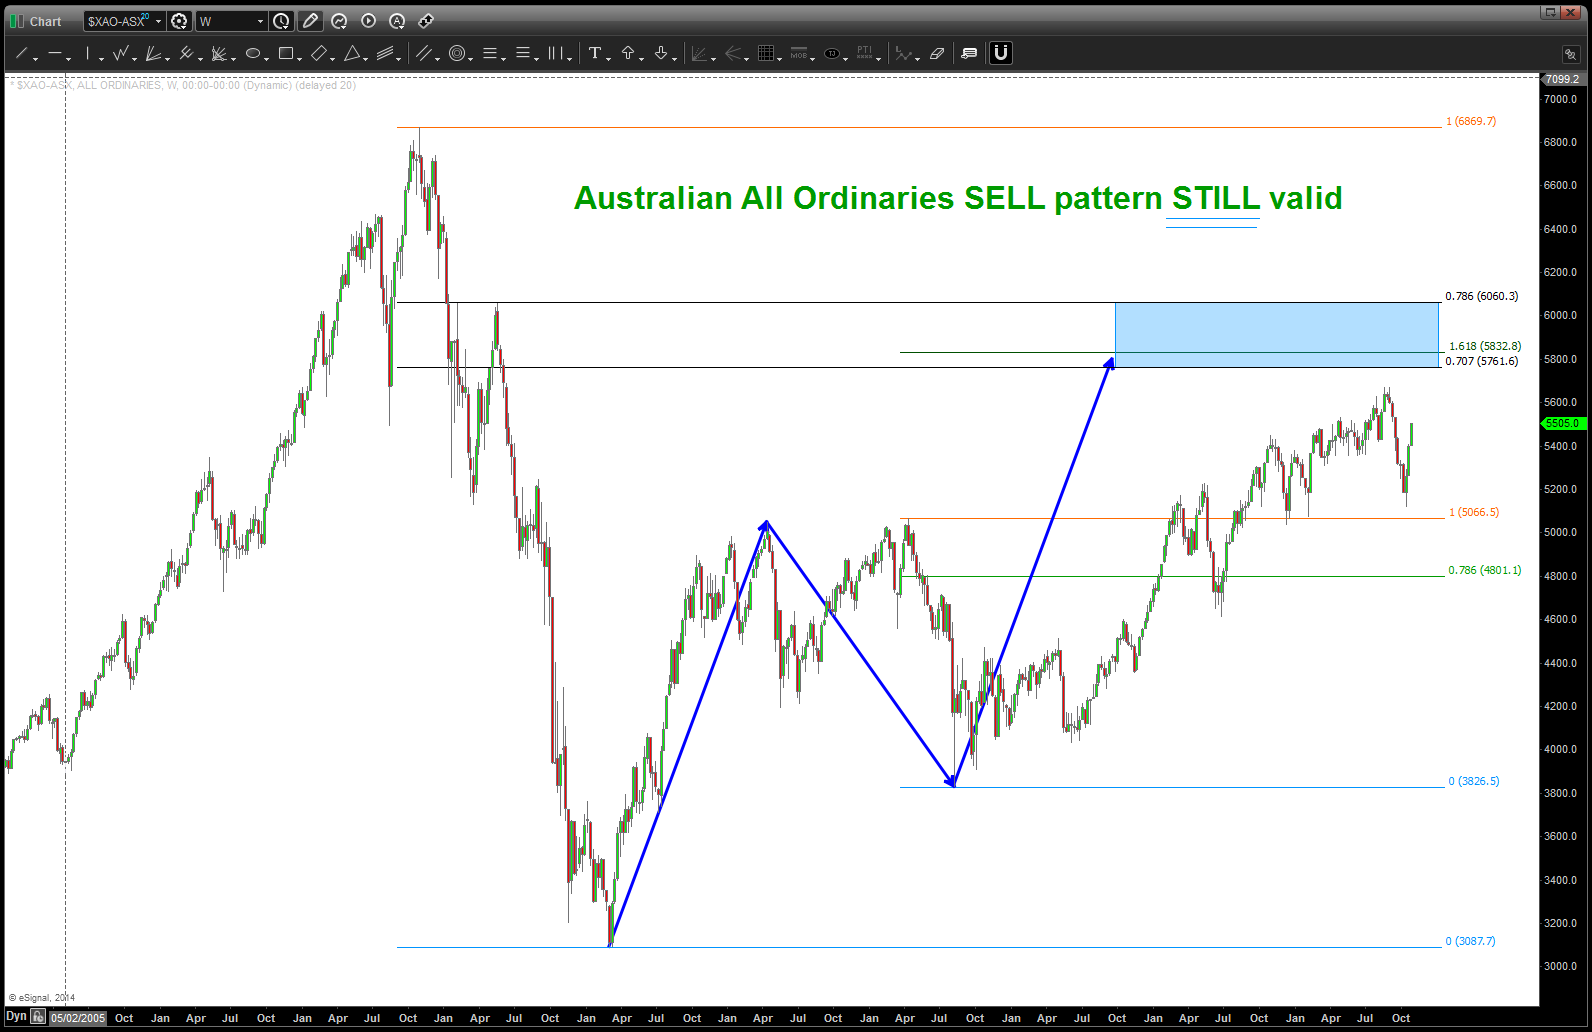
All Ordinaries SELL PATTERN
here’s the importance of the AUDJPY and the All Ordinaries …
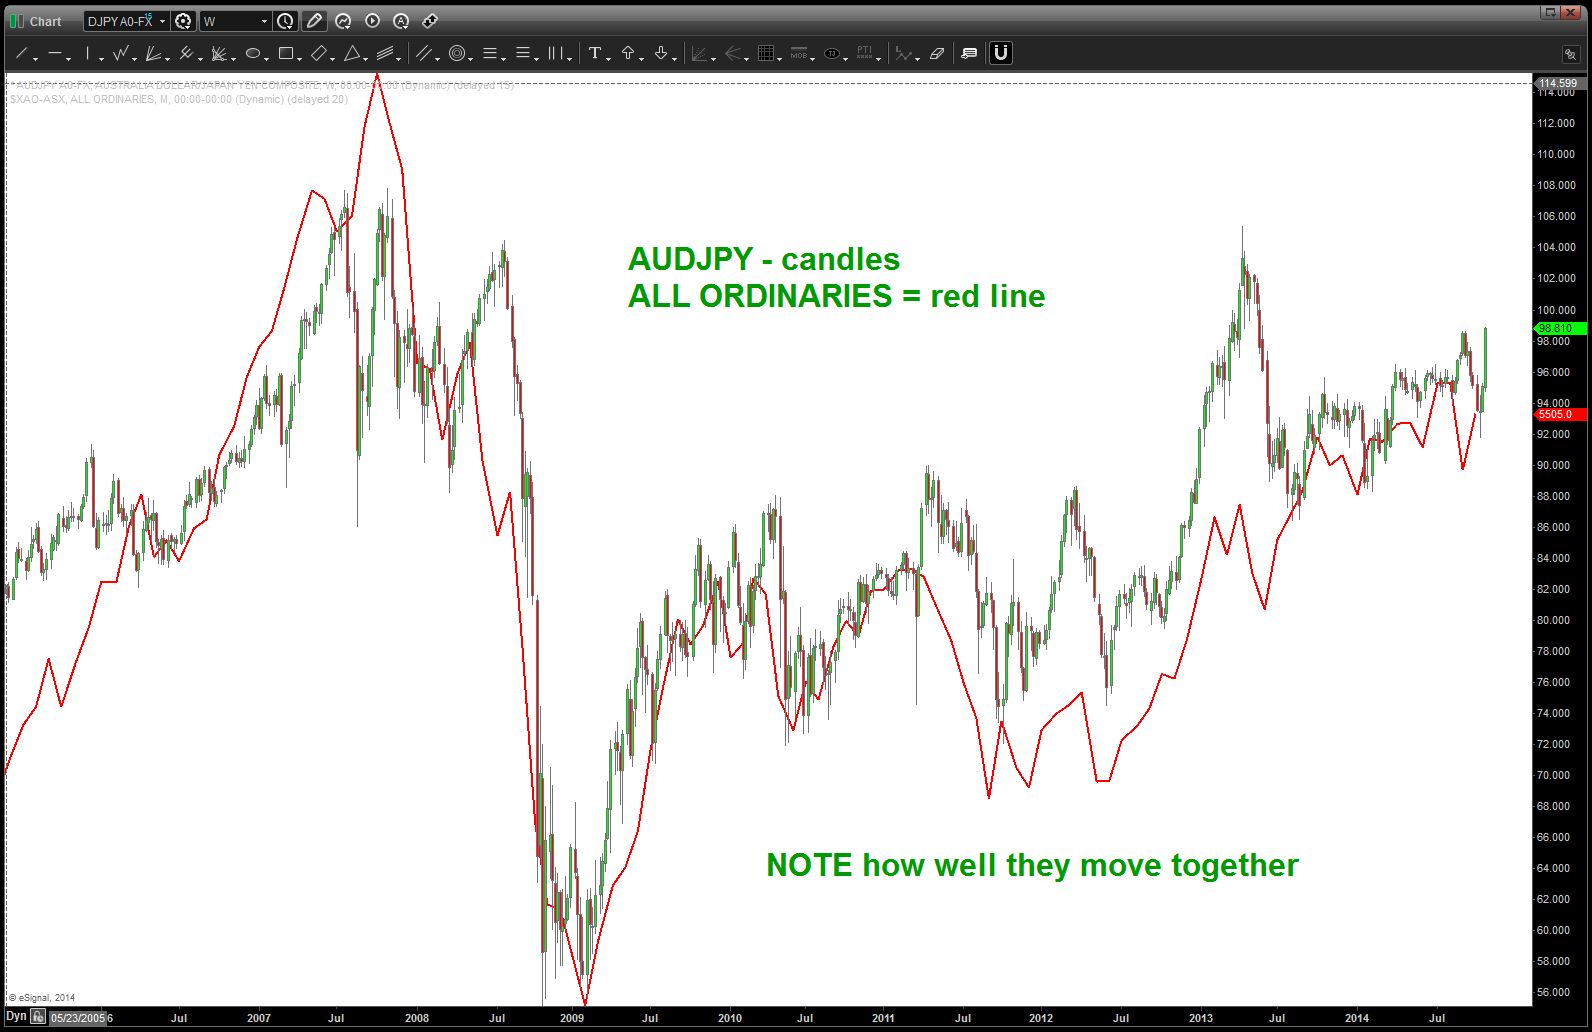
AUD vs USD and All Ordinaries
so we have a SELL PATTERN on the All Ordinaries so that “should” cause the YEN to strengthen against the AUSSIE .. ONE PERCENT OPPOSITE OF THE INTERVENTION WHICH TOOK PLACE ON FRIDAY! as you well know, I know NOTHING about the fundamentals behind this move. And I don’t care … but IF the All Ordinaries SELL works THEN historically speaking the PATTERNS and CHARTS tell us the YEN will strengthen against the Aussie …here’s the charts:
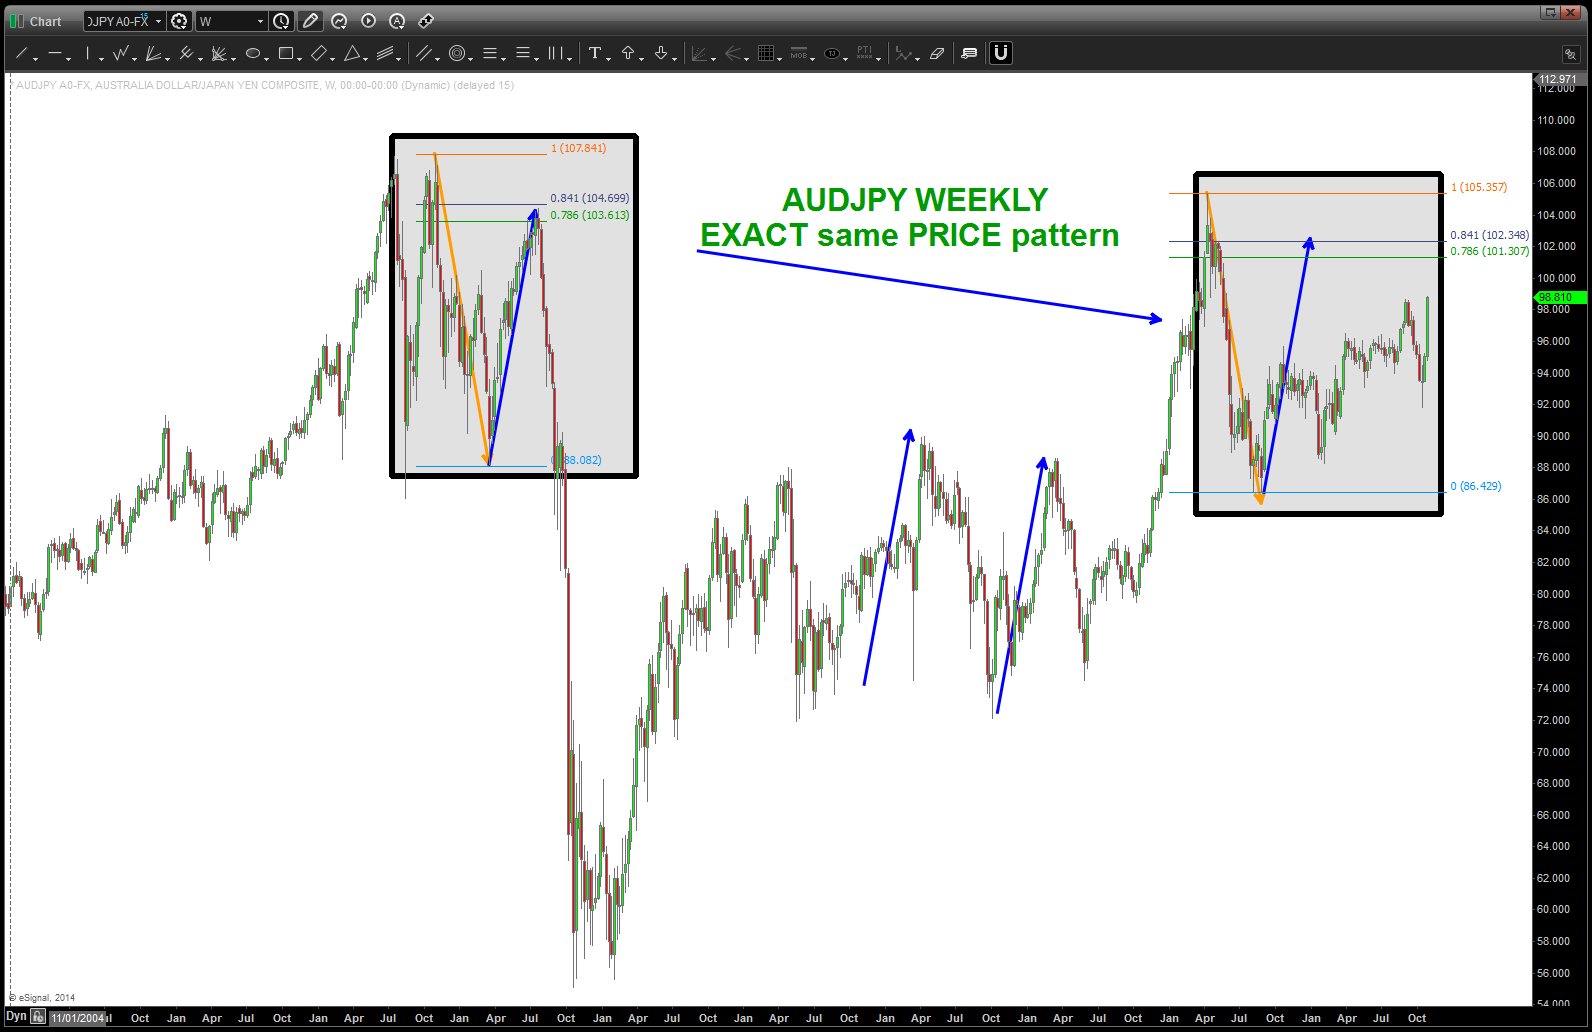
ADUJPY note same PATTERN
look at this MIRROR IMAGE foldback …
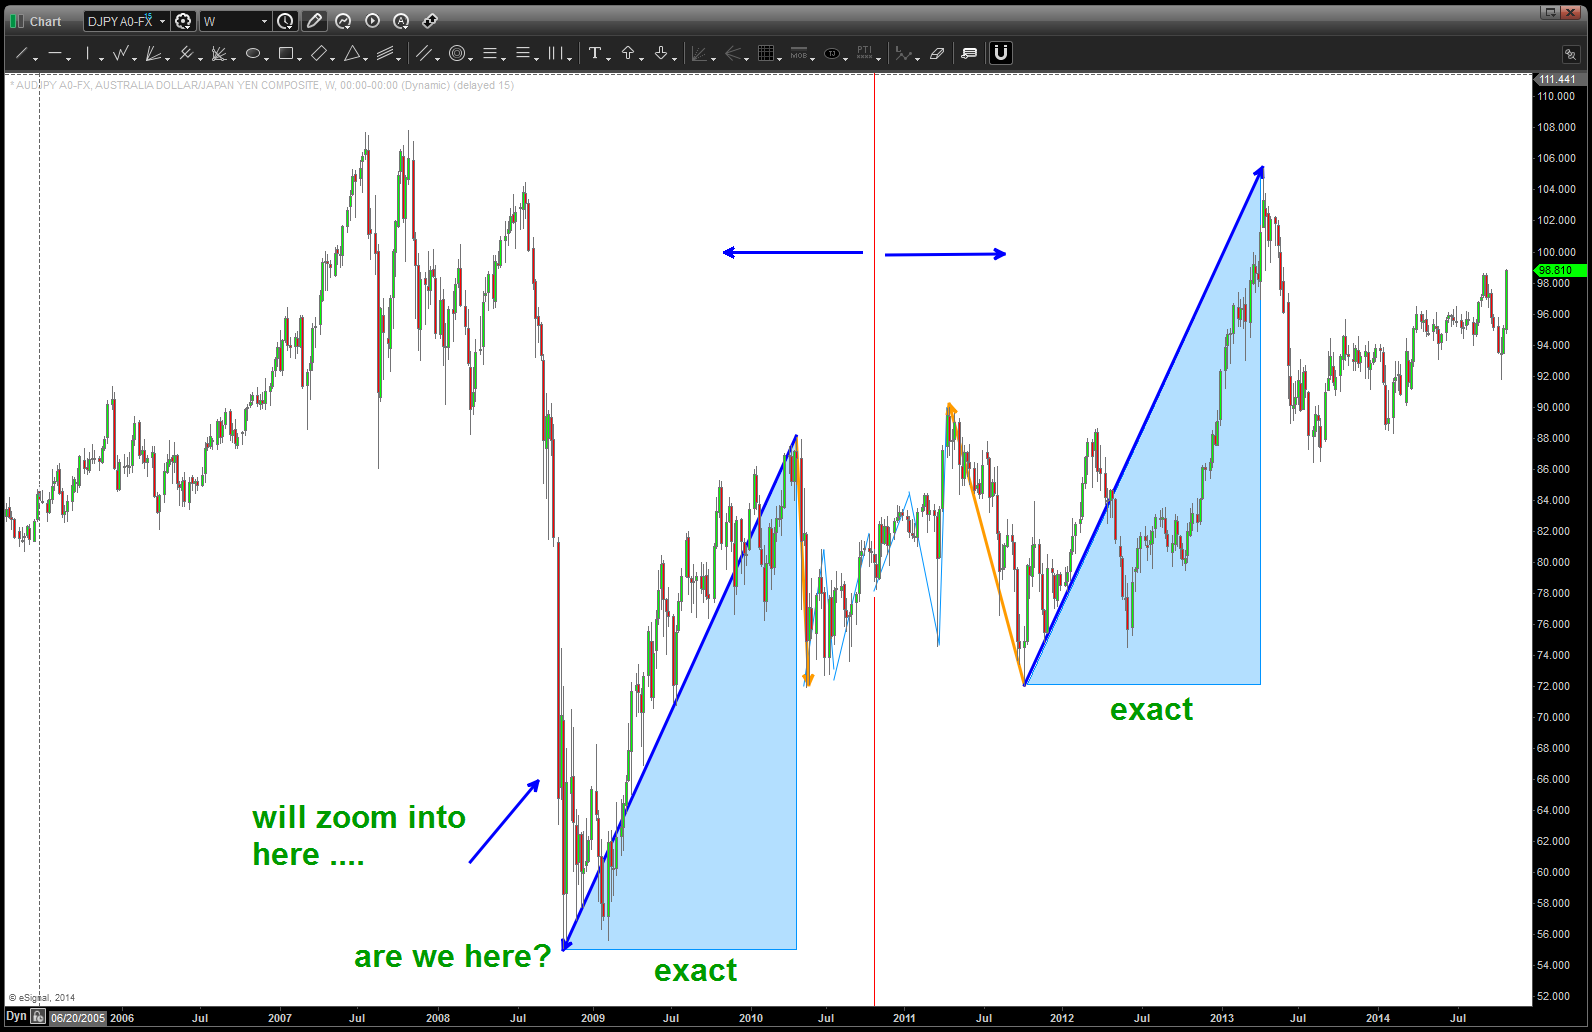
mirror image foldback
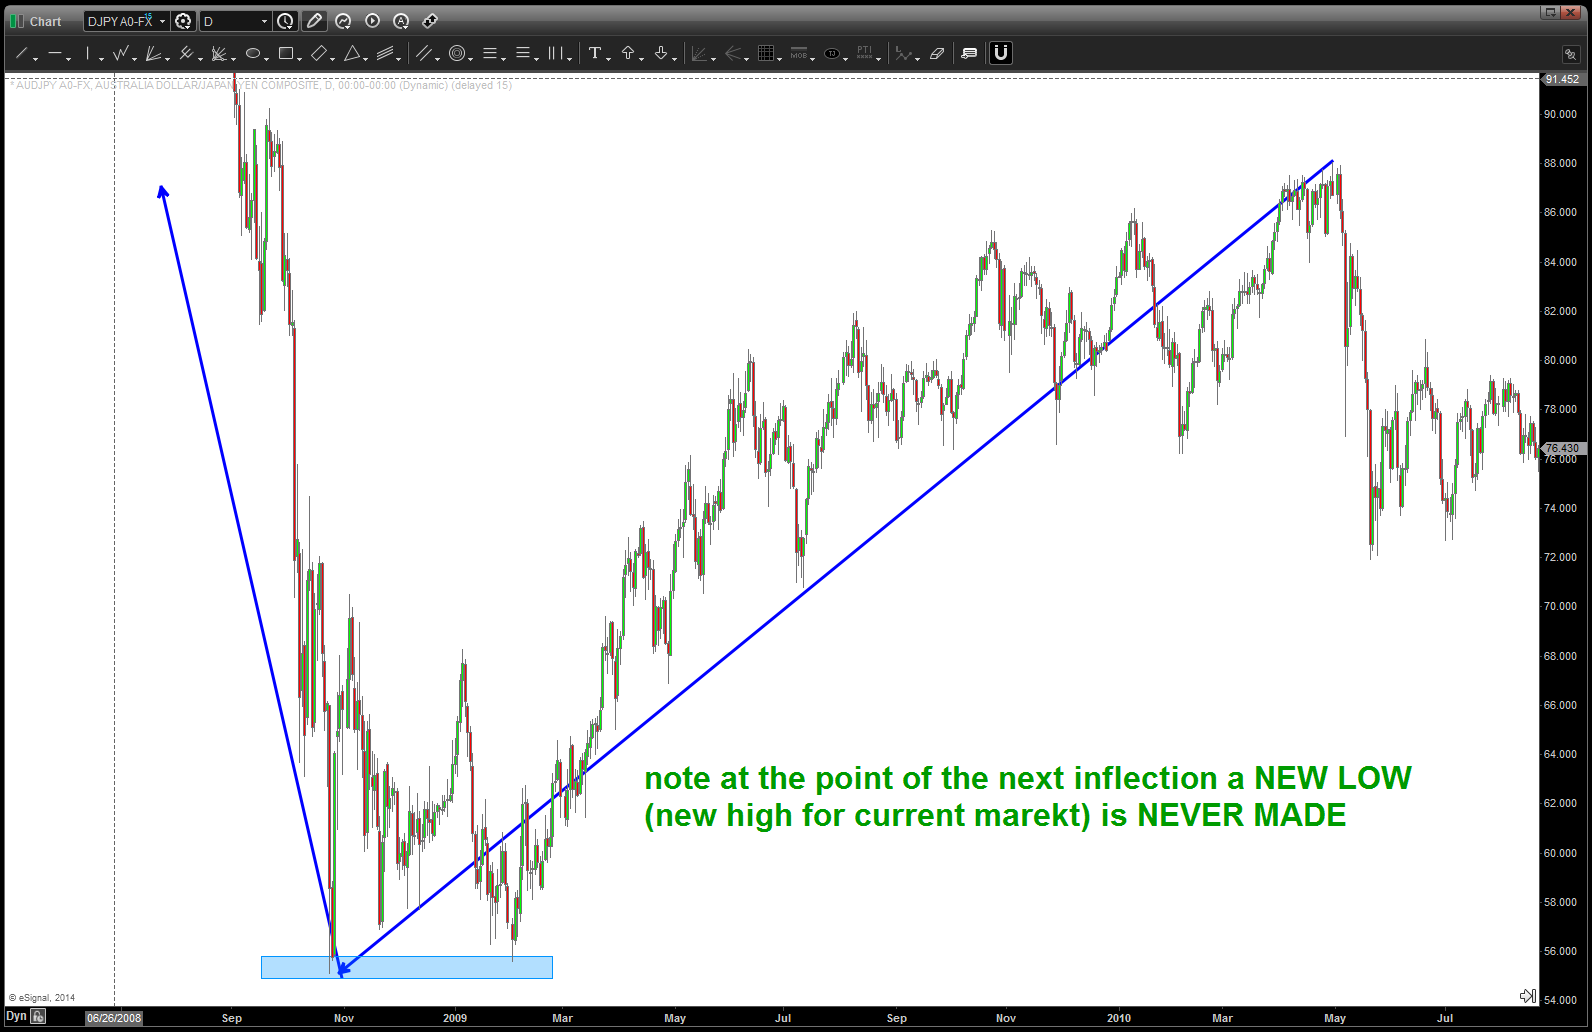
mirror image foldback point 2009
here’s the PATTERN, again, on the AUDJPY …
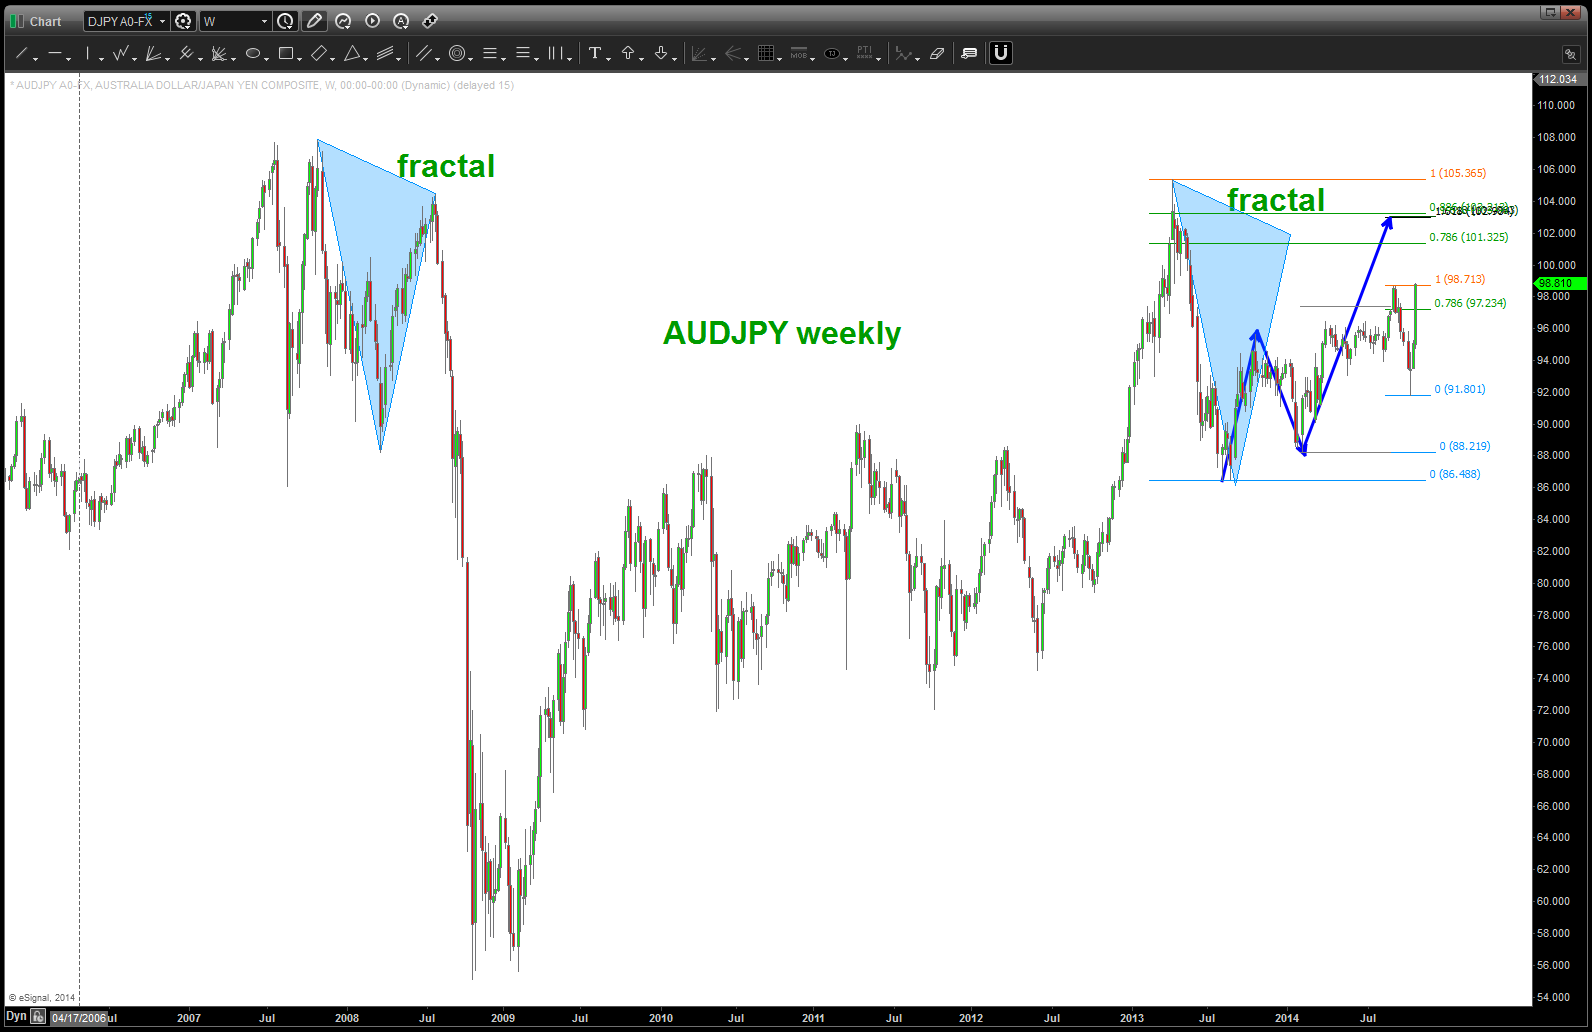
AUDJPY pattern
AAPL and Palladium – dancing w/ the stars?
Posted on October 24, 2014 Leave a Comment

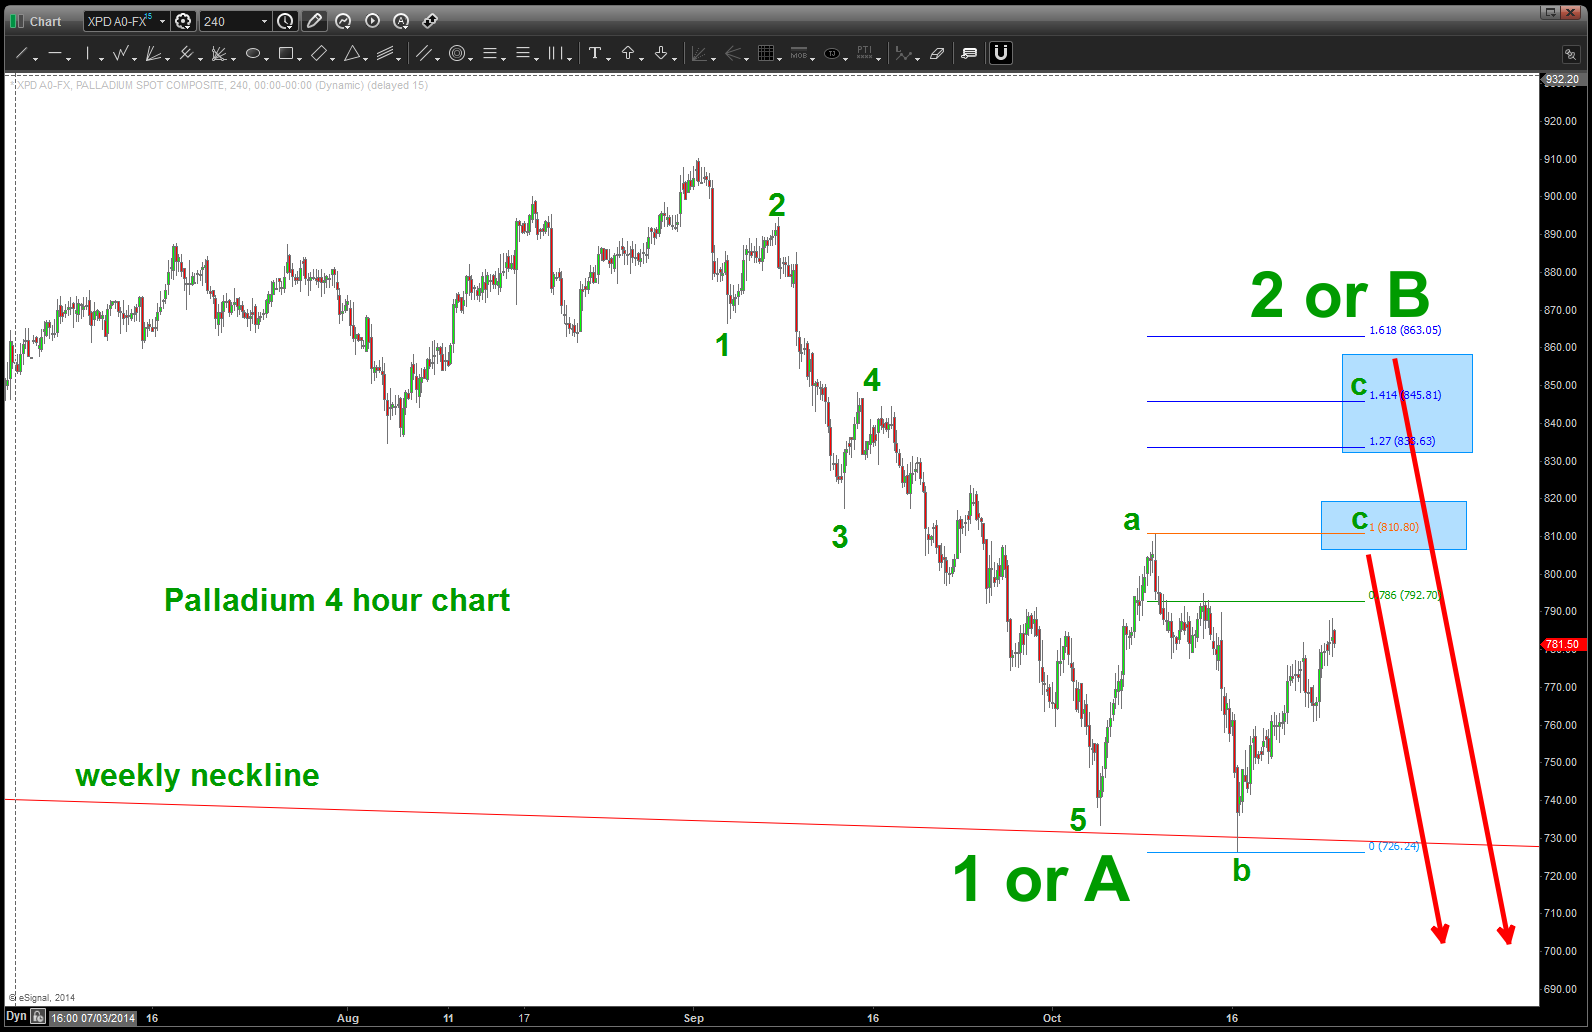
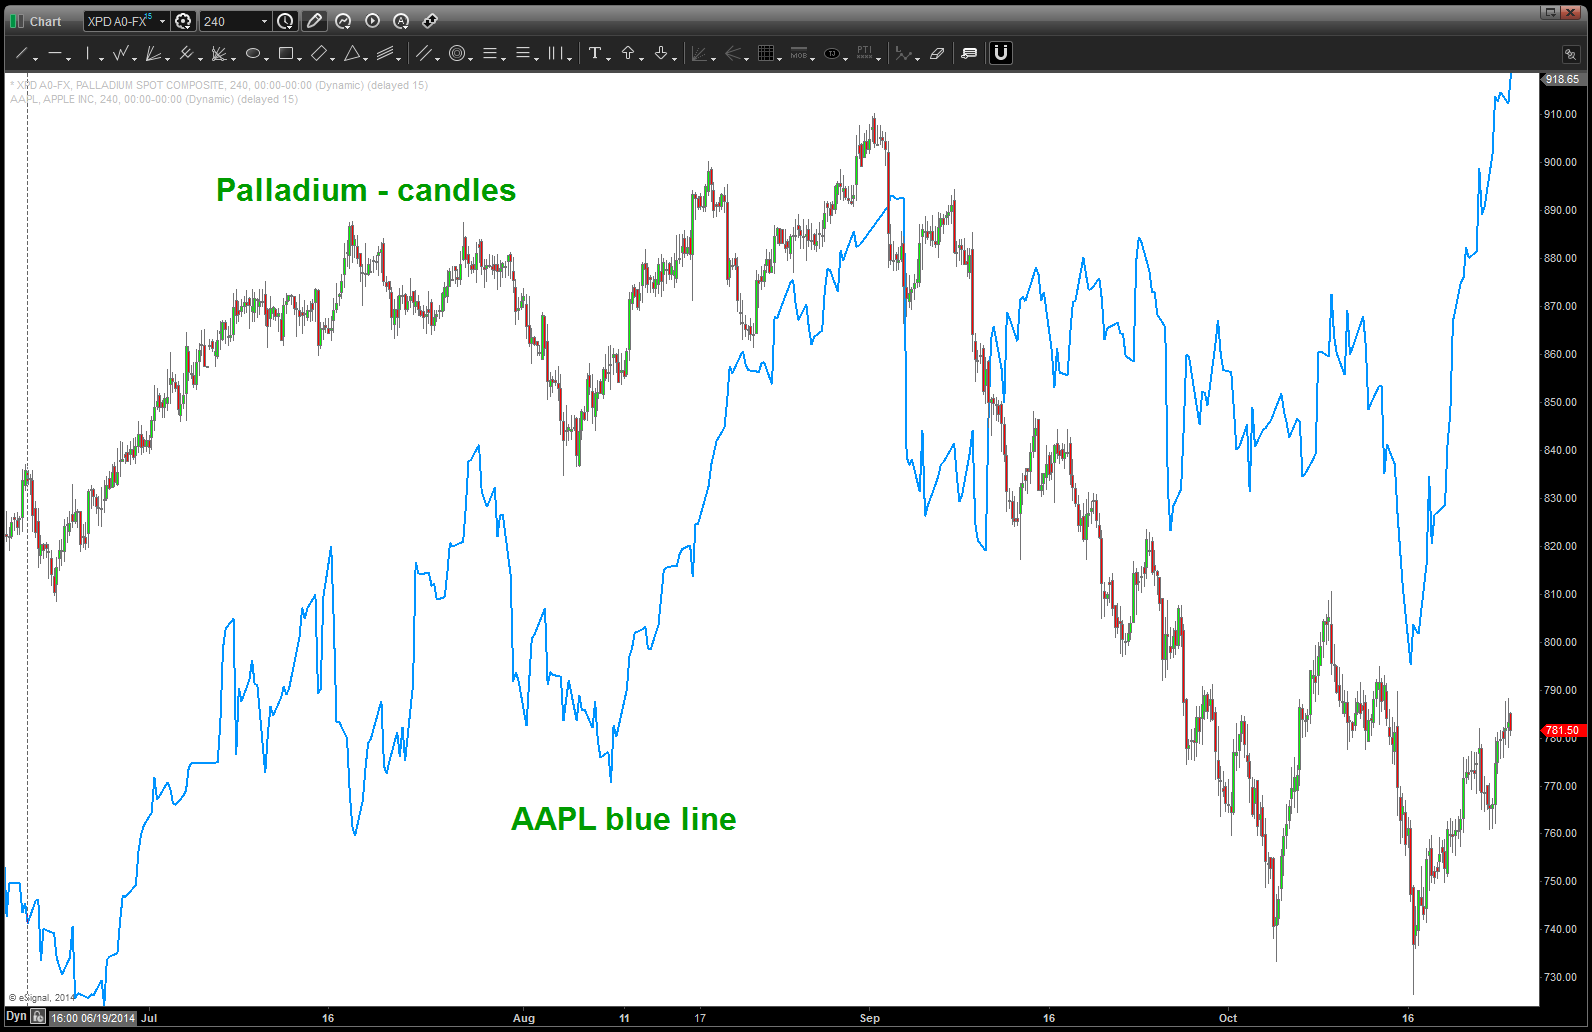
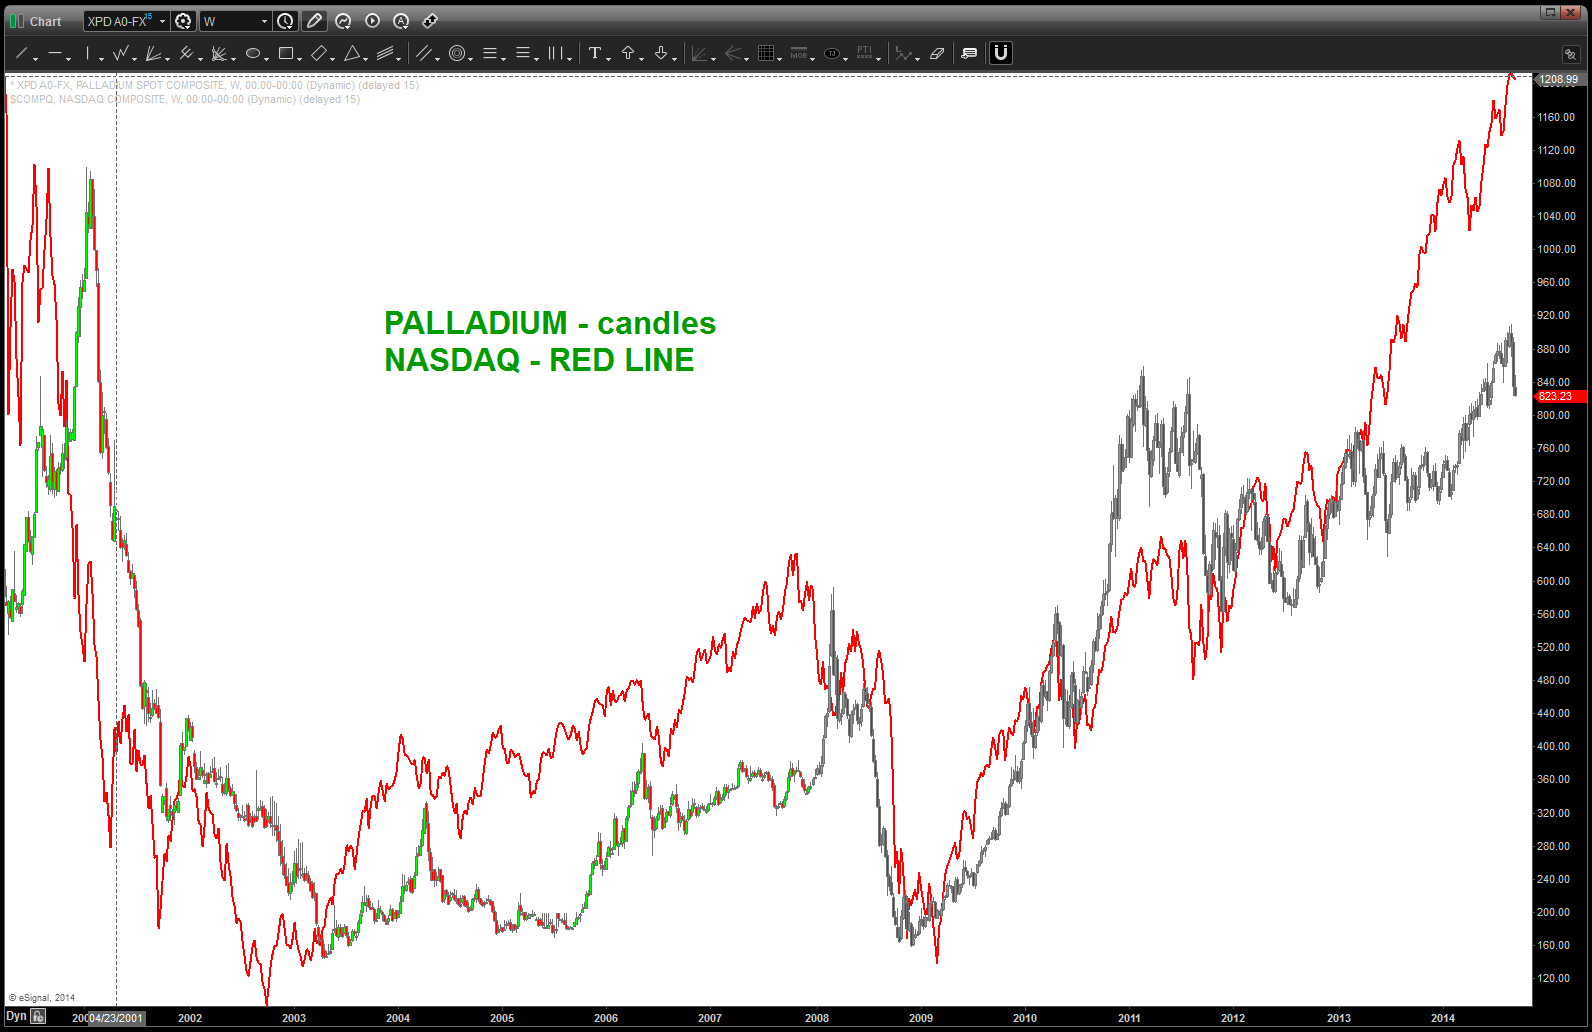
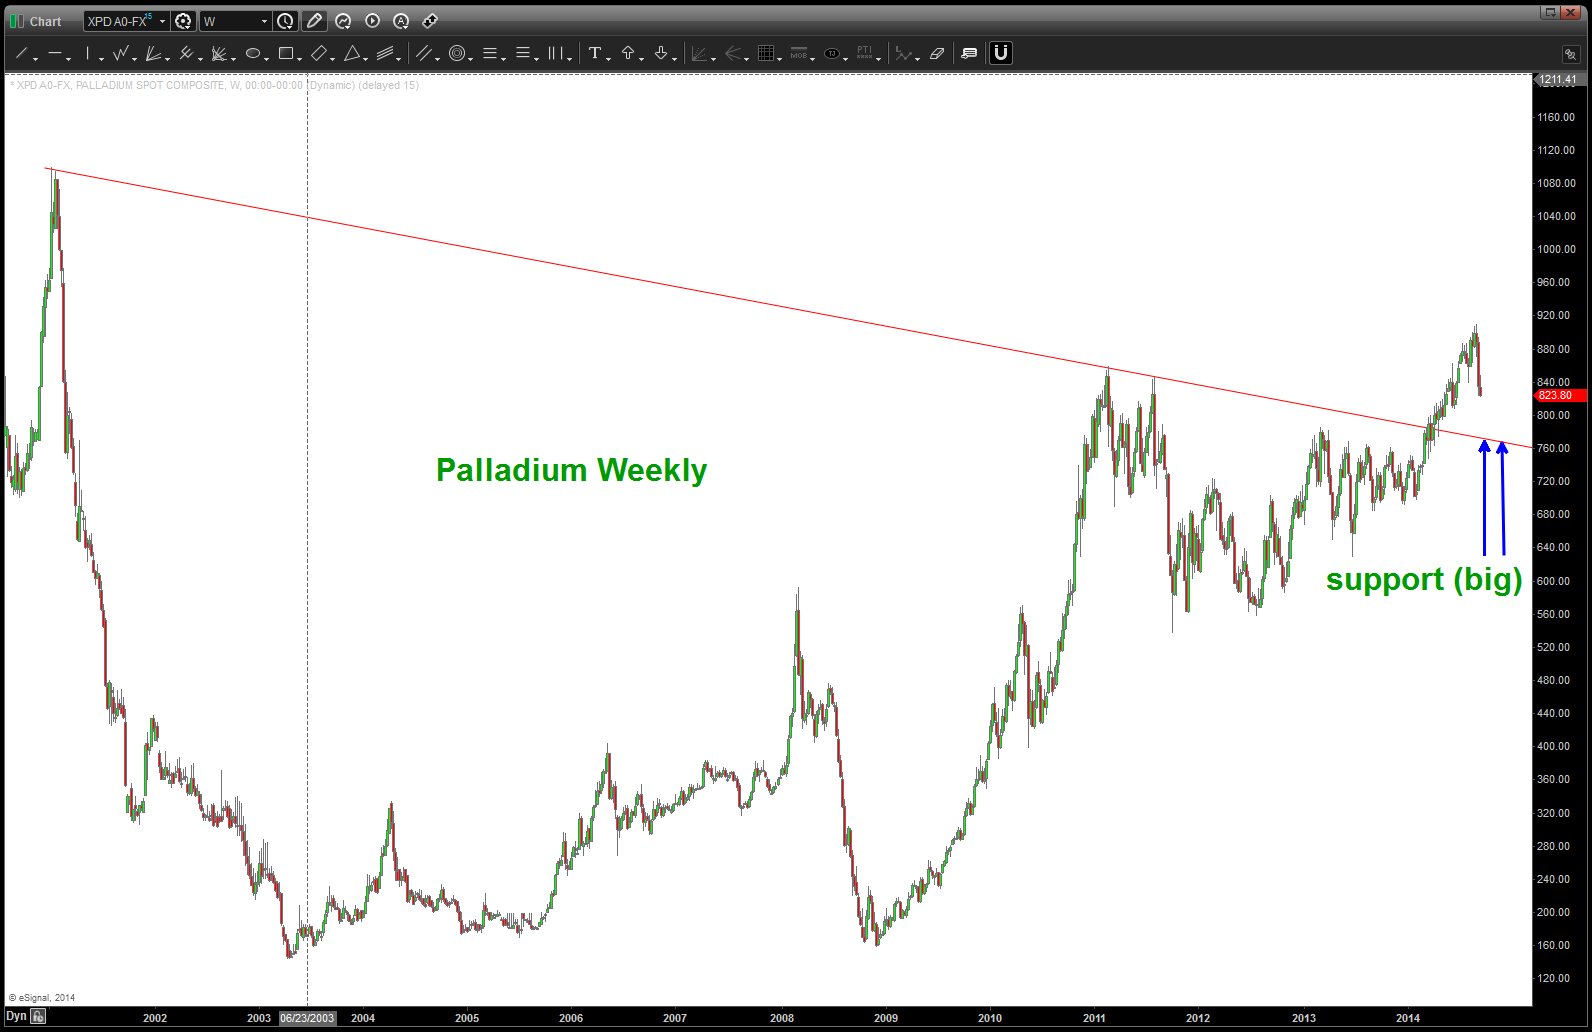
When looking at any security, I always try to look at cross market correlations (intermarket technical analysis I guess) to see if we can get correlations/confirmations. One of the more important correlations has been the price of Palladium and the AAPL stock and to another extent the NASDAQ. They are NOT perfectly correlated but they are dancing together enough (reference dancing w/ the stars) that when one inflects (up or down) the other usually follows. In this case, if you follow the charts below, you’ll see that we formed a nice pattern on Palladium that HIT and it tumbled more than 20%. Is Palladium now in a bear market — I DON’T KNOW nor DO I CARE. We’ll know something is “afoot at the circle K” based upon this next leg and what it decides to do. A count that makes sense is shown and the formation of B or 2 is where we need to just see what happens. Here’s what we can figure out …
- IF (the BIG IF) this is a wave 2 then upon completion of the FLAT or EXTENDED FLAT Palladium will start back down.
- Historically, this “should” cause pressure on AAPL.
- IF (the same BIG IF as above) Palladium continues to rip higher then AAPL will continue ….
So, just sit back and enjoy this dance…if Palladium trips and falls down the probability that it’s partner (AAPL) won’t be too far behind is a distinct possiblity.
DISCLAIMER: can’t stand that show, OBTW but my 86 year old mother enjoys it. However, I do like the last word of the show – “stars” – for obvious reasons.
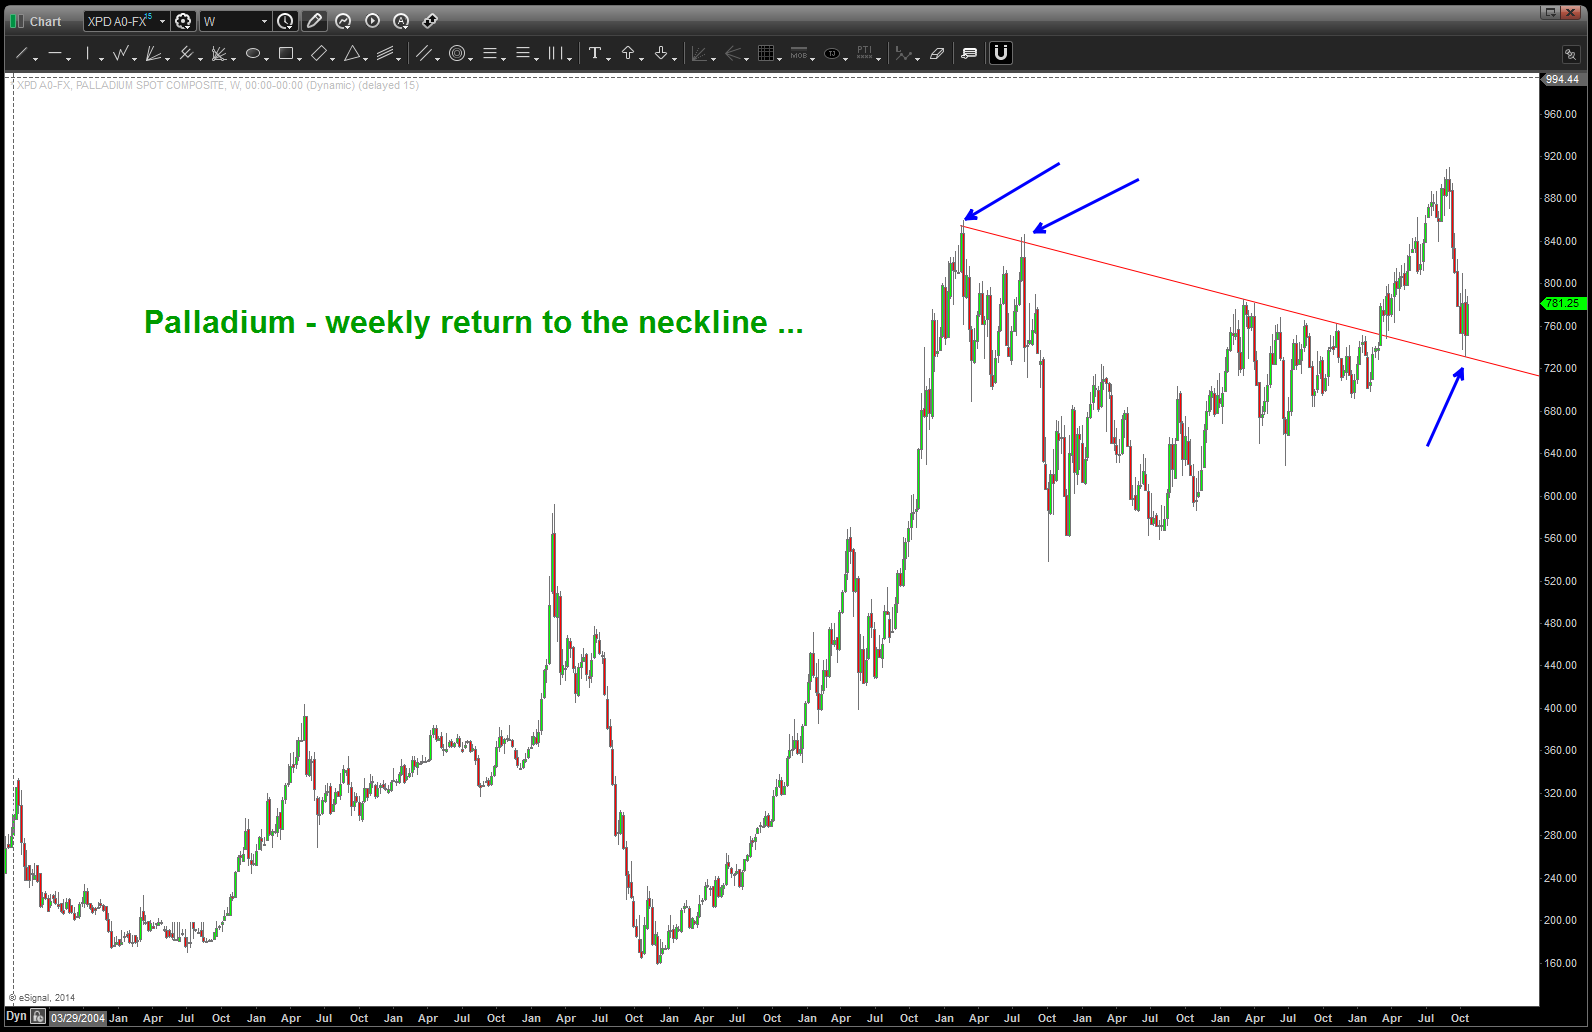
9/17/2014: this correlation is pretty strong and Palladium hit our target exactly and has been being liquidated heavily in the past month. Keep an eye on either 1) Palladium finding support to build momentum for a move higher in NASDAQ OR 2) drag the NASDAQ down w/ it. Let’s face it … ain’t NO WAY anything was going to get in the way of the Allibaba IPO. It’s going to be a crazy market as we see what happens w/ Scotland, we have a triple witch expiration, a reweighing and the largest IPO in history .. not to mention it’s been a FED week.
8/24/2014: : Palladium converging into to major resistance. This is important because it’s a nice little commodity to watch w/ regard to the NASDAQ and AAPL. In order to build the pattern we are going to to go step by step this morning into “why” Friday’s high was important from a PATTERN perspective.
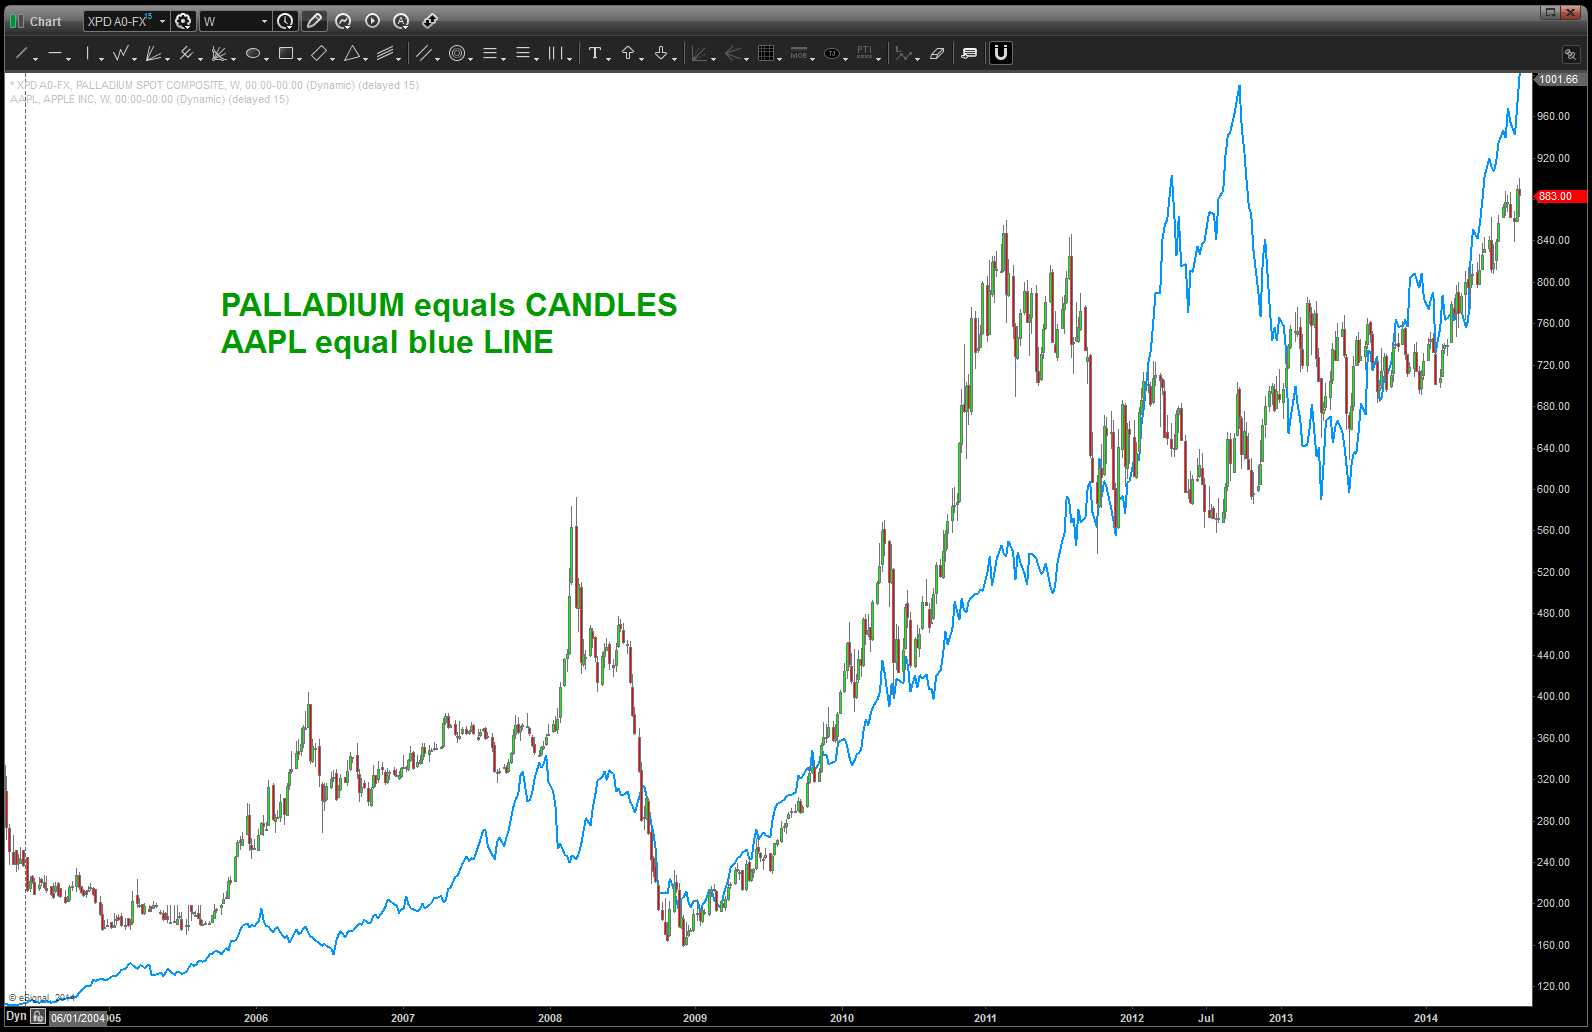
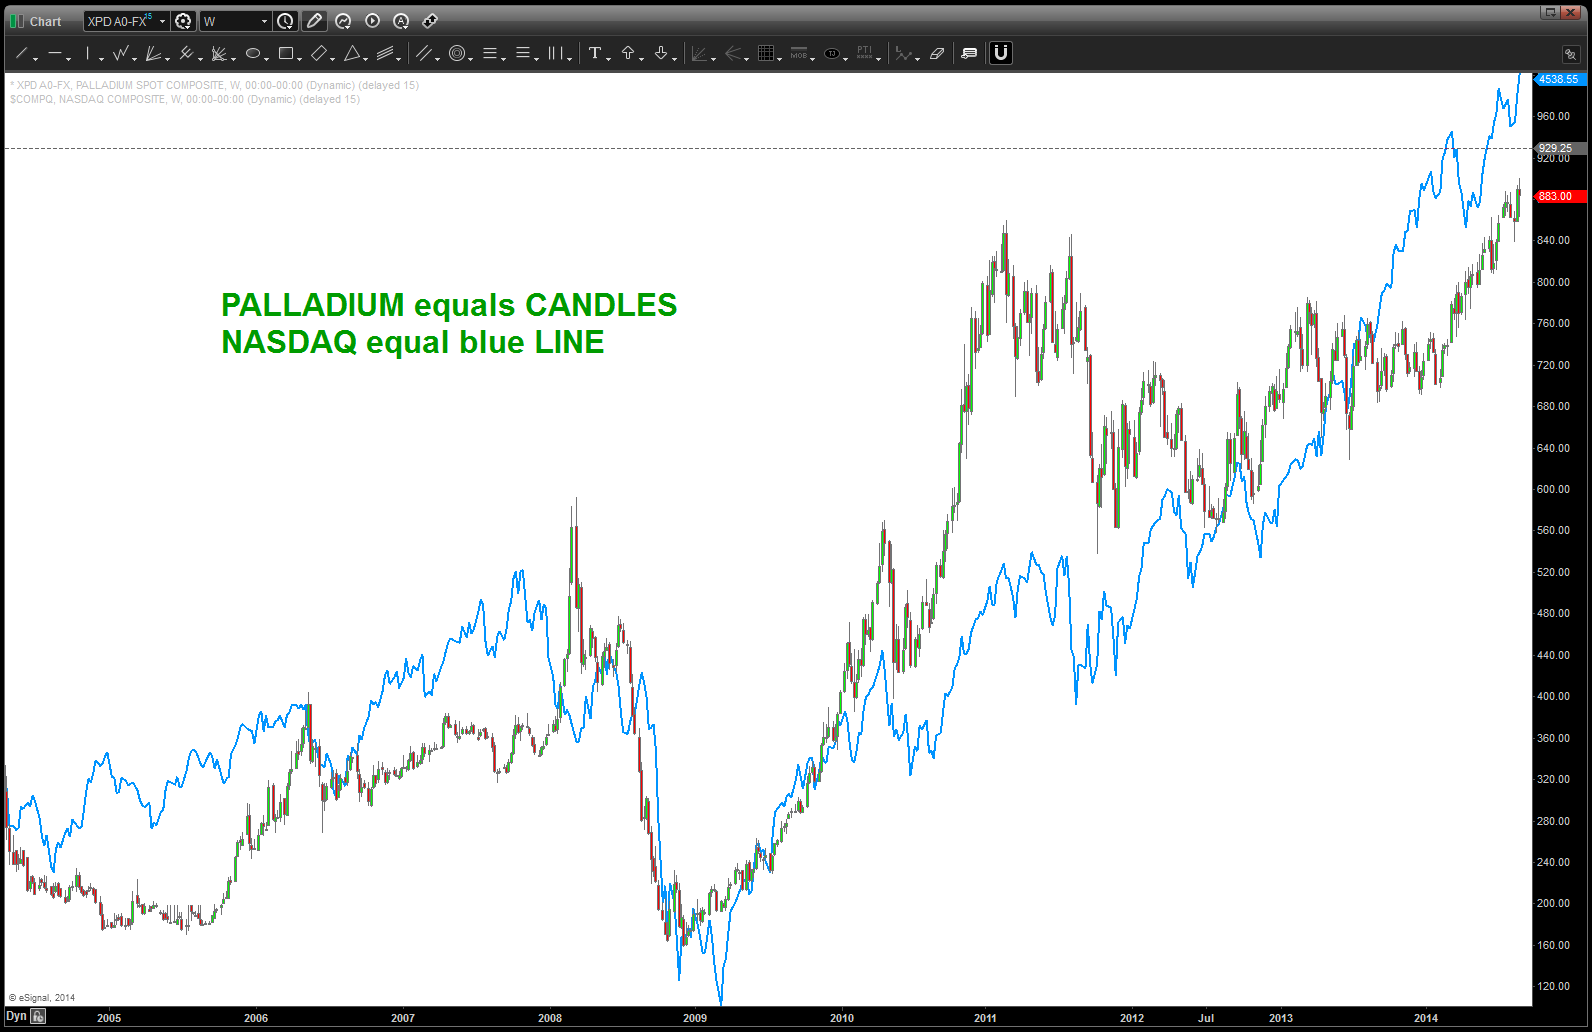
1. First, here’s WEEKLY charts of 1) NASDAQ and Palladium and 2) AAPL and Palladium.
- notice that when palladium broke out of the consolidating triangle, AAPL took off.
- of late there has been a lead/lag relationship at times BUT the overall directional pivot is clear. As Palladium goes, so does NASDAQ and AAPL.
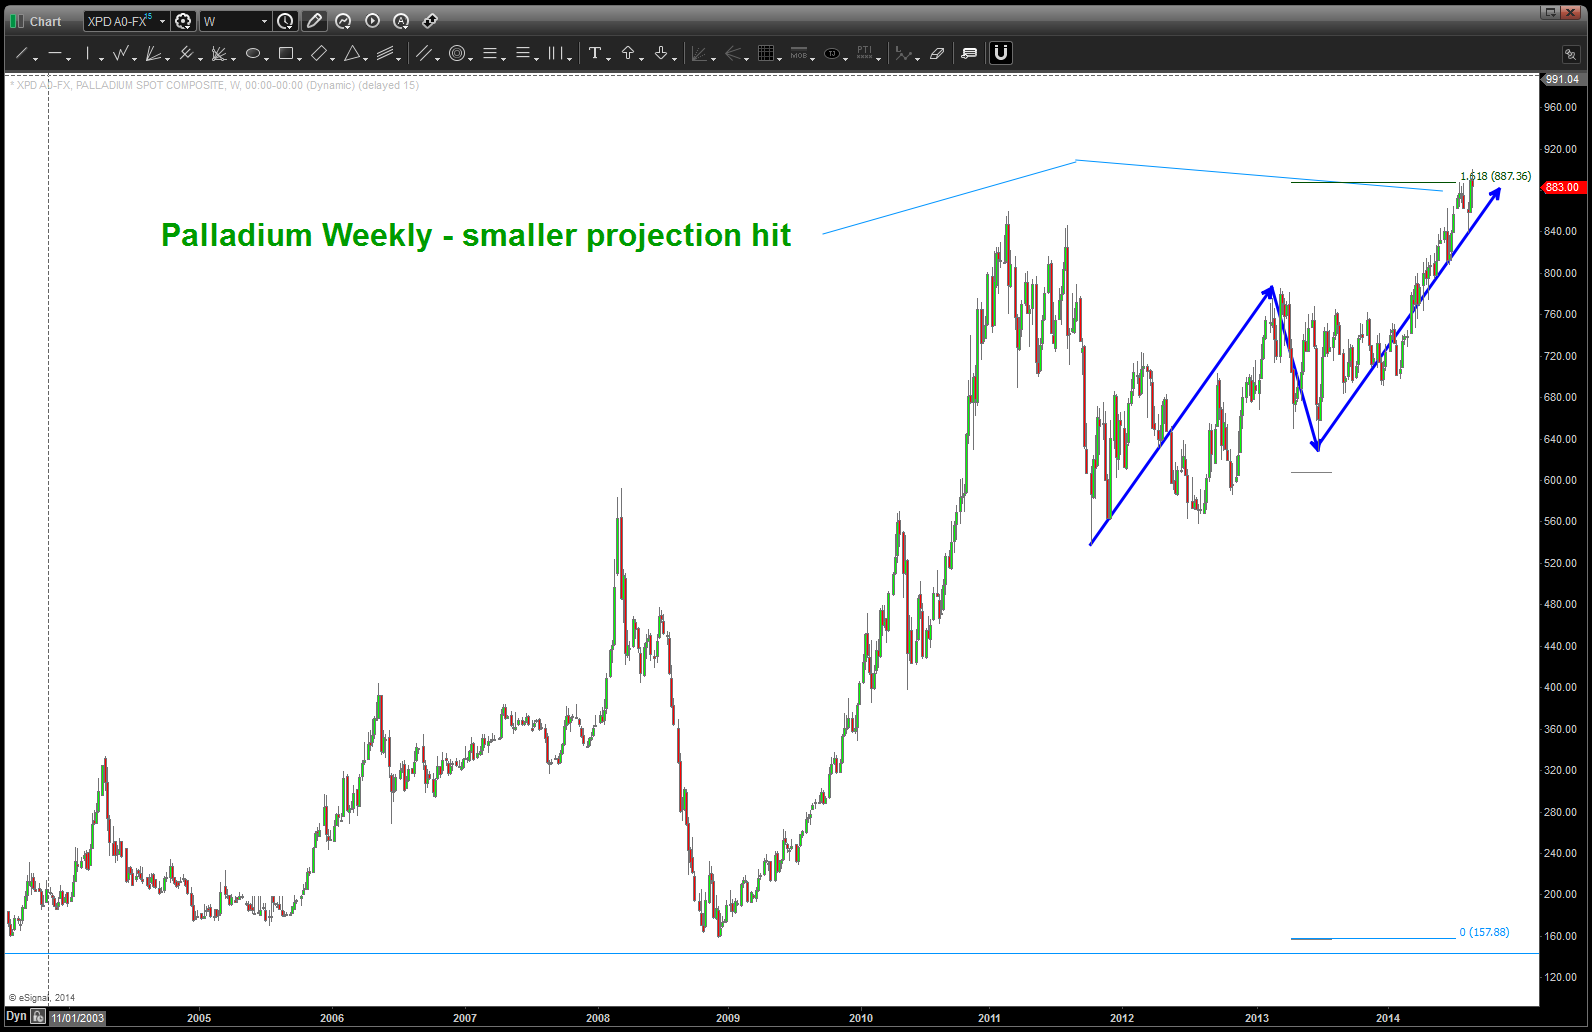
2. When constructing a PATTERN there are three things we do — PROJECT / EXTEND/ RETRACE. In order to keep this post brief I’ll do the basic stuff …
- PROJECT: note in the two charts below we have 2 “basic” projections coming into the same area. That warns of resistance.
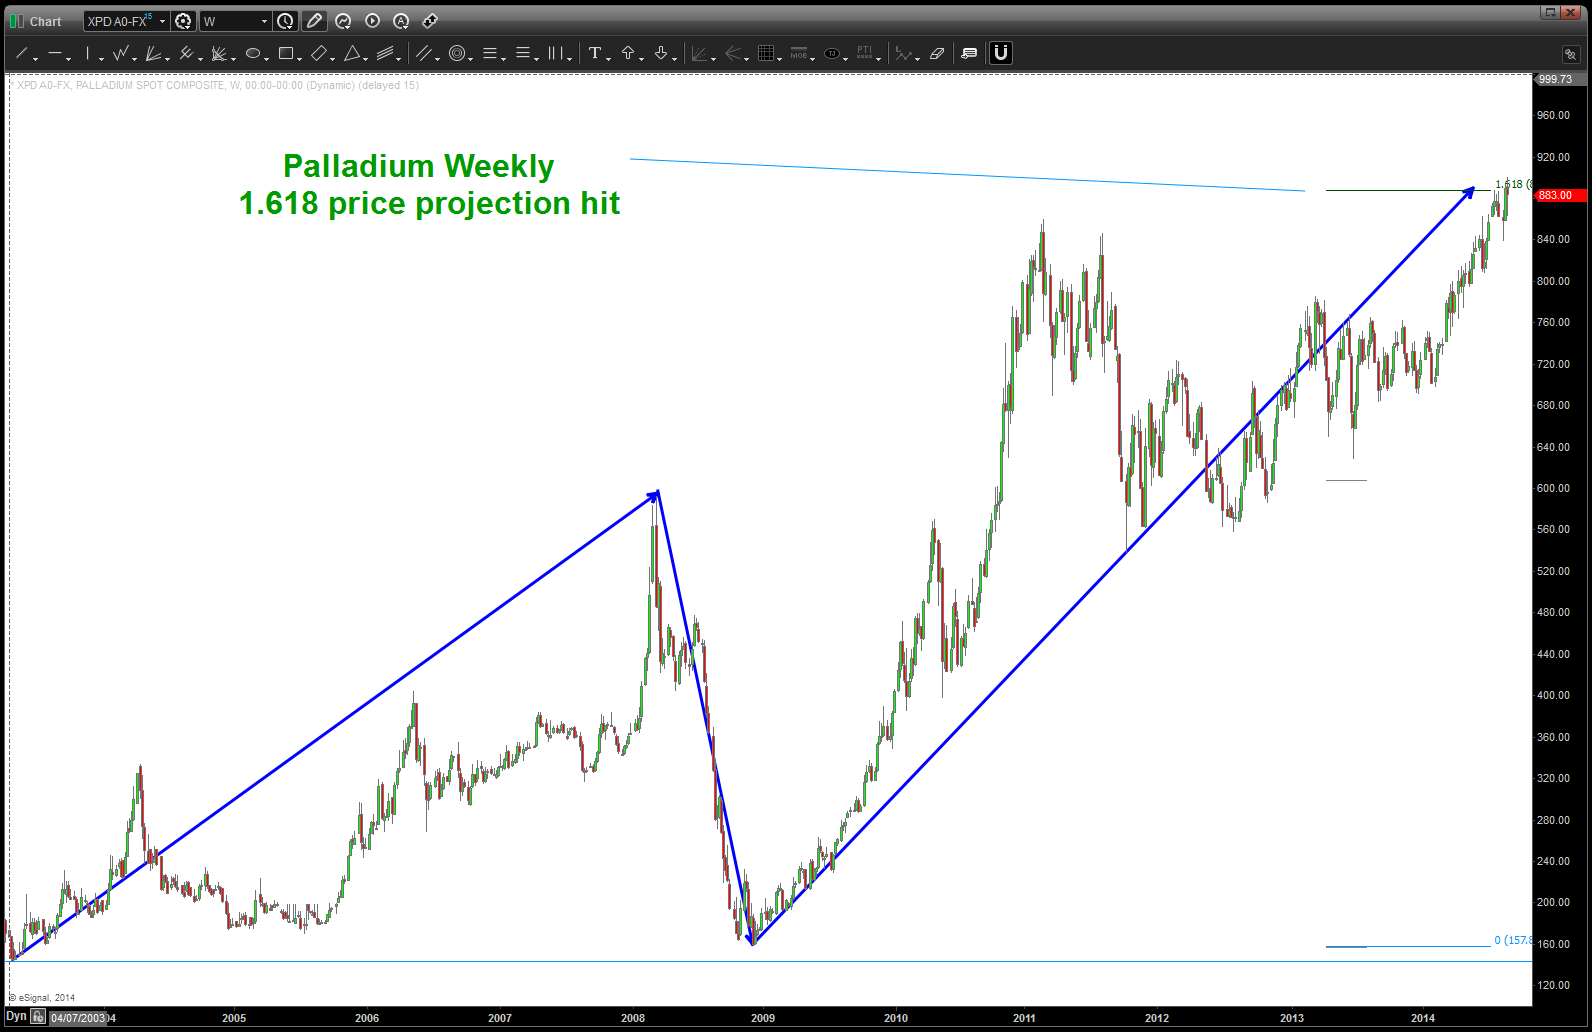
Palladium 1.618 Price Projection
- EXTEND: note, we used the middle point at 593 for the extension pattern. Also, note 1.68179 nd 1.732 are used. musical note and the square root of 3 …
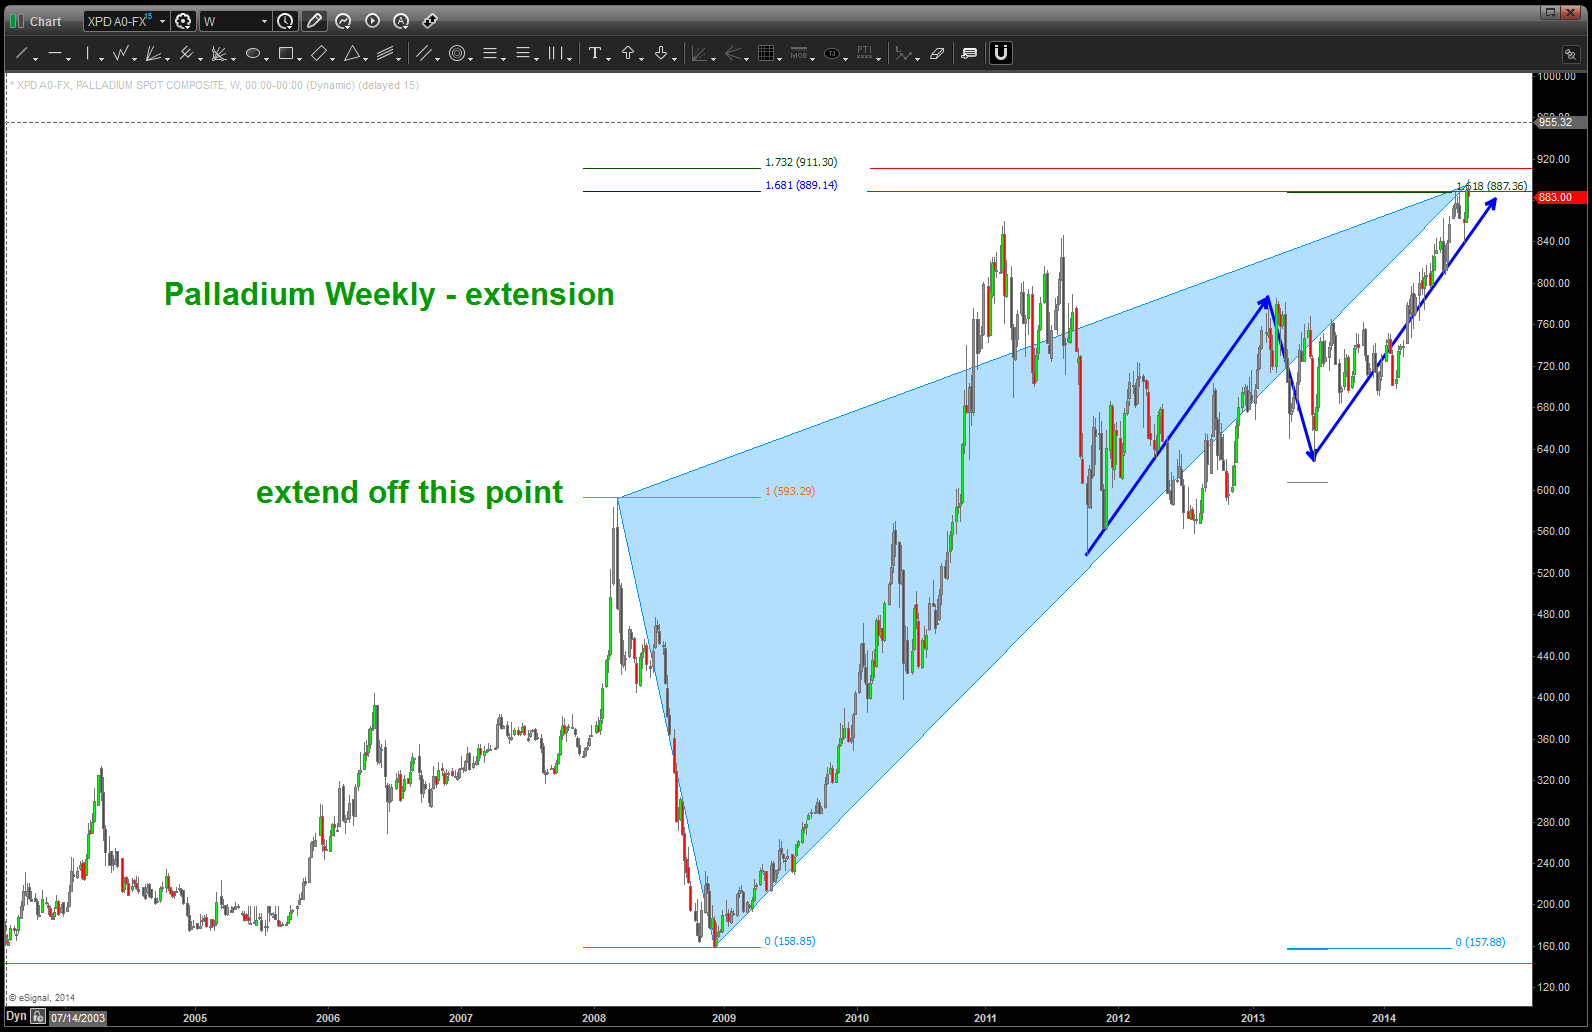
extension from 2008 (shaded light blue triangle)
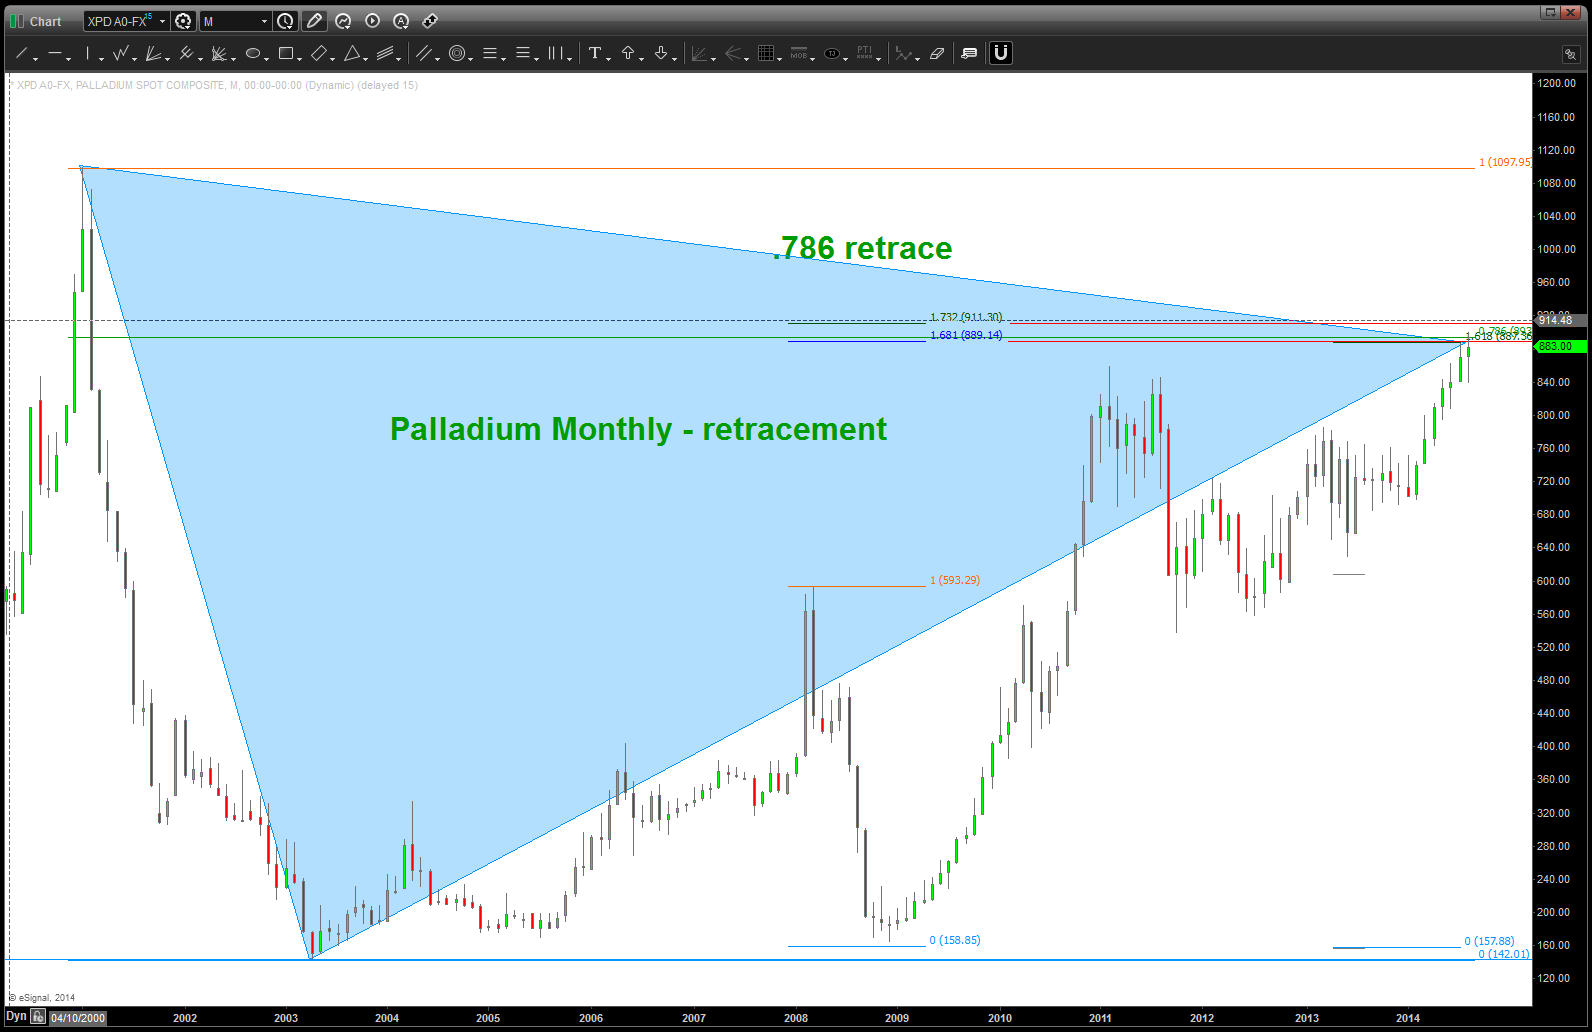
- RETRACE: from the all time high we have a .786 retracement. This is NOT a fibonacci number. Here’s the math- 1.618/square root is 1.27 and 1/1.27 = .786.
so … as you can see, we have a bunch of NUMBERS adding up to this being a big level for Palladium. And, while a case can be made that, since these are weekly/monthly nodes coming out, it SHOULD be a hefty amount of resistance. That being said, it could also BLOW RIGHT THRU EM’ and rip higher and higher. It’s just a pattern folks.
Last – the BUTTERFLY PATTERN is present. Connect two triangles together and that’s the butterfly pattern …
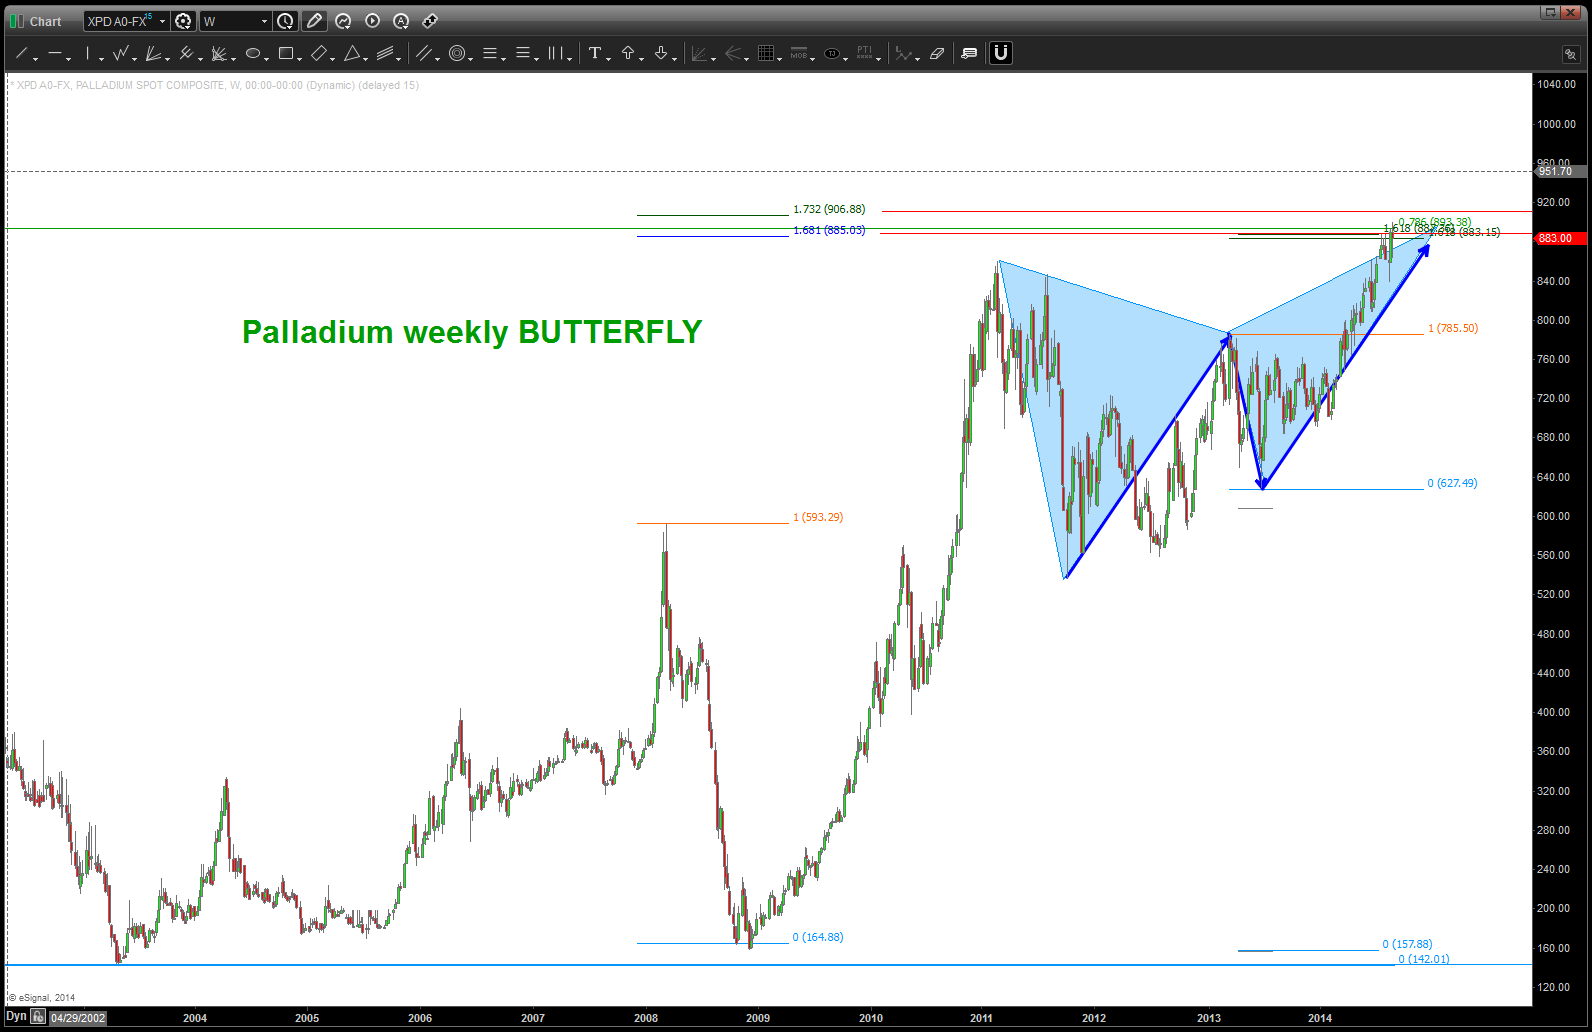
Butterfly SELL pattern
put it all together and here is the picture:
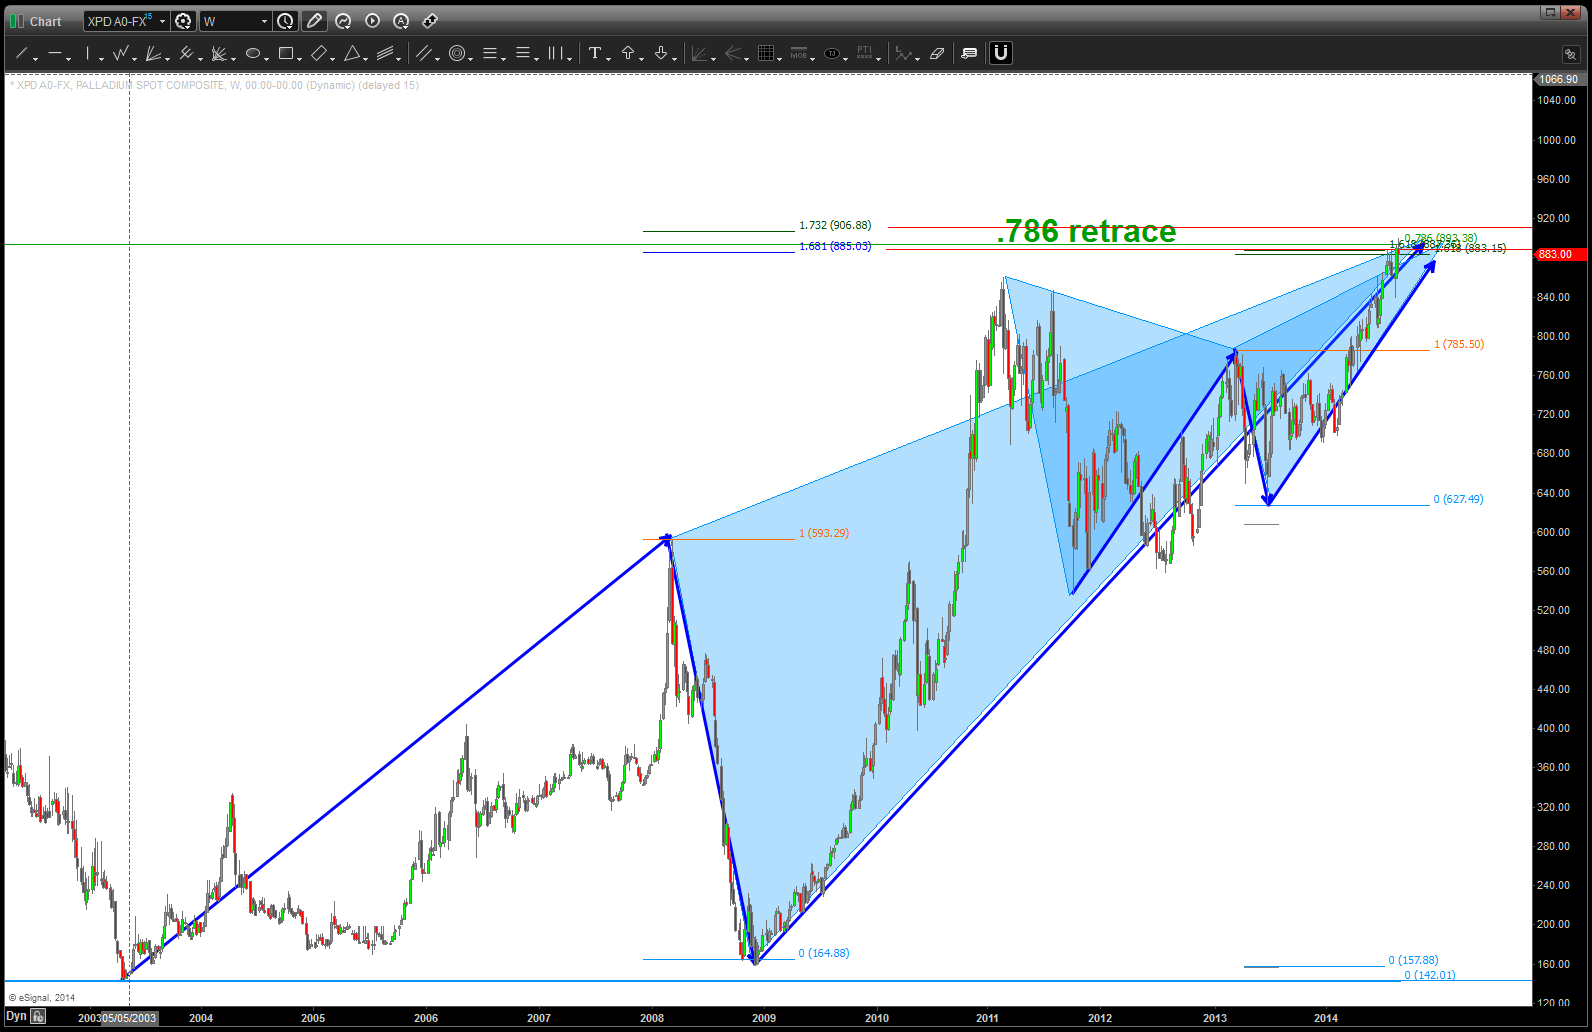
PATTERNS complete on Palladium …
here’s a potential count — note – 4 doesn’t CLOSE below 1 so I say “go for it” w/ regard to the count. Additionally, alternate targets provided at little higher. Sure seems like it wants to head up that way … ?
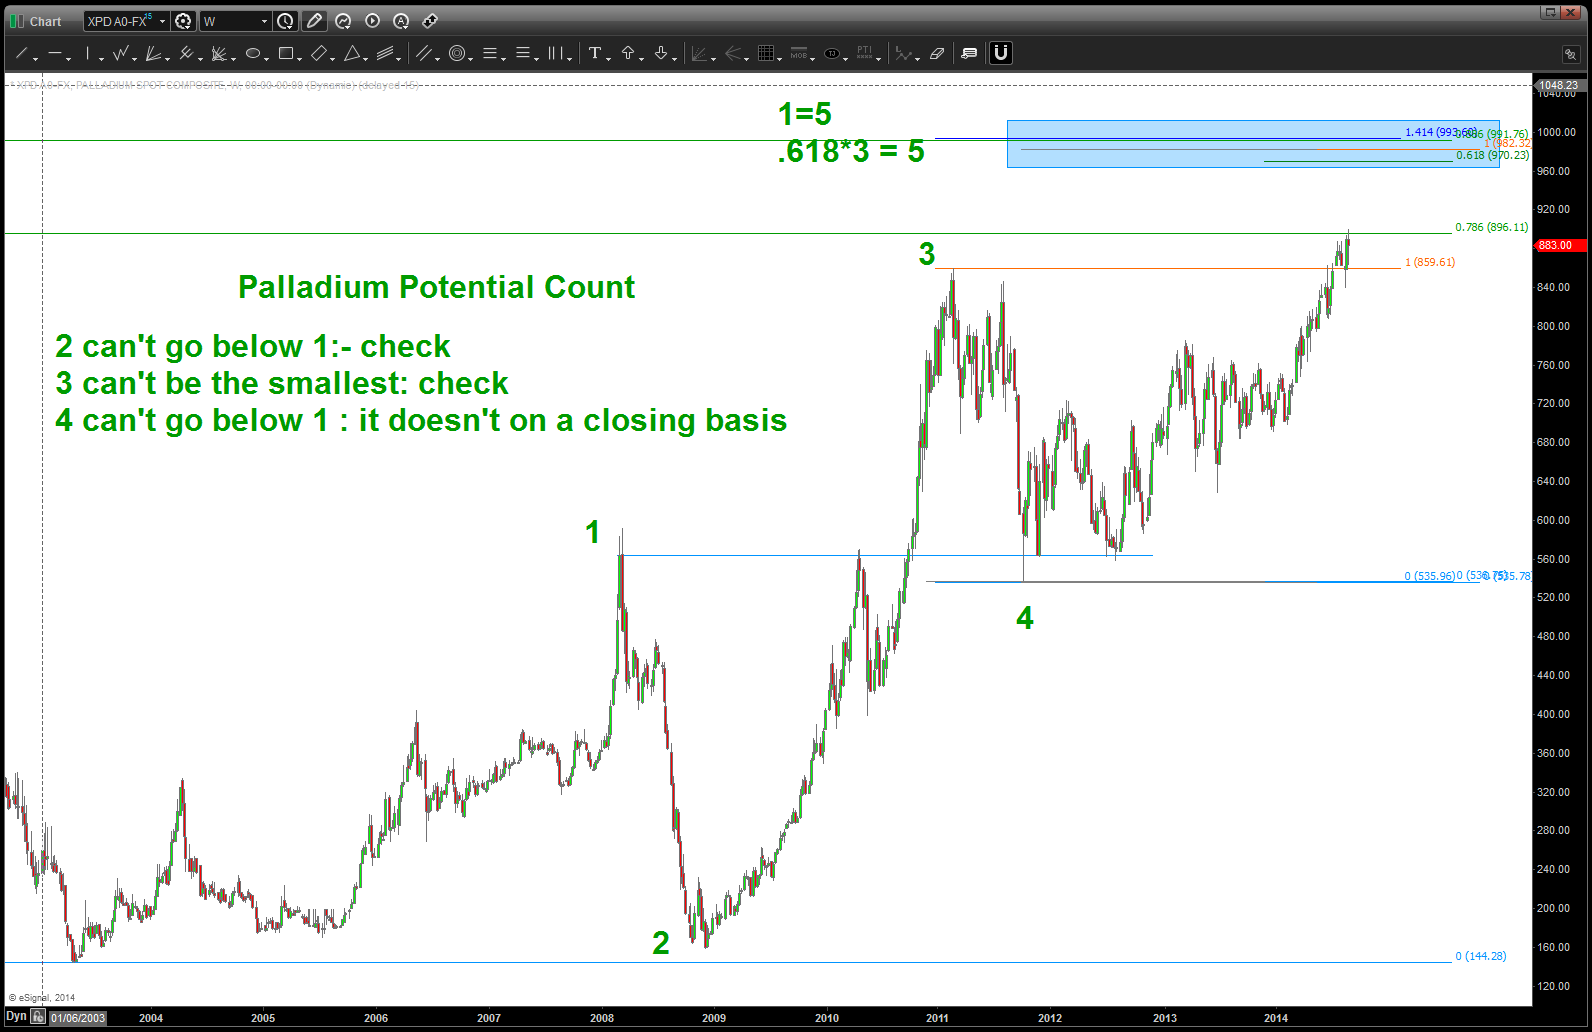
Palladium Count Potential
last thing we check is the “relative strength” using ratio analysis. in this case we have PALLADIUM / GOLD. When we overlay Gold on top of the ration there isn’t that big of a correlation. HOWEVER, when Palladium is overlaid (see below) we can see that this ratio is extremely important. And, what do we have on the ratio – a SELL PATTERN appearing, which, in the past, has caused Palladium to inflect. Stay tuned.
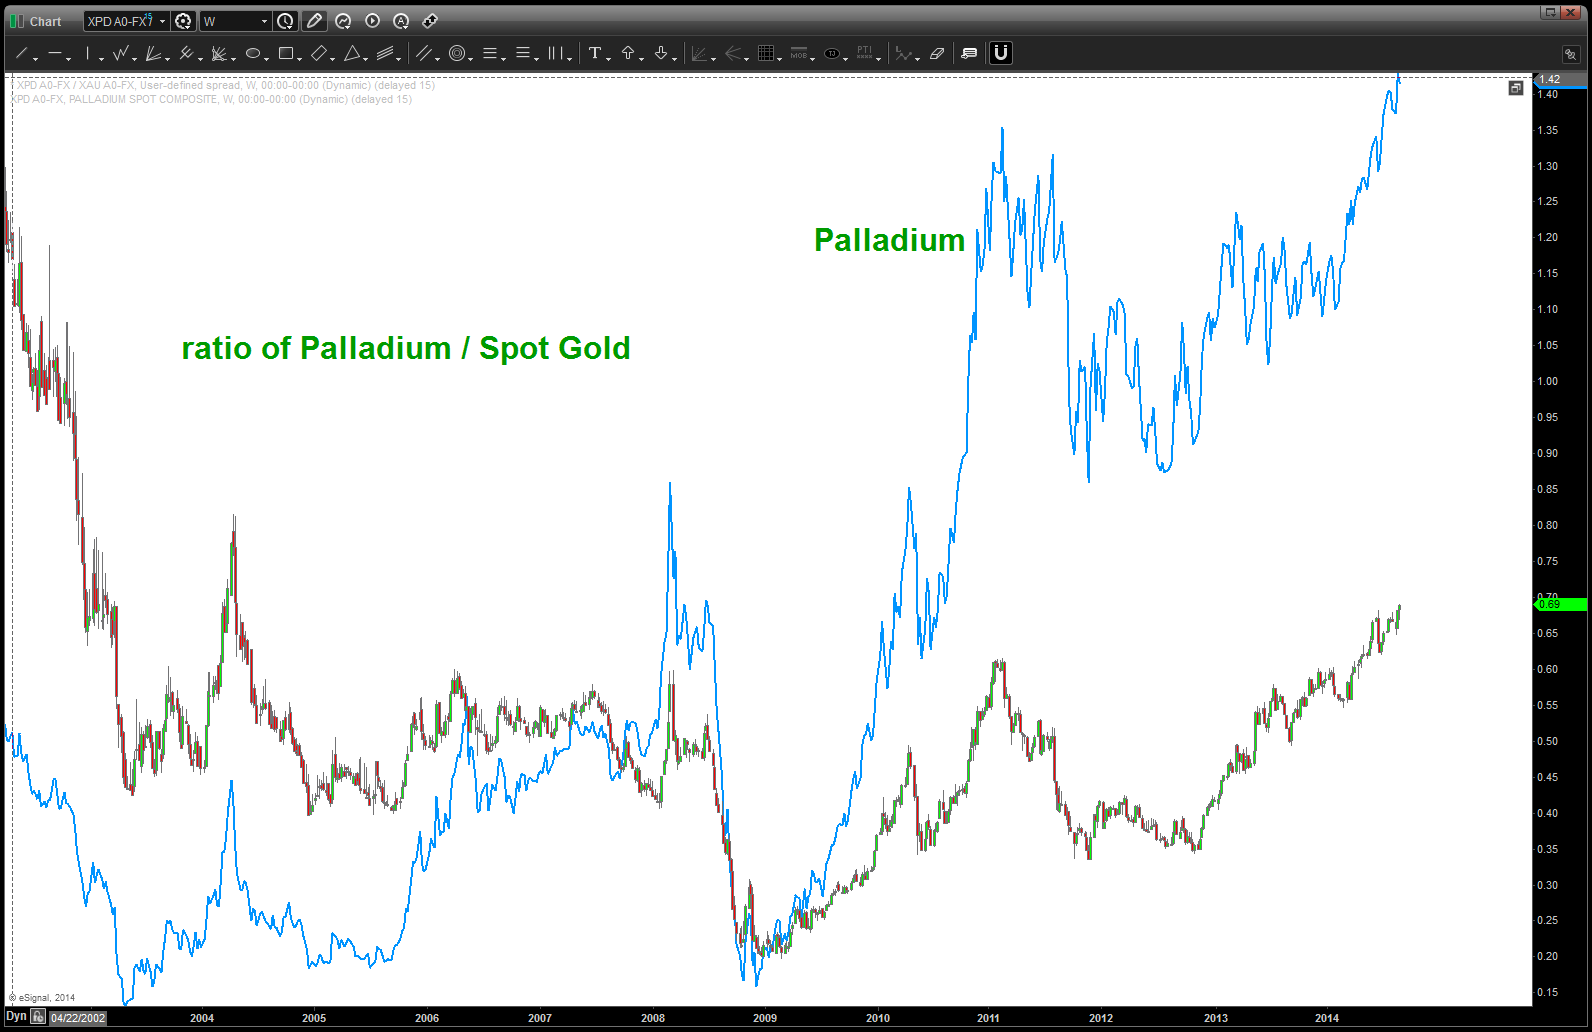
note, palladium prices overlaid and how the ratio is nicely synced w/ the highs and lows.
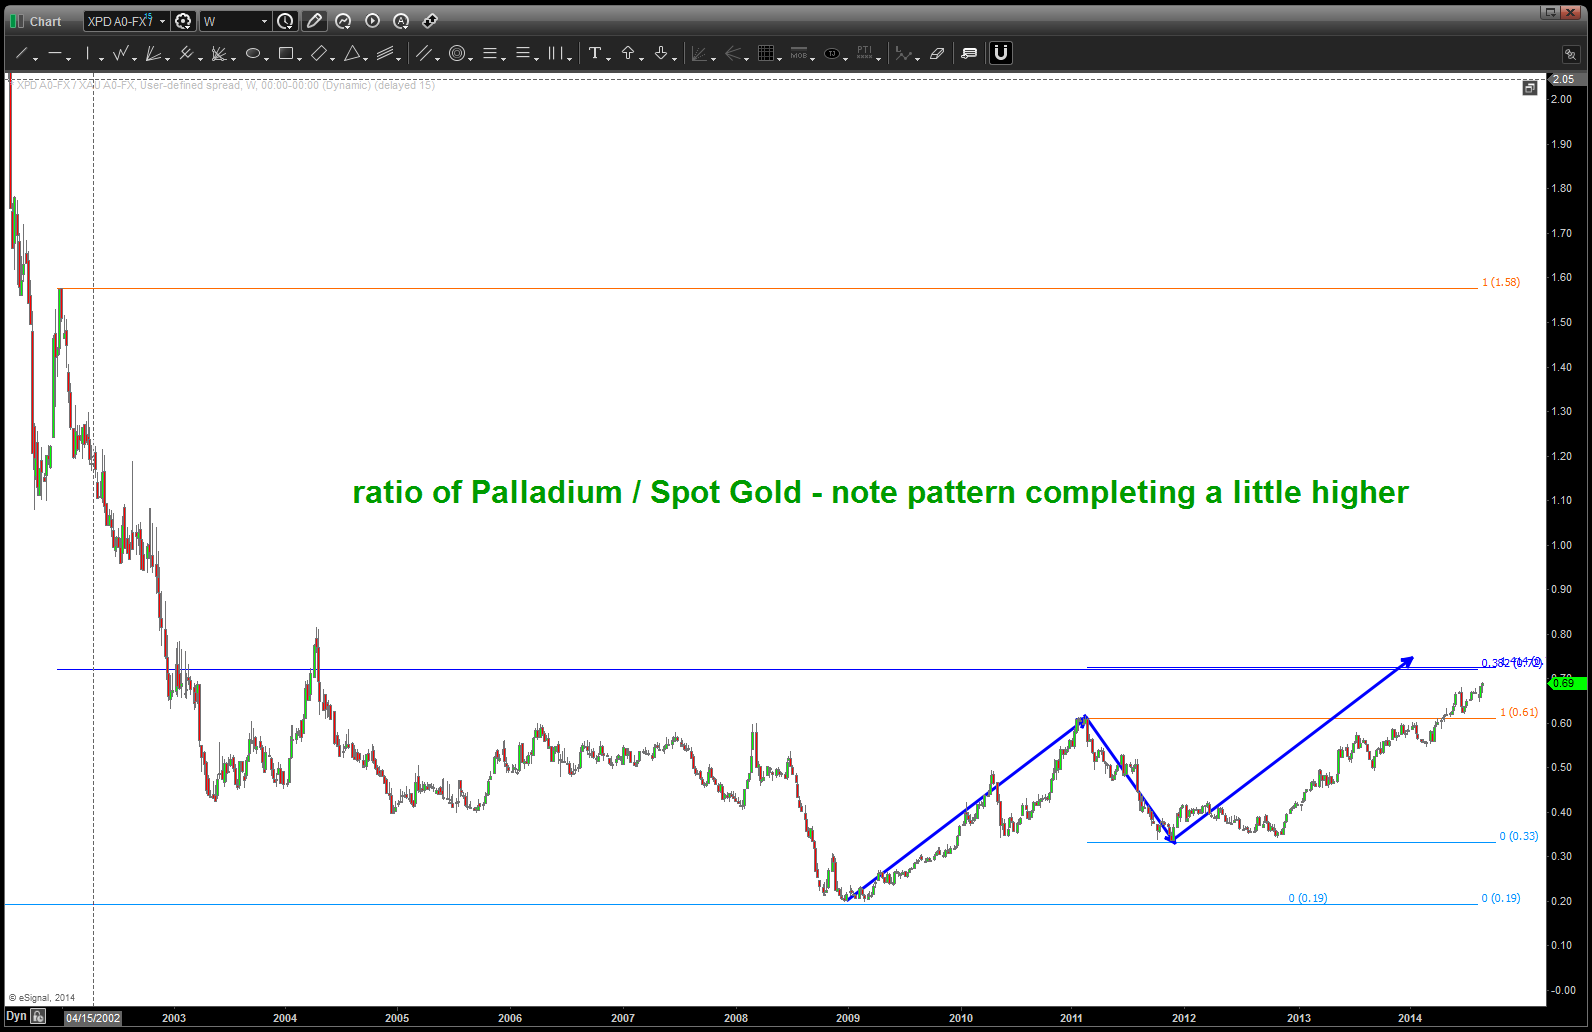
ratio of XPD / XAU – note pattern completing a little higher
So, there you have it … watch this important relationship, closely next week.
BART
EURO vs USD cross roads
Posted on October 23, 2014 Leave a Comment
I TRADE the spot currency market … as a CTA I deploy capital in the spot FX market.
I am hawking the EURO and, quite frankly, it’s at a crossroads. Why?
1) the BEARISH sentiment is at a MAJOR extreme … we have to take that into account.
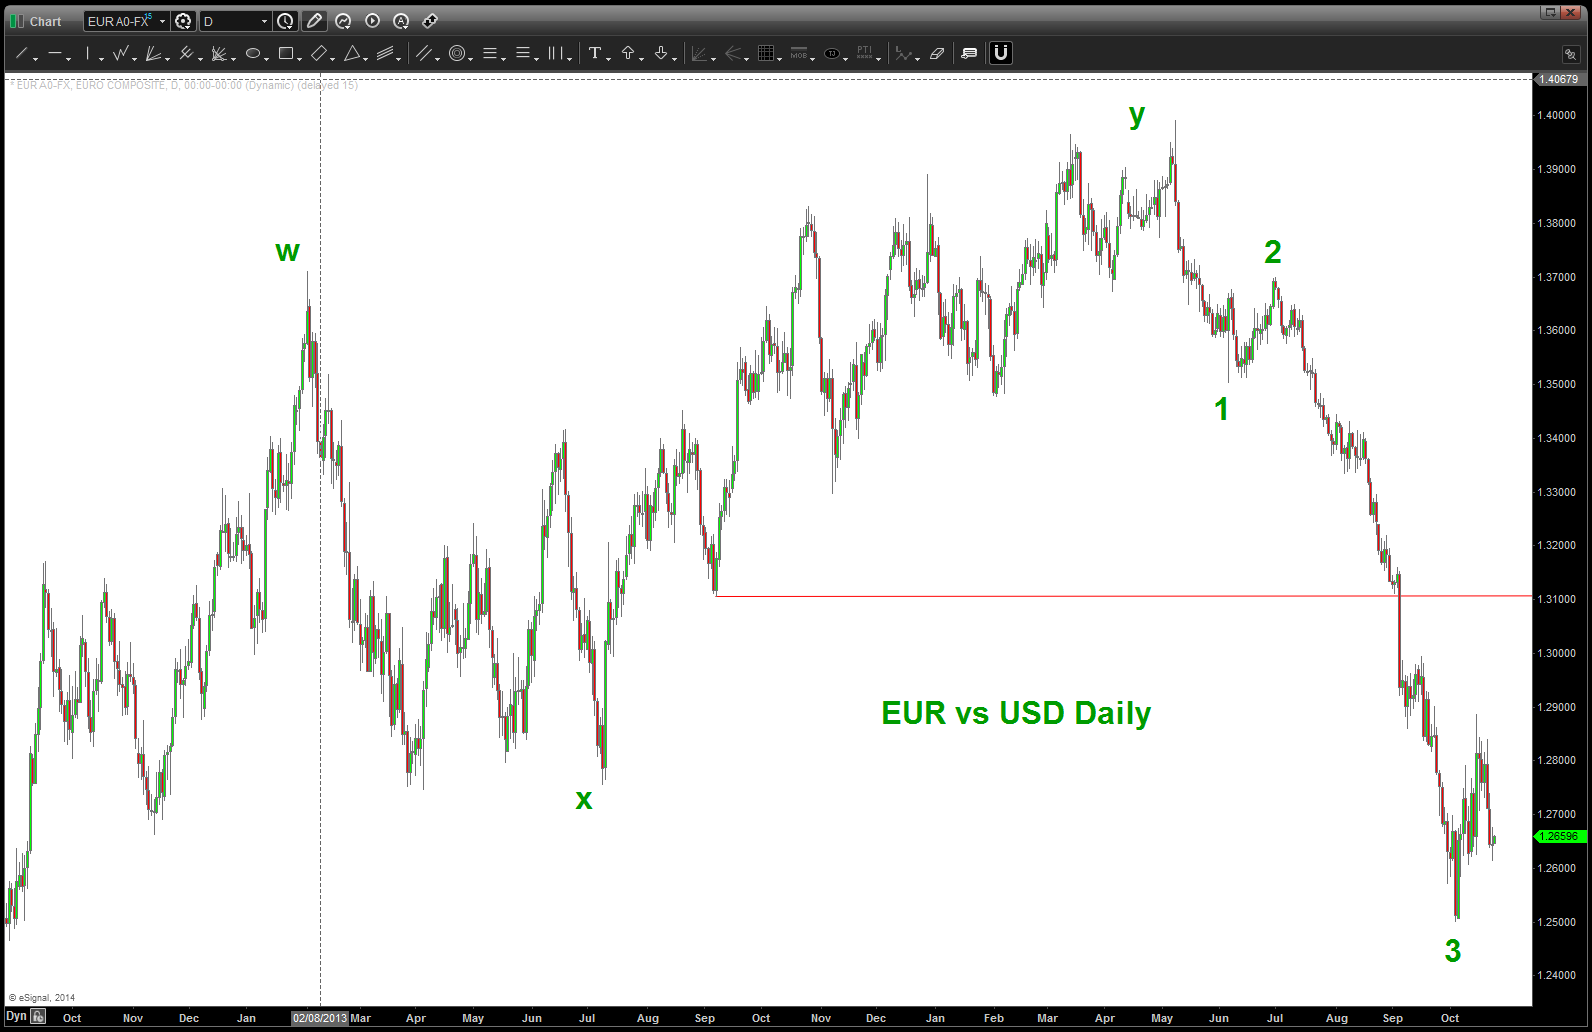
2) I feel “pretty” confident on the count shown below. (1,2,3) There IS another move down …
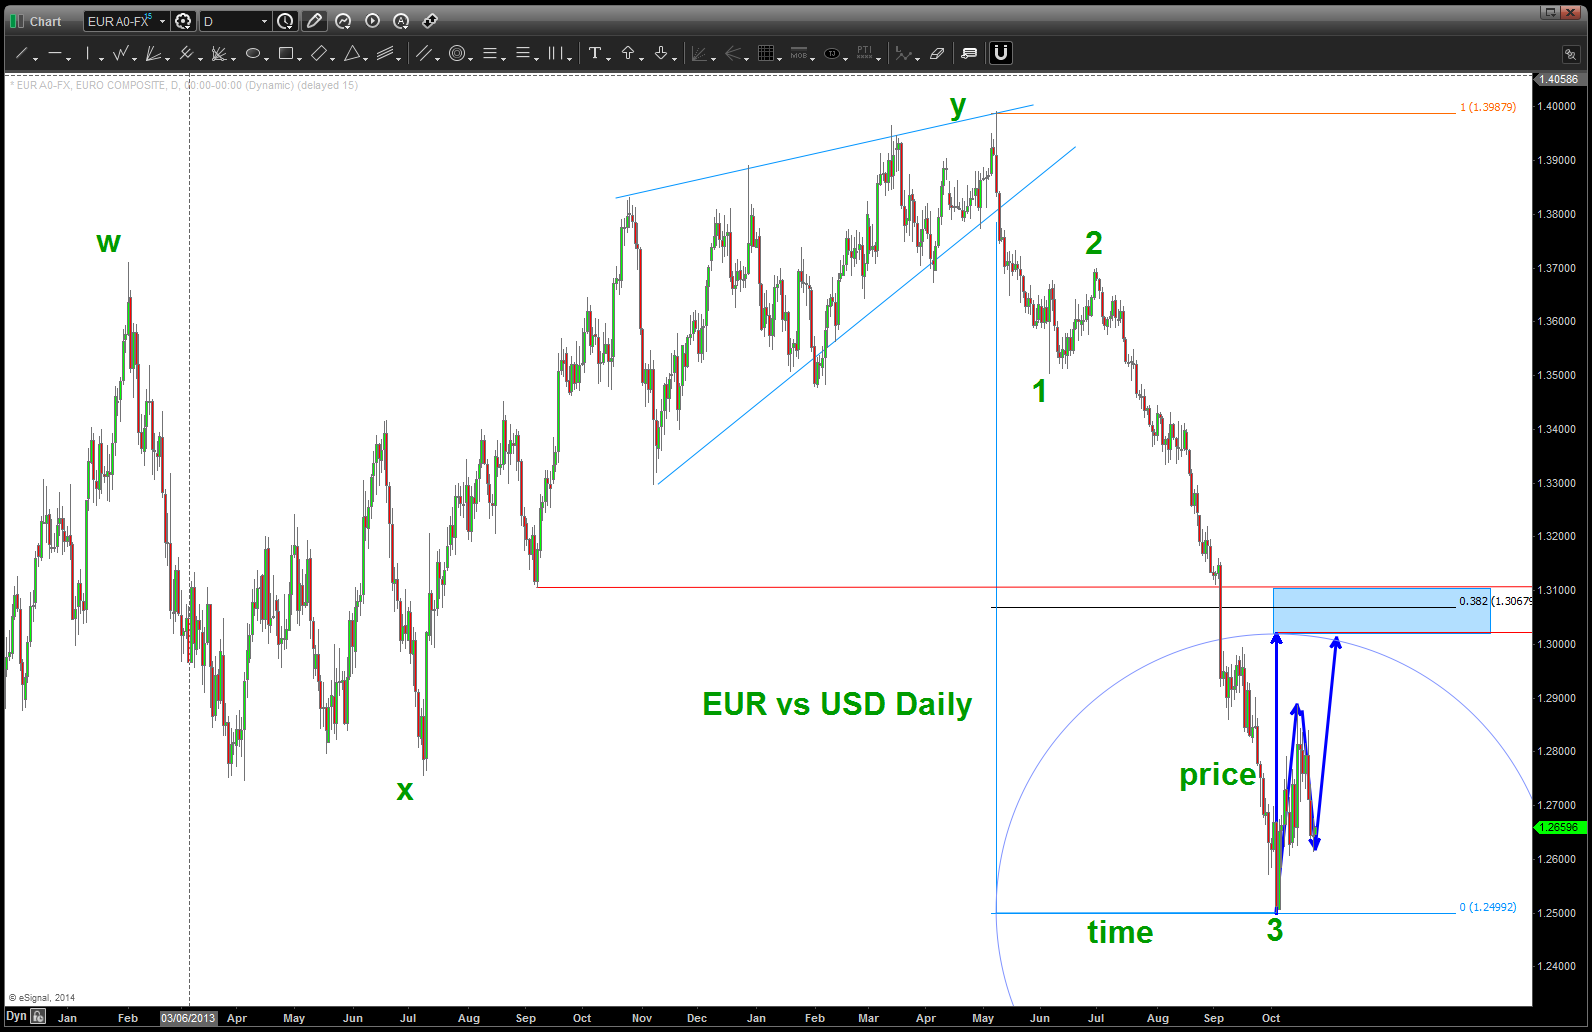
3) the cross roads is – have we completed the a-b-c OR do we have one more leg up? I am in the camp of one more leg up simply because of TIME. the last correction took a month and we still have another week to go. all that being said, we need to hold in/around here to go back UP into my desired short area. the work for that short area is below …if we don’t rally from in/around here then it’s “probably” off to the races.
4) also, posted the EXACT low on the EURO via the square out technique here: http://www.seeitmarket.com/euro-time-price-square-call-bottom-13830/ the fact that we had the square out also tells me go higher.
guess we’ll just have to WAIT and see …rock on, ok?
Bart

here’s how powerful the XLP/SPX ratio is …
Posted on October 23, 2014 Leave a Comment
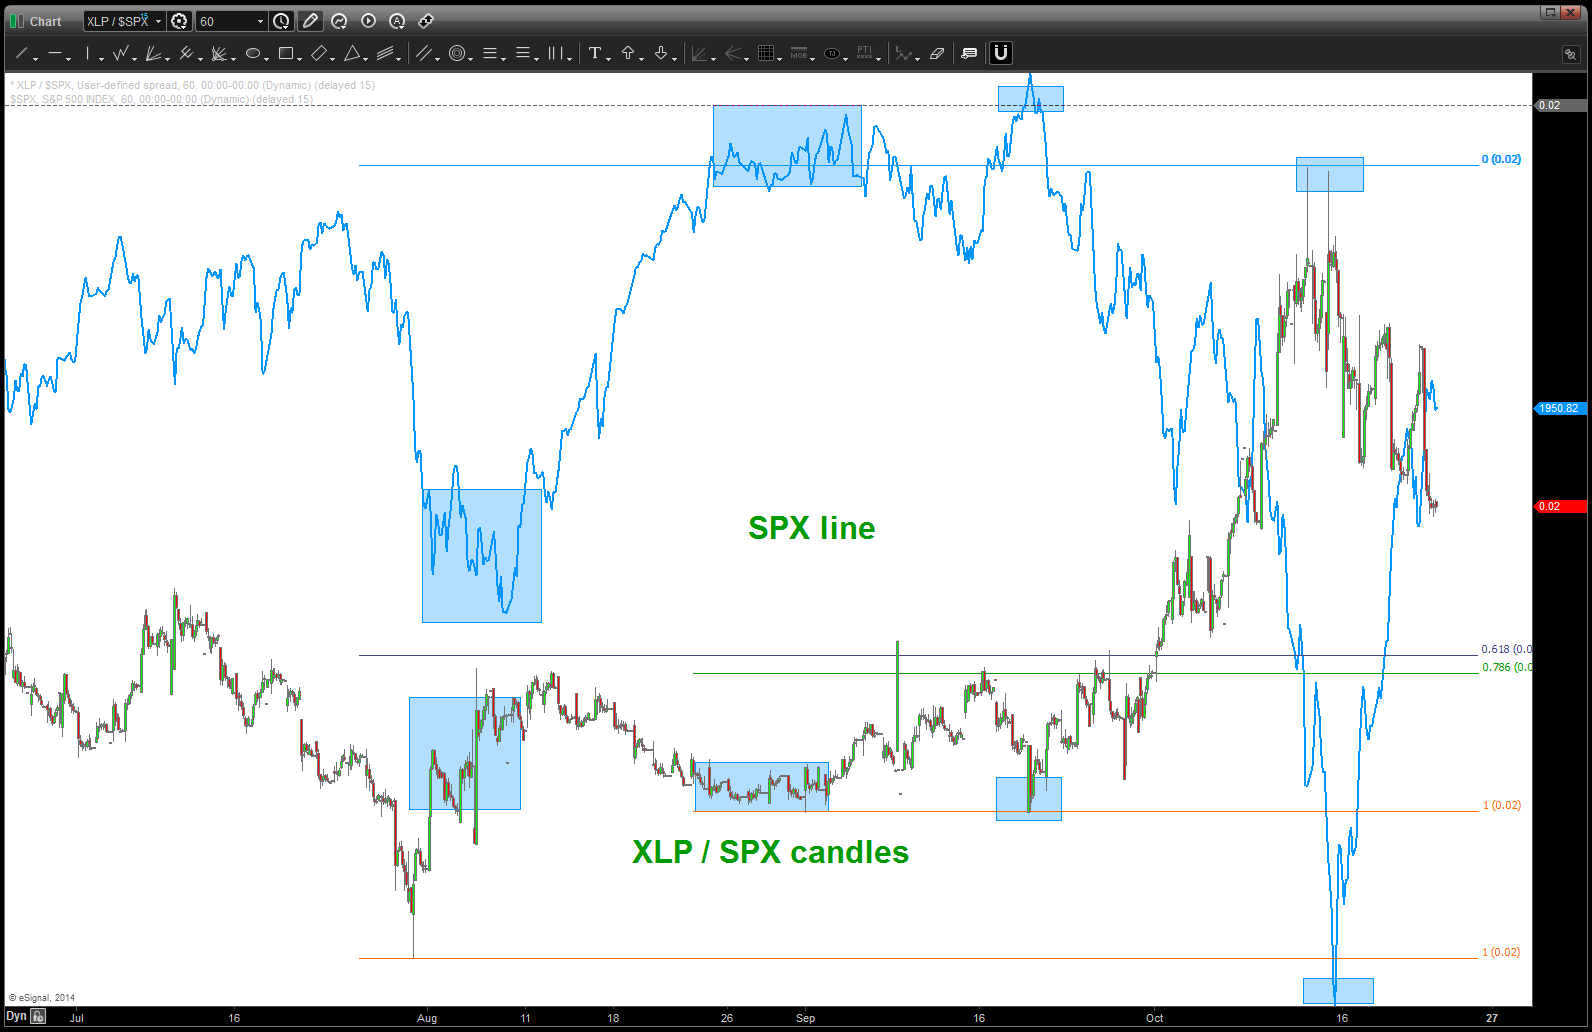
below are a couple intraday charts of the “ratio” of XLP/SPX.
note, ALL the major inflections (even intraday) are equal/opposite the overall market.
so, where does that leave us? Well, you can see a minor buy pattern (two blue triangles) but I favor lower where the .618/.786 overlap. If/when this ratio hits that level I would be a seller of the SPX.

an ideal scenario – TO SHORT!
Posted on October 19, 2014 Leave a Comment
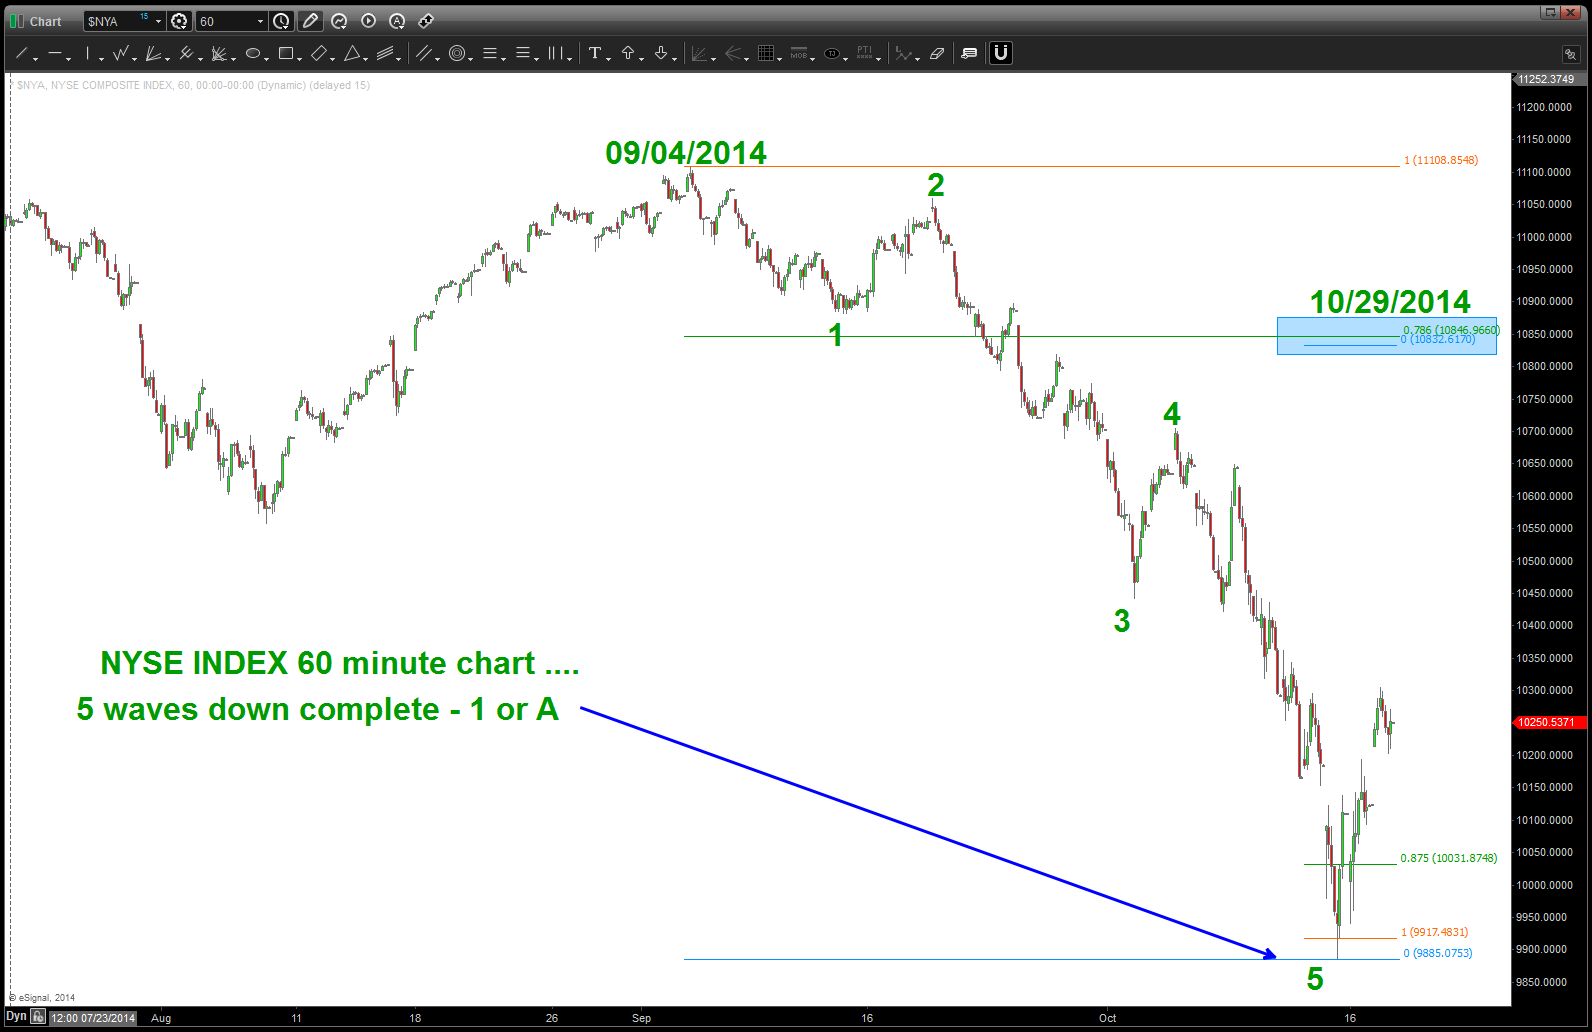
if you read this blog, then you’ll notice I’ve been pretty silent. why? well, this is all playing out to plan … MAJOR patterns completed and, well, they took a long time to form and work to be quite honest. But, read below the two horizontal lines and you’ll see the PATTERN was calling for major resistance basically right where the NYSE index hit.
of note, now, is that we completed a pretty easy 5 waves down so the rally which is happening now 1) is to be expected and 2) is just that – a rally. IF OUR COUNT is correct we are correction w/in a B wave and a C wave will follow. What is the ideal situation? Well, a rally up into the end of the year and then the next leg down? Why? In 1929, 1987 the market crashed 55 days after the TOP WAS ALREADY IN …
so, don’t get out your BULL HATS just yet … the pattern, if corrective A-B-C is not complete and we are working thru B OR the bearish implication is we just complete 1 and we have 2,3,4,5 to go.
relax, enjoy the fall weather and remember it’s always better to be OUT of the market wishing you were in than IN the market wishing you were out ..
rock on, ok?
Bart
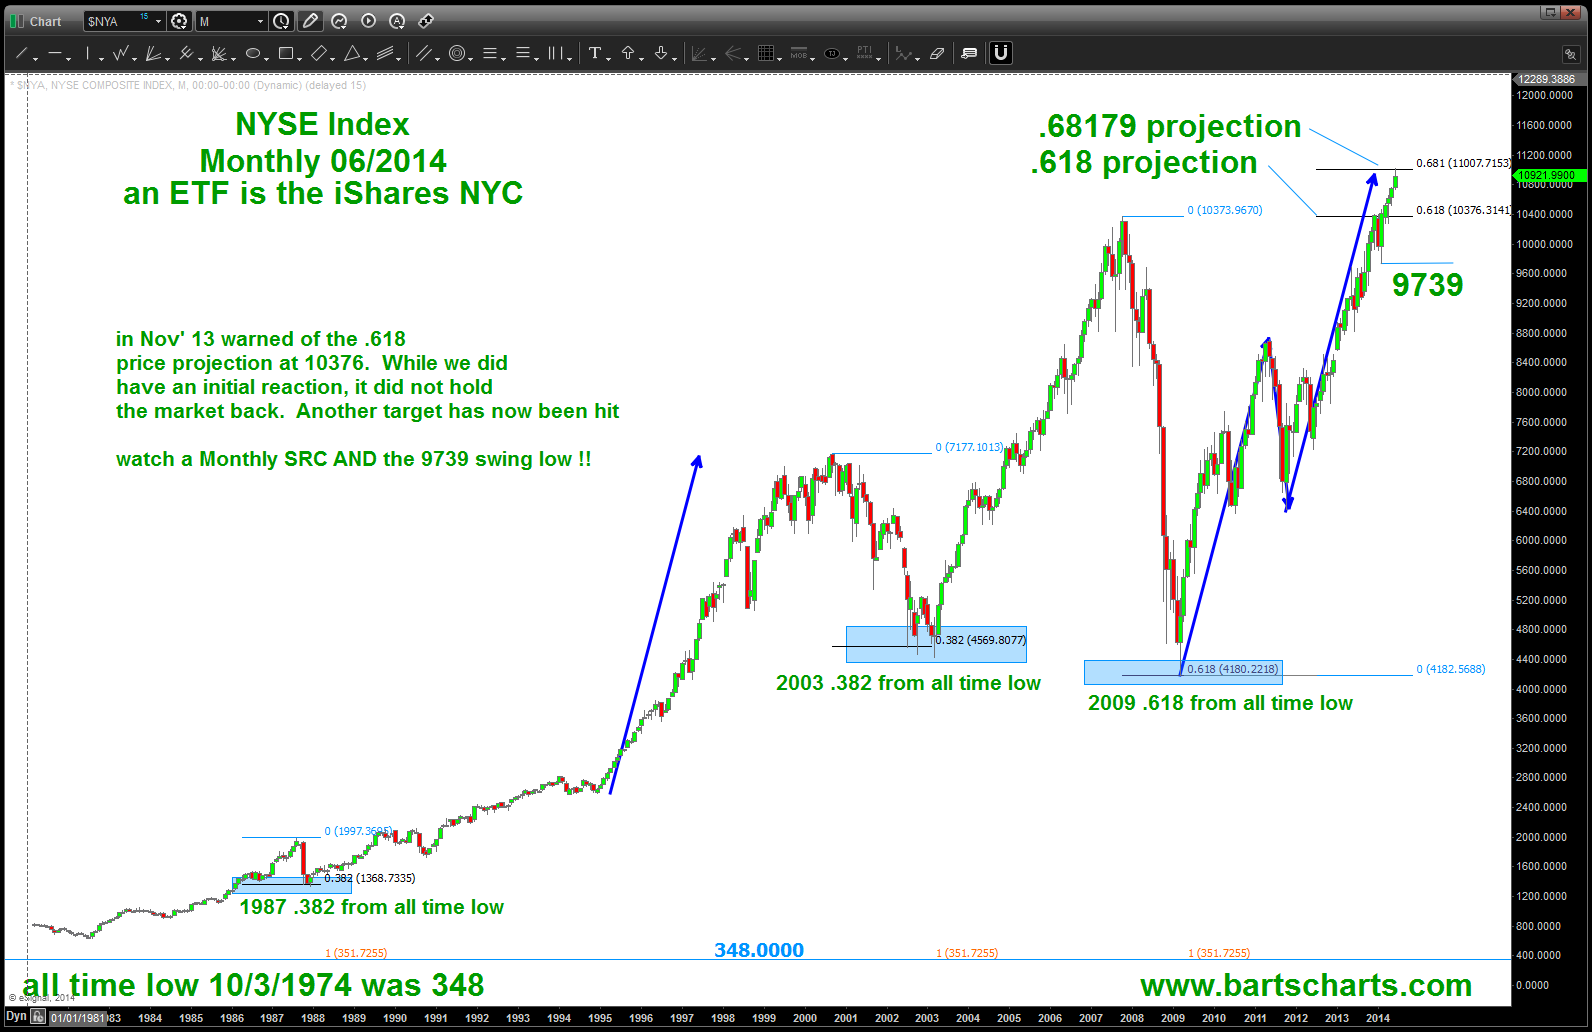
NYSE INDEX
CLIFF NOTES: in November 2013 I posted that a .618 price projection was hitting in/around 10376 level. while it did cause a month of selling AND gave a monthly signal (go look at the chart) the market subsequently “recovered” and caused the pattern to fail. Now, we have “another” pattern completing as shown below. Patterns do fail. That’s been proven .. however, a majority of the time they WORK. So, watch the swing low (it’s a monthly) and keep your powder dry. Also, the musical note F# ratio of the equal octave scale is 1.68179. Just showing that a .68179 projection works also … it’s all music.
Folks, a 10,20,30% correction is NEEDED.