Crude Oil … a potential roadmap
10/2/2014: we are at a very crucial junction w/ regards to Crude Oil. the big picture is resolving and, quite frankly, I’m not sure which BIG directional move to favor so i’m just going to TRUST the PATTERN that might have completed today. There’s an interpretation on IF the patterns works AND if the pattern doesn’t work but either way, believe we have a “line in the sand” so to speak from which to draw our conclusions and watch for confirmation in any direction. That’s why we are technicians – let PRICE and TIME be our guide.
today we have a very nice 3 drives to a bottom w/ a butterfly pattern that hit almost exactly and a rather nice INTRADAY pattern completed. we DO NOT have a DAILY signal reversal candle. that will not happen until we CLOSE above 93 on a daily basis. here’s the chart:
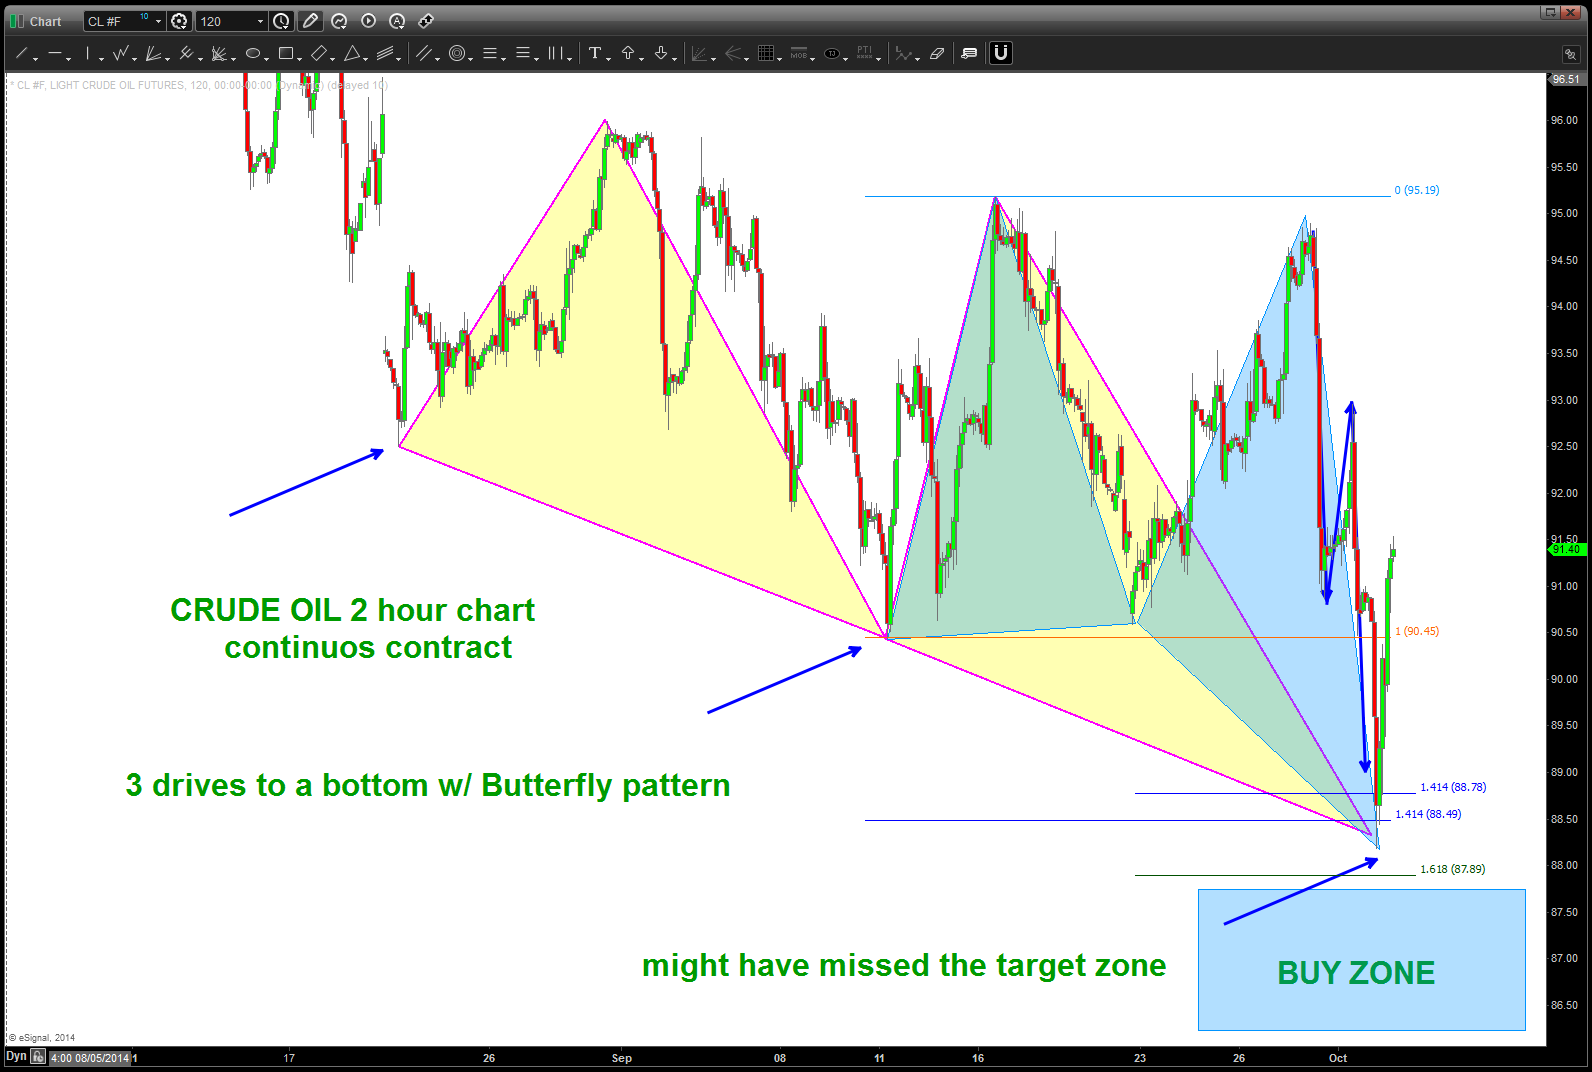
Crude Oil Intraday Patterns completing
as you can see it didn’t go all the way into our BUY ZONE so it still “might” fail into that area but based on today’s action …. not sure the probability is in our favor. here’s the math behind the daily set-up:
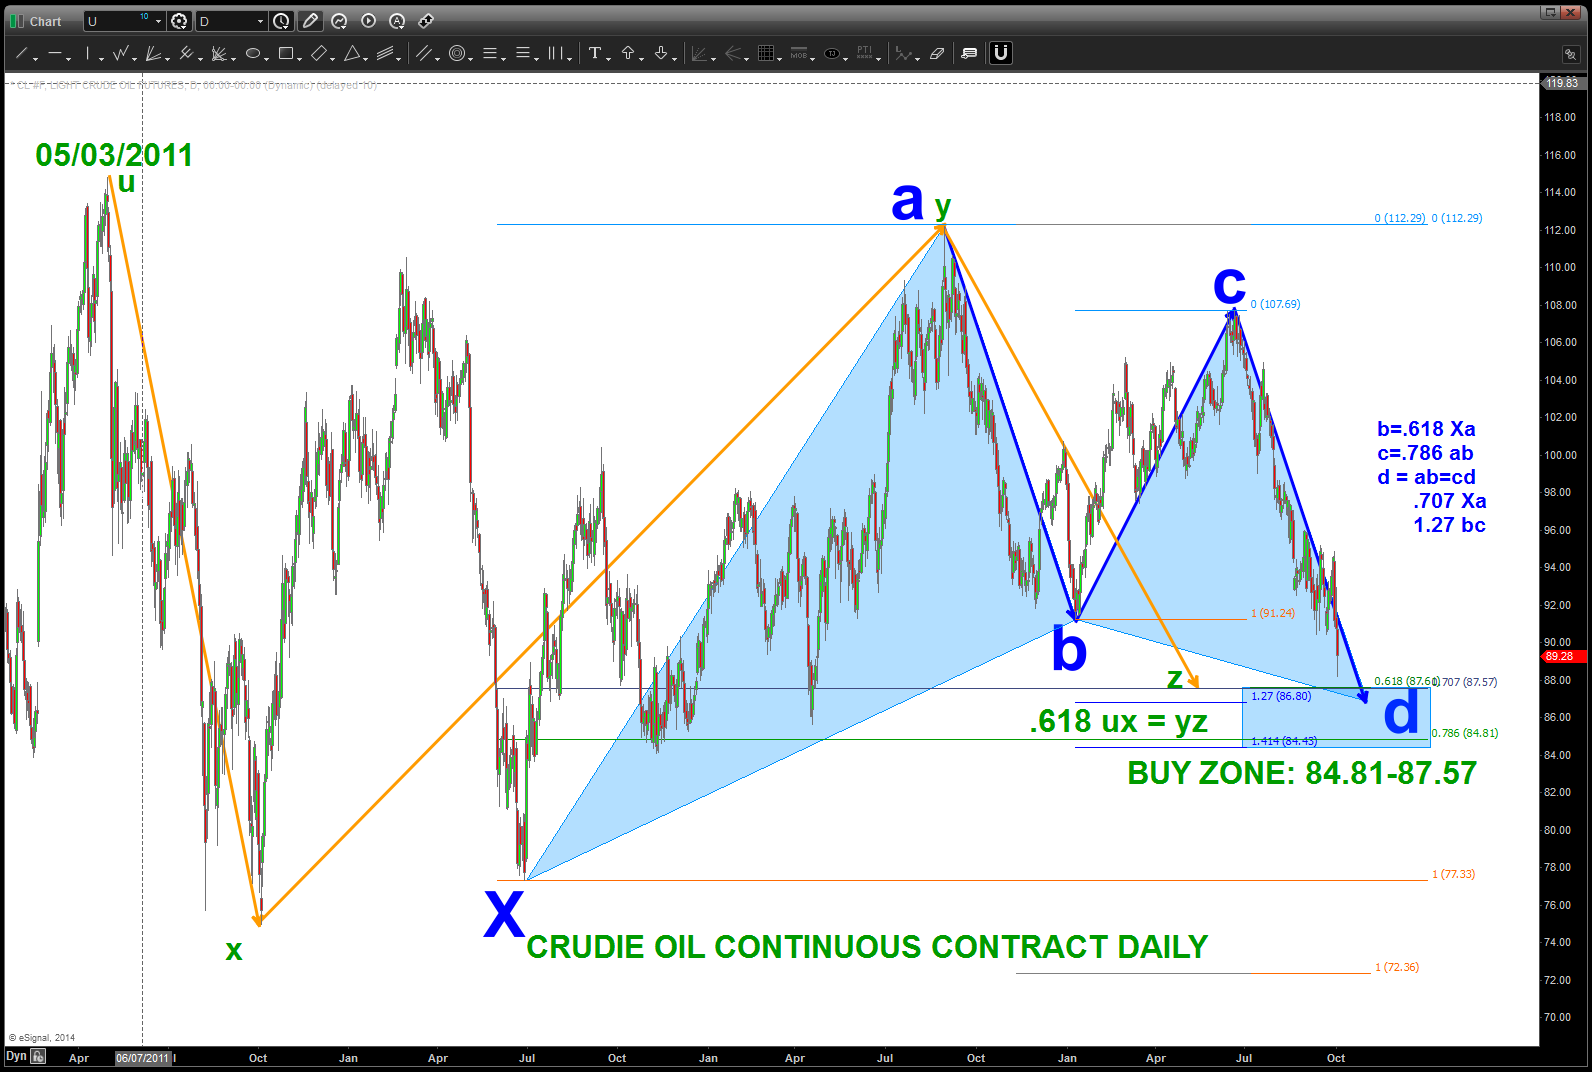
Crude Oil Daily Pattern
w/ those patterns as our backdrop why is the area we are in “now” such a big deal? well, for those of you trained in Elliott Wave theory we are finishing the 5th wave of contracting price action. that contraction is “usually” named a triangle and can be labeled a,b,c,d,e. In the context of the BIG PICTURE this level is EXTREMELY IMPORTANT because it’s my conjecture that from this area we are either going to 1) move to new highs to ultimately attack 200 OR 2) crash and burn into the low 20’s. YUP … that’s what I’m saying and based on longer term patterns, that’s what the picture presents.
here’s the long term play for both the bulls and the bears. I will present each chart and then provide some commentary …
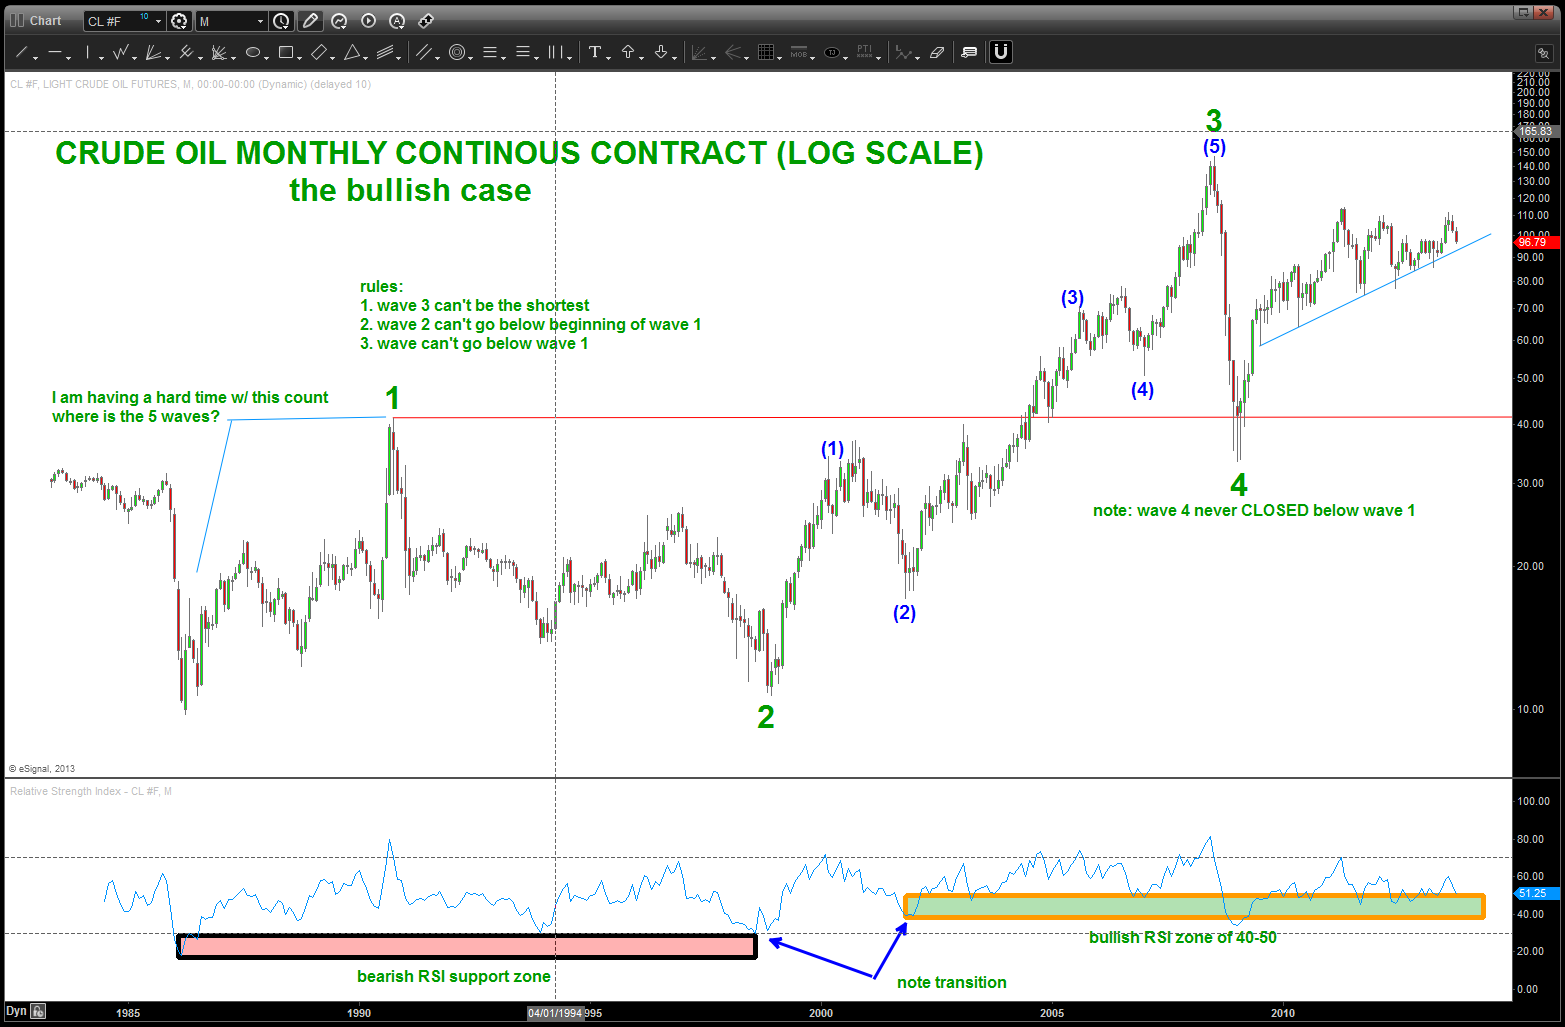
THE BULL CASE:
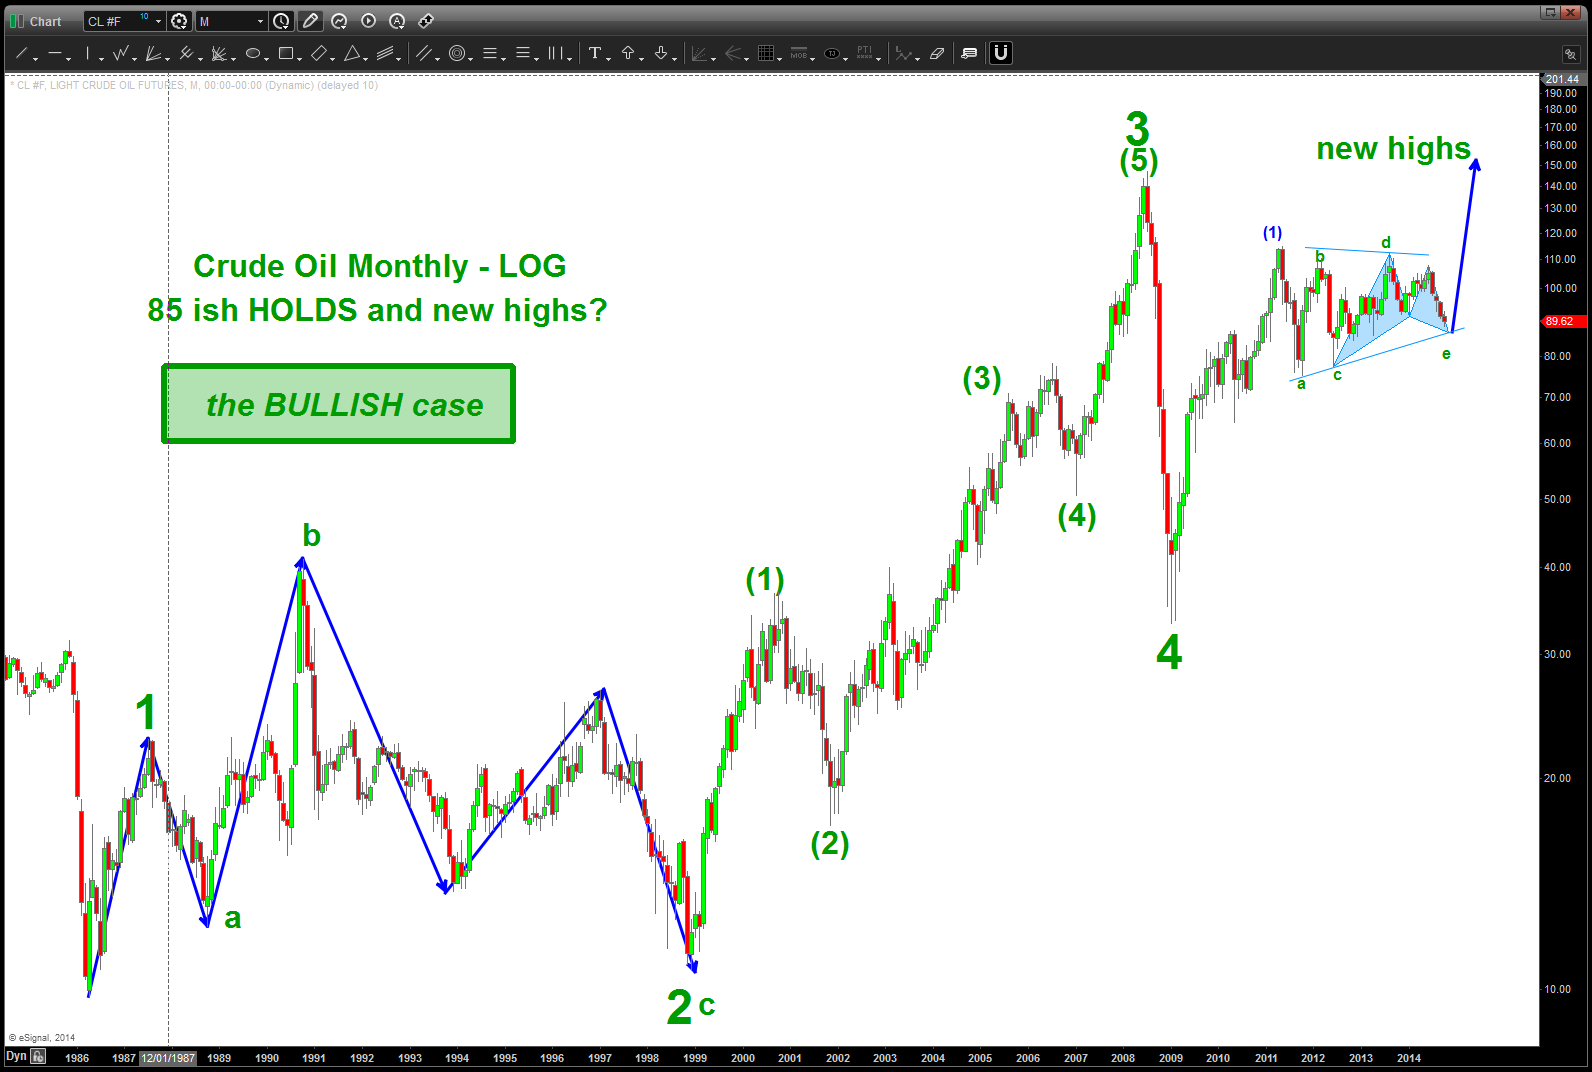
Crude Oil the BULL case)
Here’s what we know:
- using LOG scale helps see the moves move clearly. this is a log scale of the crud oil monthly continuous contract
- the move from 10-149 was a clear 5 waves UP.
- the correction labeled 4 DID NOT go below 1
- 3 is not the shortest
- 2 does not go below the beginning of 1
- folks, that’s a valid count.
- now, what I don’t like is the TIME distance of the c-d leg of the triangle. it just doesn’t “look and feel” right ….
- so, on the BULLISH side of the house we have a BULLISH buy PATTERN that completed today or a little lower that represents the end of a triangle (e)
THE BEAR CASE:
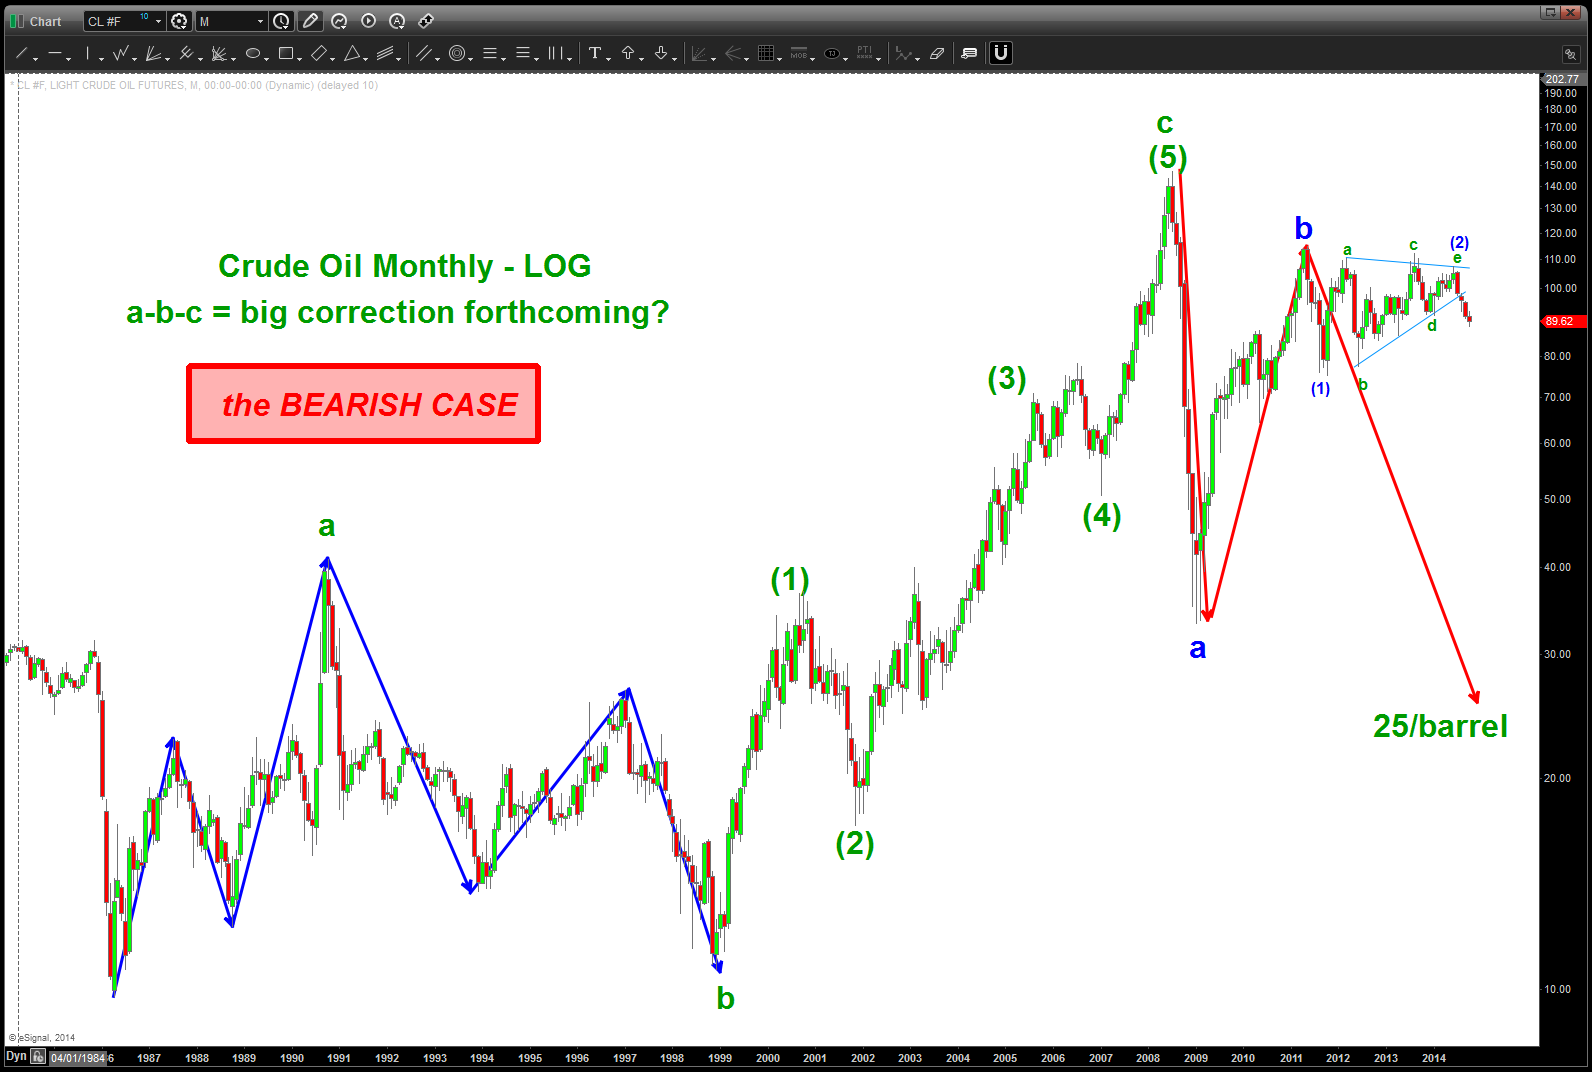
CRUDE the BEAR CASE
Here’s what we know:
- using LOG scale helps see the moves move clearly. this is a log scale of the crud oil monthly continuous contract
- the move up from 10-49 was a clear 5 waves UP
- the primary a and b waves are 3 waves and the c wave is 5
- folks that’s a valid count
- the triangle sure looks better from a look and feel perspective ….
- for a to equal c (doesn’t have to but usually does) this move down could reach all the way down to 25/barrel.
one last, here’s a chart of the XLE / SPY. we just broke some crucial trend line support … hmmmm
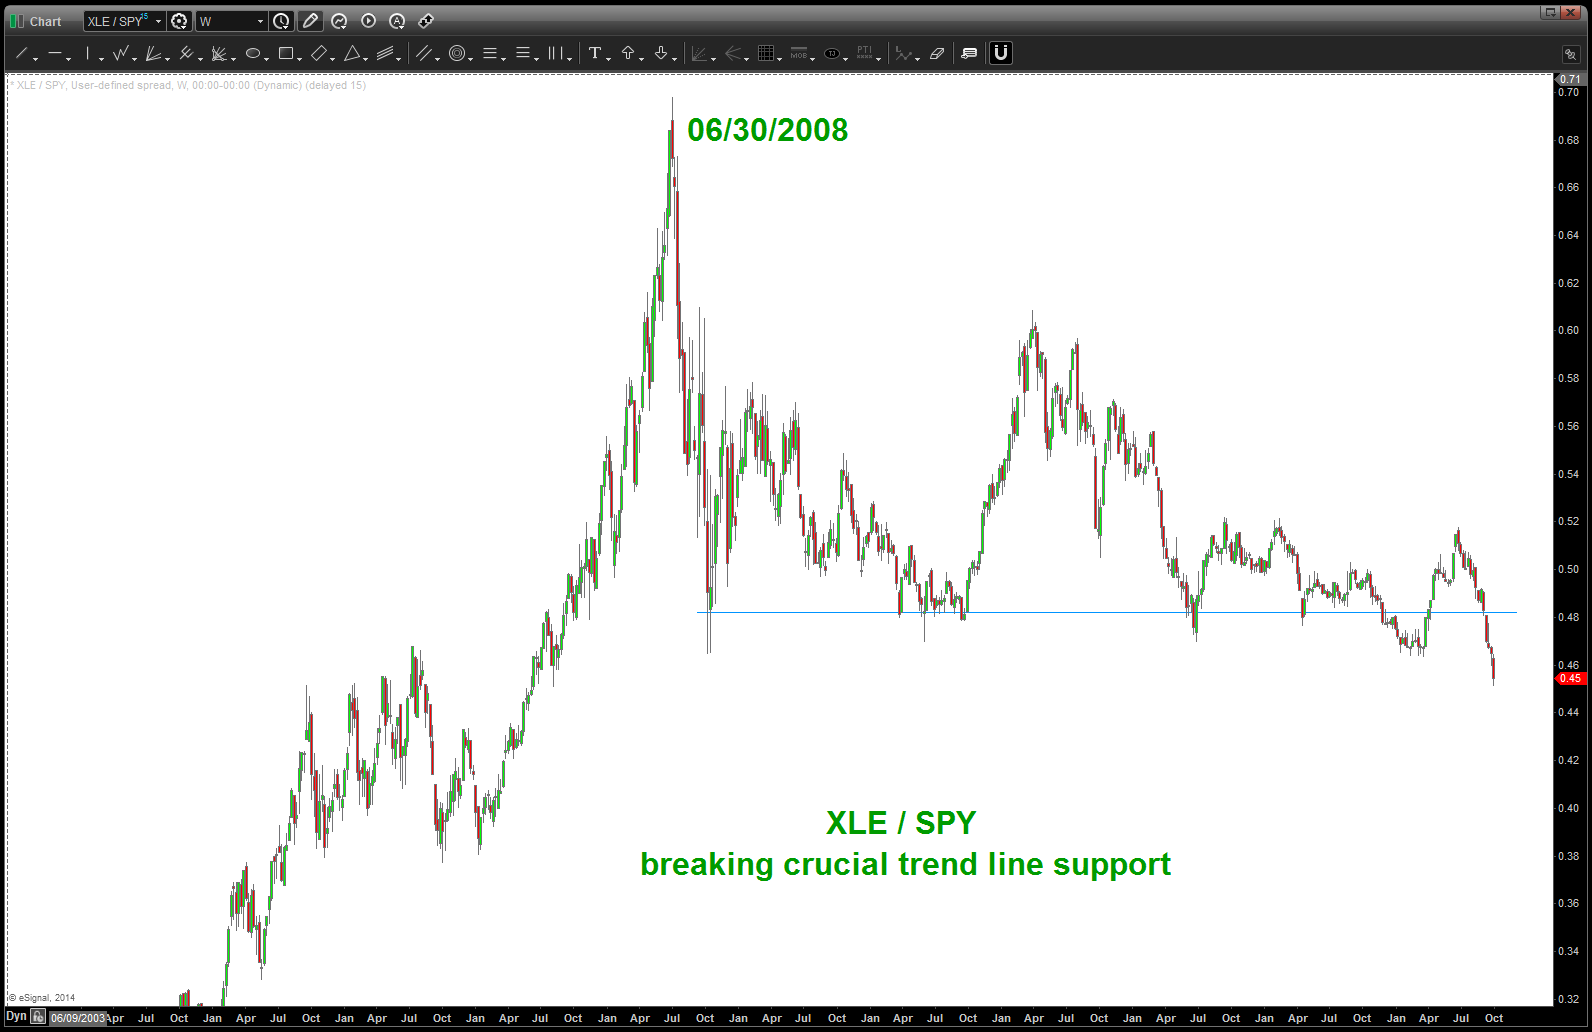
XLE / SPY
wish I had longer chart data as that might help resolve the conflict on the bullish vs bearish case. right now … well, we have a pattern that has been hit or about to be hit and, well, let’s see if it works or not. I HAVE NO IDEA OR OPINION EITHER WAY … but it will help provide a road map once it resolves and that’s kind of cool, I think (?)
rock on, ok?
voo doo man out — B
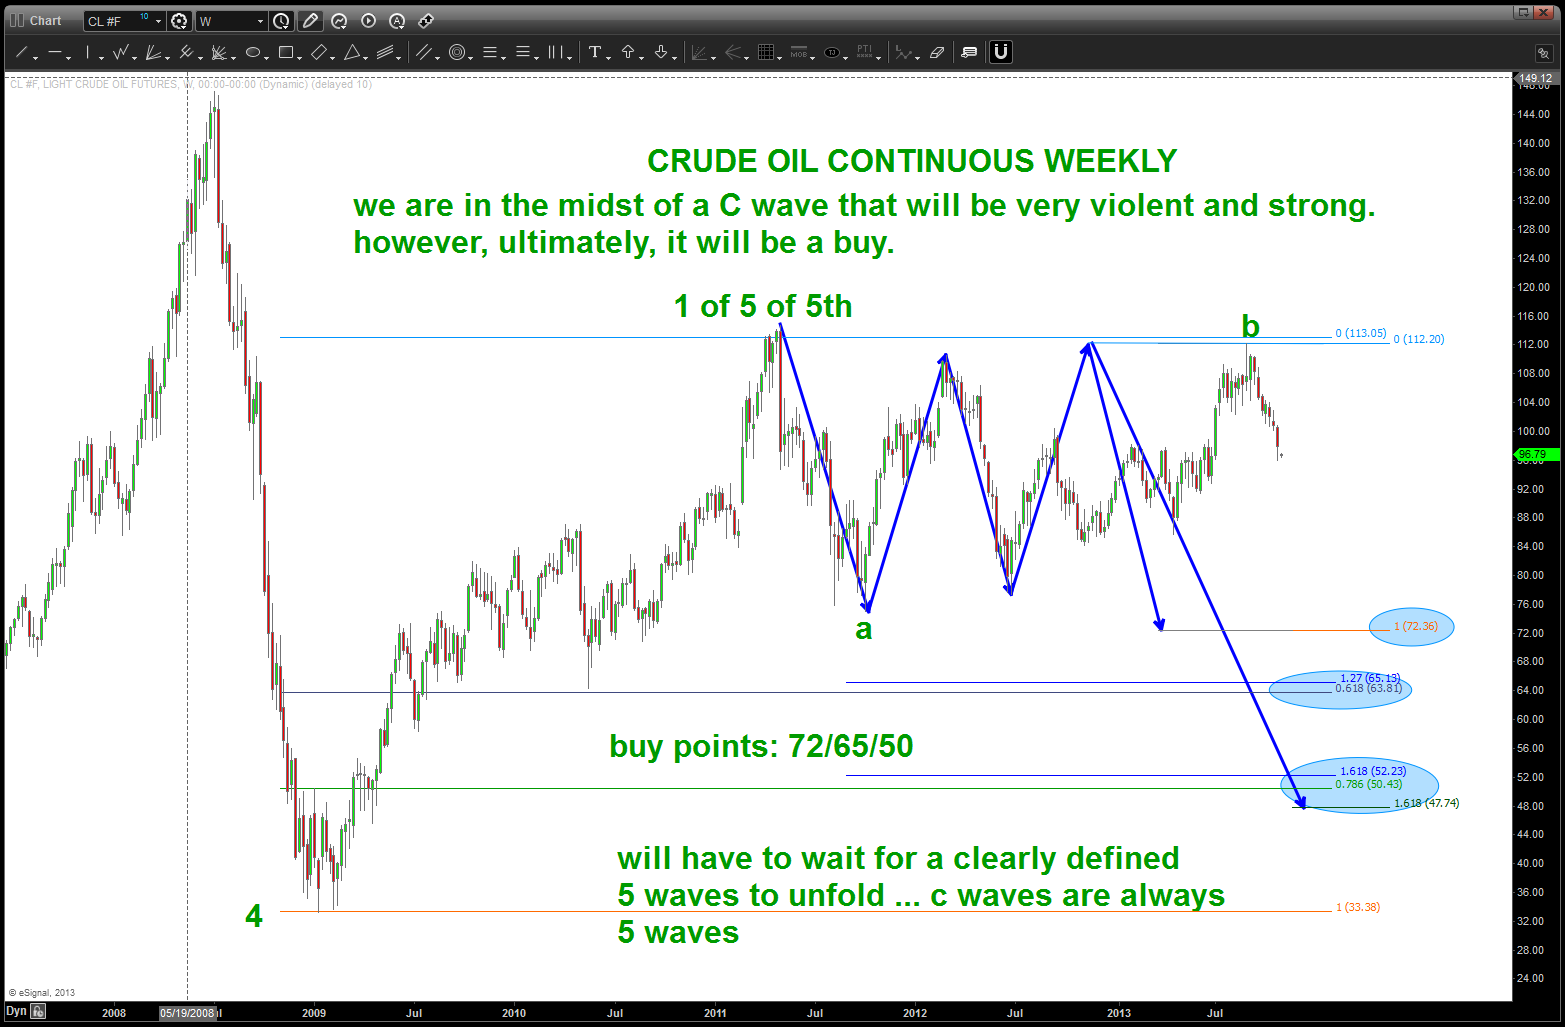
10/31/2013: I enjoy this chart, not only for the amazing dynamics of the math and harmony but … I’ll tell you in a minute
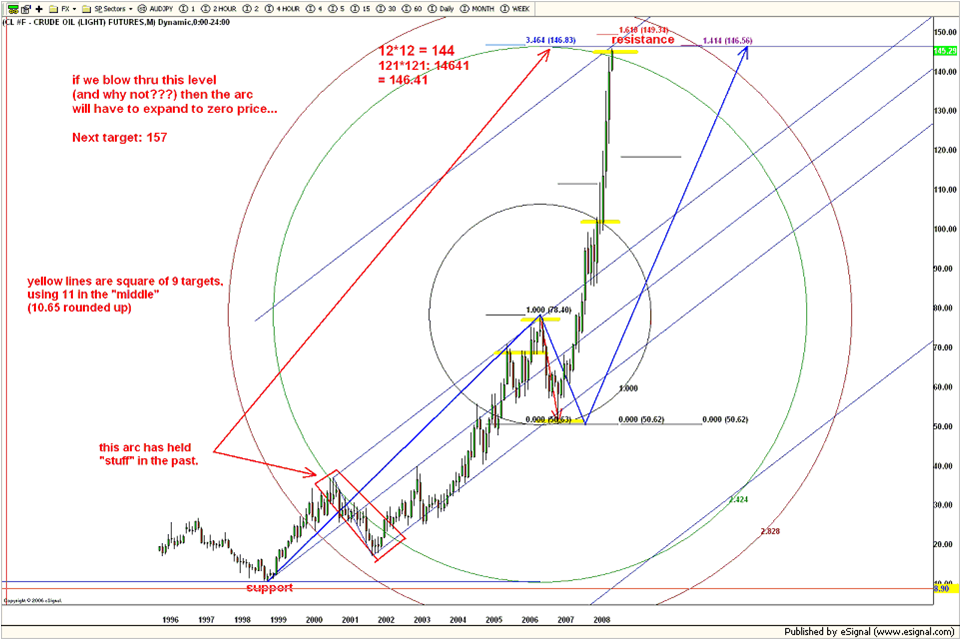
Exact high on crude oil …
here’s why – it occurred on my birthday! 🙂 July 11, 2008 was the high on crude …
anyway, I have to admit that this scenario I am putting out on the blog is, perhaps crazy, but it’s an interpretation that you can pay attention to or not … the one thing I DO NOT LIKE is that first move up from one ….it sure looks like only 3 waves and, well, that can’t be right BUT in the context of the picture it fits so I am going w/ it. the other thing is wave 4 can’t overlap the end of wave 1 and well, technically, it does go threw there for a bunch of months but NEVER closes below so I’m working w/ that one also .. subjective interpretation so to speak.
so, below are the pictures that I”m working w/ … the thesis is we have a very powerful C wave in oil down that has just begun and one that will, ultimately need to bought – perhaps 6-9 months from now … enjoy.
a POTENTIAL count