JPM Voo Doo
Folks, almost a year ago this pattern was ID’d on JPM … pretty crazy hugh? here’s the updated chart – pattern appears to be hanging in there. any daily close above, say, 63 would be a pattern failure IMHO.
again, before hitting the sack, it simply amazes me that I can sit here in my home office w/ a computer drawing lines and come up w/ a NUMBER that the market will respect. Just checked and the average daily trading volume is roughly 10MM shares a day. folks, I don’t know but that’s a lot of shares …
so, for whatever reason, way before it ever got to the NUMBER 61, a simple PATTERN RECOGNITION dude ID’d the pattern and pointed it out ….
whomever is BUYING or SELLING those 10MM+ shares/day decided to stop BUYING at/around that EXACT number …
yup, pure VOO DOO …
let me know if you want to push the I believe button ….
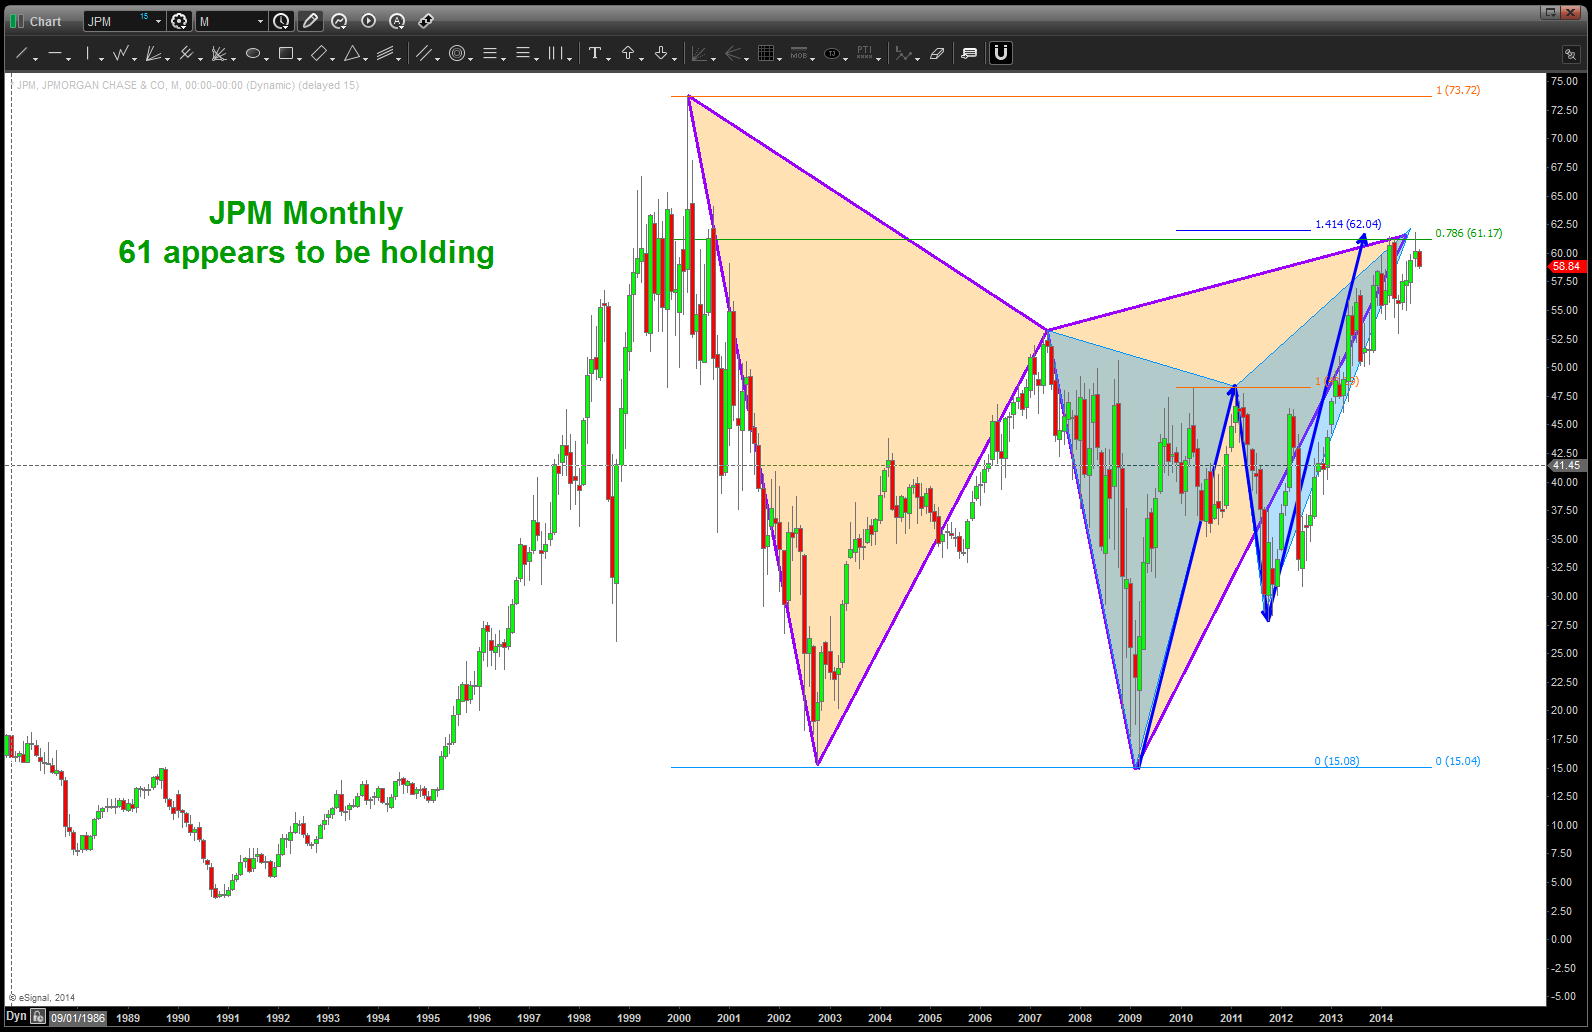
JPM P A T T E R N hanging in there …
one last chart .. actually presented this chart at the MTA’s annual symposium and it’s the EXACT LOW (real time) of the JPM low in 2009.
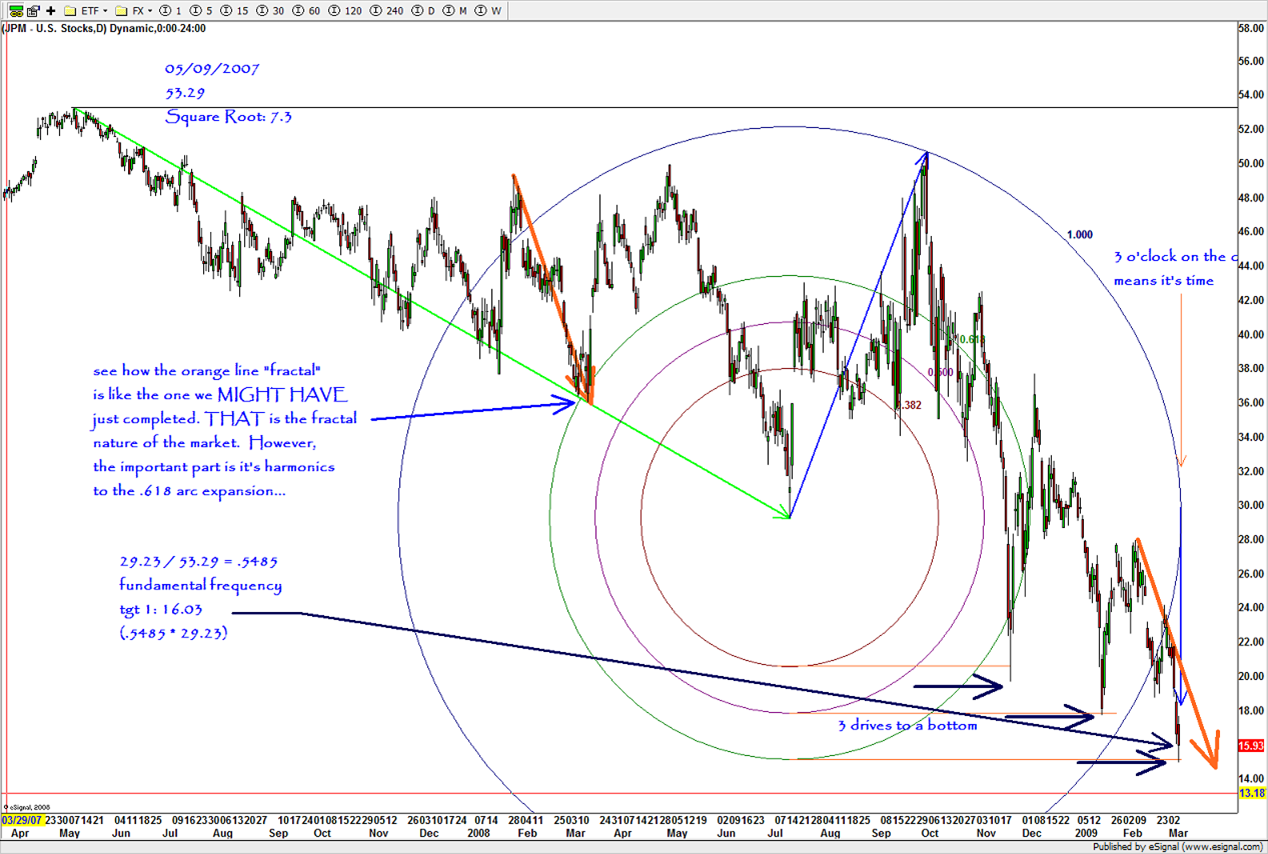
chart presented at MTA
11/19/2013
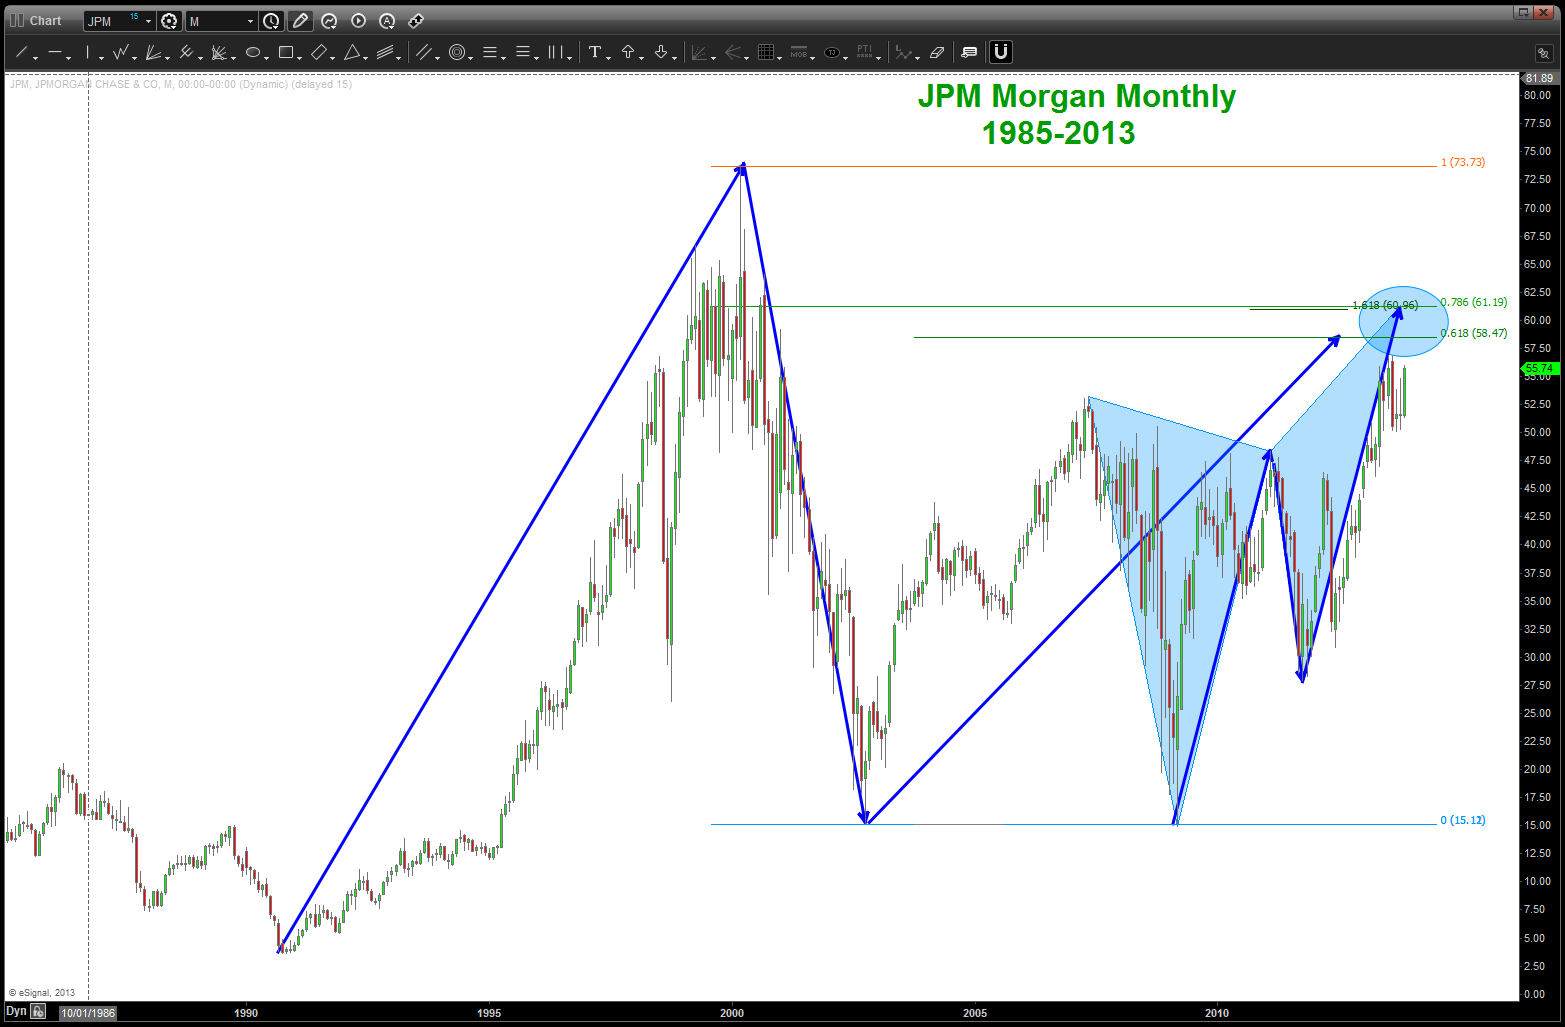
JPM sell pattern
