ratio’s are really powerful
been blogging a BUNCH about the importance of the XLP / SPY ratio. Why? Well, EVERY turn since 2000 has been nearly exact to the ratio turning up or turning down. here’s the chart:
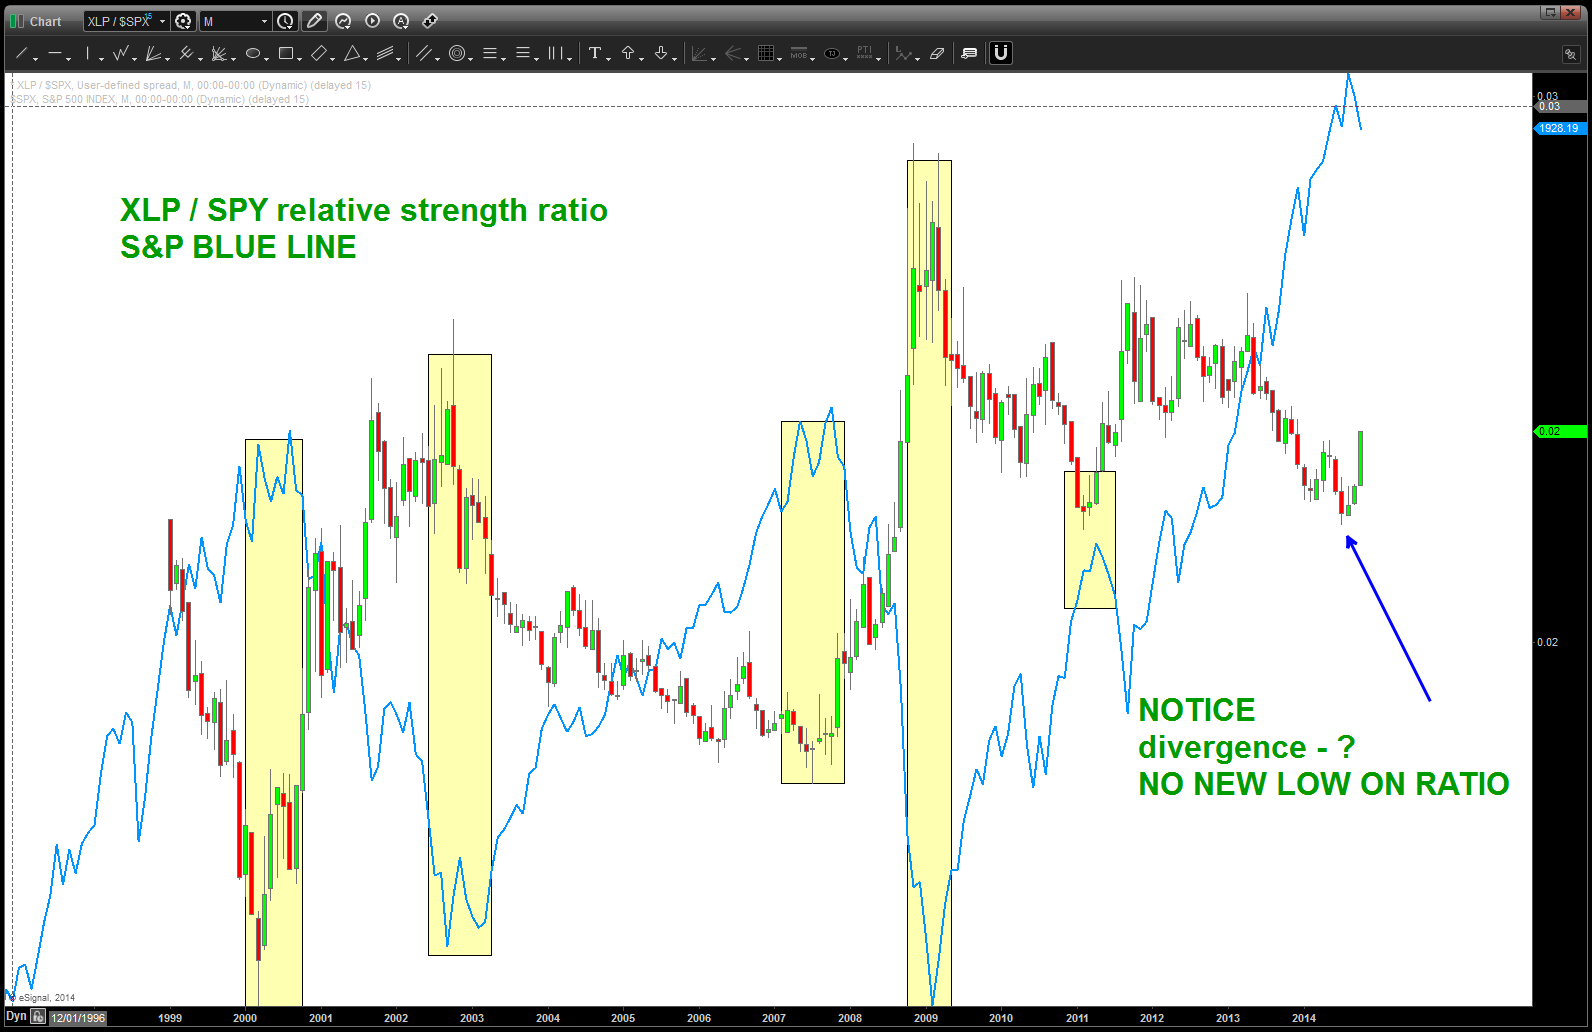
XLP / SPY ratio w/ S&P overlaid on top of it … NOTE divergence since 2012
folks, it doesn’t get much better than that … the CANDLES is the ratio of XLP / SPY. The BLUE LINE is the S&P 500. the chart time frame is monthly. EVERY PIVOT IN THE STOCK MARKET HAS BEEN A CORRESPONDING PIVOT EQUAL/OPPOSITE in the ratio. (move up in stocks equals move down in ratio and vice versa)
why is this important … well, check out the VIX and the ratio
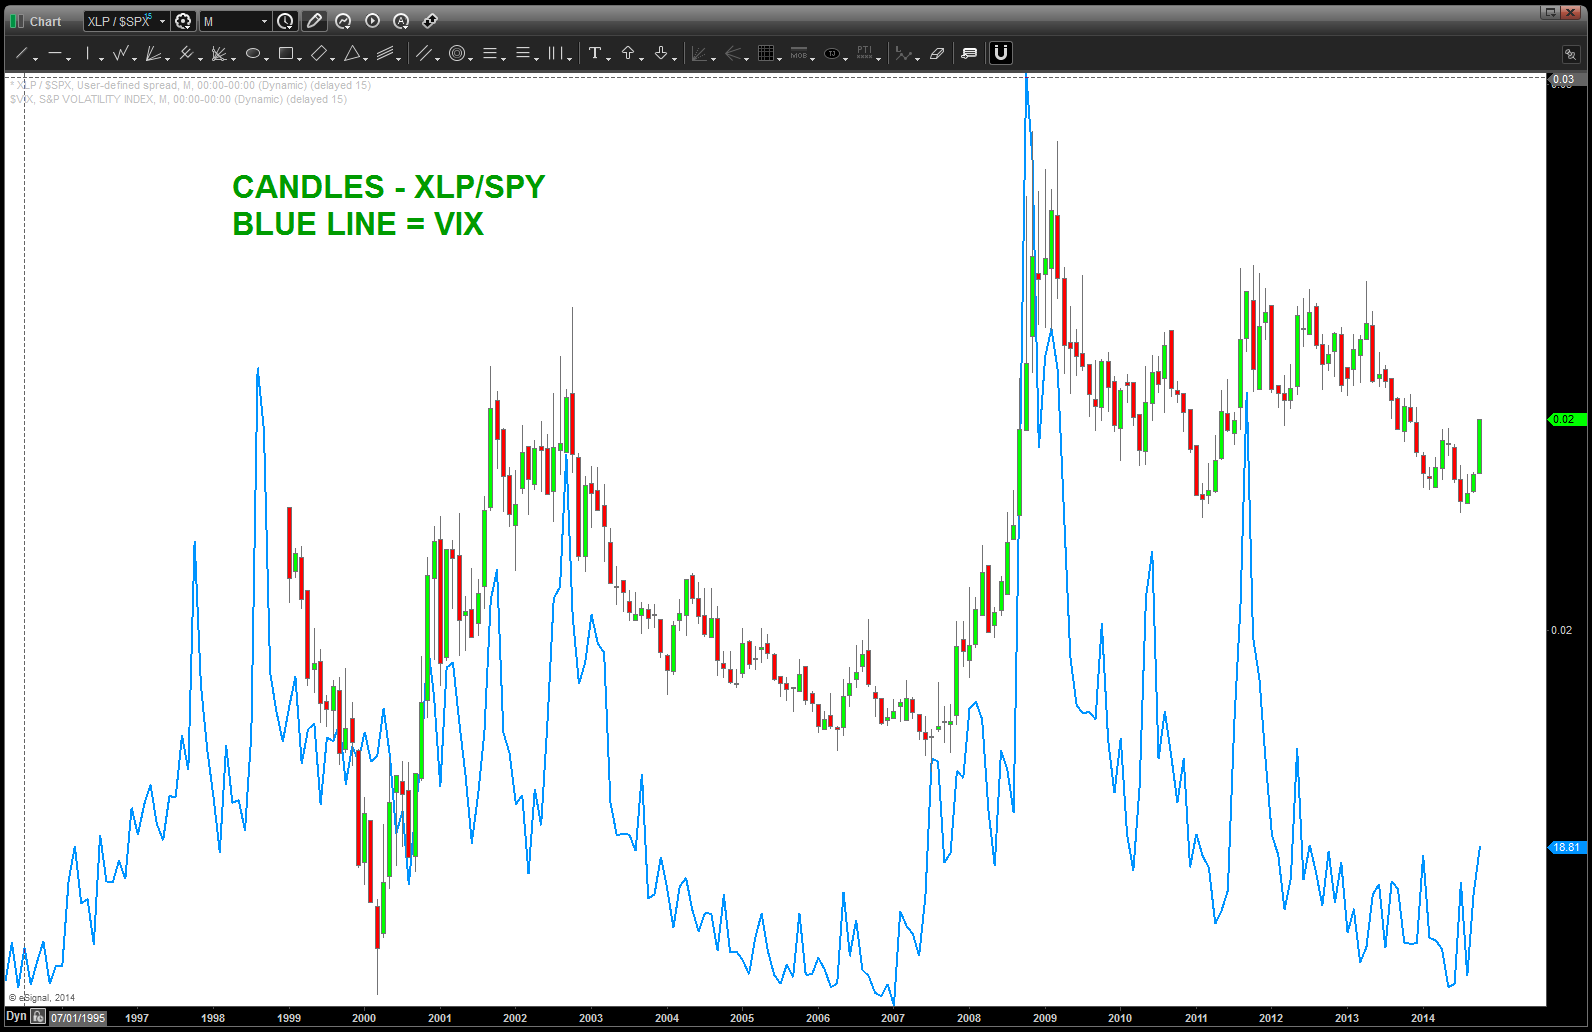
XLP / SK&P w/ VIX overlaid on top of it
here’s the deal — RATIO ANALYSIS is a unique look into the key hole of the INSTITUTIONAL rotation … and, my take is the ratio should have been sreamcing down while the S&P ripped to new highs. IT DID NOT … that has been something I have tried to resolve for almost two years …
now, why is this low so important in the ratio? well, take a peak at the RSI BULLISH support zone below:
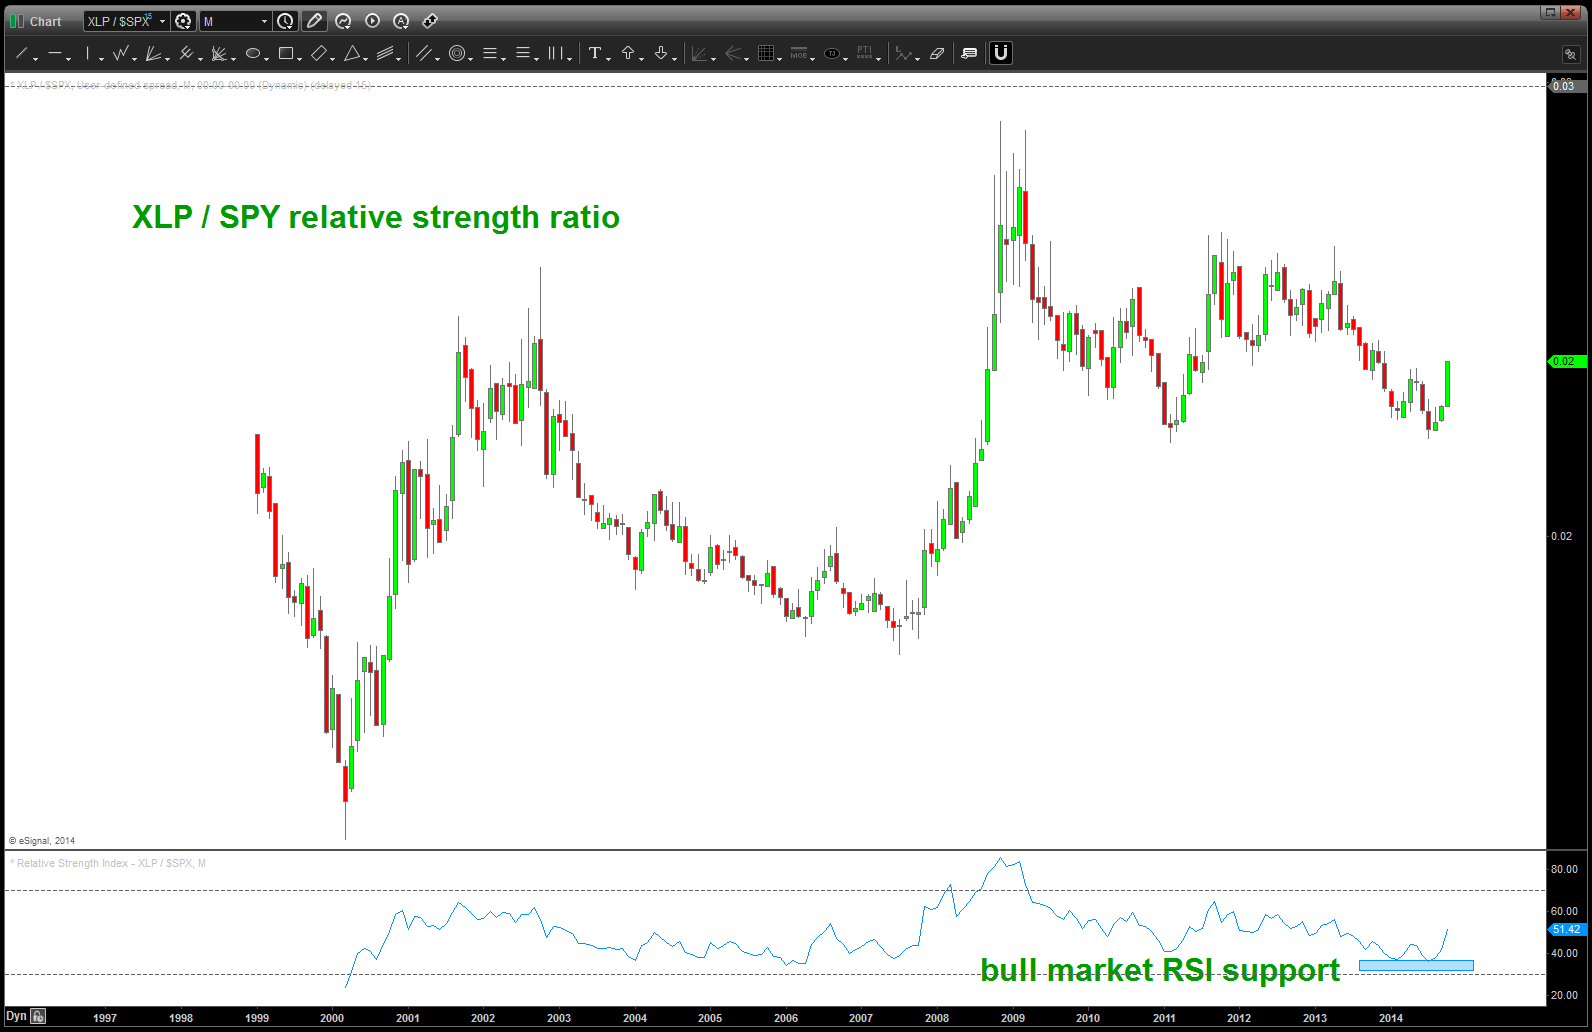
XLP/SPY ratio found support on bullish RSI zone
and, then you could have this as your count …

a POTENTIAL count for the XLP / S&P which shows higher
so, let’s review:
- the CHARTS show
- when the XLP/S&P 500 ratio pivots so does the market …
- we had a very noticeable divergence in the ratio and the S&P 500 as the S&P 500 screamed to new highs
- we have shown that the VIX pivots w/ the ratio
- we have shown the ratio is at bullish RSI support zone …
all the above tells me 1) volatility is here to stay, 2) expect pressure on the equities and 3) I could and might be completely wrong and that’s OK!
make it a great weekend and rock on, ok?
Bart
