Let the market tell you – EURO quick look
Posted on September 19, 2014 1 Comment
CLIFF NOTES:
- follow the black dotted line to see where the major level has been for the Euro.
- Then, follow the orange line.
- Additionally, note a nice little cycle coming in at 778 days. We are off by a week, but that’s OK and – quite frankly – the reason is a little too esoteric for this discussion. we are still in the time zone for a bounce.
- Note, from the beginning of the BULL market that started in 2000 we have used the “standard” 1×1, 1×2 and 2×1 angles but the KEY is we have oriented them to the plane of the move up that began the bull market. Follow the bouncing ball and we’ll see that the 2×1 caught the July 2012 move and now we are approaching the .618 retrace and the trend line.
- Bottom line: EURO bounce coming based on 1) structure, 2) “basic” and “advanced” time cycles, 3) trend line from the beginning of the bull market in 2000 4).618 retracement 5) the 1/8 increment of the signal reversal candle down completes a little lower and 6) we are developing bullish divergence.
- WAIT to 1) short the upcoming bounce or 2) let the market tell you a bottom is in place and then buy the first pullback that should have a 3 wave structure . (NOTE the only correction so far has been a flat. by the law of alternation, we will have a triangle or ziz-zag appear. so WAIT for the bottom…
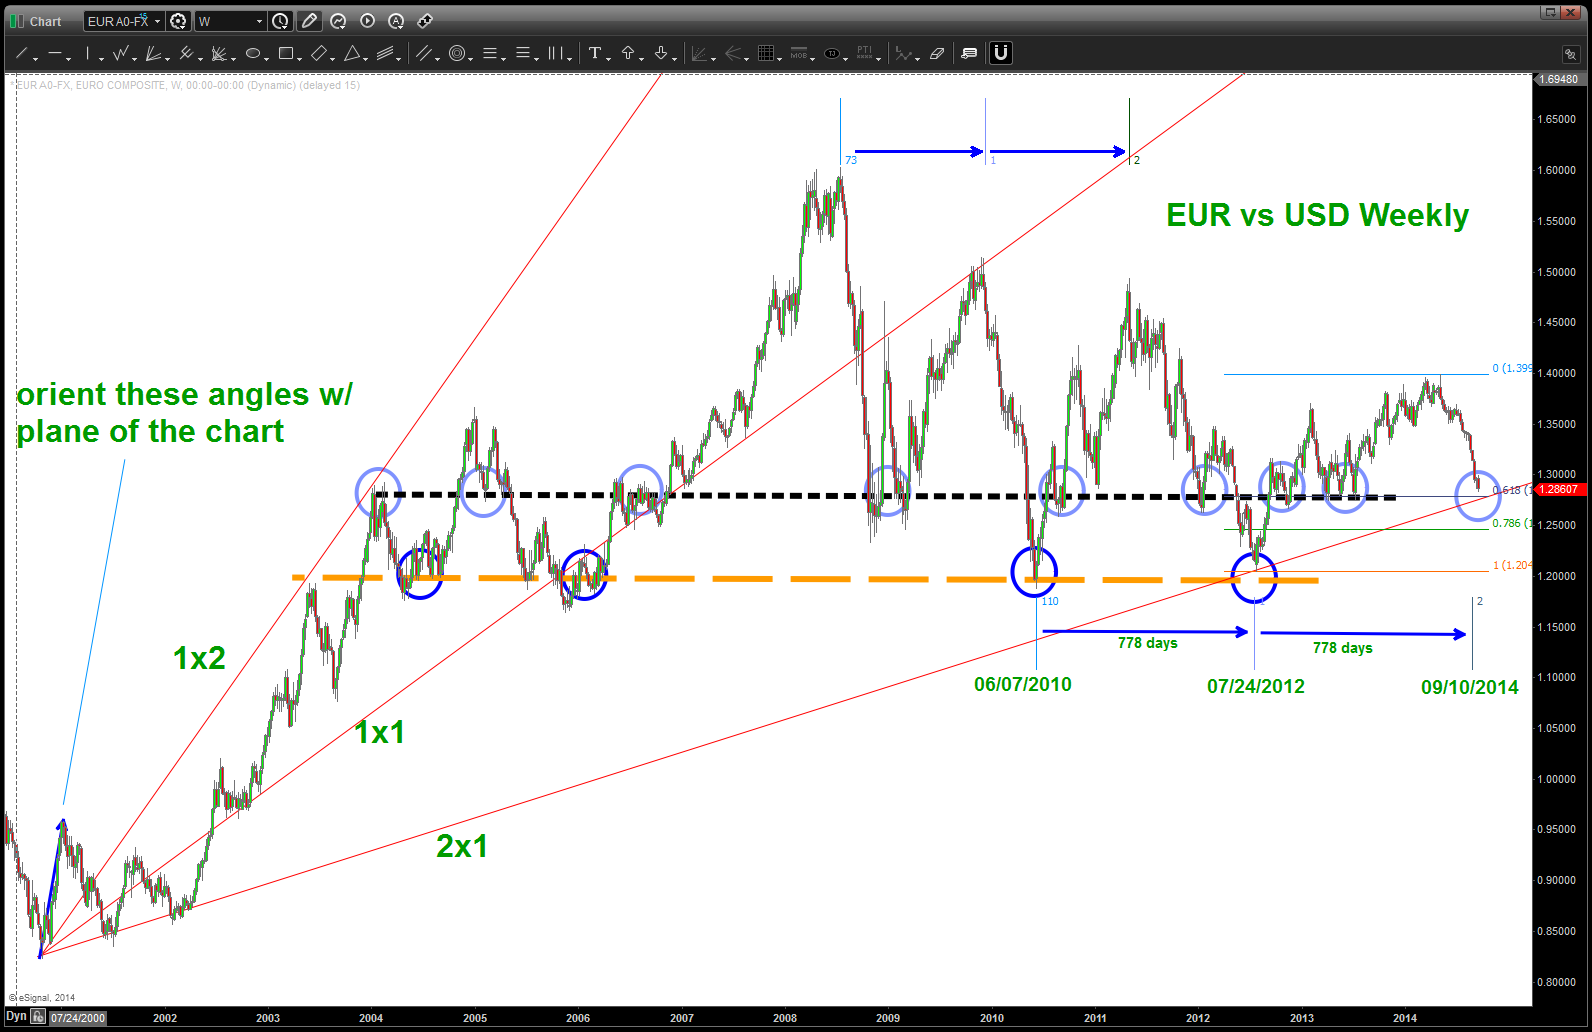
EURO vs USD weekly
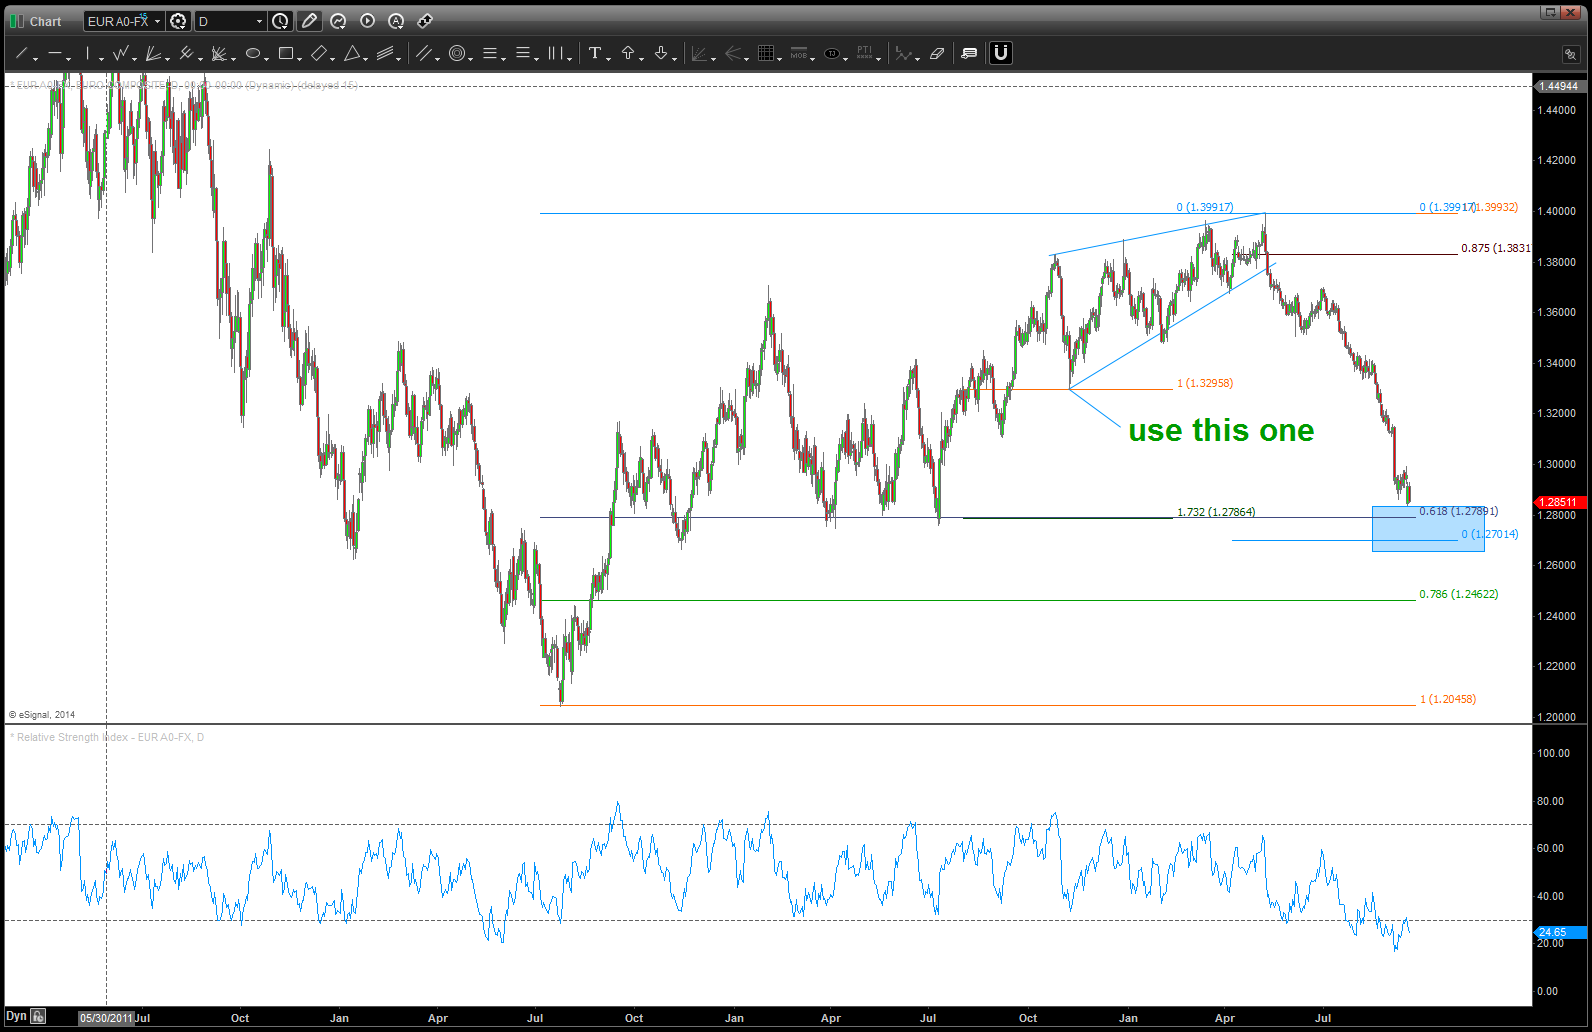
EURO vs USD Daily
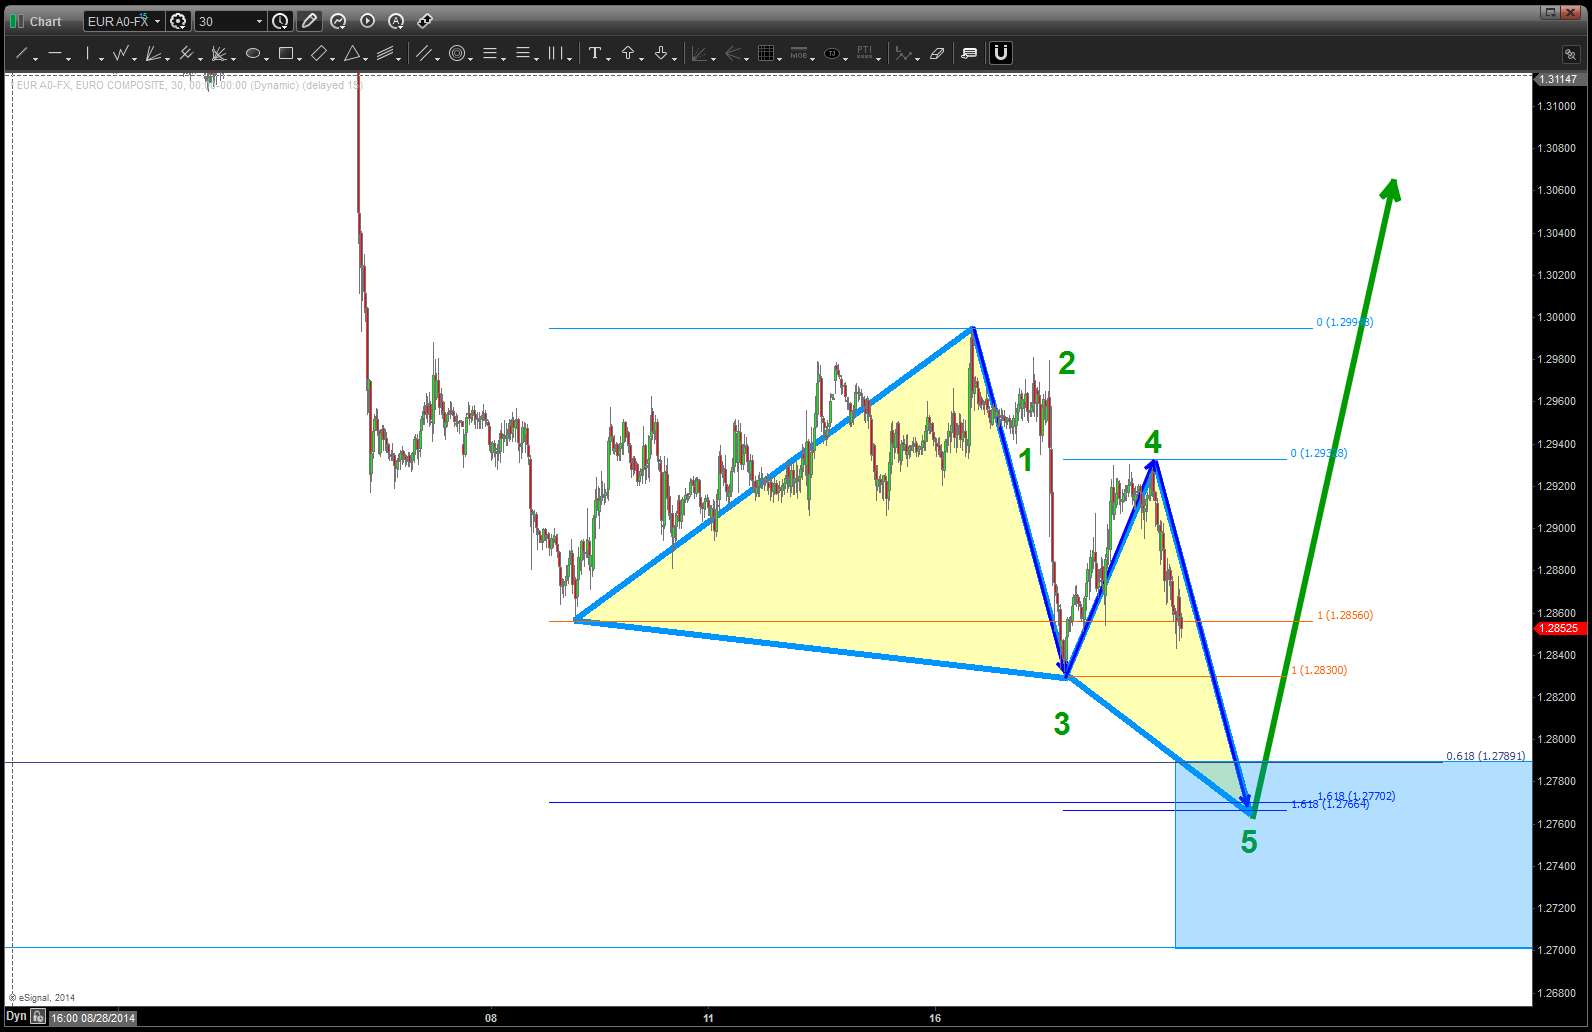
EURO vs USD 30 minute
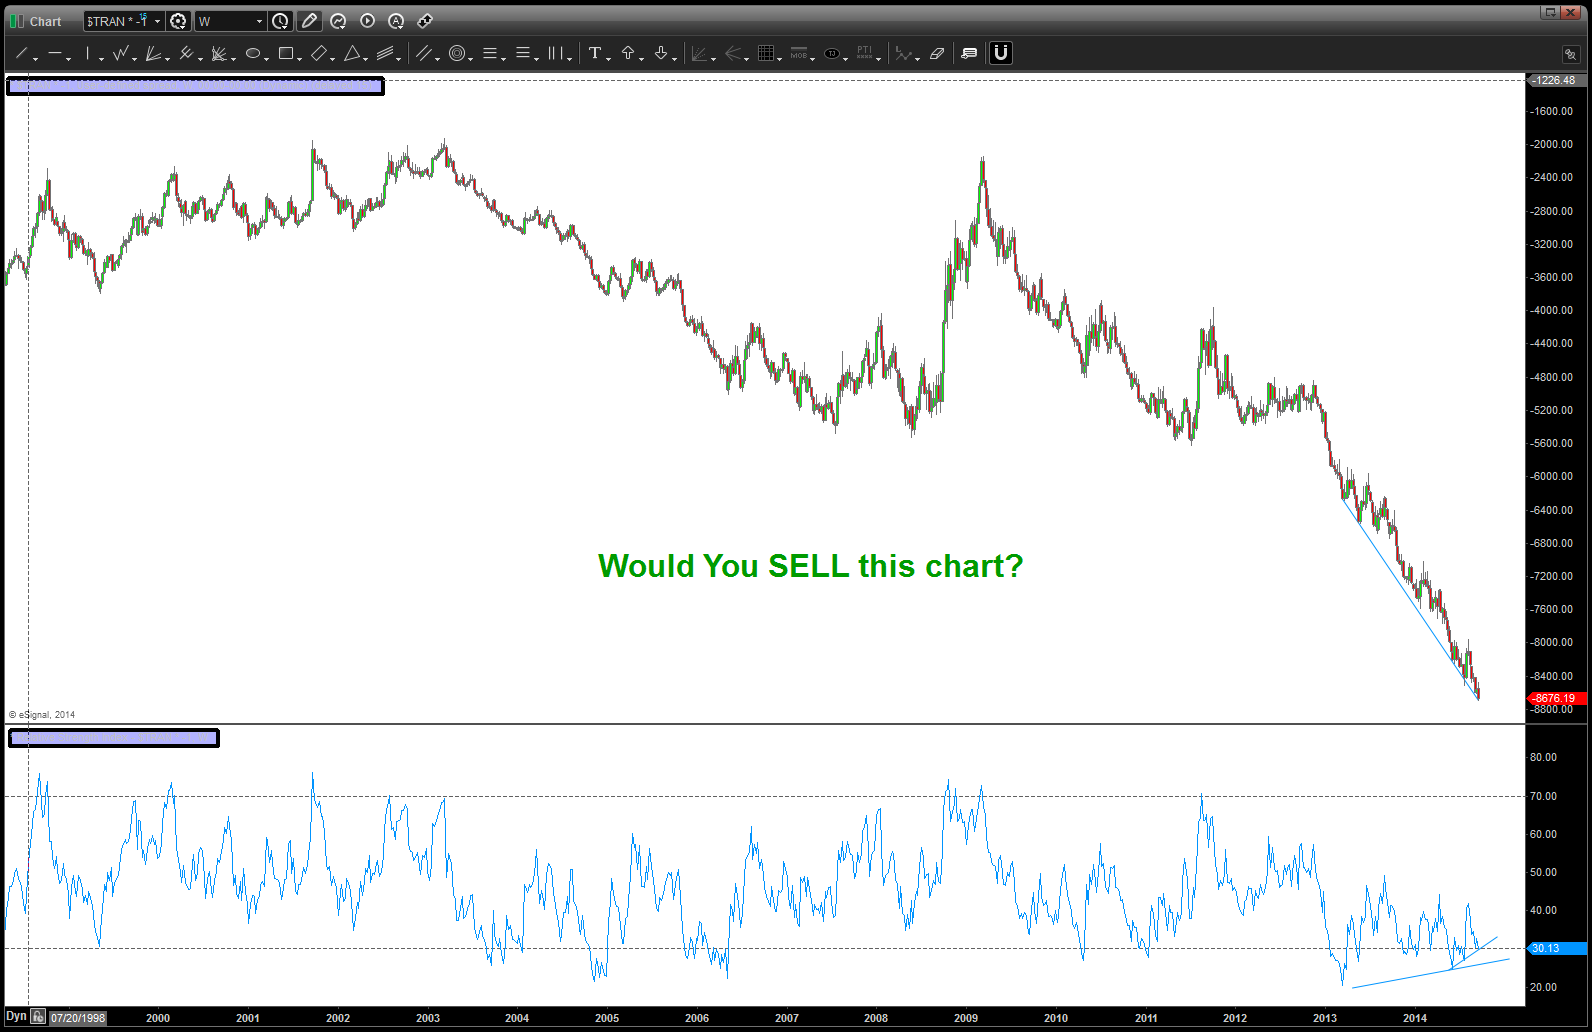
Would you SELL or BUY this chart?
Posted on September 19, 2014 2 Comments
Been active on Twitter and for my readers about some cycles hitting and square outs occurring and, well, blah blah blah. So as any technician is EXPECTED to do when the PATTERN has failed pretty dramatically, I hit “erase all” and went back to work. Asked myself … so, if the PATTERN SELL has failed then would you BUY it? In order to answer that question I inverted my chart and simply said – would I BUY this chart in it’s inverted state?
Would you BUY or SELL this chart?
the Great British Pound Rules of Engagement for 9/18/2014-9/19/2014
Posted on September 17, 2014 Leave a Comment
Joe Dinappoli once told our seminar … your either going to build the boat OR sail it. Choose one …what he was trying to say is your either going to TRADE or your going to put out research. No one side is better than the other …I’m of the mindset that in order to TRADE you need to put in place a game plan or strategy. But in the end, it’s about putting the gameplan at risk by deploying money….
Tomorrow might be a historical day and, then again, it might be a whole lot of nothing. If the Scott’s do vote to leave the UK well, it’s going to move EVERYTHING. As a spot FX trader I want to be ready for that .. so tonight I INTENTIONALLY erased EVERYTHING off my Pound vs USD chart and decided to work TOP – DOWN into a POTENTIAL gameplan to manage risk and TRADE WHAT YOU SEE.
Back in the day flying we came up w/ concepts of criteria for mission accomplishment: commit criteria, drop criteria, valid shot, abort criteria, skate or bonzai criteria , etc., etc. And, these were based on the Rules of Engagement (ROE) for any particular theater. So guess what, we are going to devise our ROE based on risk management:
By the end of this post, a game plan will have unfolded … let’s begin !!!
- ROE: Counting will begin approximately 2200 British Summer Time or 5PM est 09/17/2014. Due to monstrous potential for volatility w/in the FX market, a POSITION will NOT be put on until after 5:00 PM. Any position could be immediately wiped out if a monster reversal occurs. Then again, if your right the position could move in your direction amazingly well. But guess what … that’s gambling not trading. WAIT until the count is complete.
- ROE: expecting 1.5700-1.5800 to be major support and given the very oversold condition of the Pound on a daily basis, will be very cautious to “just short” the Pound. If we reference the monthly chart, we will see that current move down is very small in the big picture. there will be time
- ROE: if the market rallies then will look for 1.6390 but higher targets are more favorable to relieve the oversold condition. they are 1.6460 and 1.6540-1.6560.
- ROE: note, some of these levels are pretty far away and if you are a scalper then just book mark these levels. There is a distinct possibility that the Pound could move 200-300 pips in a matter of minutes. Unless you are a HFT w/ exceptional light speed MOST IF NOT ALL BROKERS will not get you the fill you want … however, after the initial burst, these levels become very important and therefore a gameplan can be worked.
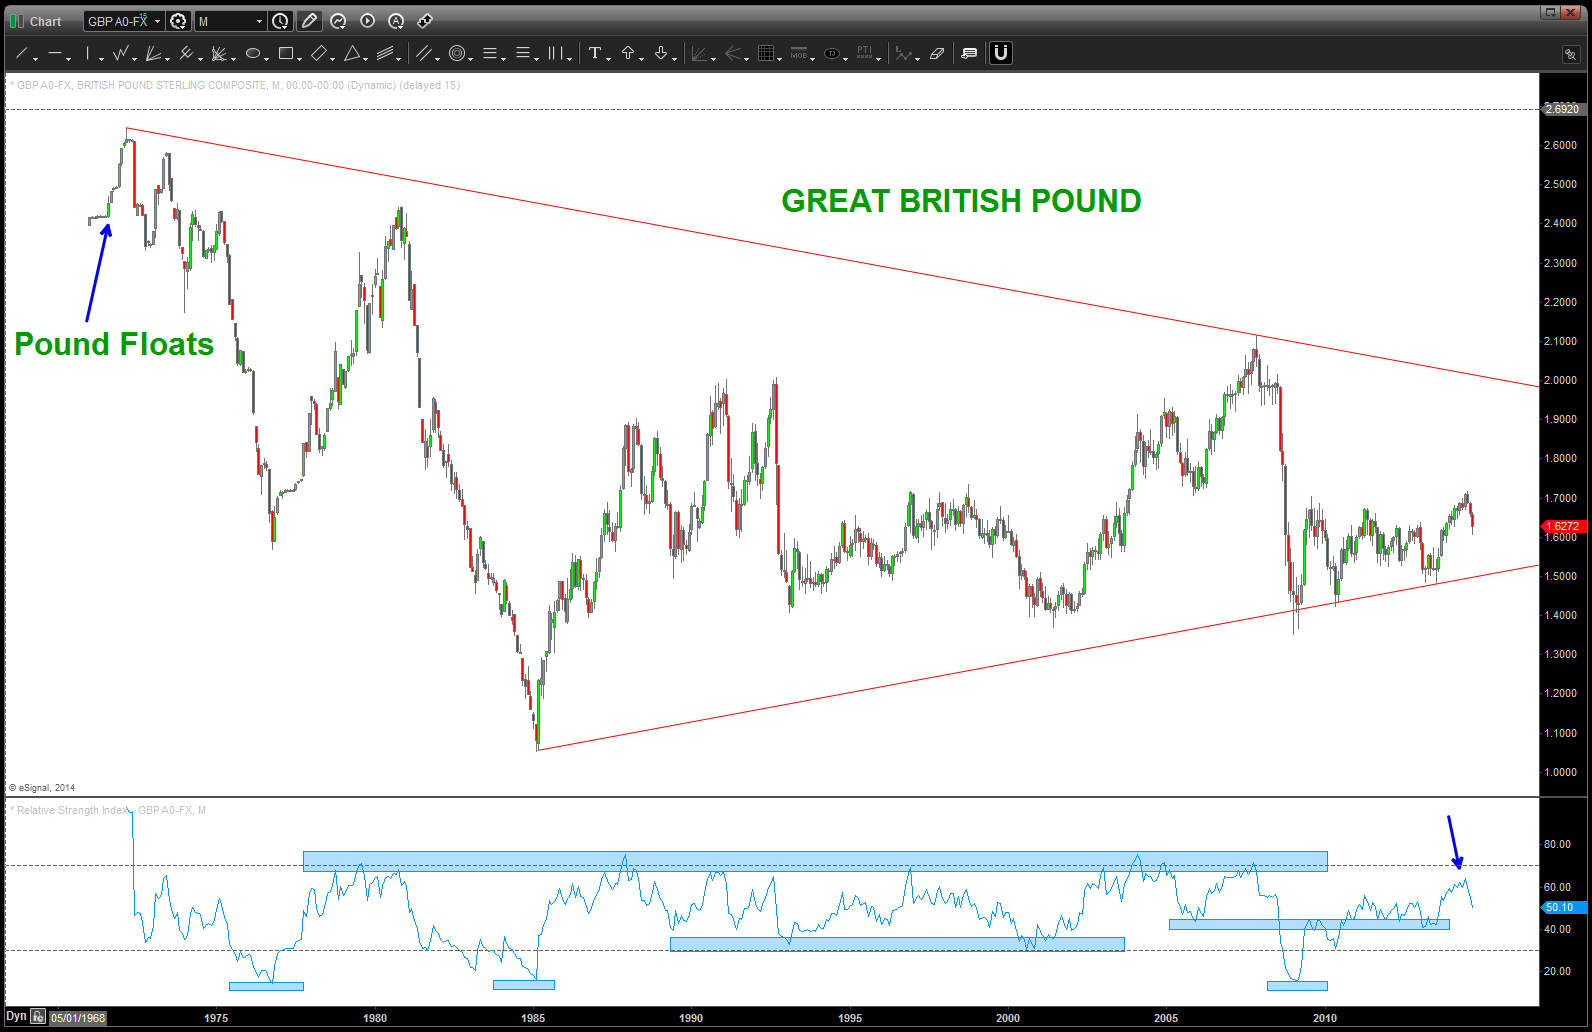
Great British Pound Monthly
Using RSI to see where the support and resistance levels have been … the big thing is notice that the 2007 – 2014 time frame we are seeing a grid shift in that the we busted thru support and now, have failed at the lowest level in the history of the chart. My mindset is bearish and therefore believe on a weekly/daily timeframe (key) any rally should be faded. Other than that, no specific and/or tactical ROE aspects to consider. Analysis only …
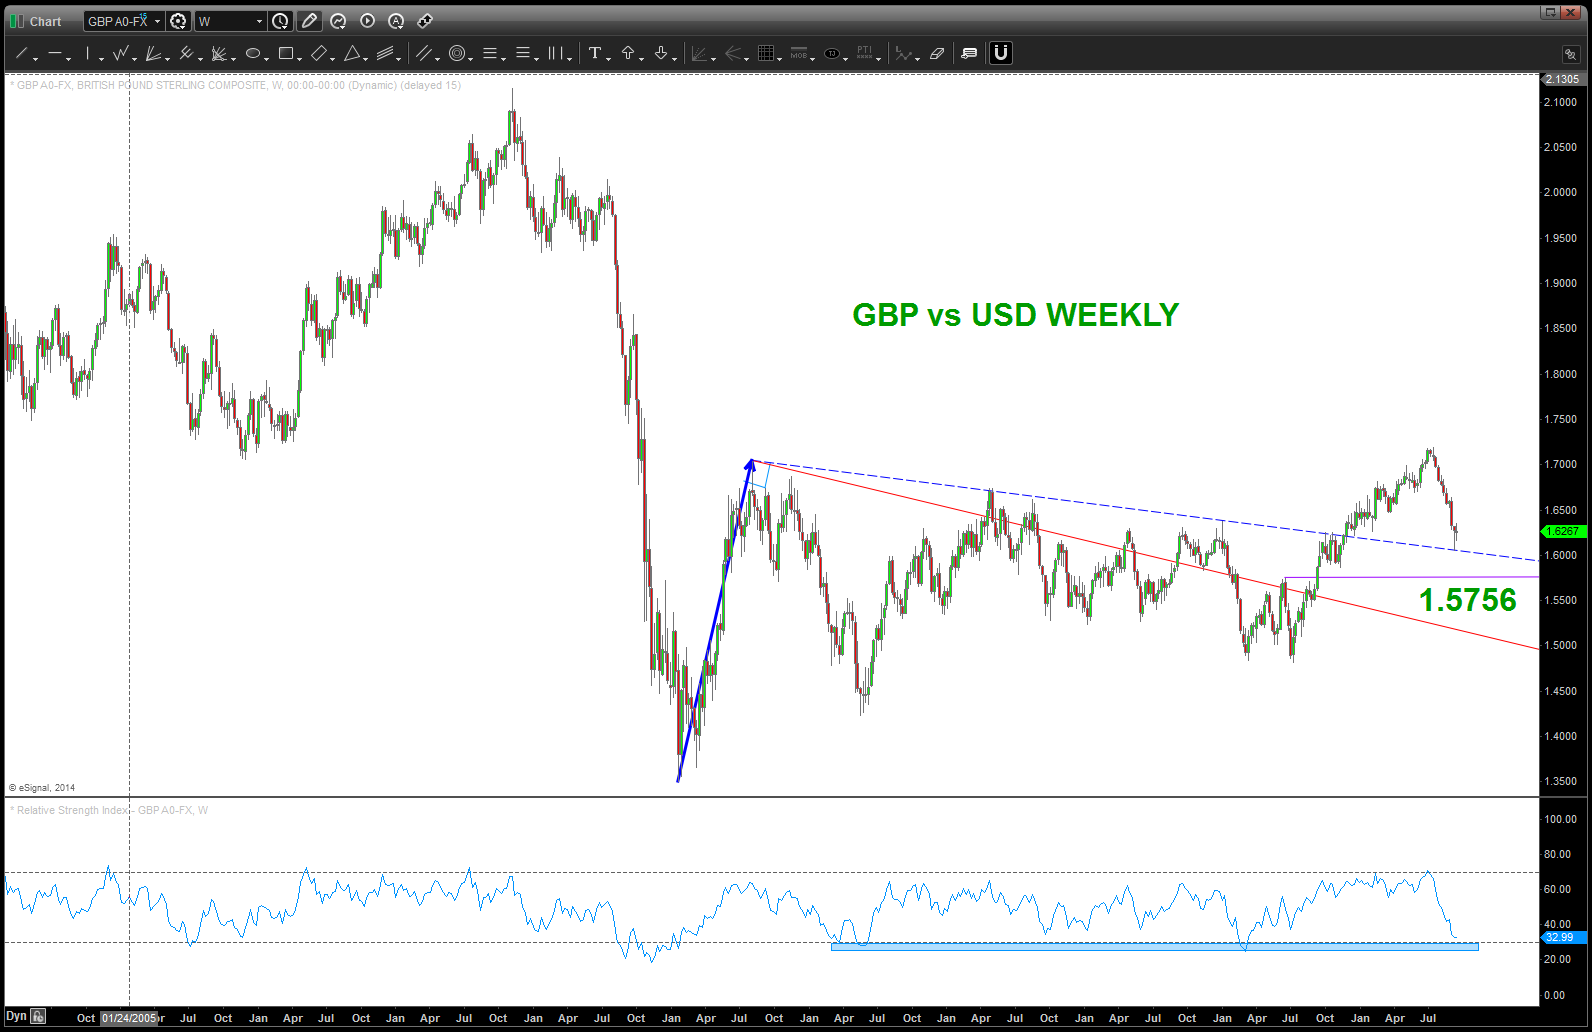
GBP vs USD WEEKLY
Again, using the weekly RSI, note that we are oversold but “no divergence” is present. Can still go lower, but notice the dotted blue line and you’ll see the polarity principle at work. if we break that dotted blue line price “should” vacuum to the 1.5756 level. Also, the red 90 degree angle is something for us to consider. but 1.5756 is in the way, right now.
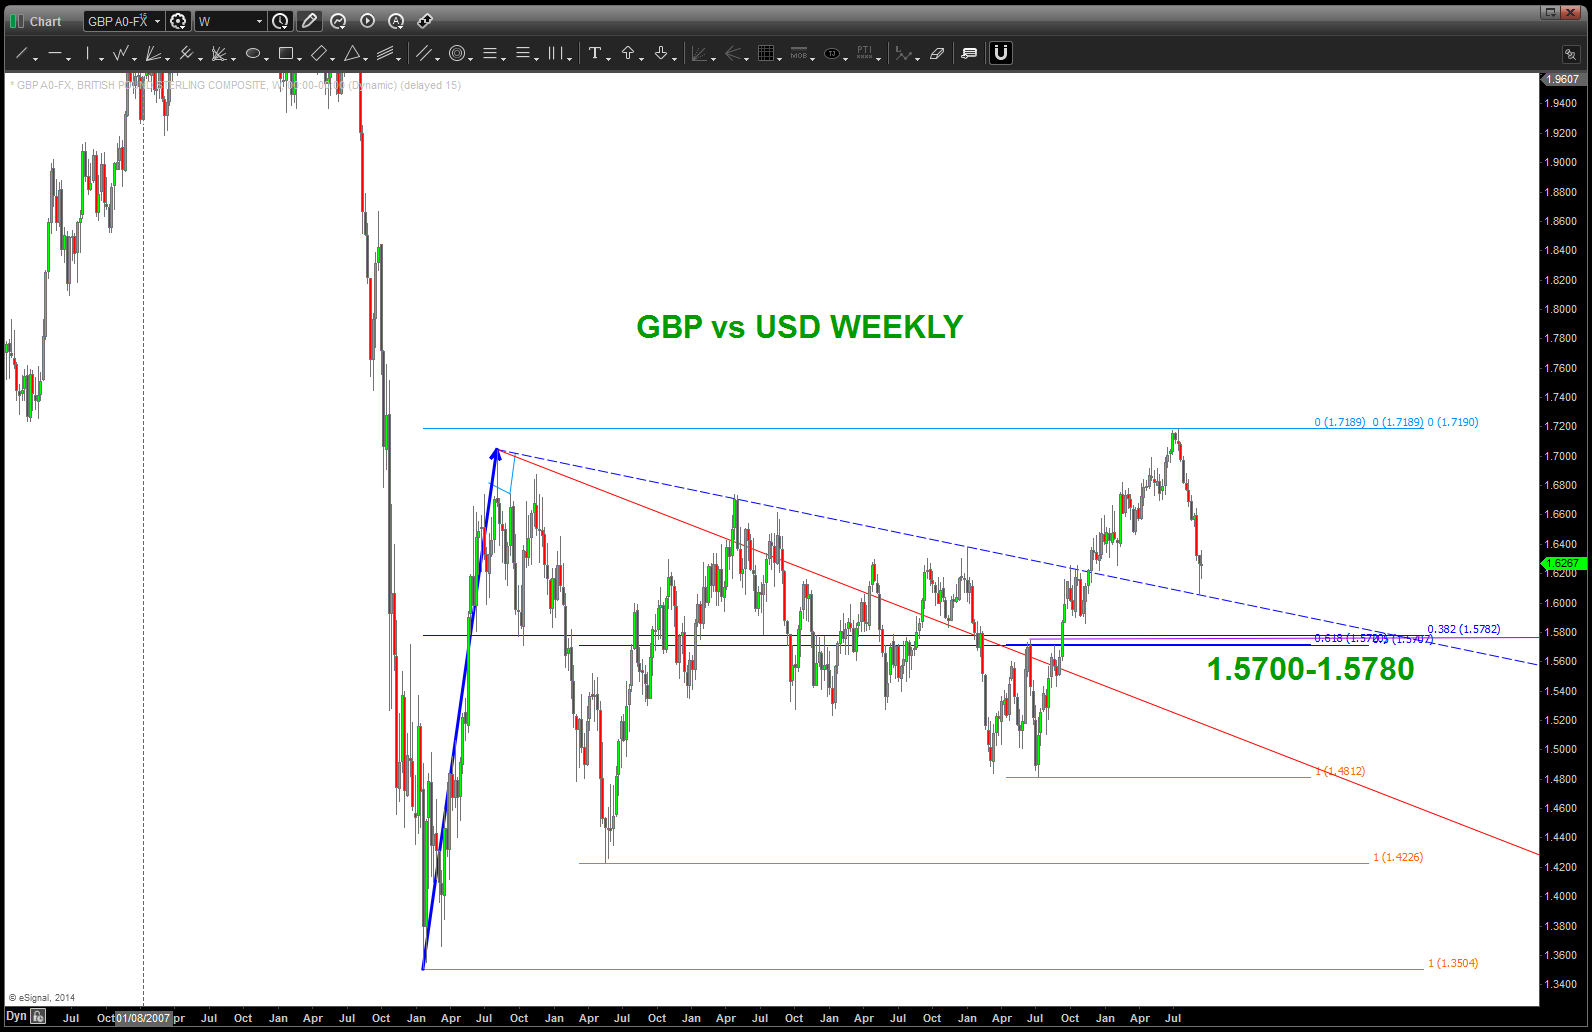
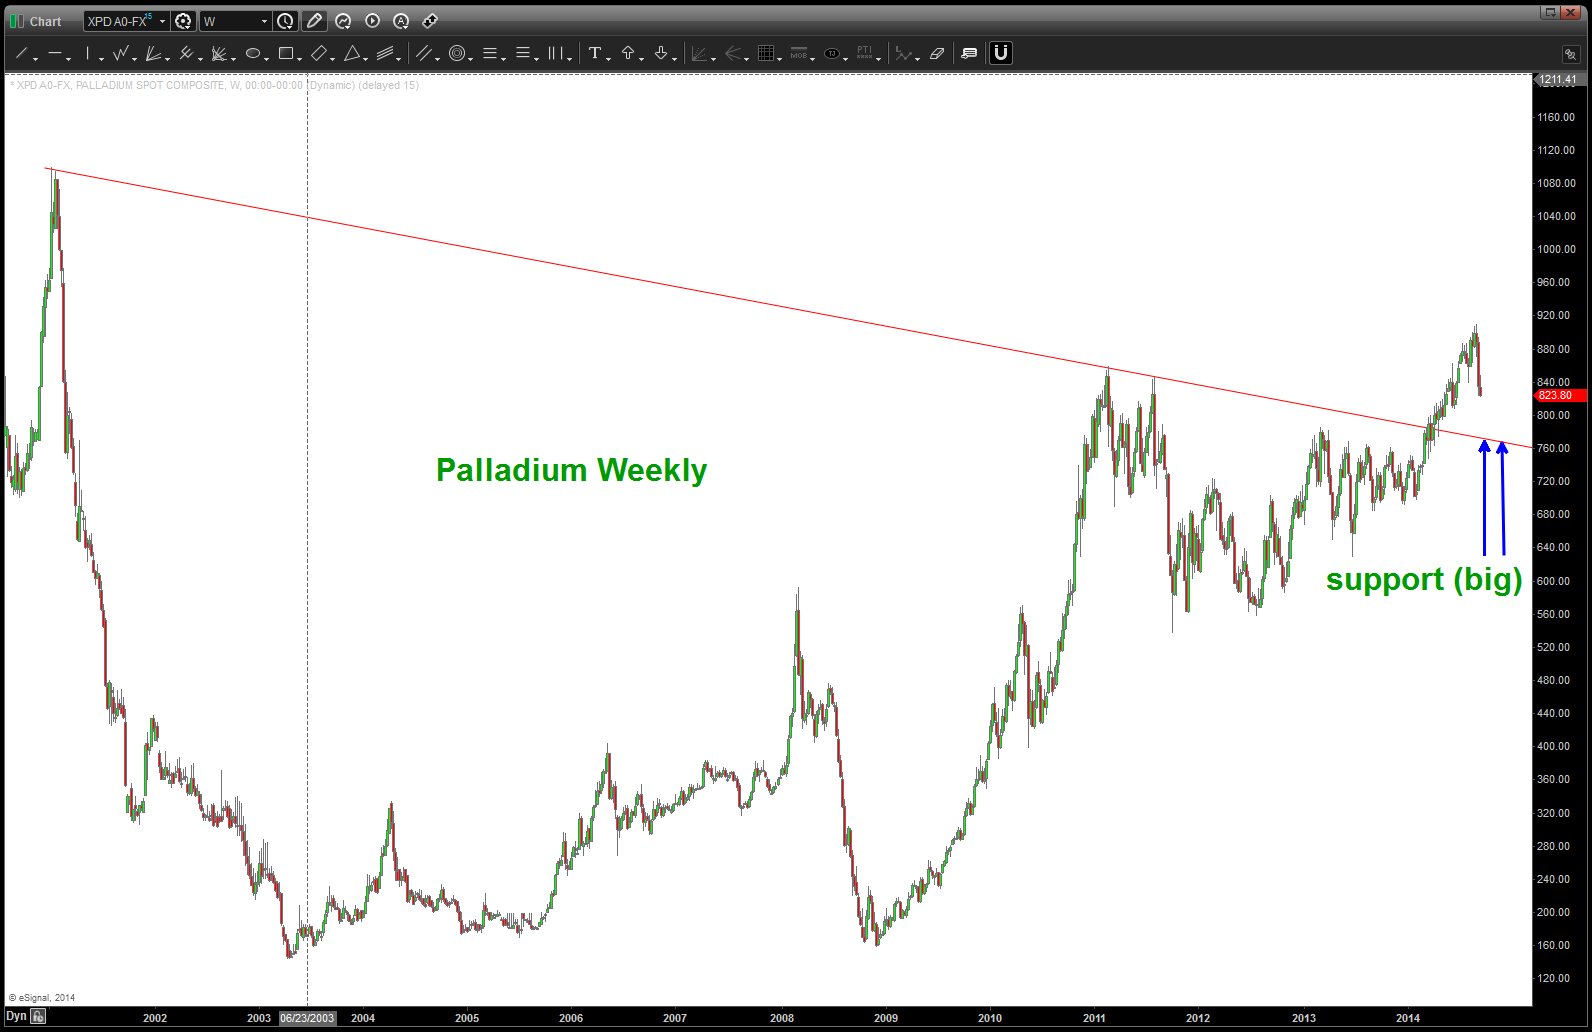
Great British Pound Weekly
note on the above – we have a .382, .5, .618 retracement all coming in right in/around/on top of our 1.5775. THIS SHOULD BE SUPPORT.
ROE: as we approach this level, if during a sell-off DO NOT SHORT in/around this level as it could be major support ….
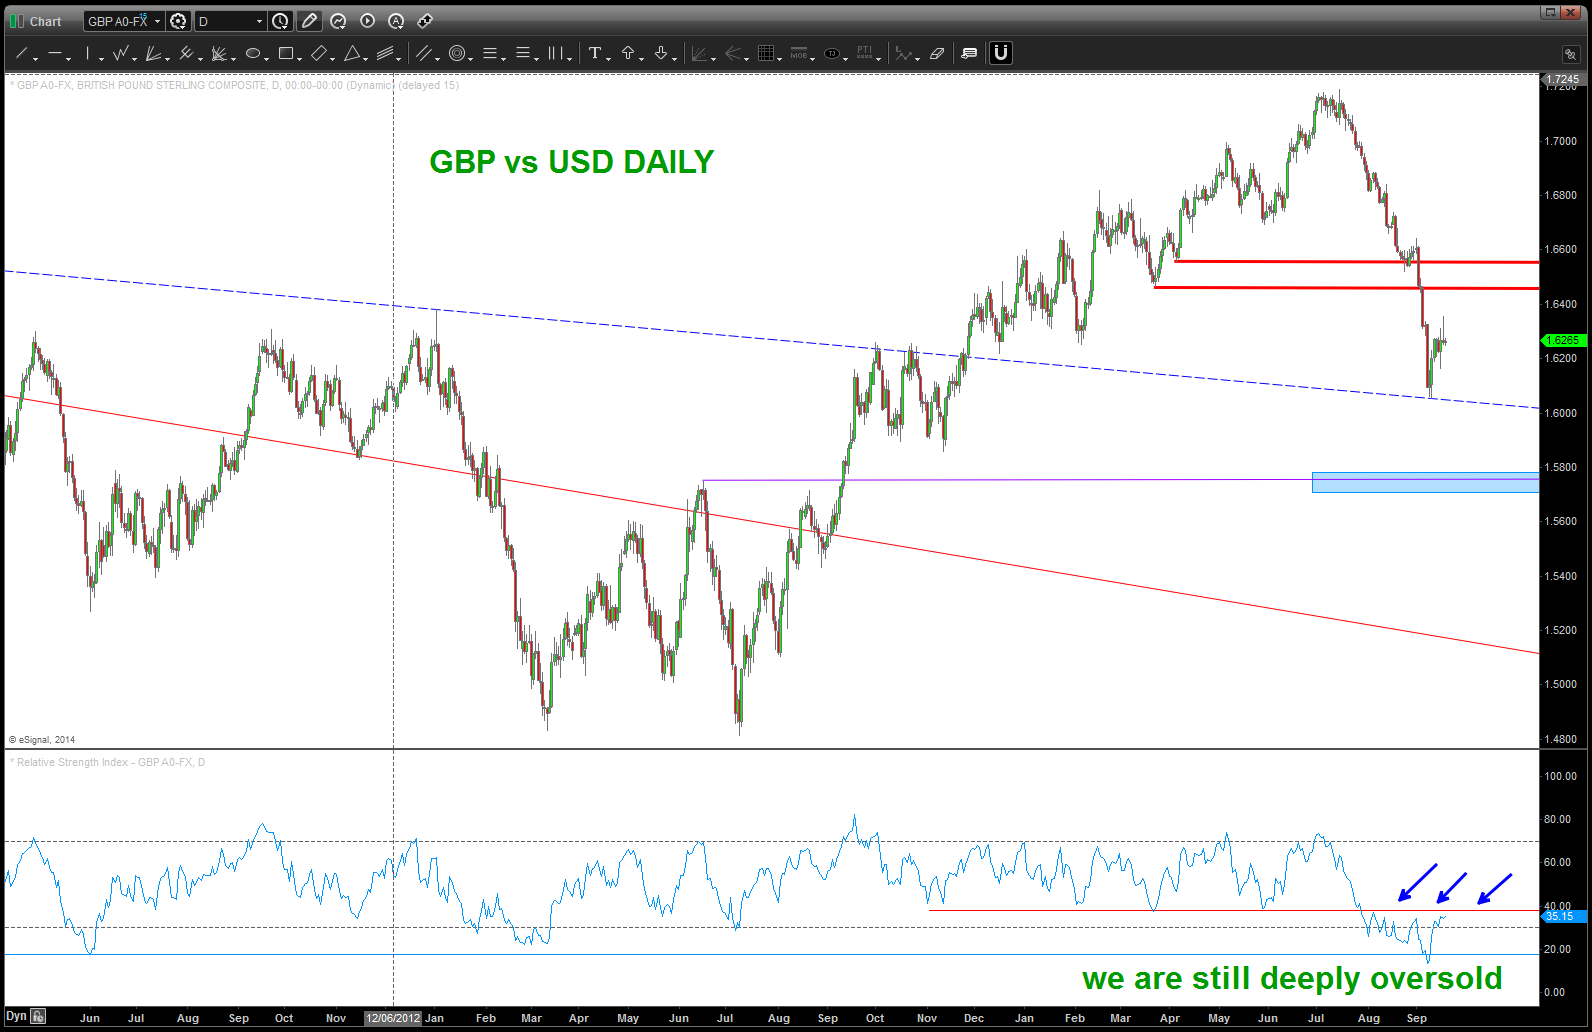
GBP vs USD DAILY
Note, if we can rally look for those RED LINES to short against. Also, note we are still deeply oversold on a daily basis.
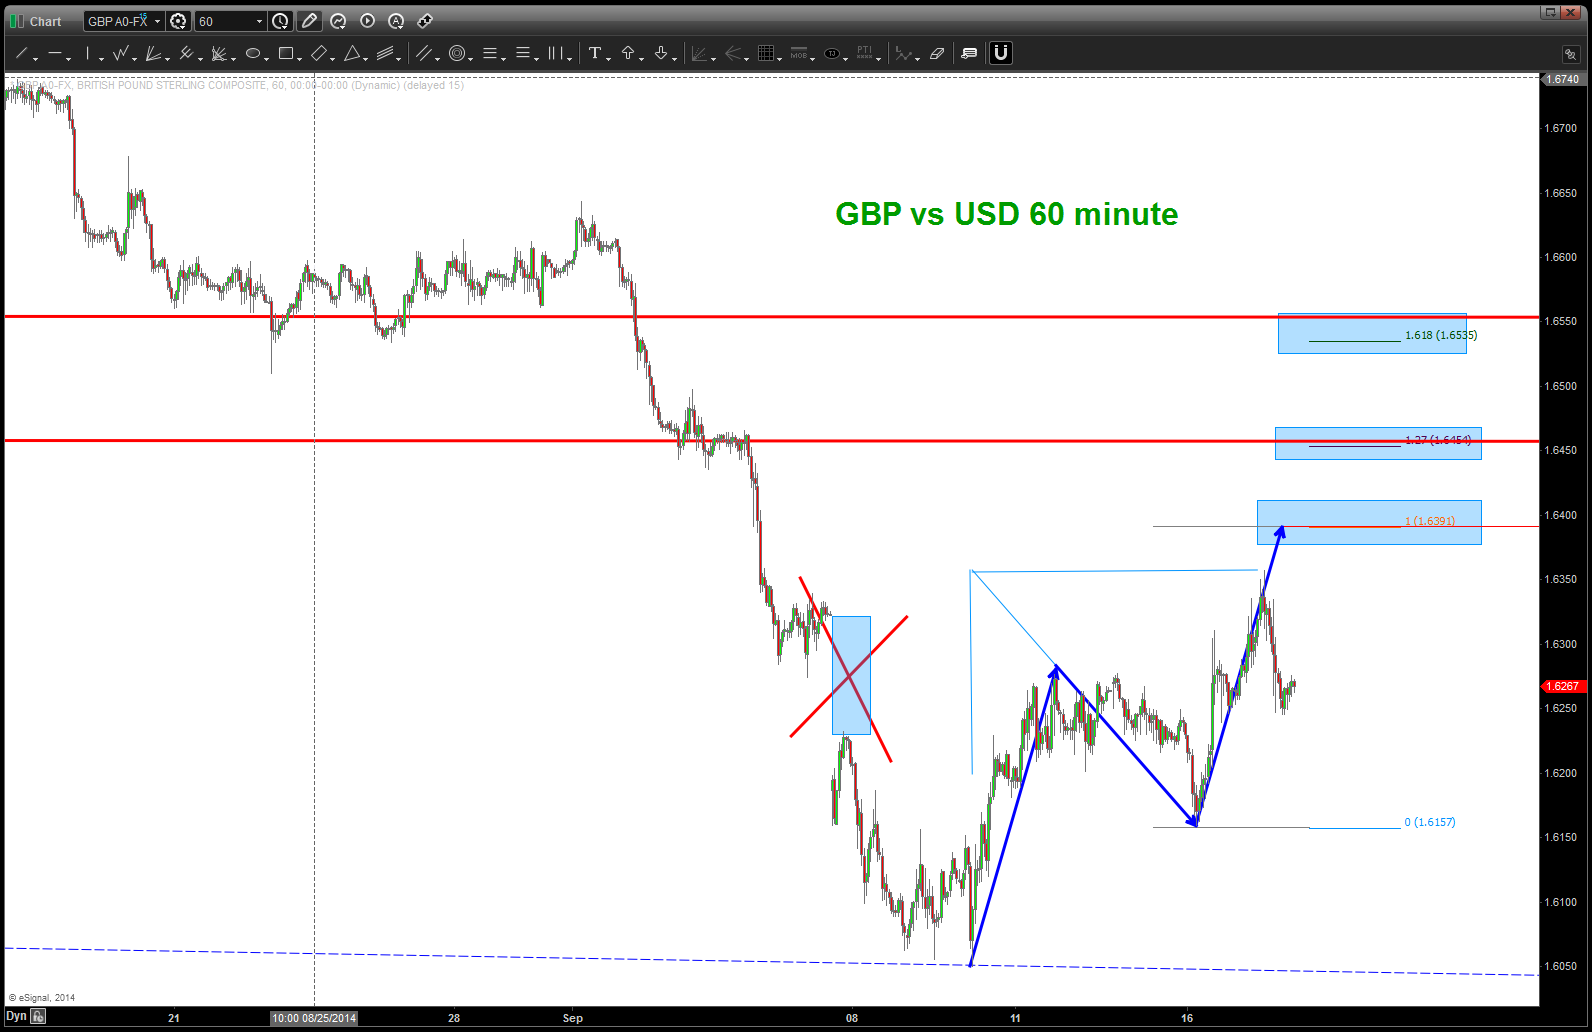
GBP vs USD 60 minute
note the geometry from today’s move … hit the high and the red X is showing the gap from Sunday (very very rare in the spot FX world) has been closed. Note upper targets as shown by the light blue.
Palladium liquidation and NASDAQ
Posted on September 17, 2014 Leave a Comment
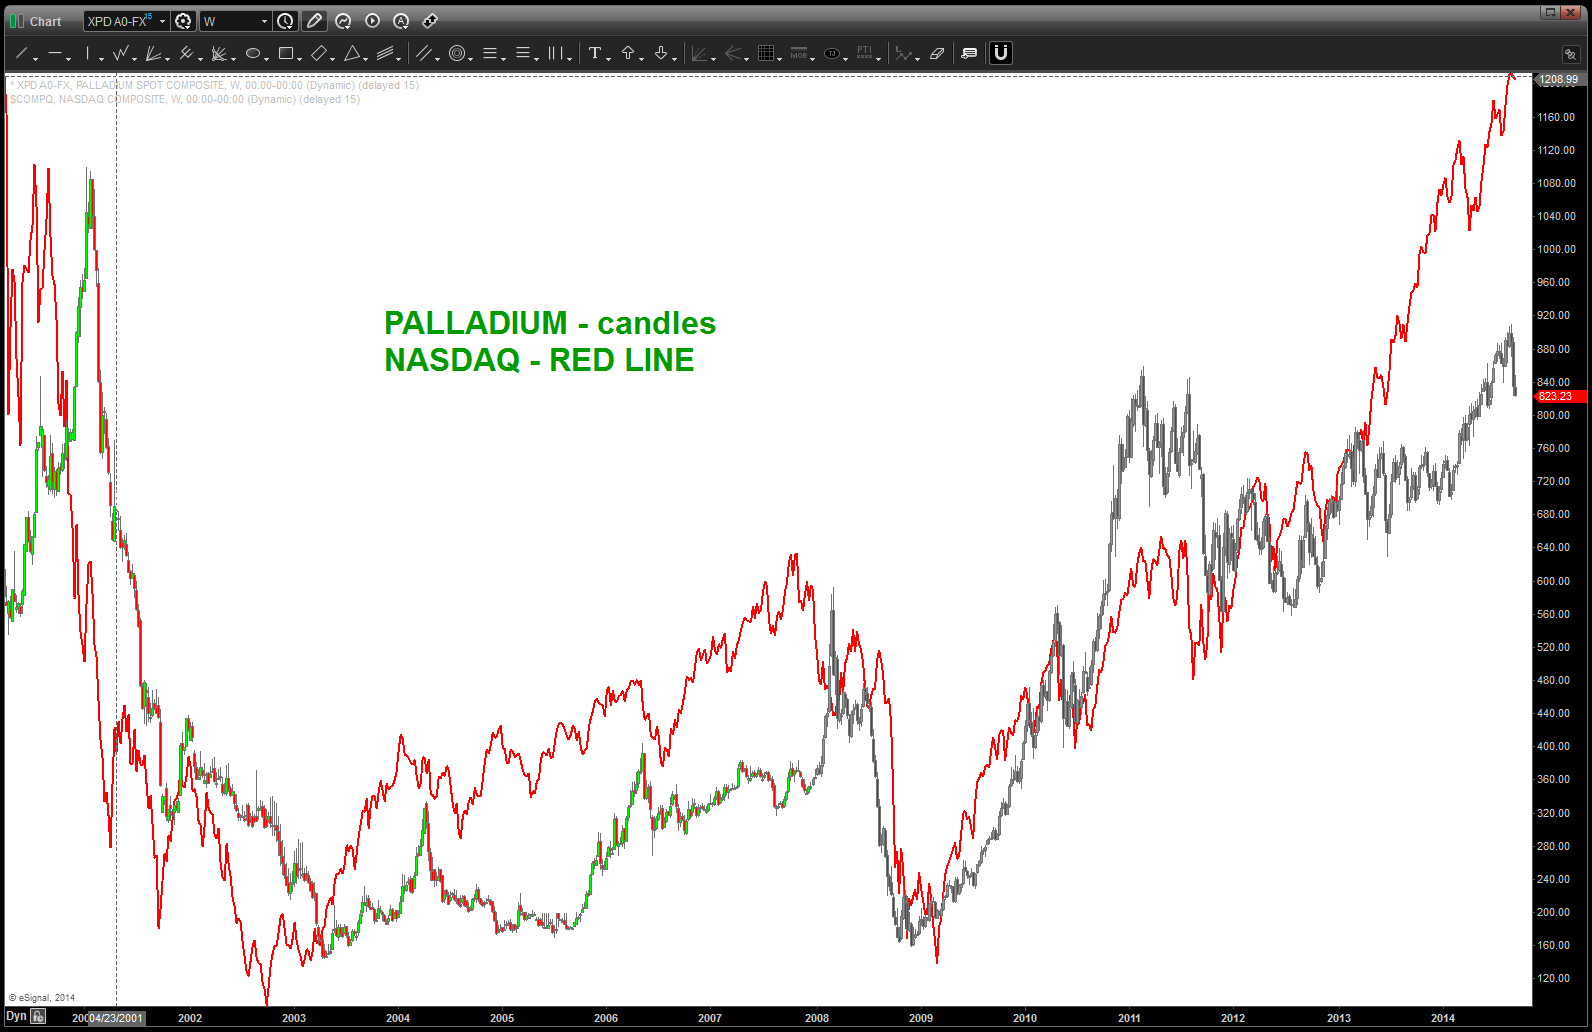
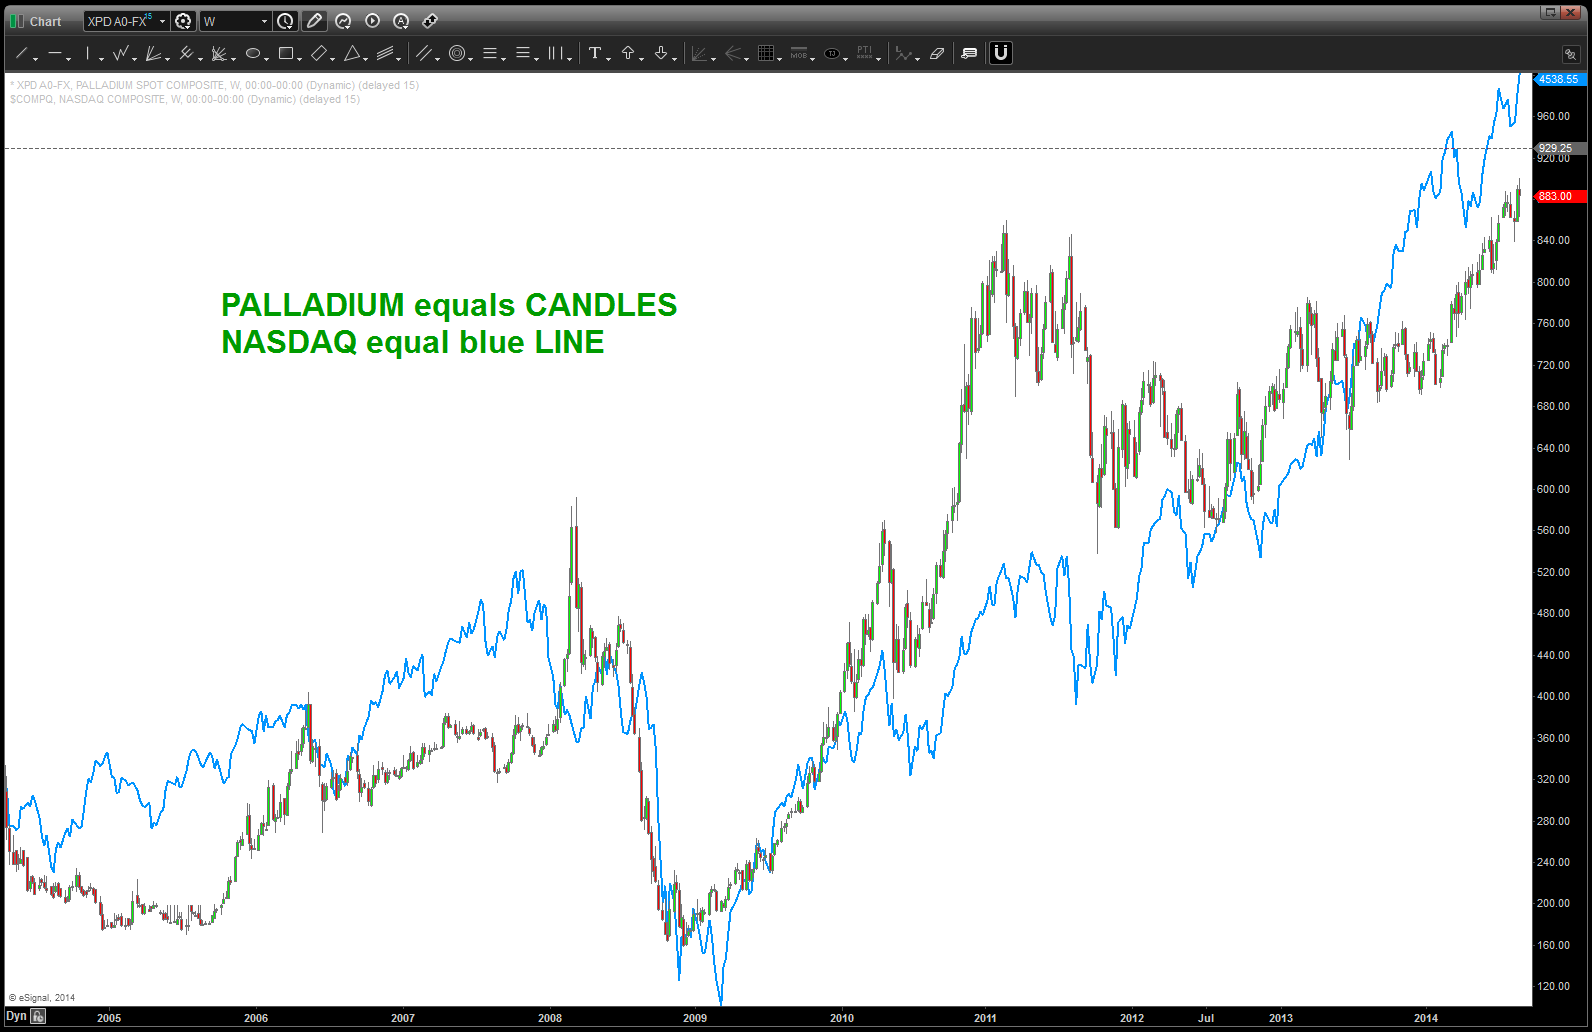
9/17/2014: this correlation is pretty strong and Palladium hit our target exactly and has been being liquidated heavily in the past month. Keep an eye on either 1) Palladium finding support to build momentum for a move higher in NASDAQ OR 2) drag the NASDAQ down w/ it. Let’s face it … ain’t NO WAY anything was going to get in the way of the Allibaba IPO. It’s going to be a crazy market as we see what happens w/ Scotland, we have a triple witch expiration, a reweighing and the largest IPO in history .. not to mention it’s been a FED week.
8/24/2014: : Palladium converging into to major resistance. This is important because it’s a nice little commodity to watch w/ regard to the NASDAQ and AAPL. In order to build the pattern we are going to to go step by step this morning into “why” Friday’s high was important from a PATTERN perspective.
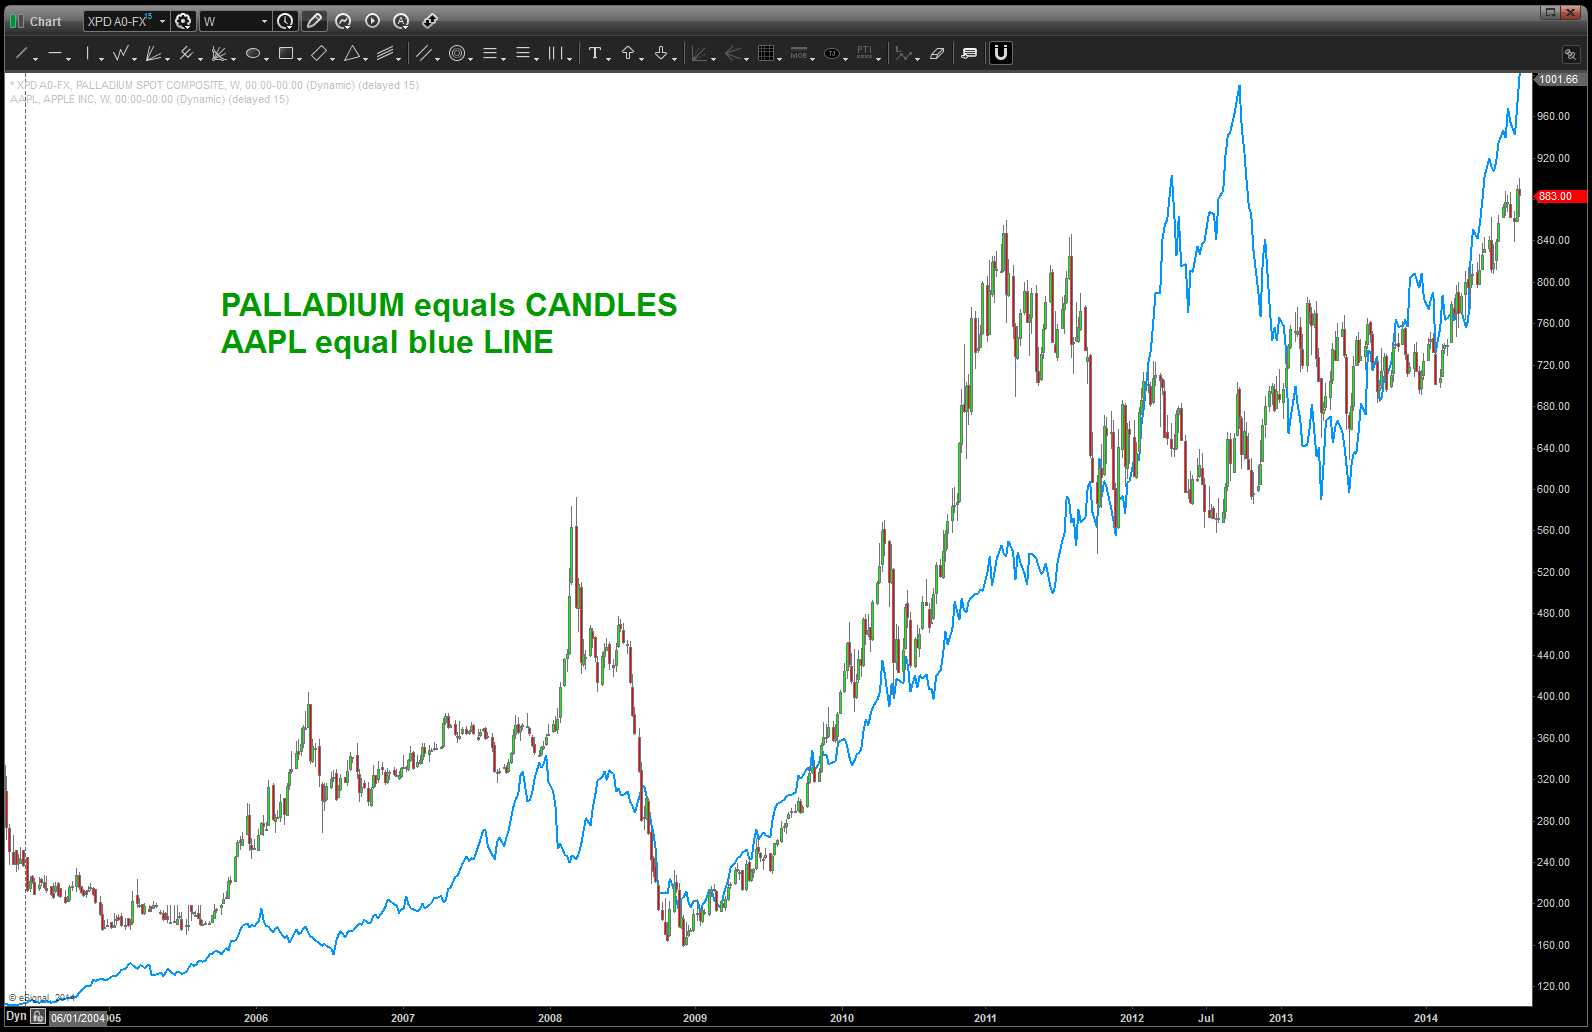
1. First, here’s WEEKLY charts of 1) NASDAQ and Palladium and 2) AAPL and Palladium.
- notice that when palladium broke out of the consolidating triangle, AAPL took off.
- of late there has been a lead/lag relationship at times BUT the overall directional pivot is clear. As Palladium goes, so does NASDAQ and AAPL.
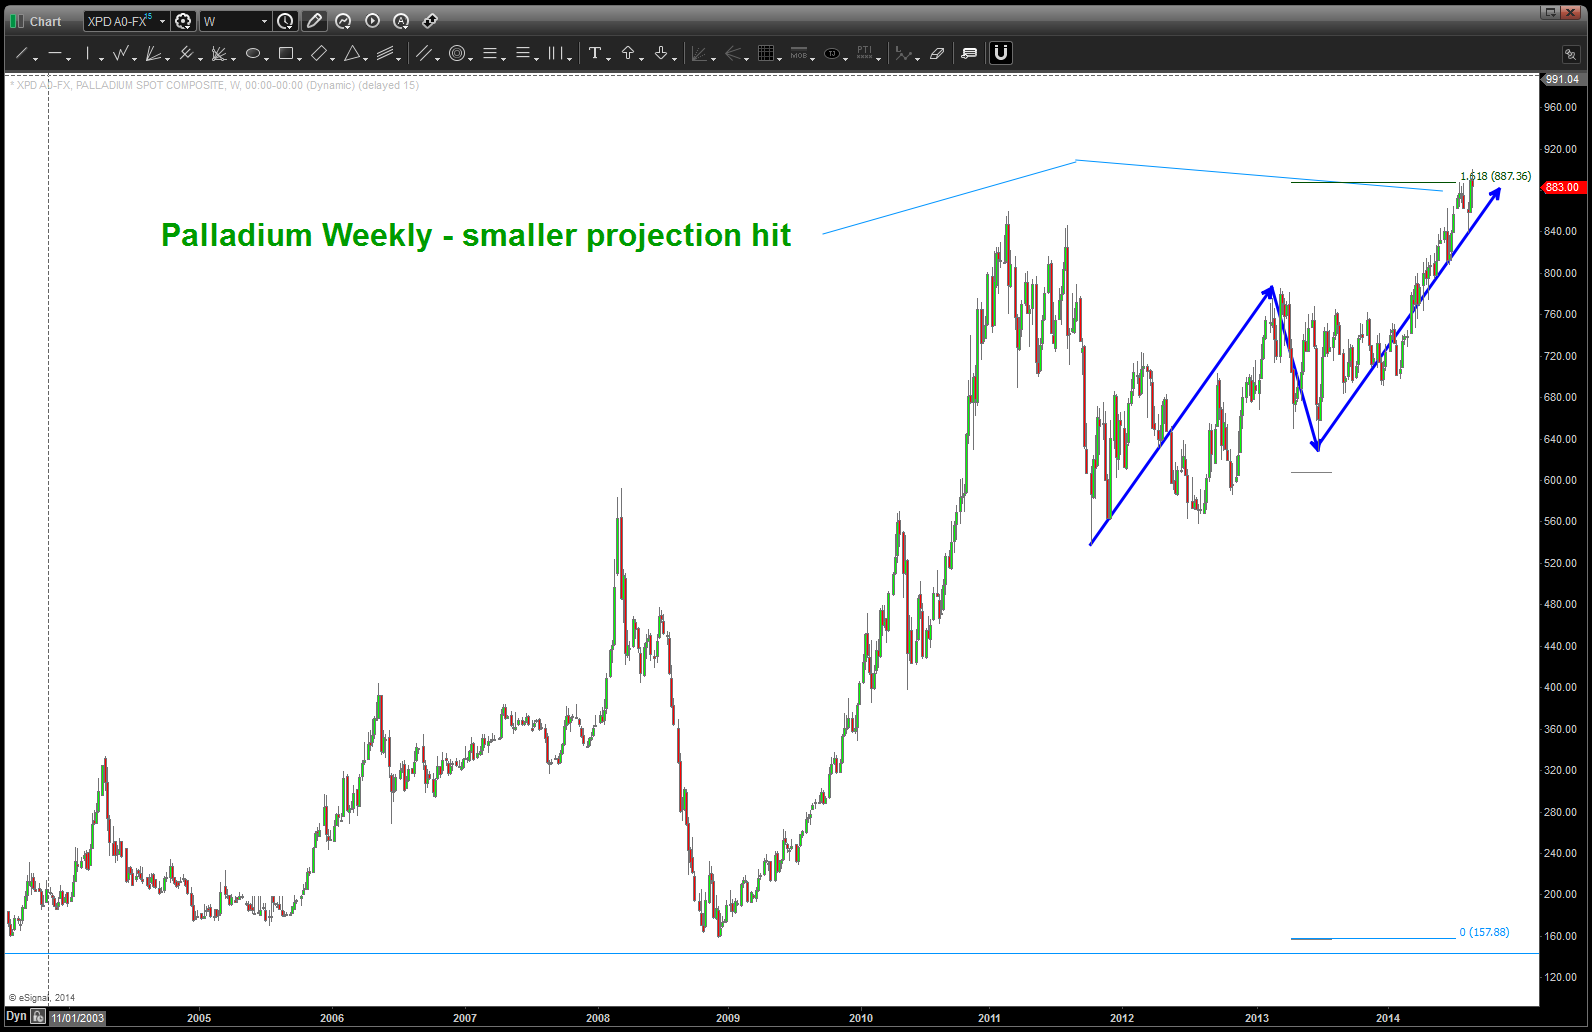
2. When constructing a PATTERN there are three things we do — PROJECT / EXTEND/ RETRACE. In order to keep this post brief I’ll do the basic stuff …
- PROJECT: note in the two charts below we have 2 “basic” projections coming into the same area. That warns of resistance.
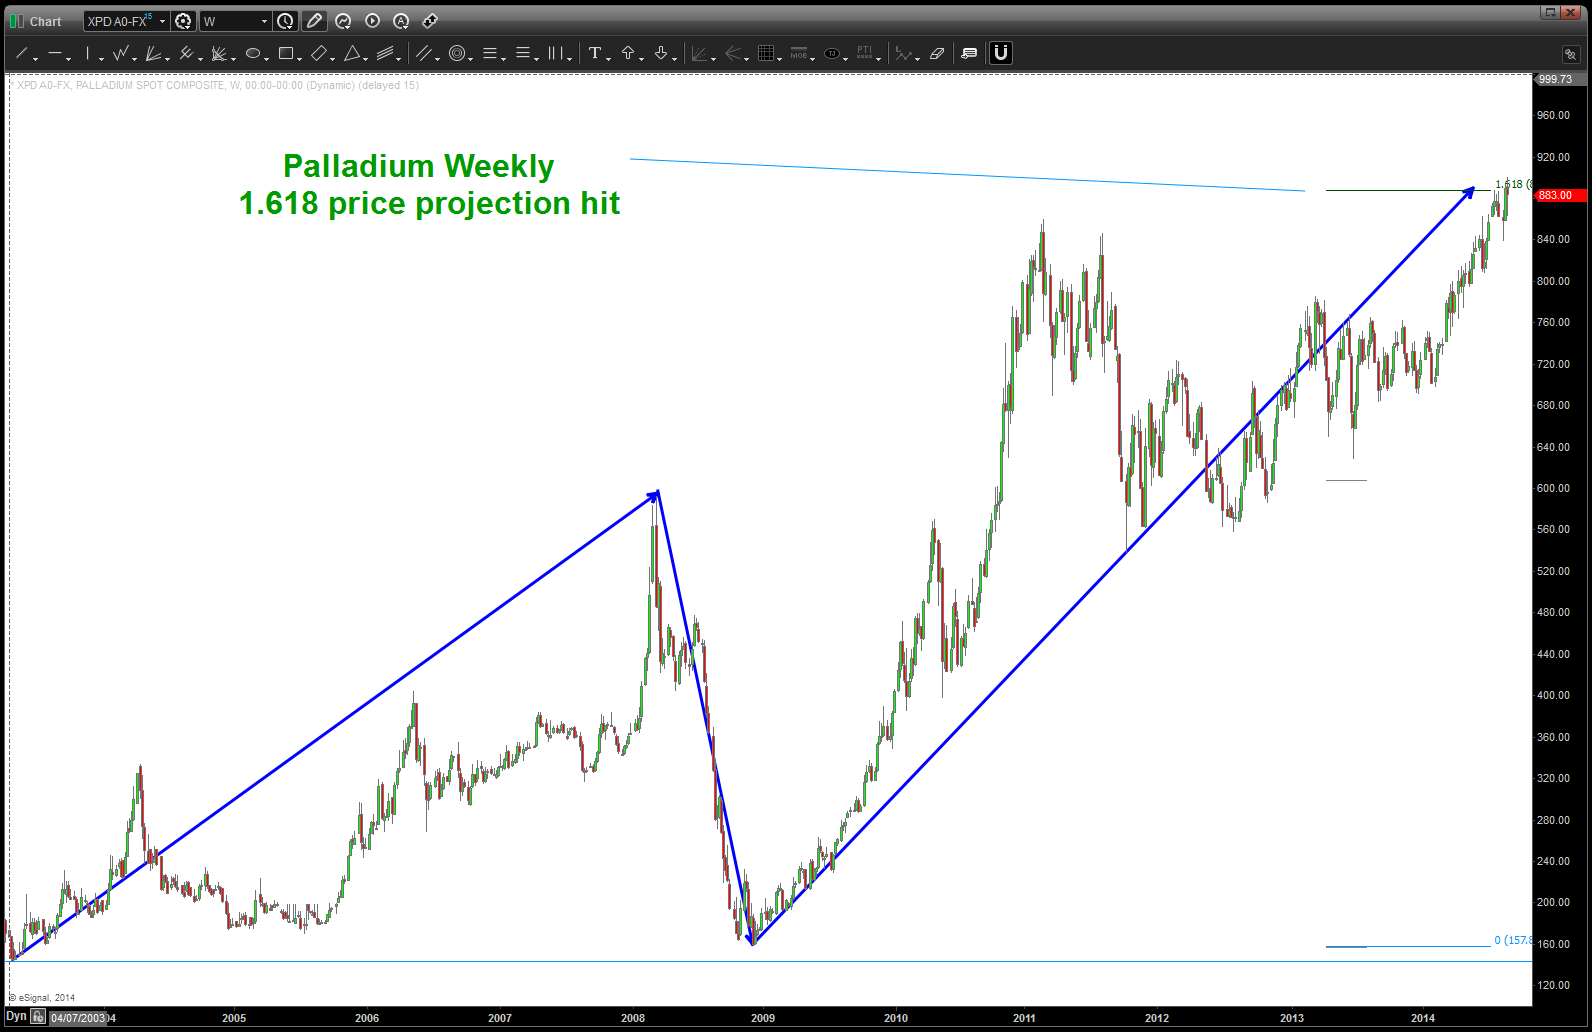
Palladium 1.618 Price Projection
- EXTEND: note, we used the middle point at 593 for the extension pattern. Also, note 1.68179 nd 1.732 are used. musical note and the square root of 3 …
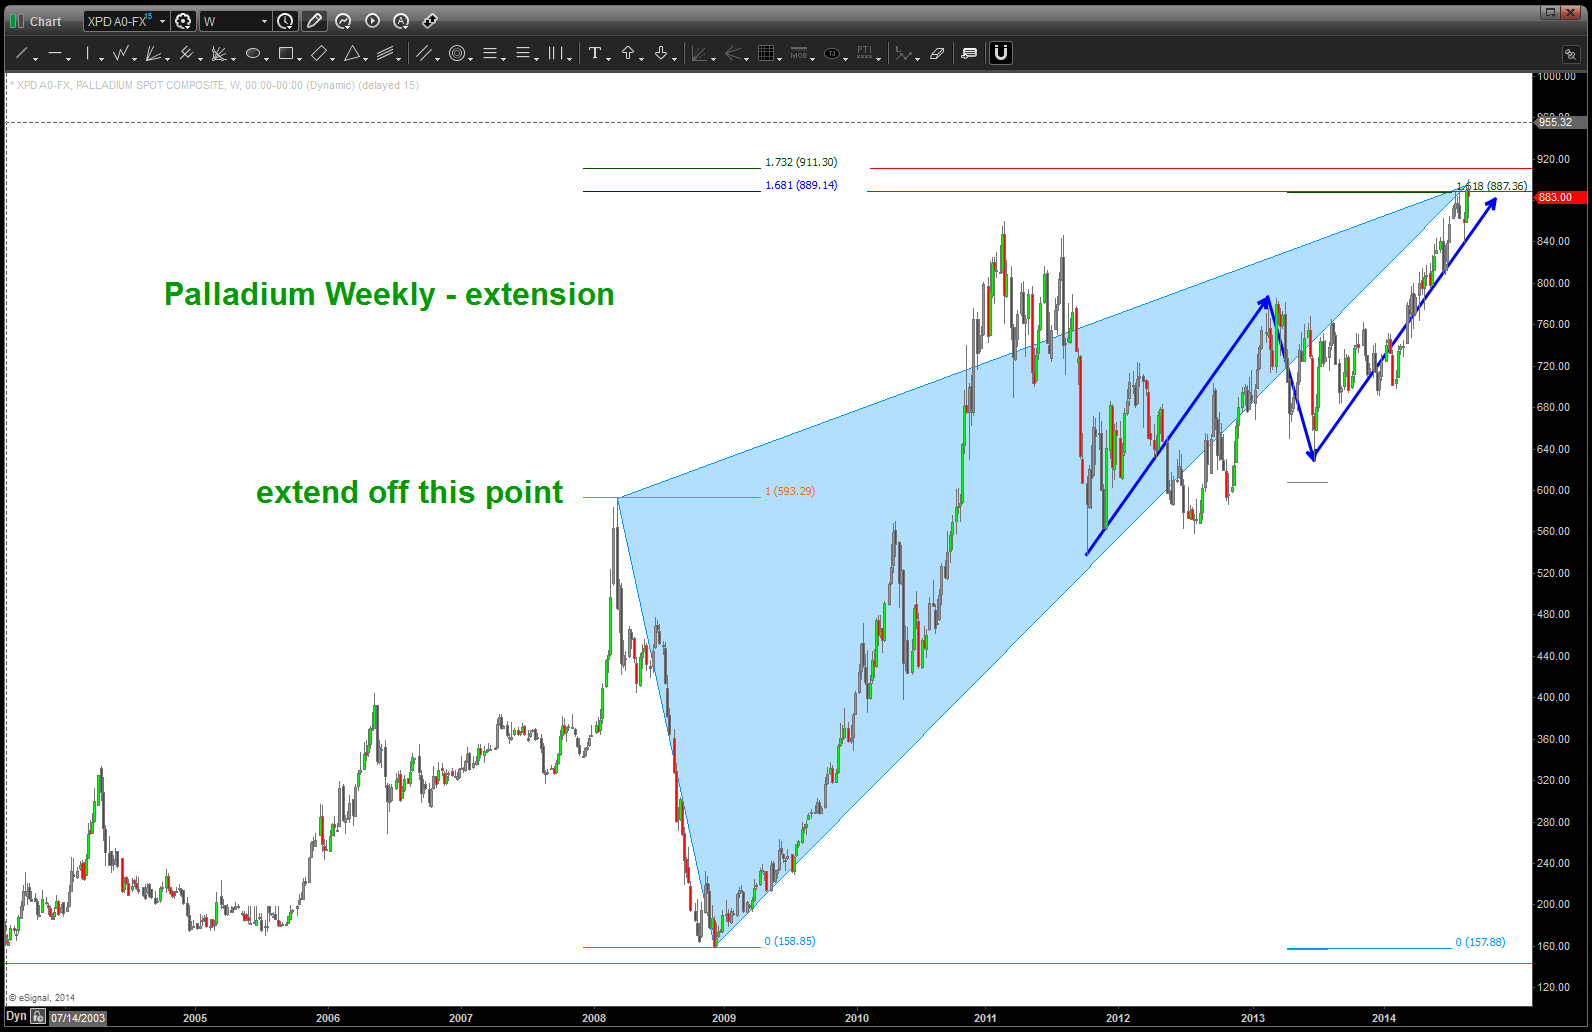
extension from 2008 (shaded light blue triangle)
- RETRACE: from the all time high we have a .786 retracement. This is NOT a fibonacci number. Here’s the math- 1.618/square root is 1.27 and 1/1.27 = .786.
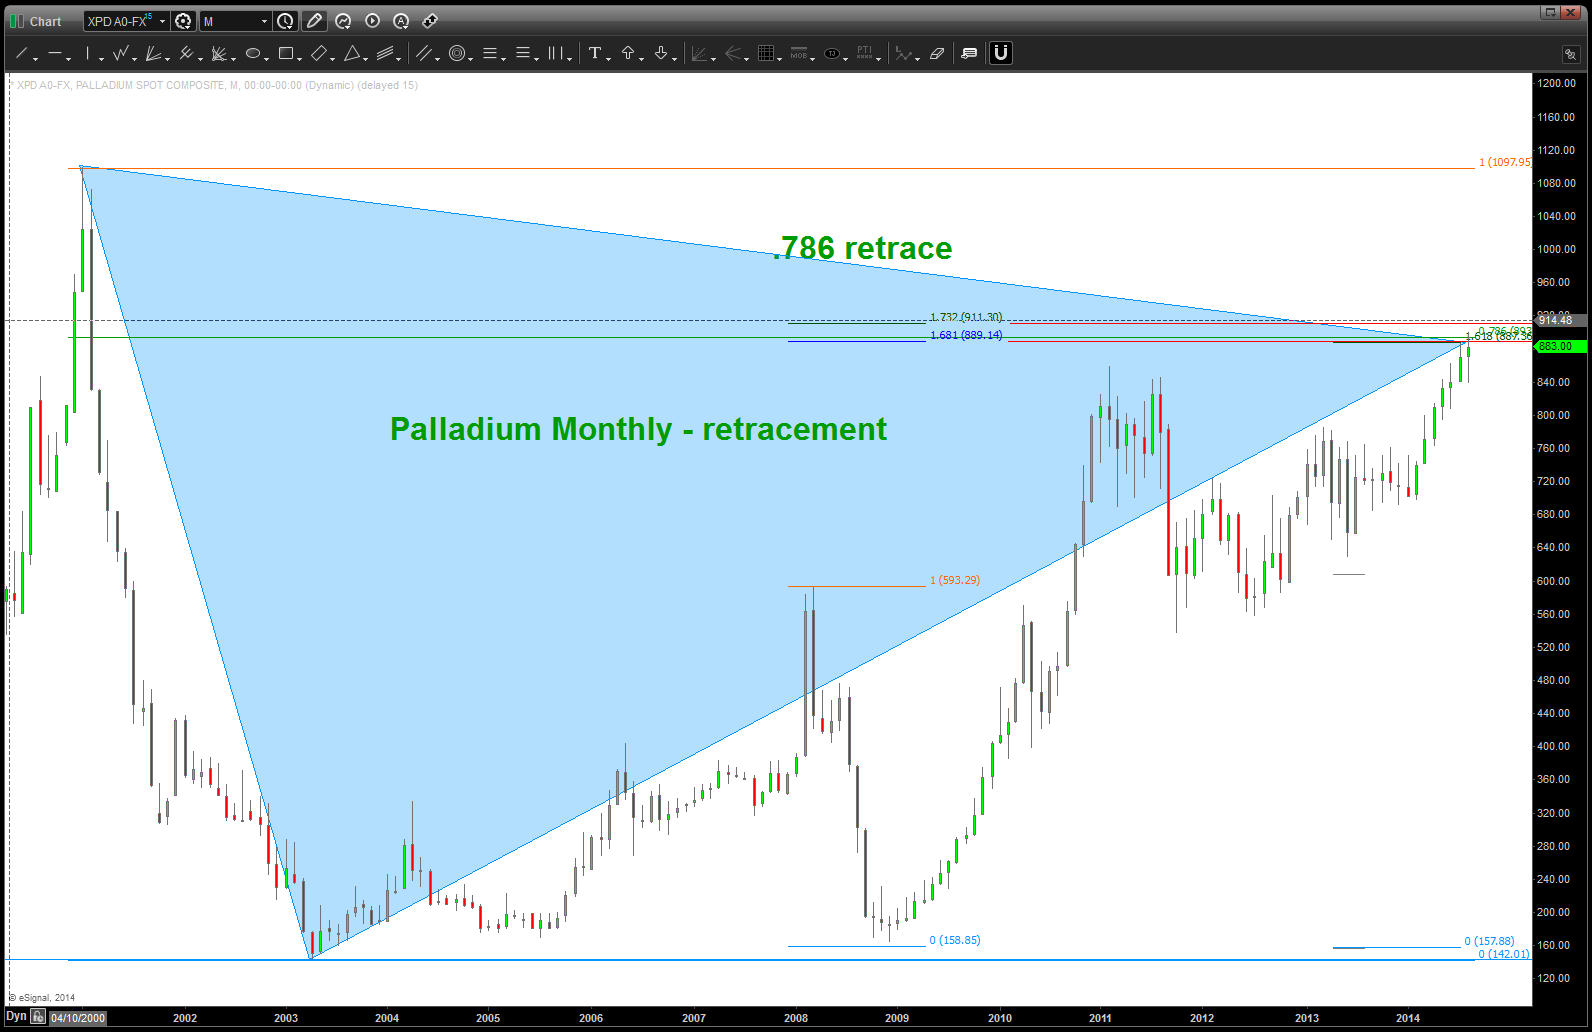
so … as you can see, we have a bunch of NUMBERS adding up to this being a big level for Palladium. And, while a case can be made that, since these are weekly/monthly nodes coming out, it SHOULD be a hefty amount of resistance. That being said, it could also BLOW RIGHT THRU EM’ and rip higher and higher. It’s just a pattern folks.
Last – the BUTTERFLY PATTERN is present. Connect two triangles together and that’s the butterfly pattern …
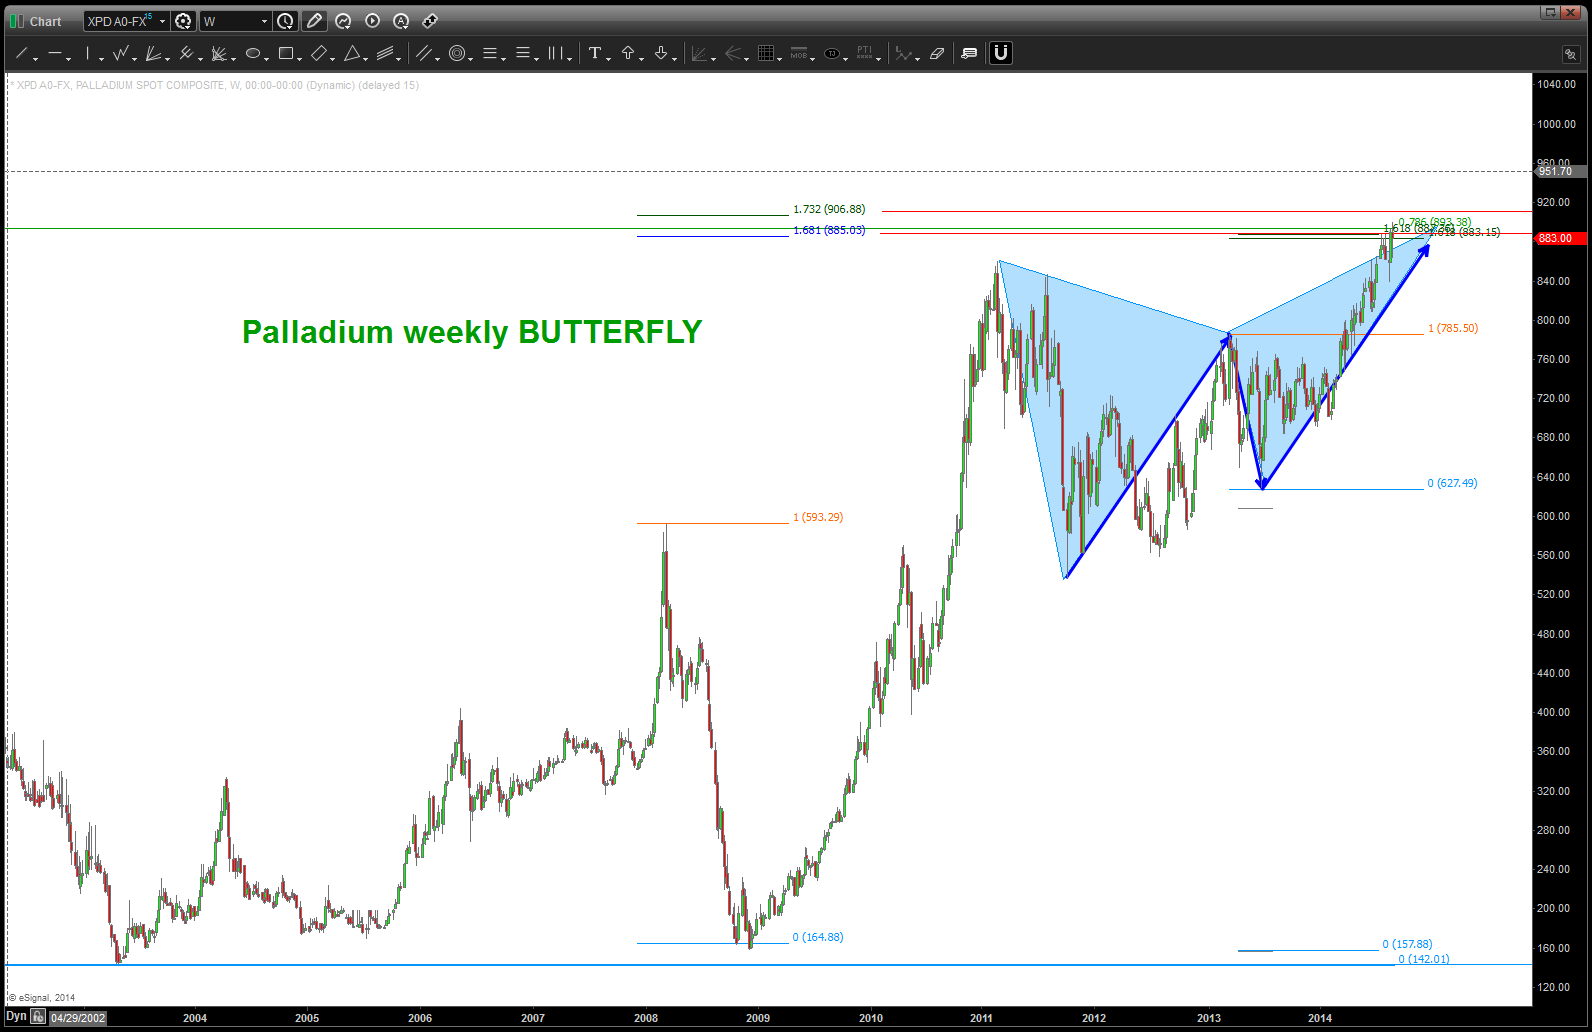
Butterfly SELL pattern
put it all together and here is the picture:
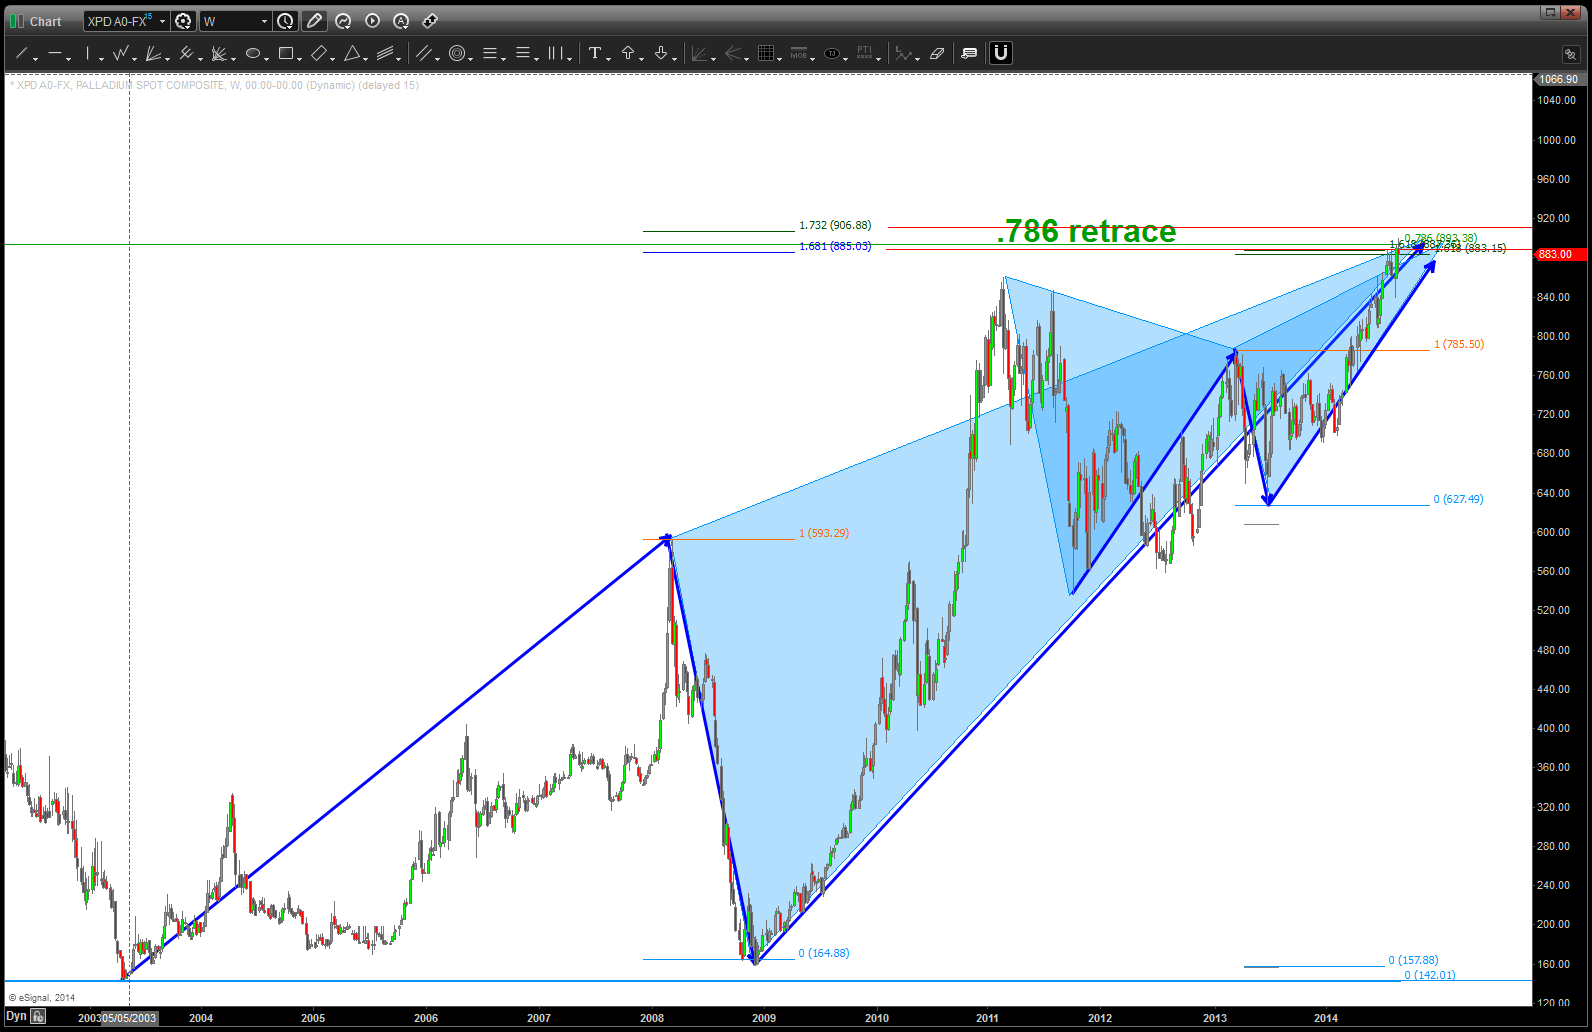
PATTERNS complete on Palladium …
here’s a potential count — note – 4 doesn’t CLOSE below 1 so I say “go for it” w/ regard to the count. Additionally, alternate targets provided at little higher. Sure seems like it wants to head up that way … ?
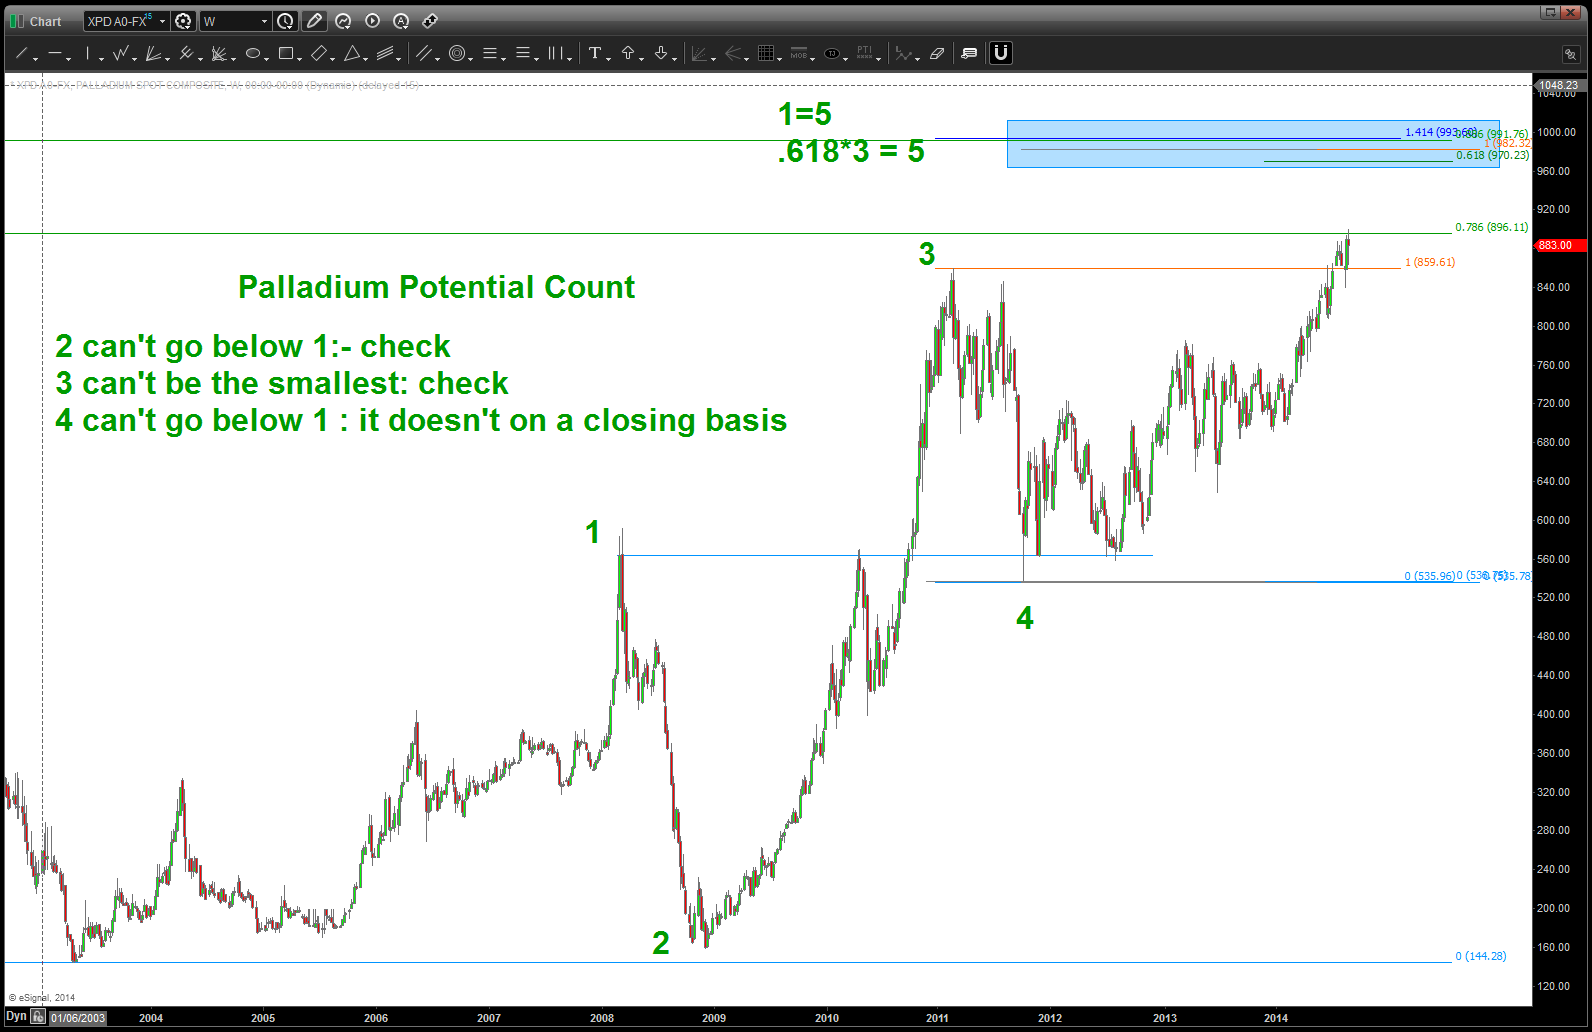
Palladium Count Potential
last thing we check is the “relative strength” using ratio analysis. in this case we have PALLADIUM / GOLD. When we overlay Gold on top of the ration there isn’t that big of a correlation. HOWEVER, when Palladium is overlaid (see below) we can see that this ratio is extremely important. And, what do we have on the ratio – a SELL PATTERN appearing, which, in the past, has caused Palladium to inflect. Stay tuned.
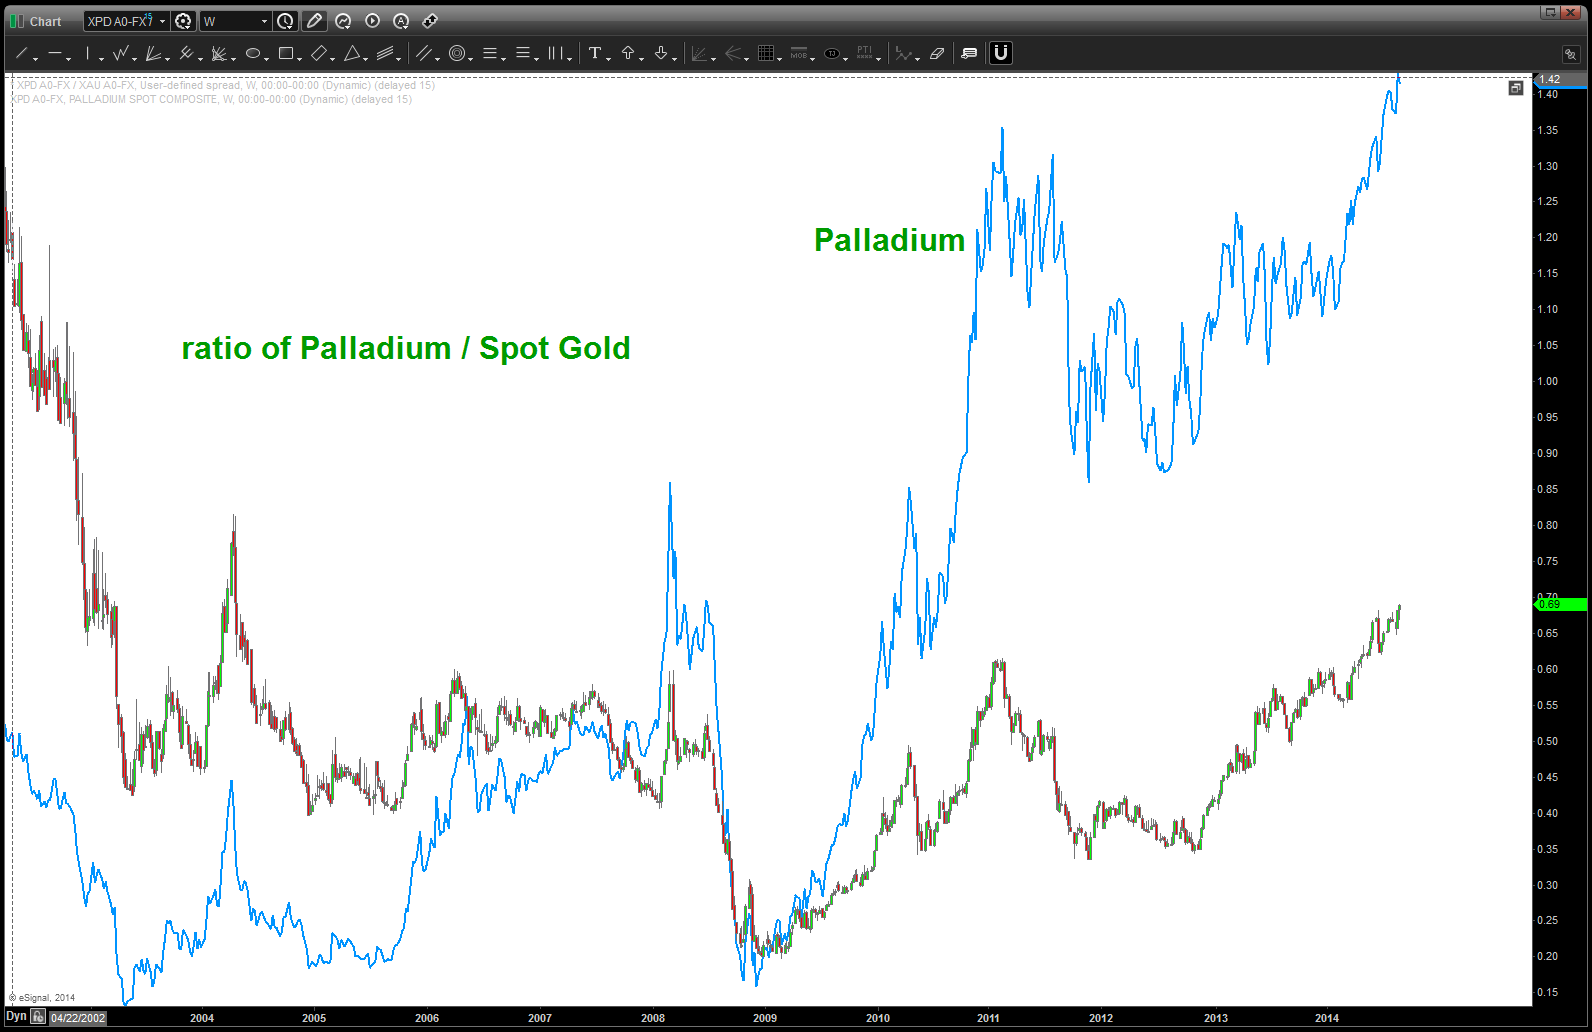
note, palladium prices overlaid and how the ratio is nicely synced w/ the highs and lows.
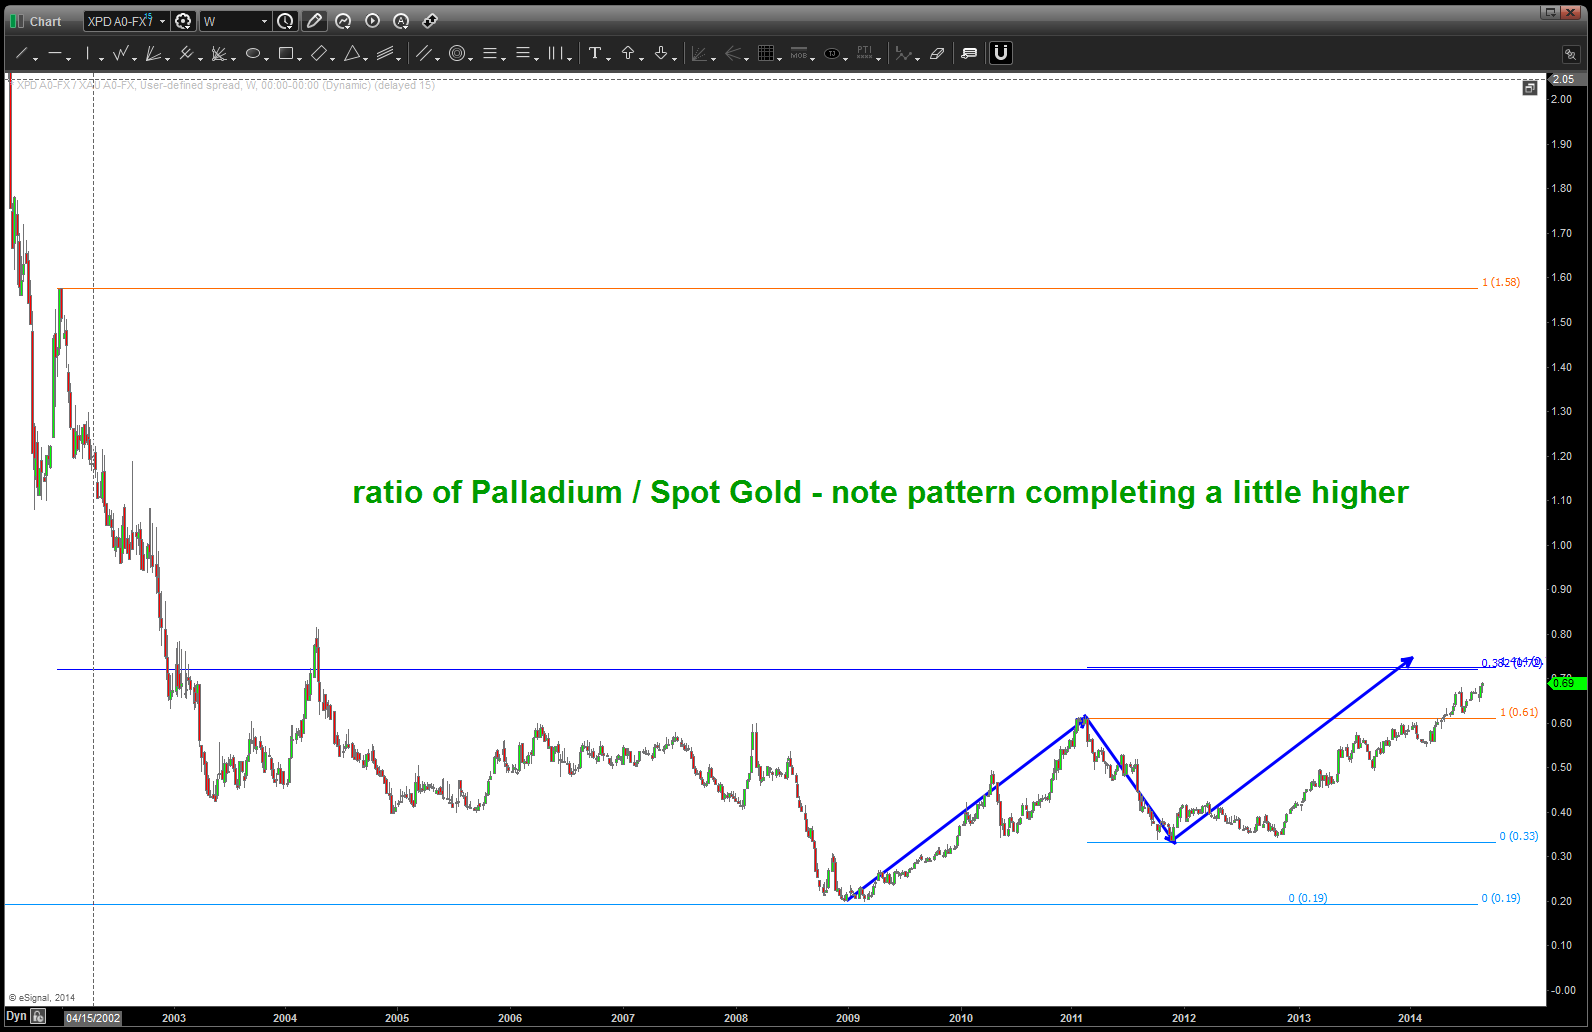
ratio of XPD / XAU – note pattern completing a little higher
So, there you have it … watch this important relationship, closely next week.
BART
bunch of cycles coming together …but who cares
Posted on September 17, 2014 Leave a Comment
how many institutions are there out there ….? perhaps 30-50K? and, if you think about it they own 10MM+ shares of the big names. the “big names” have, on average, say 5MM shares / day traded. so, what happens if they try to get out of a non liquid market that has been manipulated by “buy” and “sell” programs …? That’s a liquidity problem … but, perhaps I am the only remaining individual on the earth that thinks this market can correct — 20-30%. I’m alone on an island …
here’s some more time/price coming together.
my pivots are 2020 and 1988 …
amazing …
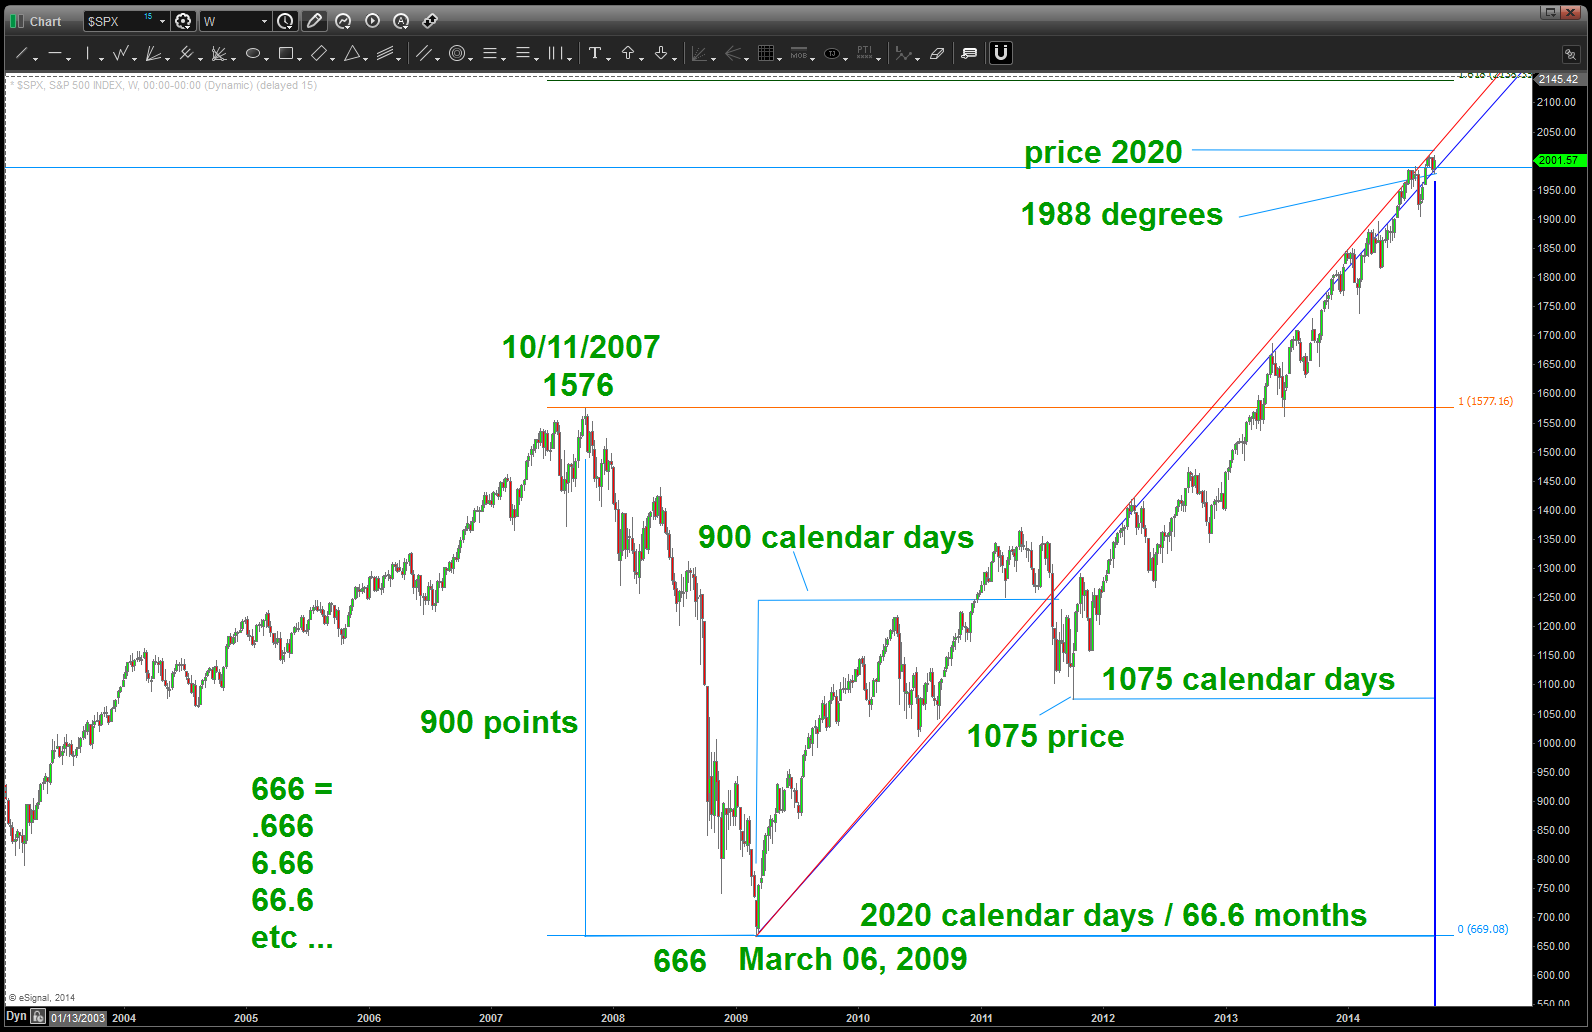
more time and price coming together
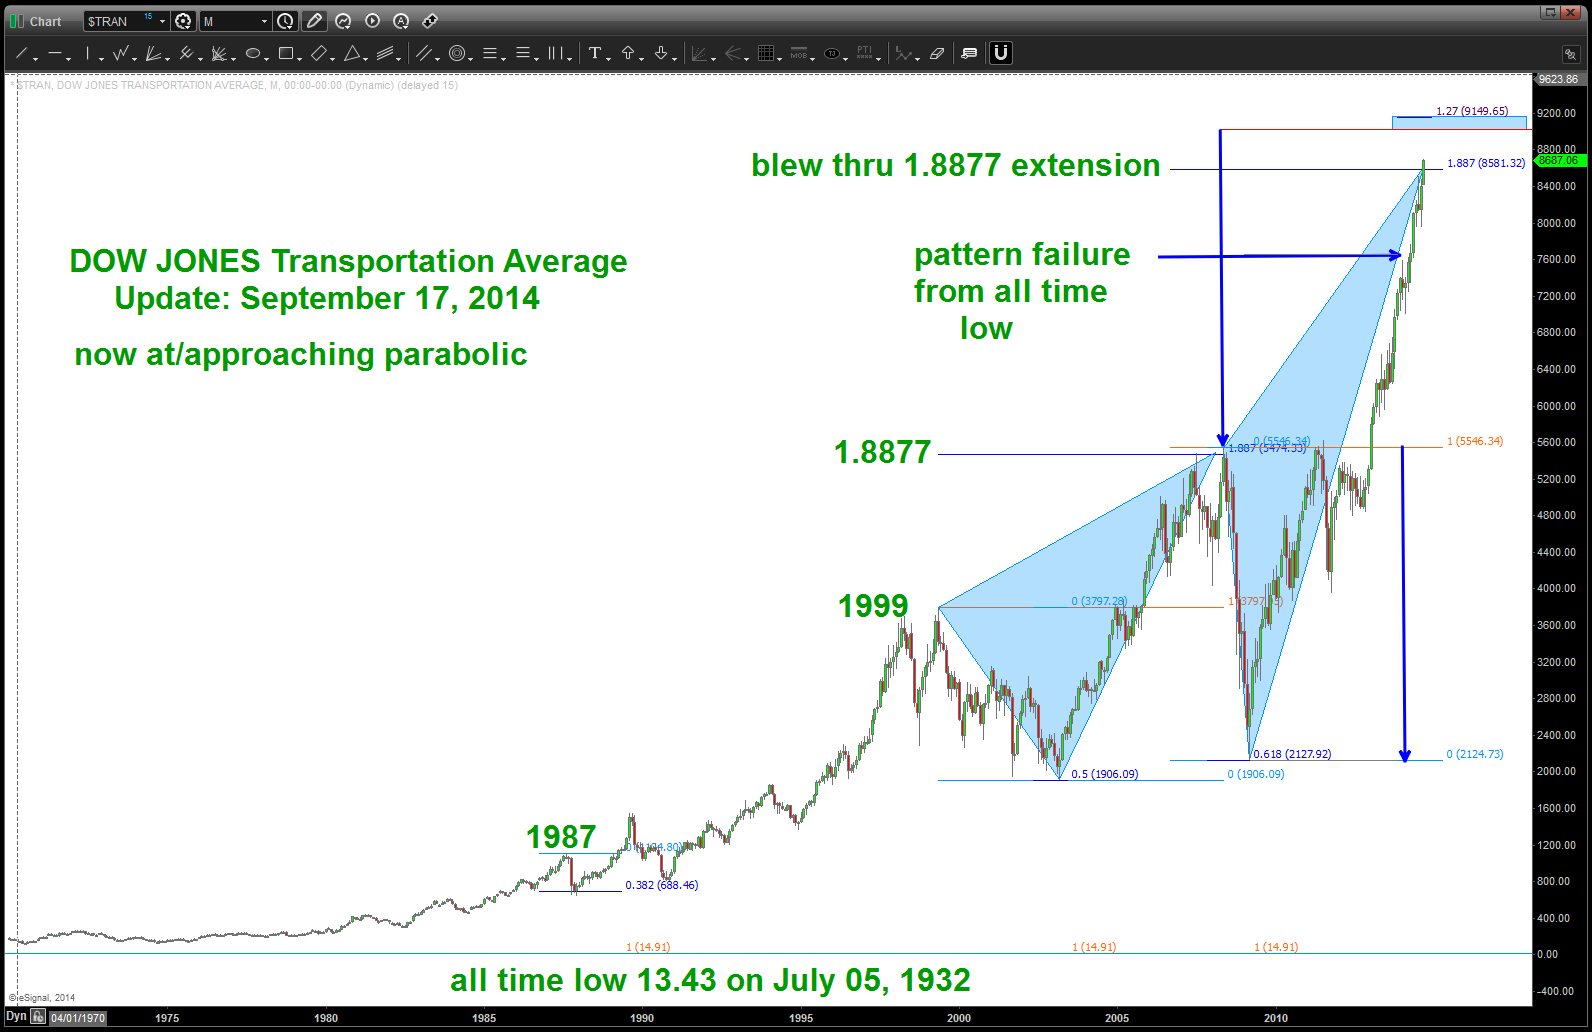
Dow Jones Transports – almost parabolic.
Posted on September 17, 2014 Leave a Comment
September 17, 2014: below you will see some of the continuing work I have done on the transports. Quite simply, an incredible move …
there are, however, some things we can learn from this from a PATTERN perspective:
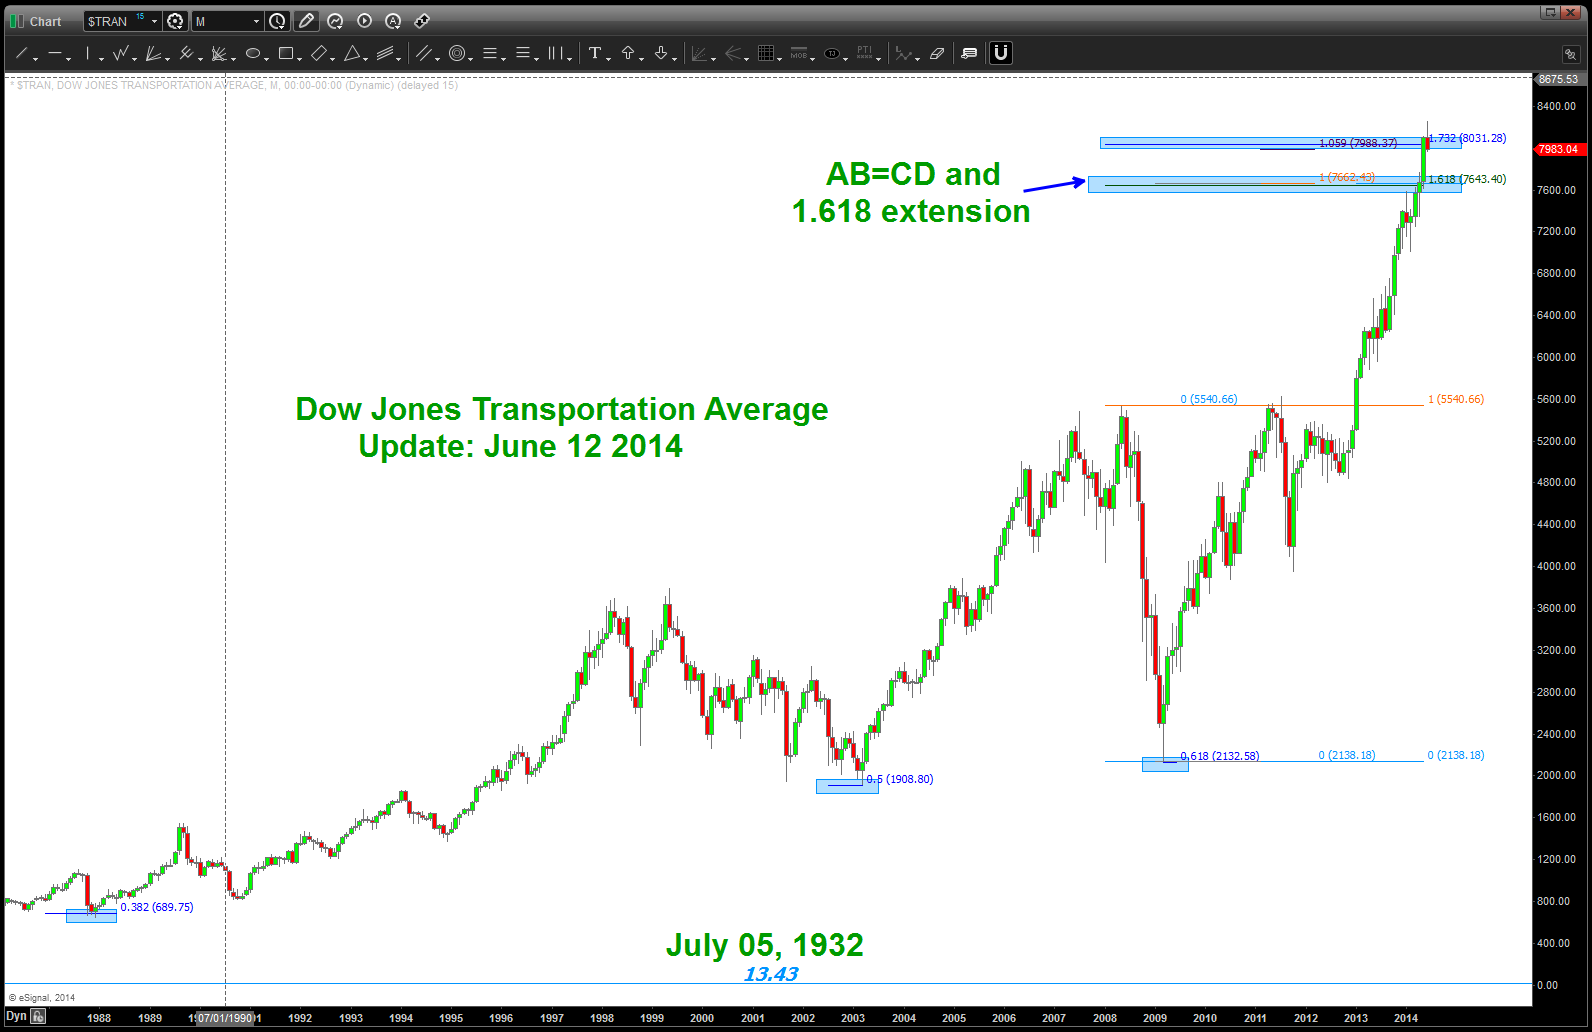
- my “job” as a PATTERN chartist is to do my best to find the patterns and then present them to you, my readers. (thanks for the following also) As a PATTERN chartist you are NEVER wrong. The PATTERN works or it doesn’t it … it has NOTHING to do w/ you. On long term time frames, well, the patterns are “easier” to construct. An all time low to a “former” all time high gives you AMAZING projection capabilities. In fact, it is one of our easiest PATTERNS to form – the “zig zag or AB=CD” PATTERN. Folks this formed on the Transports and got SMOKED … not even a token of resistance. Wow …
- when a “zig-zag” or “AB=CD” PATTERN fails it will usually go to 1.27 or 1.618 of the PATTERN.
- so, what do we have “now”
- note the all time low of 13.43 was on July 05,1932 a mere 30,024 days ago.
- using that low and a 1.27 AB=CD we get a target of 9149
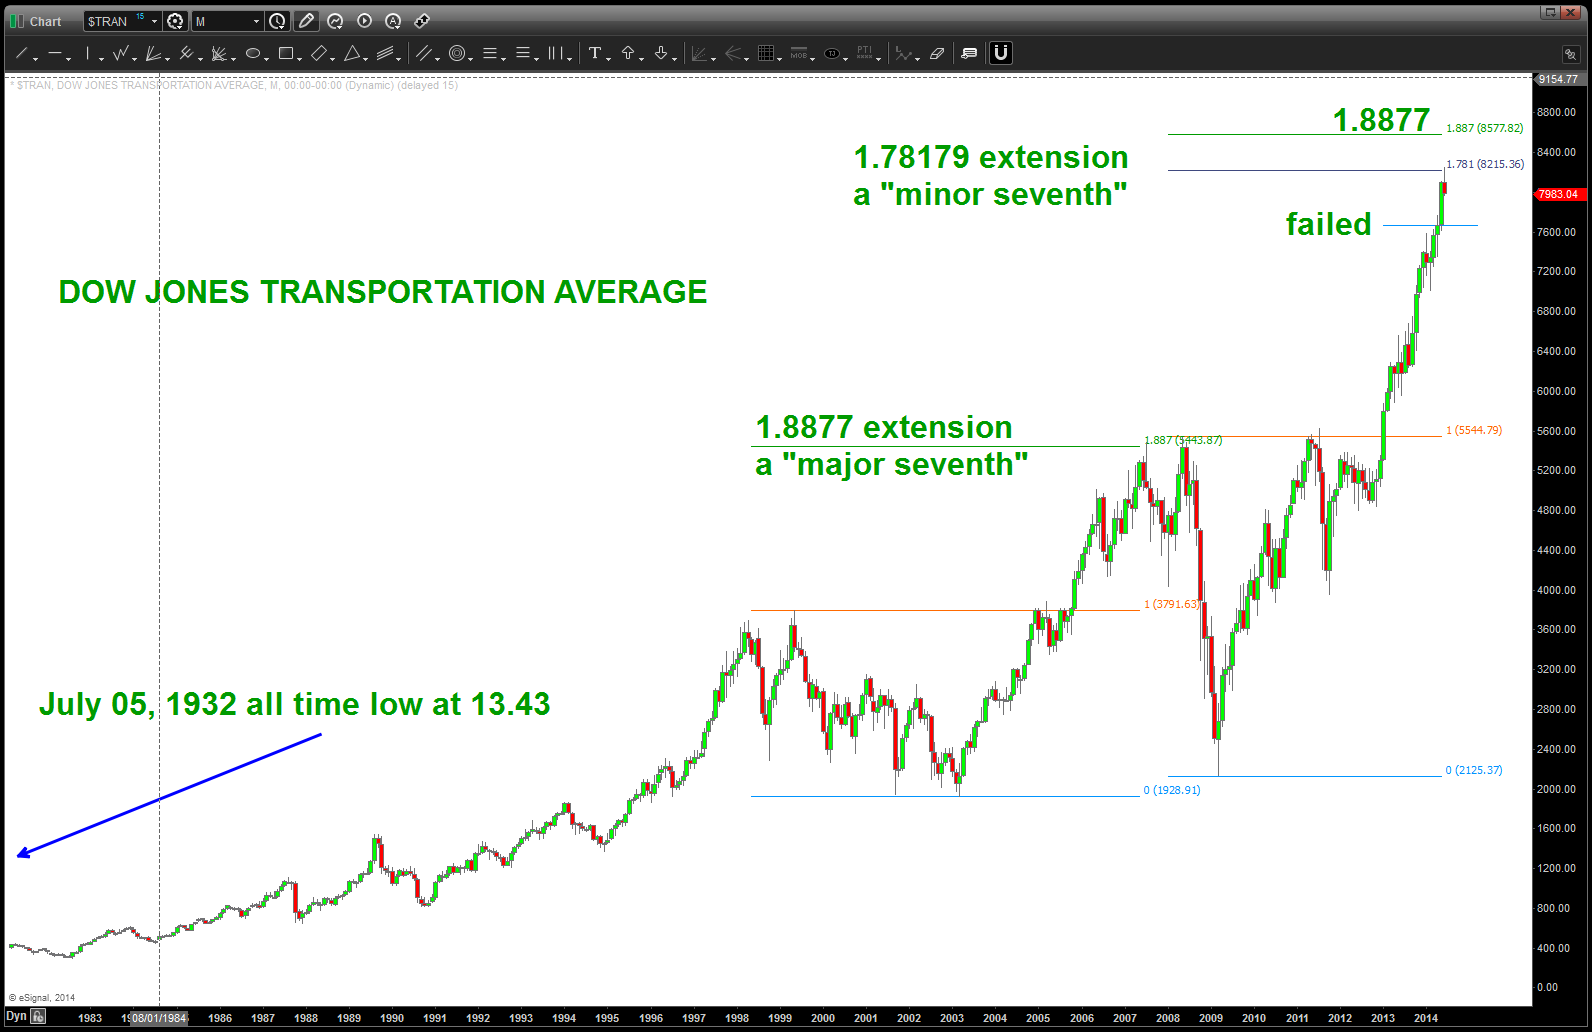
- note, the “old” all time high in 2000 to the 2009 high was a 1.8877 extension (musical note). sometimes, the PATTERNS repeat the same harmonic. NOPE not today … blew threw it.
- also, you can see the blue arrow projections and the “minimum” objective of the head and shoulders BULLISH top that formed comes in around 8880

some other projections shown for the Transports
- note the all time low of 13.43 was on July 05,1932 a mere 30,024 days ago.
Since this move is going PARABOLIC it’s sometimes helpful to bring out the old geometry … this is simply the technique of how to draw a circle from 3 points. (full disclosure: I have NO IDEA where the GRAVITY CENTER is going to end up.) Note, when using this technique our gravity center is, basically, the zone for the past major top in the Transports.
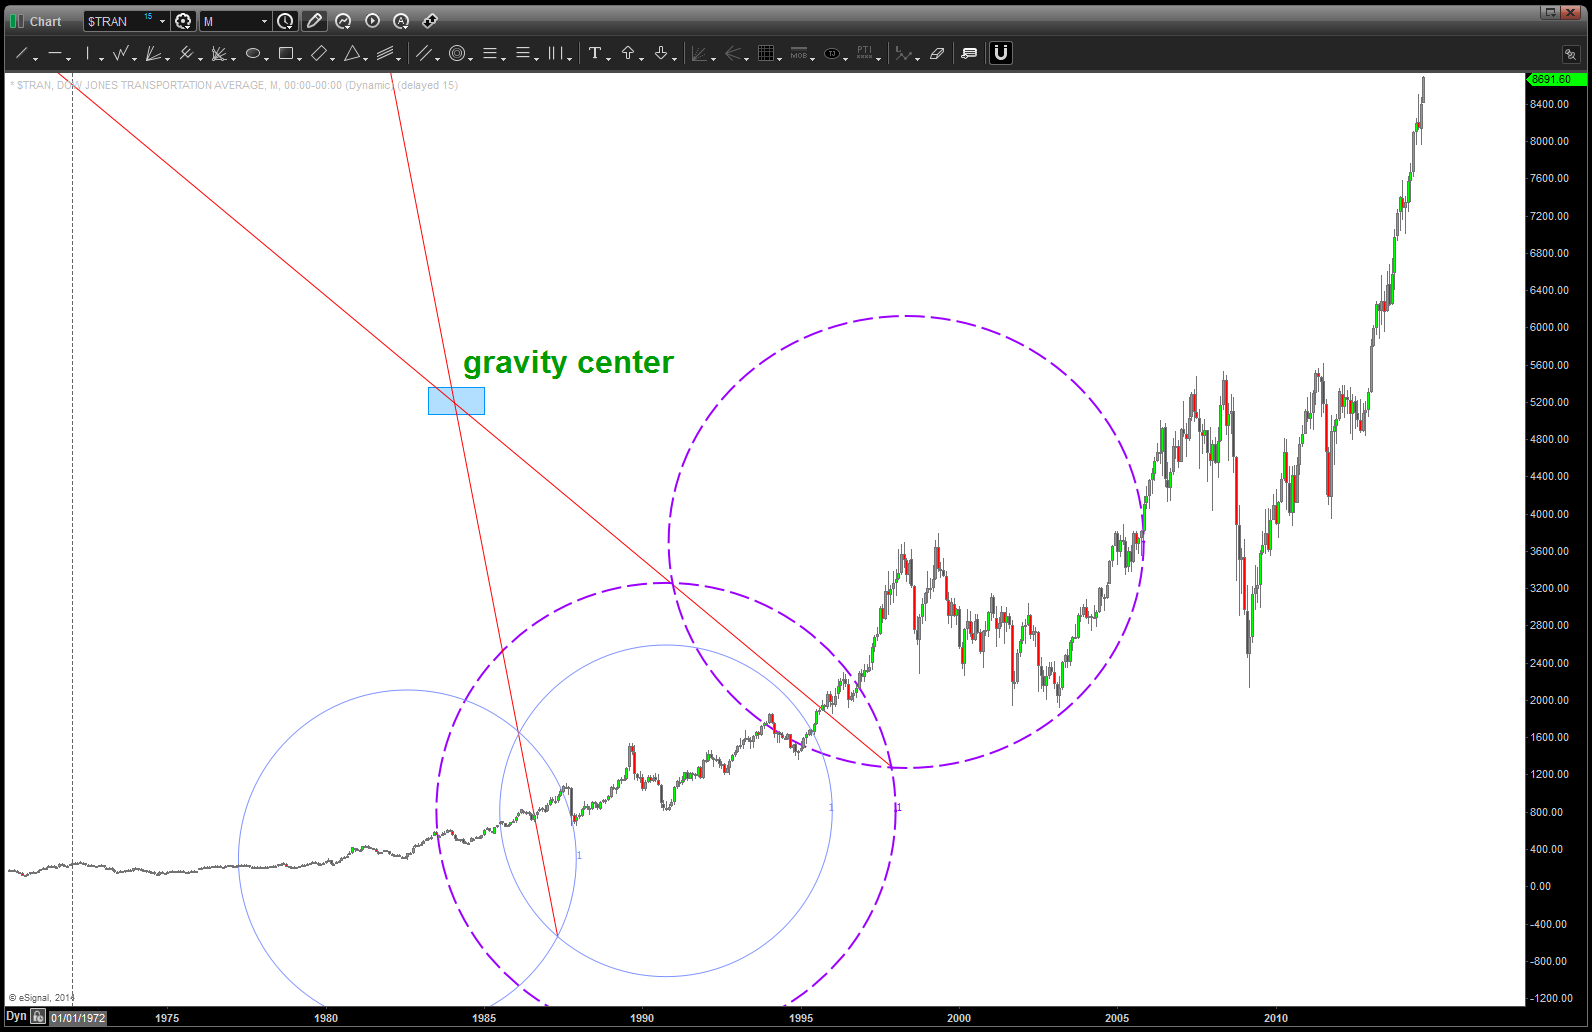
finding the gravity center
now that we have found the gravity center we can get to work ….
- note, the gravity center (blue horizontal line) is the “reason” for the major tops
- note from 1994-1999 price “hugs” and rolls right up into the top. that tells us we have a nice gravity center …
- note also that when we draw, from the gravity center, harmonic trend lines we find the “major reason” for support and resistance …
- when projecting from a neckline, remember, the depth of the neck is how to project UP (in this case) to project a minimum target. (again, it’s minimum target, NOT the target or though it can be)
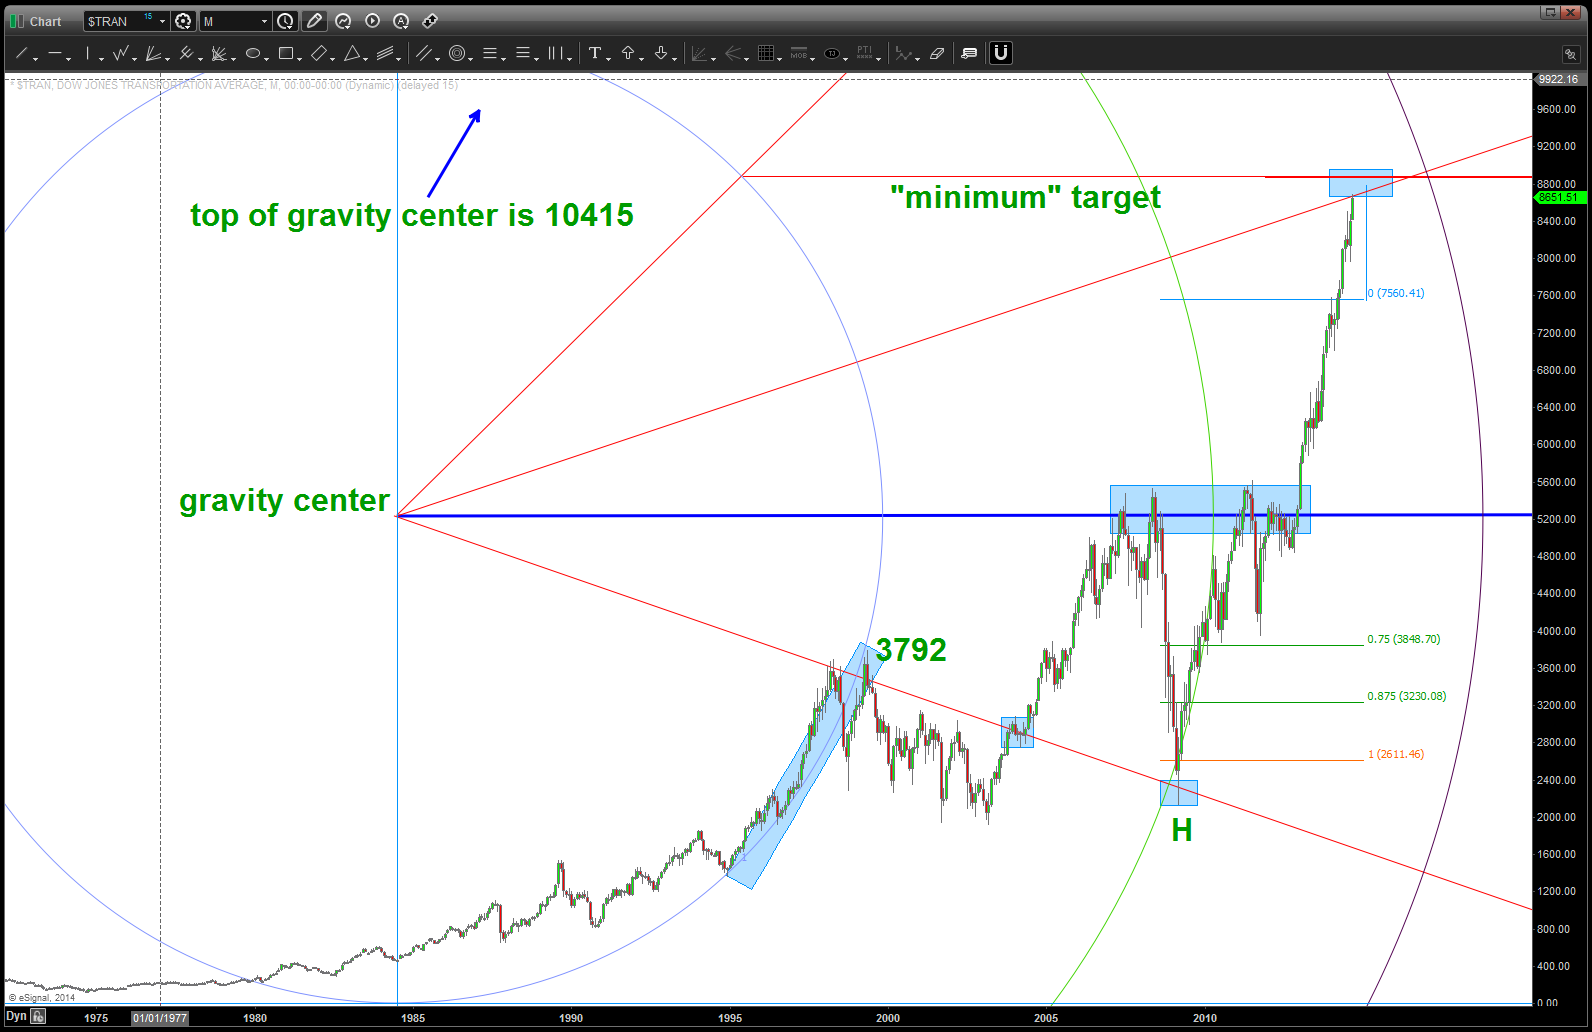
gravity center harmonics
CLIFF NOTES: this is an incredibly powerful move. Some more targets are coming into play as noted above. when the PATTERN around 7600 failed the vacuum up was to be expected.
June 12, 2014: more than likely, you saw my long term transports post a couple months ago and as this target got attacked I was truly looking for a “little” resistance. I mean, come on, it was the ALL TIME LOW to the “old” ALL TIME HIGH and we have a 1.618 extension RIGHT ON TOP OF THE LEVEL. As patterns go .. this was a doozie. However, as patterns go, it failed. Folks, it didn’t even put up a fight …
so, I hit “erase all” on the chart and, quite frankly, left it alone. the joy of patterns and charting …
I went back to it tonight and I still think we have a pattern forming so I went back and said “self, what did it do the last time we surged past an old high and into a new high? Well, guess what? It surged thru the 1.618 extension in 2007-2008 an stopped on the 1.8877 extension! TILT … 1.8877? Well, that is exactly a major seventh ration in the equal octave scale of music. So .. perhaps it did that again? Please see below …we smacked into the minor and, quite frankly, the major is still out there. However — this sure looks like a MONTHLY 3 DRIVES TO A TOP pattern.
Keep the mindset (defensive) of ‘breaking a swing low’ …until we do break a weekly or monthly swing low this puppy will still keep running but if we break 2 or more weekly swing lows … we could see this thing drop to the old highs at 5600. Stay tuned …
What a run! Hugh?
Also, please be advised that a reader corrected me on the price and time of the old time low. I did some more research and it appears the low was in the 1930’s around 30 points lower than the one in the late 1800’s. Negligible when we are up at 8000 BUT extremely important.
When you look at the Yahoo Finance Chart below – try to disregard this is the entire life cycle of the Transports – and just look at the symmetry of the 3 drives to a top pattern that is appearing.
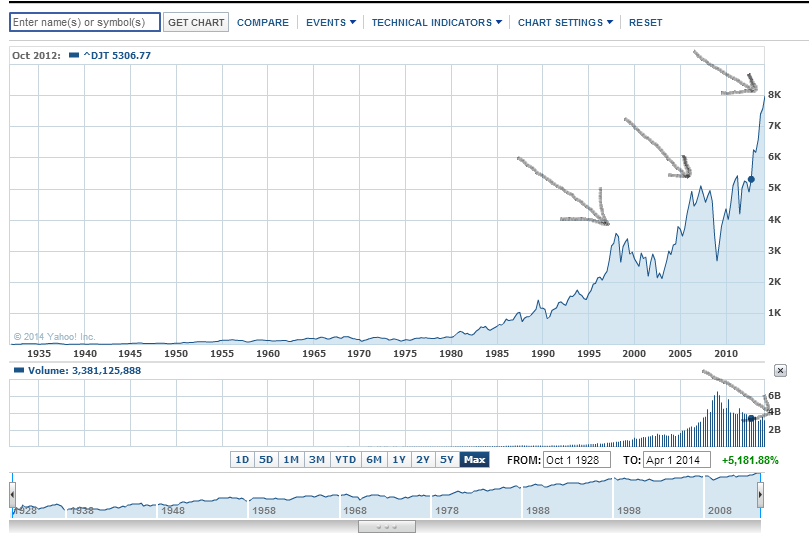
notice the decreasing volume and POTENTIAL 3 drives to a top
Carrier Aviation Strike Planning and Investing …
Posted on September 12, 2014 2 Comments
Have seen the recent TWEETS by my friend and fellow blogger JC about Gasoline Futures and, while I don’t trade it, I am interested in it so I thought I would give it a shot … let’s face it, I owe JC a lot because he got me blogging a little over a year ago. Now, gasp, I have around 250+ people who check out what I say. One day … it’s will be 2500 and then another 25,000. So, this is pretty cool …
Before I throw some Voo Doo on the page I’m going to address some of the recent flow on TWITTER about risk and how, your not going to be right every time .. period. That’s why I have found the holy grail. PATTERNS tell you where your WRONG every time! 🙂
People sometimes ask me – how right are you on your calls/trading?
Me: “100 percent”.
Them: “You can’t be right 100% of the time.”
Me: “100% of the time I have defined my risk and know where I’m wrong”
- if they don’t get it … they don’t trade
- if they do get it, then a meaningful conversation or, at a minimum, a drink or four follows.
So, why is investing/trading like Strike Planning? Because you spend TONS of time and cover the most MINUTE details and plan every thing to the SECOND and guess what? When you launch … EVERYTHING changes. I mean everything … I’ve been known to “hold court” at a happy hour or three and I could fill hours telling you some of the craziest stories about how the PLAN CHANGED as soon as wheels were in the well …
How is this like investing? Well, as your going to see below, some considerable time and brainpower was/is spent on Gasoline futures … a gameplan has been developed and it will be followed BUT INVARIABLY the ENTIRE DARN THING IS GOING TO CHANGE!
Here’s the key …
“Adapt and Overcome !!!” – the true saying of Naval Aviation
Natural Gas:
- IF we are going up THEN a case can be made that we have finished a triangle (labeled a,b,c,d,e w/ light blue trend lines and that is a continuation pattern)
- THIS IS WRONG if the most recent swing low of today goes any lower on close. If the triangle is complete, then the move up was 1 and this move down is 2 and according to the rules … 2 can’t go below 1.
- We have 3 reasons why the 2.455 held … retracements and “TCB” Taught to me by my mentor, Mike Jenkins, the TCB takes the TIME of the move up and converts that to the PRICE of the correction.
- One last, take note of the bold/dotted blue/grey arc. As you can see, the BIG MOVE DOWN was pretty violent (orange arrow) by using that move down as a radius, we can swing an arc and then use the 3 o’clock position as TIME which will represent the pyschology of that big move down has been digested and it’s time to go back up. Depending on the thickness of the bar and exact geometry it can be very powerful. All were trying to do is say it’s either “now” or “soon” that the move DOWN has been digested in TIME …
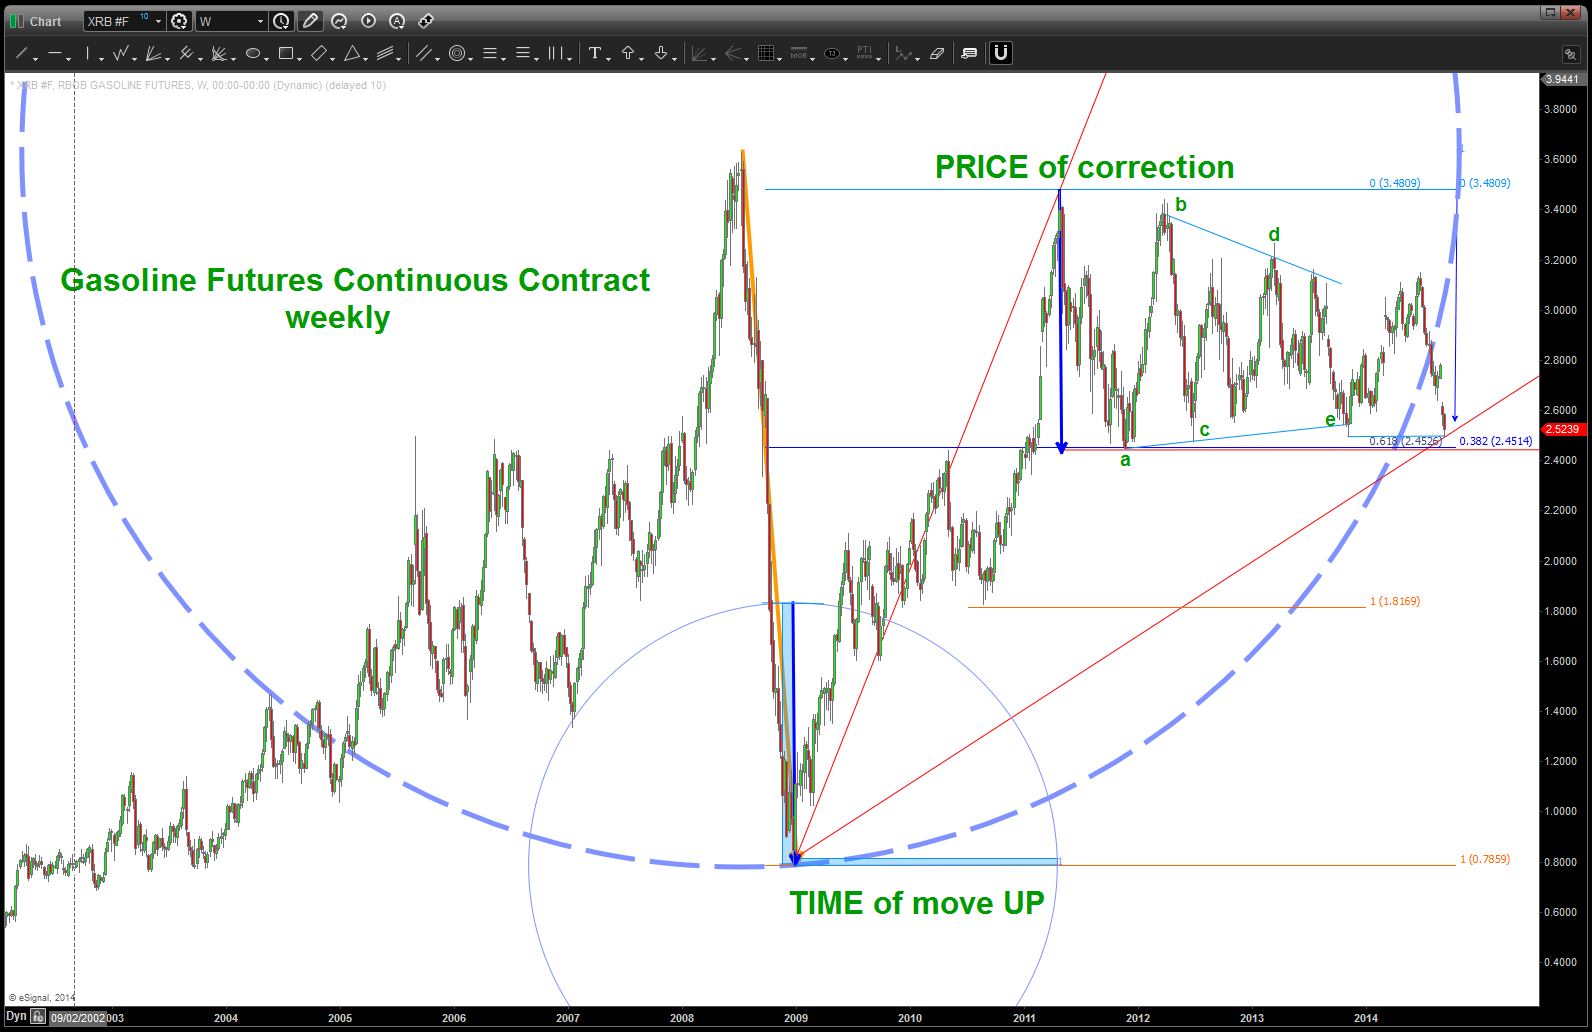
Nat Gas BULLISH case
Now, go down to a daily and the KEY HERE IS THE MOST RECENT HIGH at 3.1500 WENT UP TO THAT HIGH! Folks, that’s a classic B wave (3 waves in a B wave) and what follows is a devastating 3rd wave. IF this analysis is correct then the C wave of the A-B-C correction should be ending here/now. (note it’s exactly 2.71828 *a which is the natural log and basis of the pyramid geometry – I digress)
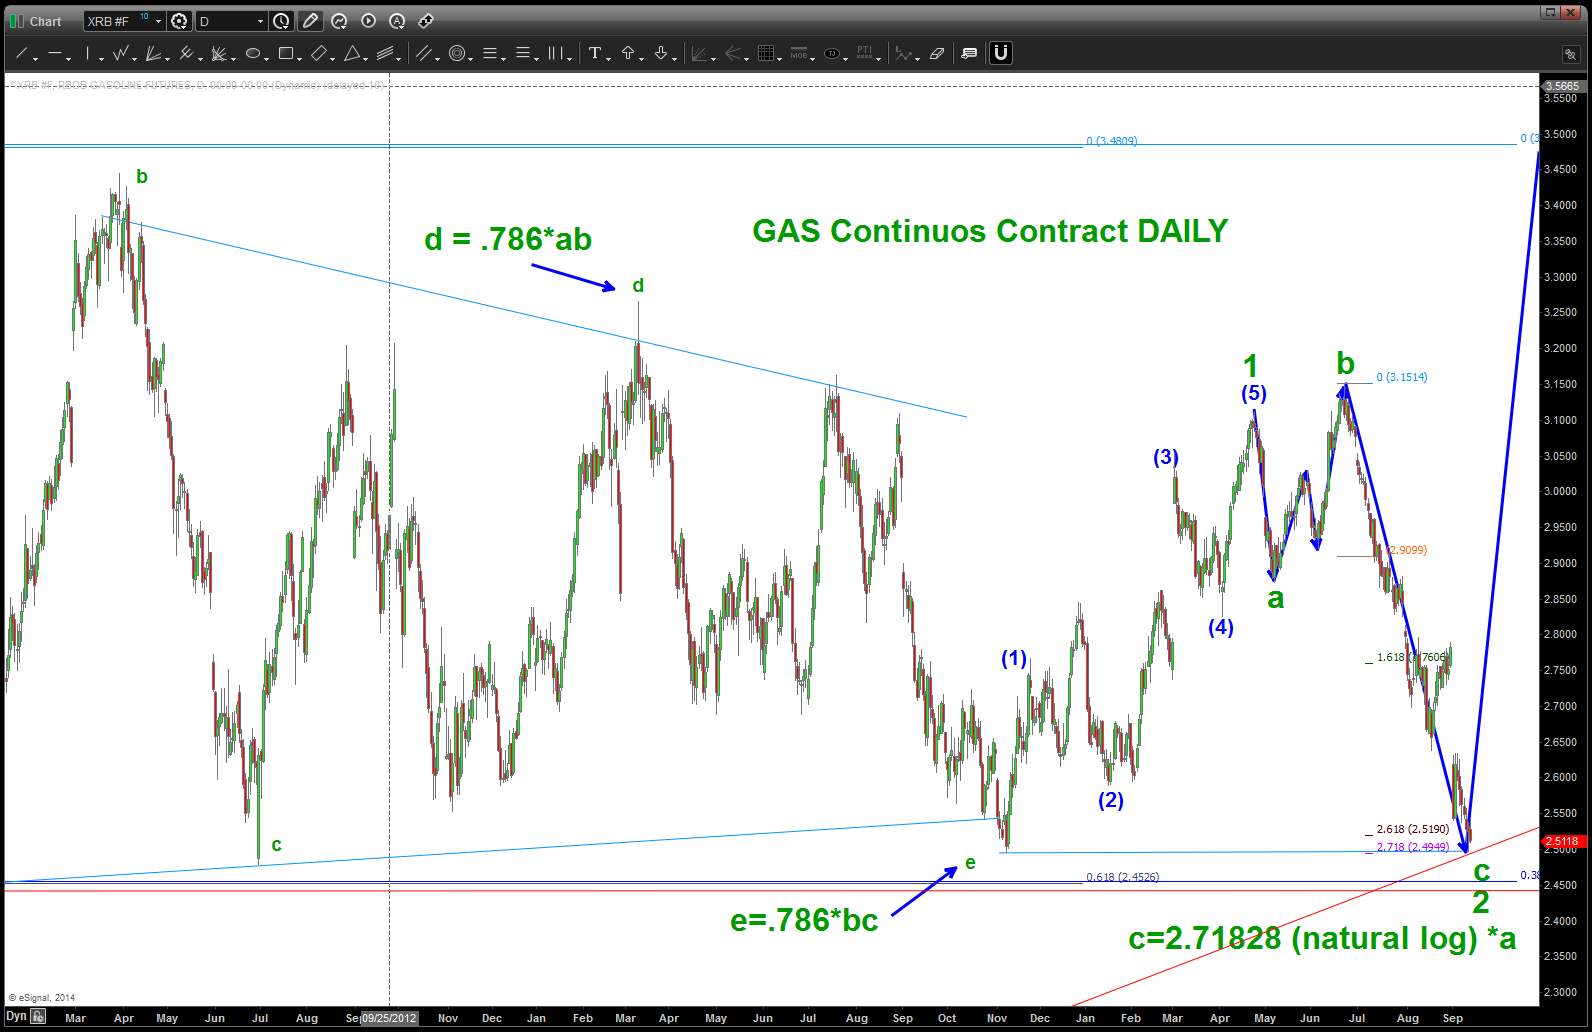
GASOLINE FUTURES continuous contract – DAILY
so, what’s going on down in the trenches ..? here’s the 5 minute chart –
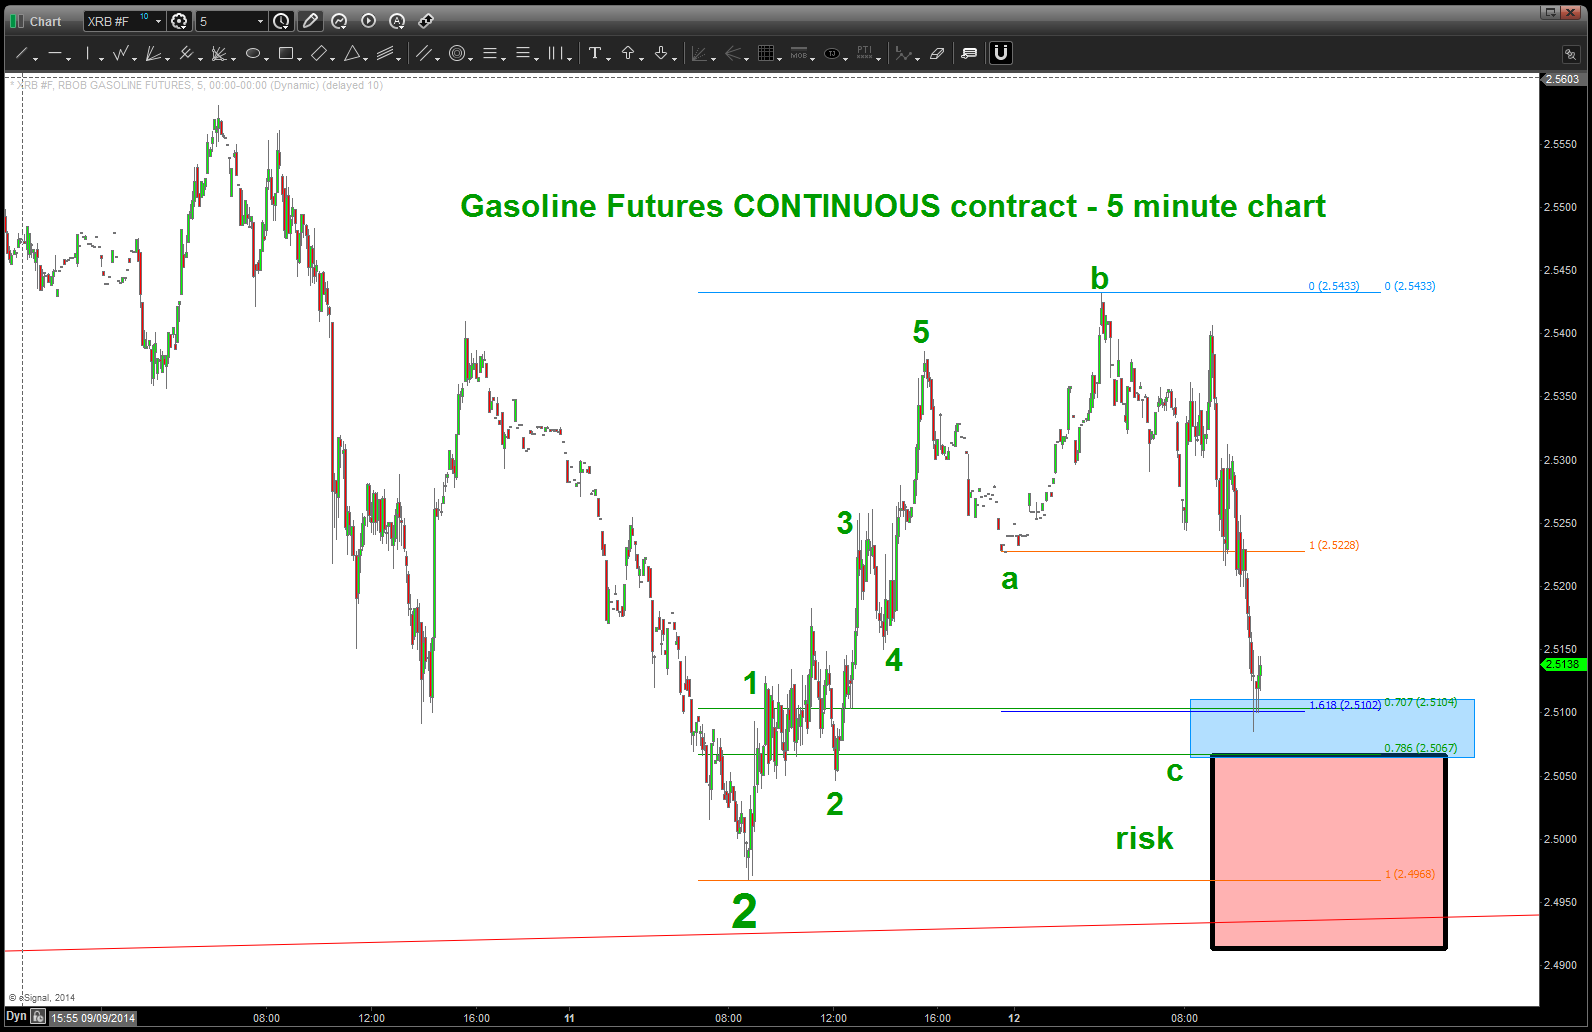
5 minute chart
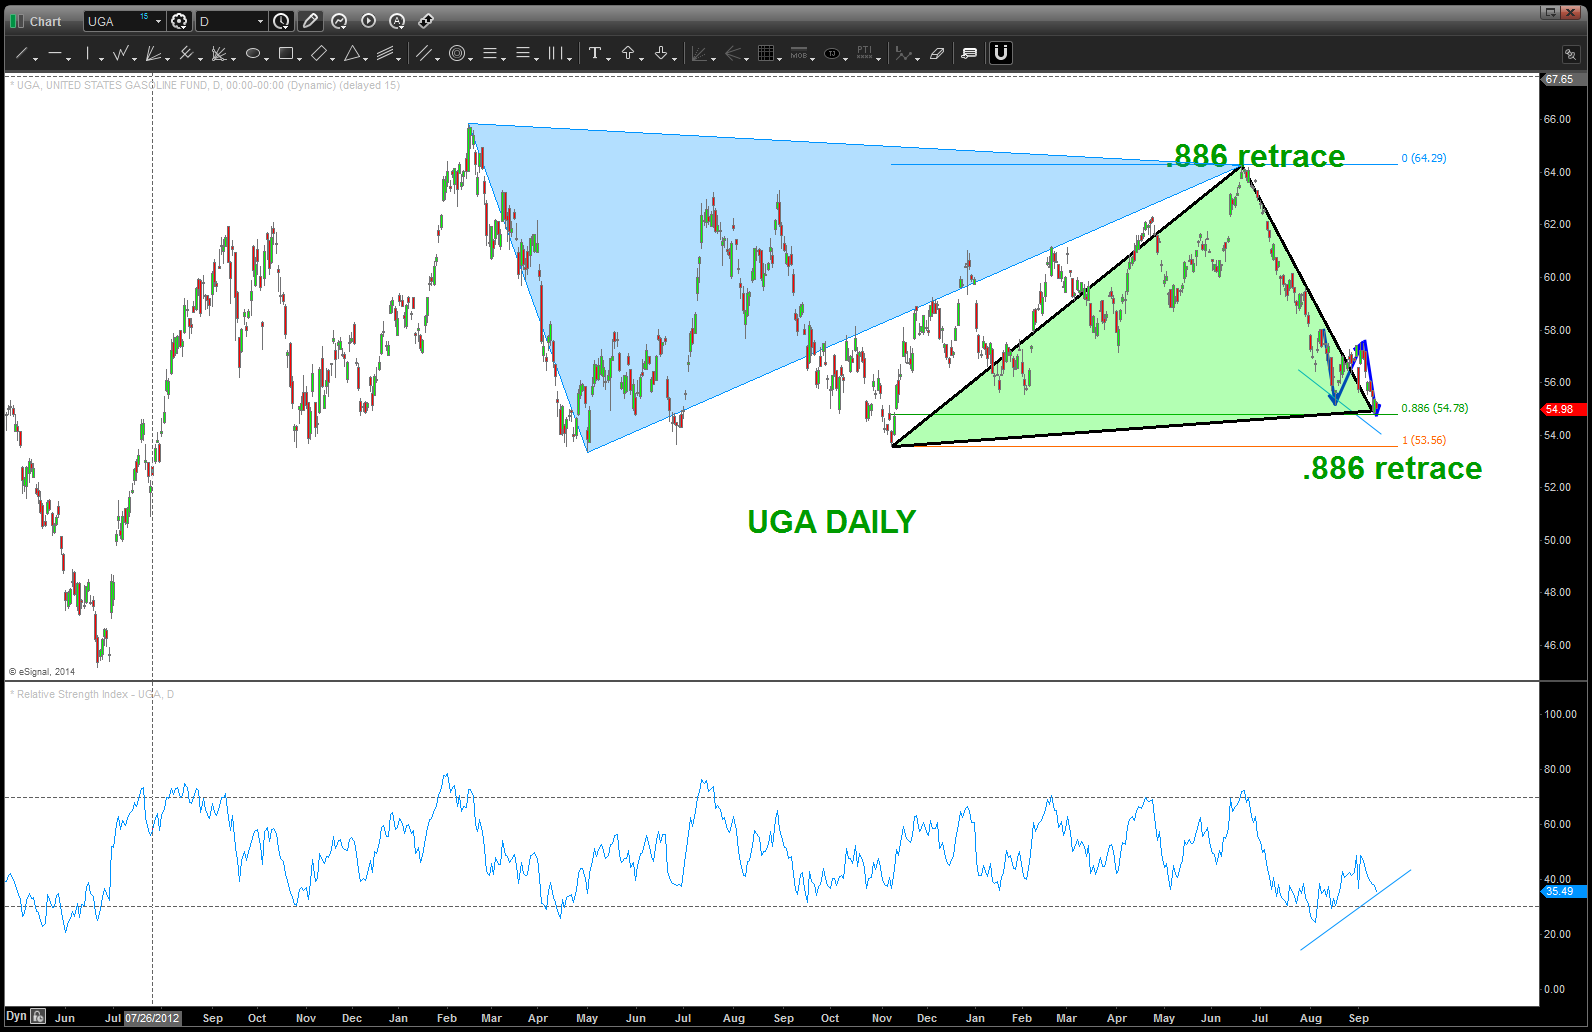
UGA DAILY
there you have it … a red box of risk. take it or not ….but either way, as soon as you enter the market, everything is going to change because every market moment is unique.
rock on, ok?
have a good weekend …
PS — this could be totally wrong and, well, that’s OK w/ me because we have defined the risk. Do you think this aircrew expected to be flying along, hanging out and have his WSO eject and leave him w/out a canopy? Probably not … 🙂

buy me a martini and I’ll tell you the story on this one …
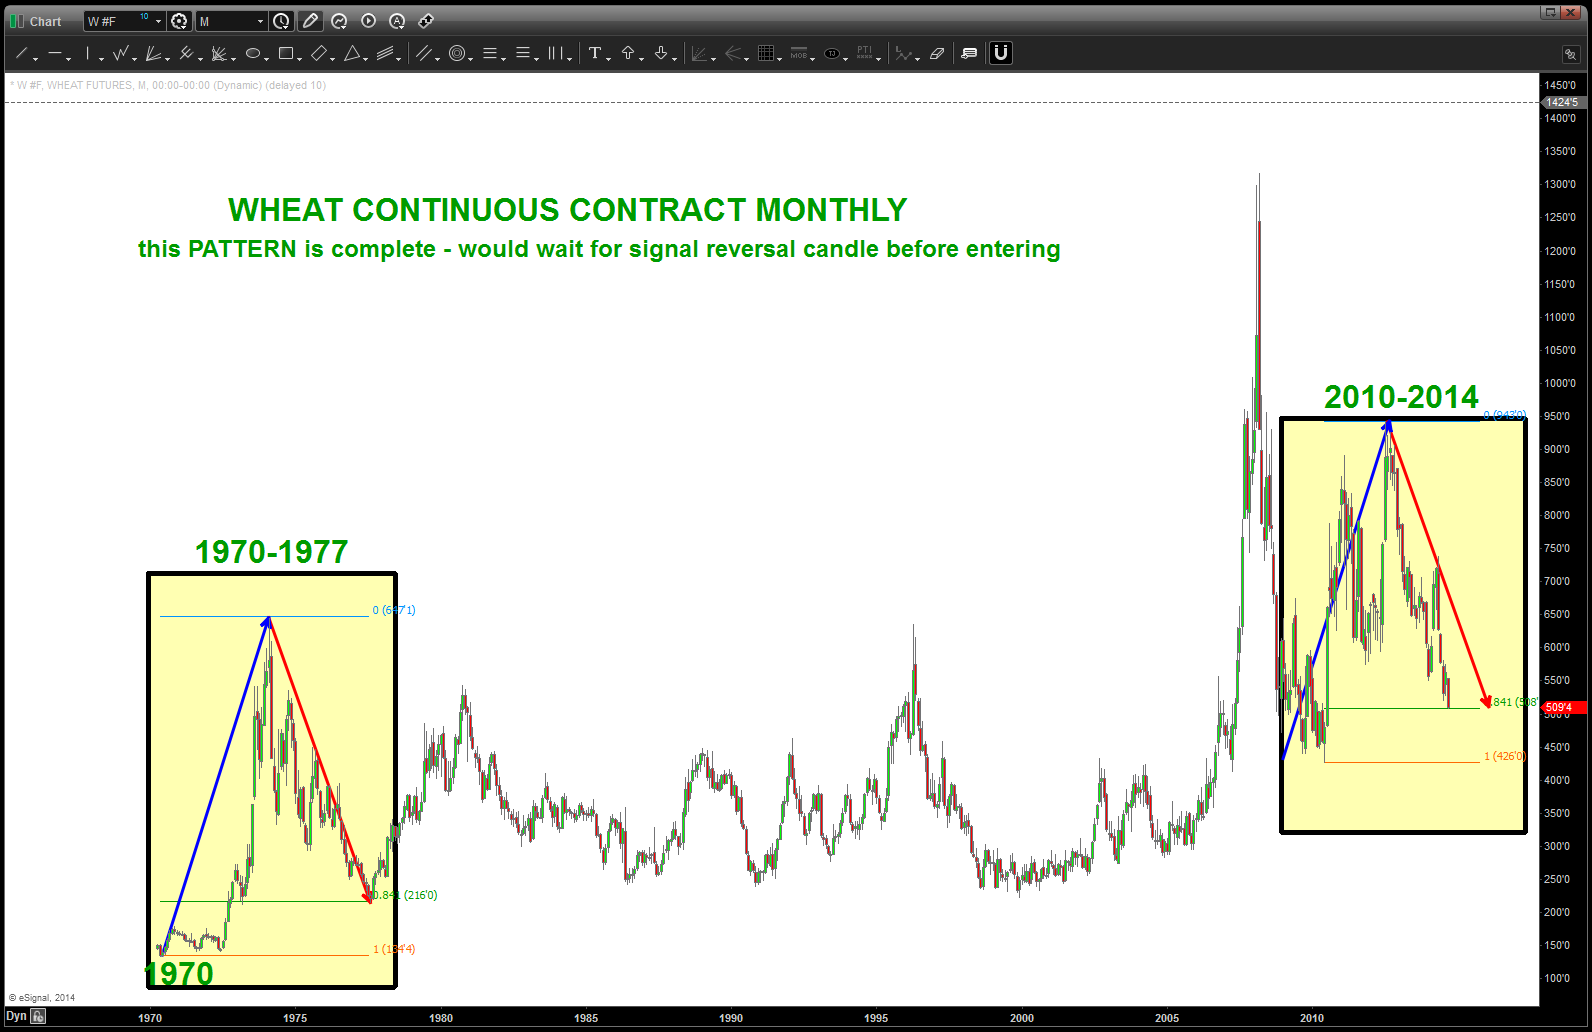
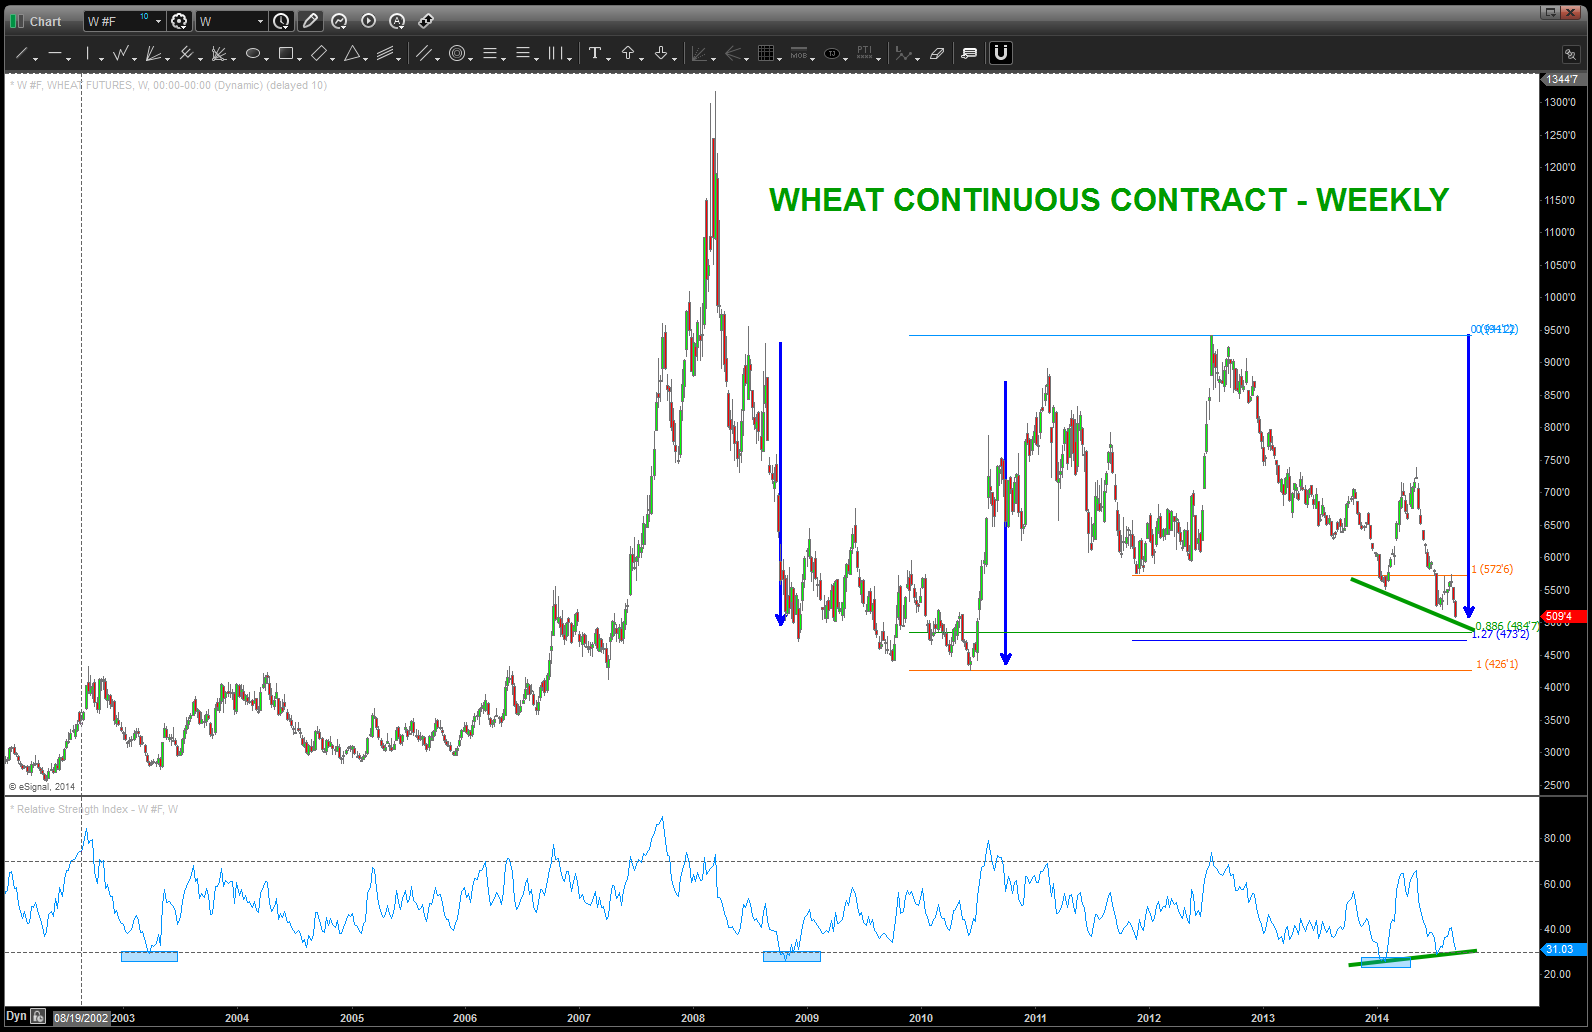
Wheat – pattern from the 1970’s complete
Posted on September 12, 2014 Leave a Comment
CLIFF NOTES: charts below show the SAME PRICE PATTERN from 1970 is complete … we do have some pretty BIG candles going into the level so “waiting” and letting the market prove it is advised. That being said – we have bullish divergence on a weekly basis and we have a PATTERN complete so put on your radar screen. If we go thru 473’2 then believe this PATTERN is toast.
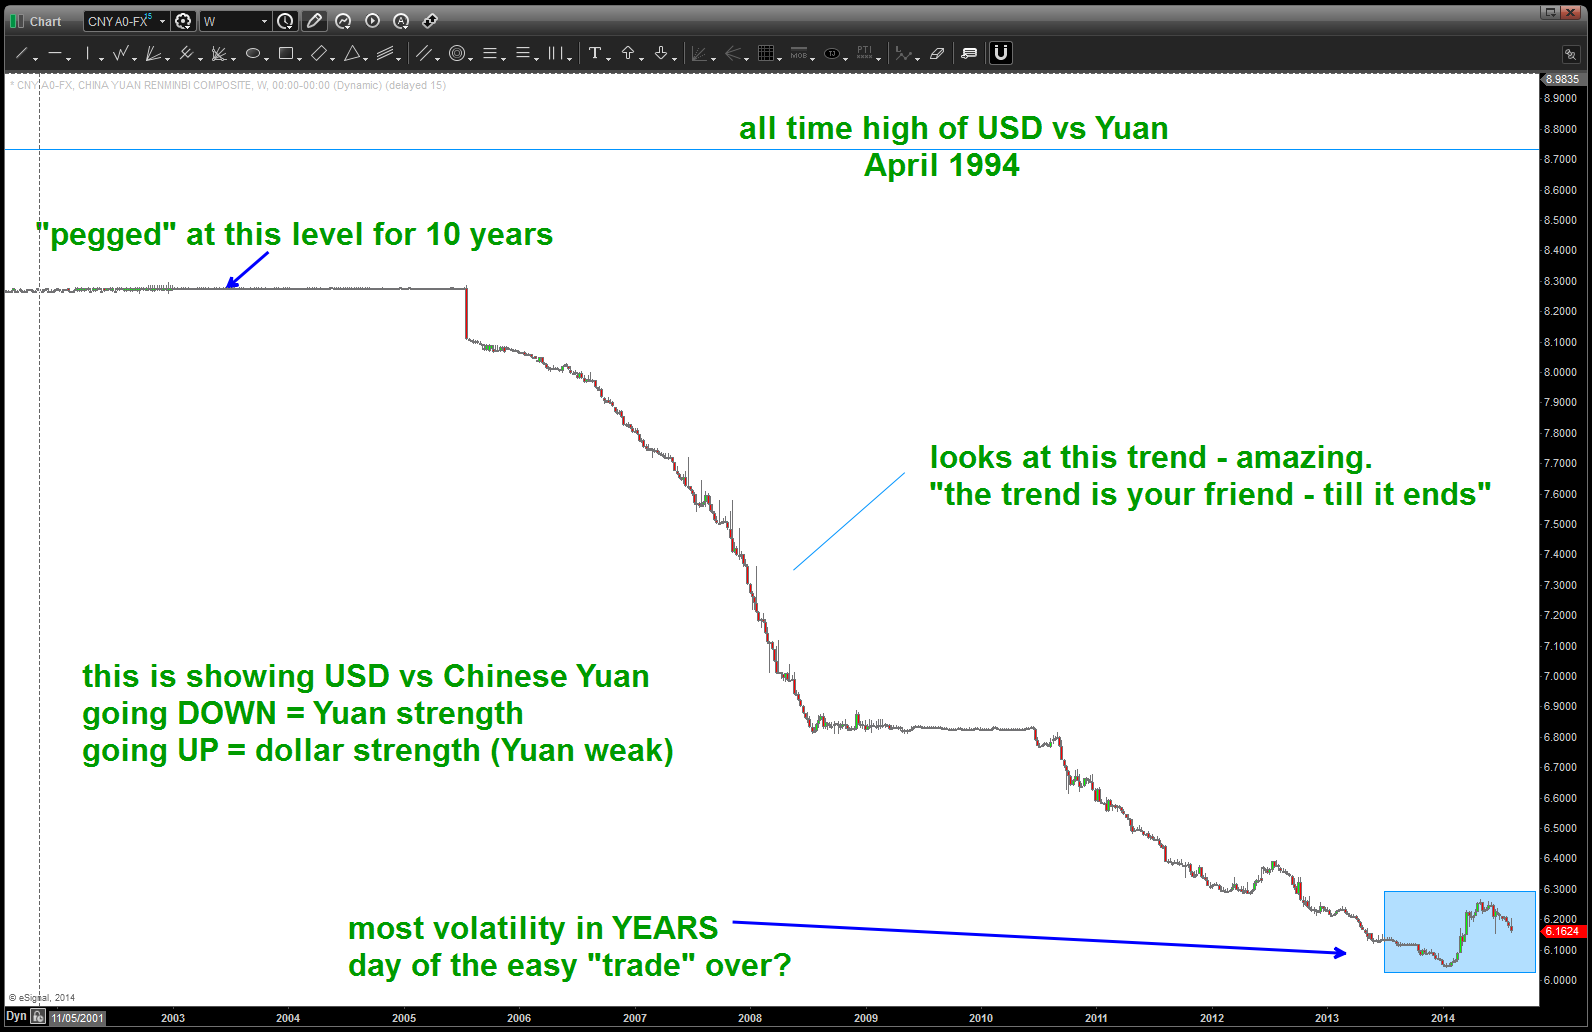
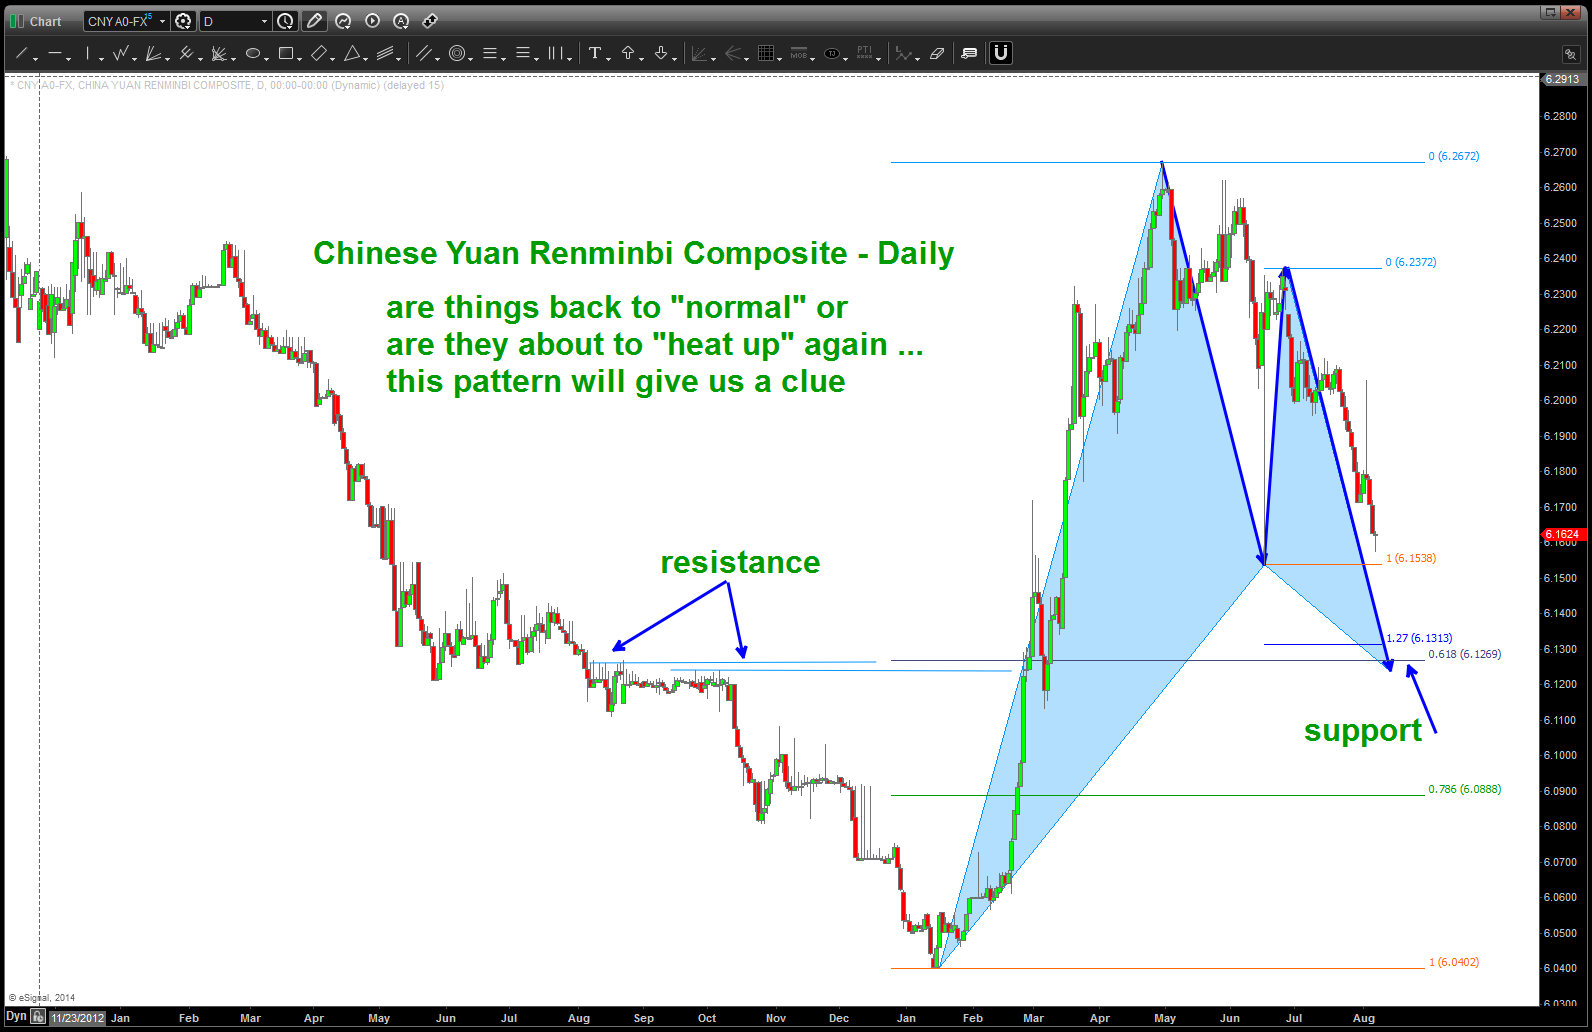
Chinese Yuan Pattern complete ….
Posted on September 11, 2014 Leave a Comment
09/11/2014: for all intensive purposes this BUY USD vs CHINESE YUAN pattern is complete … WATCH this closely as we continue to monitor the GLOBAL flow of funds. I’m not a fundamentalist (I have nothing against it, I’m just not smart enough to understand it – remember – I draw pictures w/ crayons) but I am aware that 100’s of BILLIONS of dollars are closely aligned to the “EASY” (my emphasis) LONG Chinese vs USD and if we get another UP move (YUAN weakness) there could be nice little unwind ….
for now, all appears quiet on the Chinese front but don’t discount this patterns, as the YUAN could weaken big time and in the global flow of funds that is a big deal.

PATTERN COMPLETE – BUY USD vs CHINESE YUAN
09/08/2014 – let’s not forget this looming shot across the bow. It’s close/at our BUY level so watch this Currency Pair closely. The “trend” is DOWN so expect the levels shown to fail but if they don’t …that could be a “big deal.”

Chinese Yuan at/approaching key levels
For years institutions have “bet” on the continued strength of the Yuan as a “safe bet.”
That might have all changed around mid January of this year … from Jan-March the Yuan weakened appreciably.
To quote one news article – “this move is particularly notable, as the yuan has broken through the 6.20 yuan per dollar mark. At that point, some investments that bet on a strengthening yuan should start to incur “sizeable losses,” (my emphasis added) according to foreign exchange strategists from Bank of America Merrill Lynch.”
Folks, the pattern shown below is a BUY pattern which, if correct, will lead to another move HIGHER – weak Yuan vs the USD. Right now, as we move down from the notable move UP perhaps all seems OK. Put this into the context of the recent sell-off in the equity markets — I’m guessing here, but I bet it’s “safe” to assume 100’s of billions of dollars are tied up in some exotic way for the institutions to grab any yield out there w/ regards to the “safe bet” on the Chinese Yuan. If this thing starts going back up again then my hypothesis (only a thought) is the “institutions” are going to try and unwind these positions – maybe in a hurry.
There are many ways countries muscle their weight around … cyber, traditional weapons, deterrence, etc. In the end, these are usually reactions to the global flow of funds. The next move by the Chinese will be extremely interesting (folks, they control (manipulate) the currency level – it’s not a true float) on the global scale.
If you don’t think it’s true then just think of the masterful move by Mr. Putin. Right before an invasion of Ukraine (maybe) the Russians sign an order to BUY BILLIONS of dollars of planes from Boeing. Now isn’t that interesting …. (http://www.reuters.com/article/2014/08/06/ukraine-crisis-russia-airlines-idUSL6N0QC3JK20140806 )And, why they are at it, let’s give Snowden another 3 years in our country. CHECKMATE … China, your next move please?
WATCH CLOSELY ….
B
on pressure from the US (and others) the YUAN has steadily strengthened for years … is that over?
BUY pattern appearing on the Chinese Yuan vs USD (if holds = YUAN weak)
Interest Rates – Patterns suggest higher
Posted on September 11, 2014 Leave a Comment
Here’s my latest post for @seeitmarket on Interest Rates :
