JPM updated w/ a SELL pattern complete
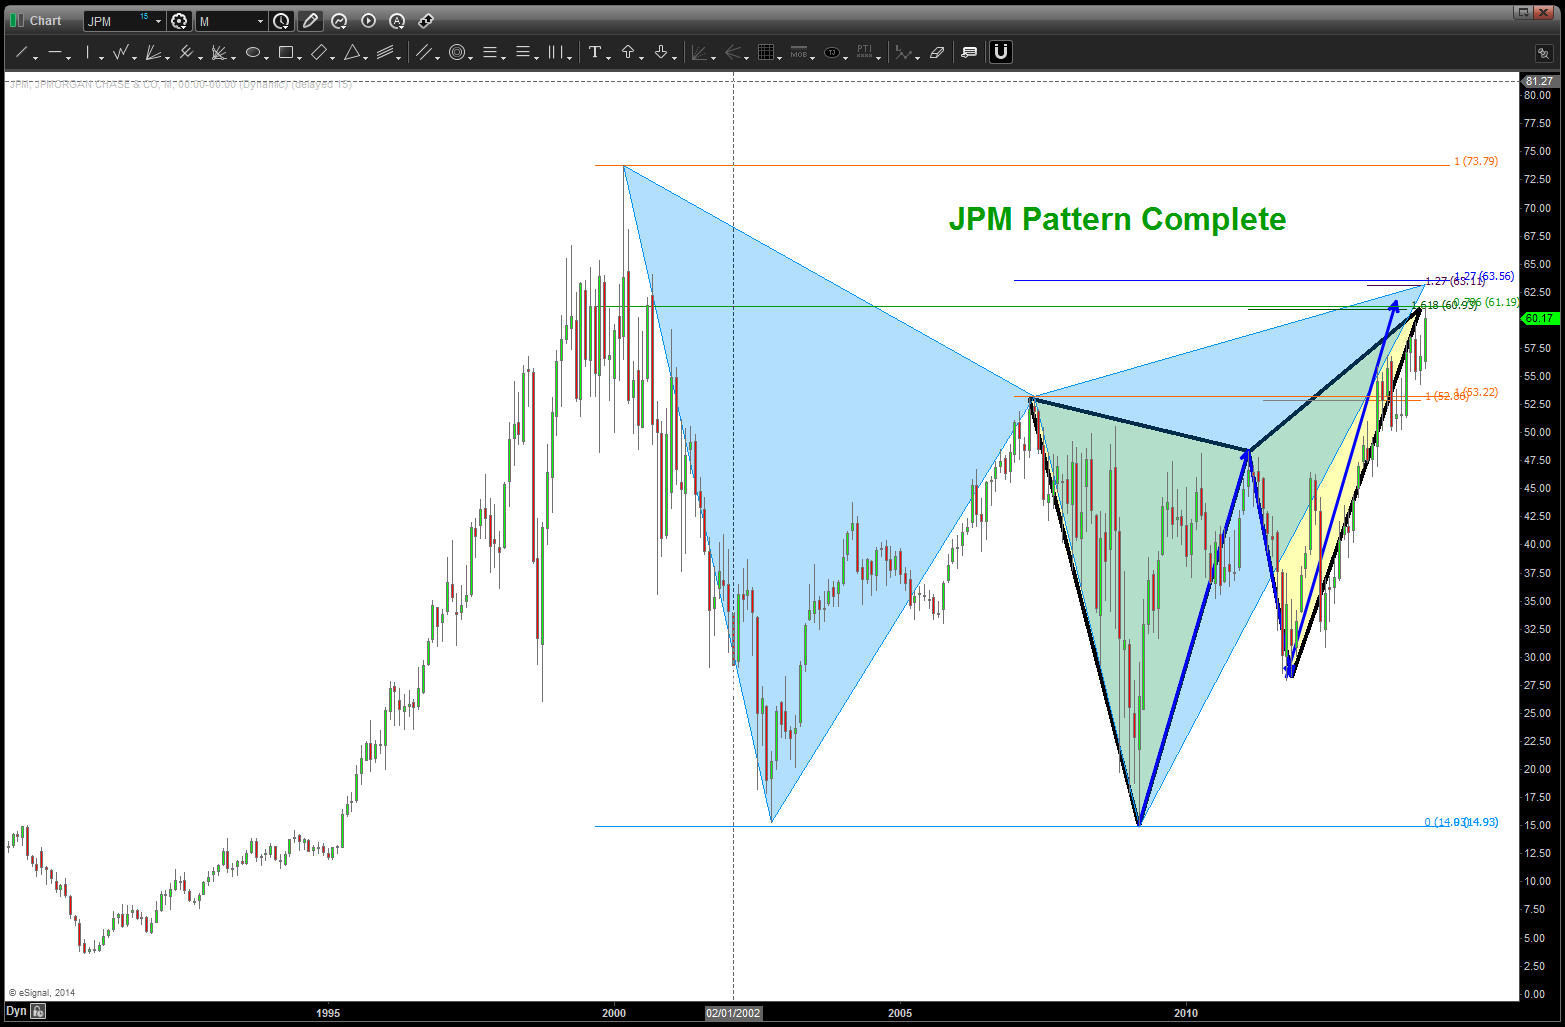
August 29 2014: when we use PATTERNS on weekly and monthly charts PATIENTS is a must. If you take a look at the thread below, the JPM PATTERN was identified back in November 20013 and then didn’t hit for 4 months. It hit, perfectly, and fell roughly 20 percent. The rally has been roughly 203 months and now we have hit a KEY area for this to be ready for the next move down. Last, remember, 64 is still a longer term target so this PATTERN could fail and attack that number. Either way, we have a Gartley (blue shaded area) and a three drives (black w/ green shaded triangles) after a MONTHLY Gartley and Butterfly Pattern .. probability is this level holds. We don’t know, we know we have a PATTERN and leave it at that.
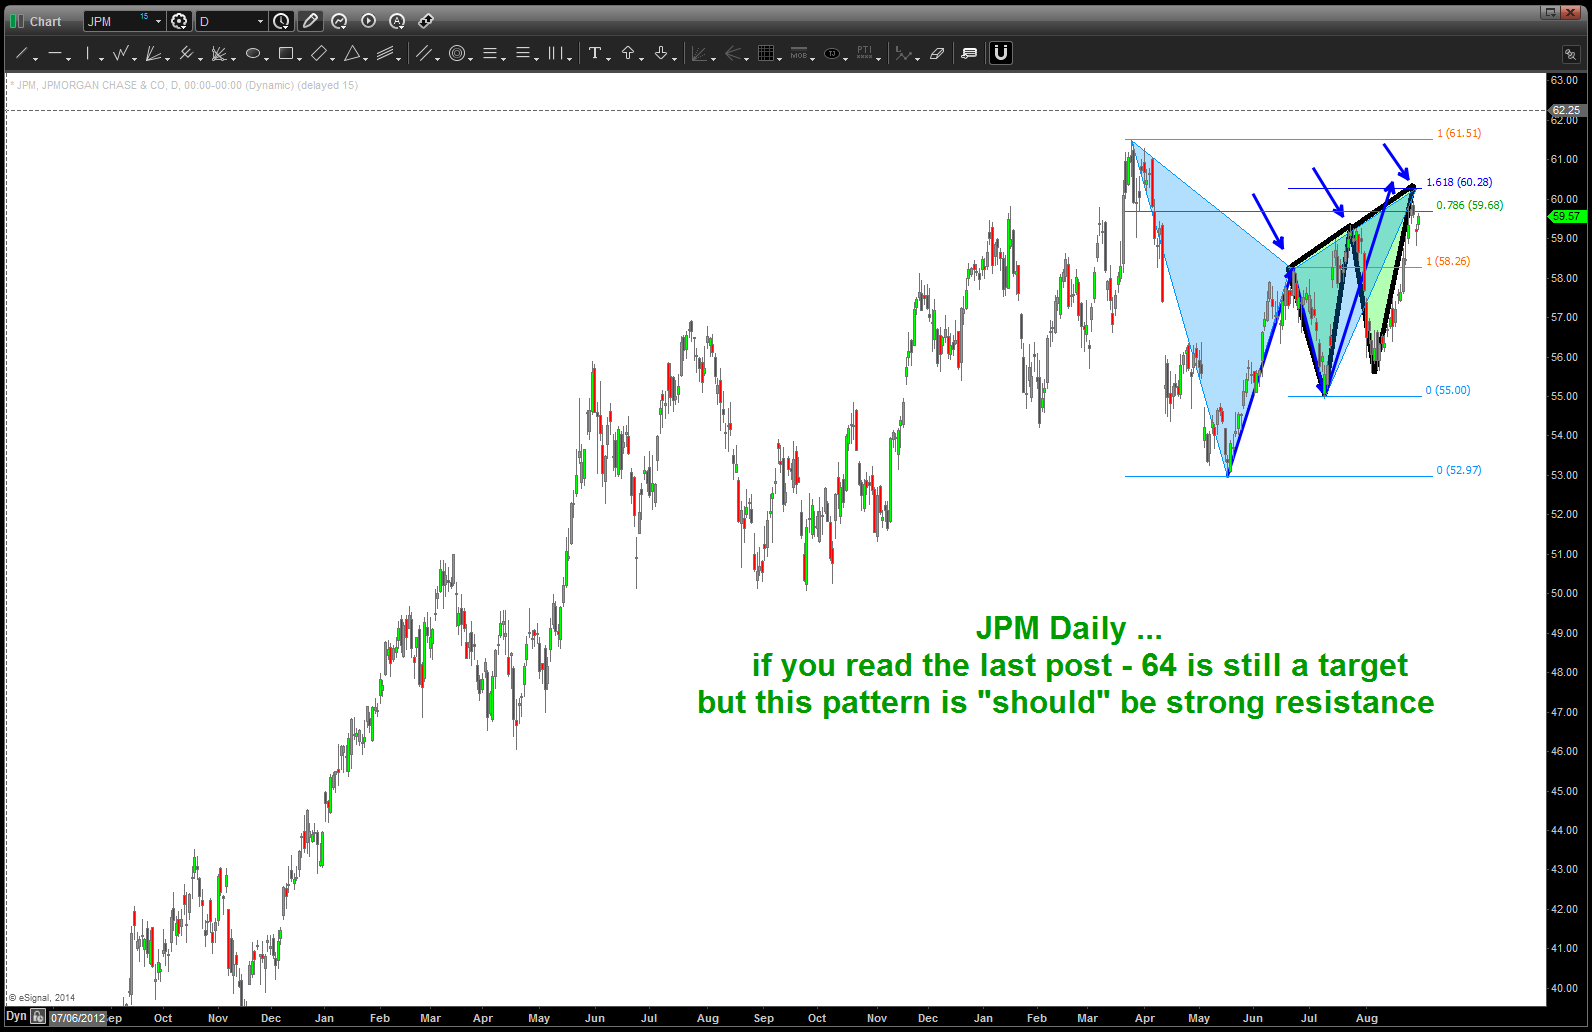
JPM Daily
March 23 2014: in November 2013 we targeted this area as a SELL pattern:
much like the movie Inception w/ the dream w/in a dream w/in a dream concept we also like PATTERNS to behave in the same manner. a pattern w/in a pattern w/in a pattern. all this does is increase the probability of a pattern working. does not guarantee it will work but does tip probability in our favor.
w/ JPM we have the following:
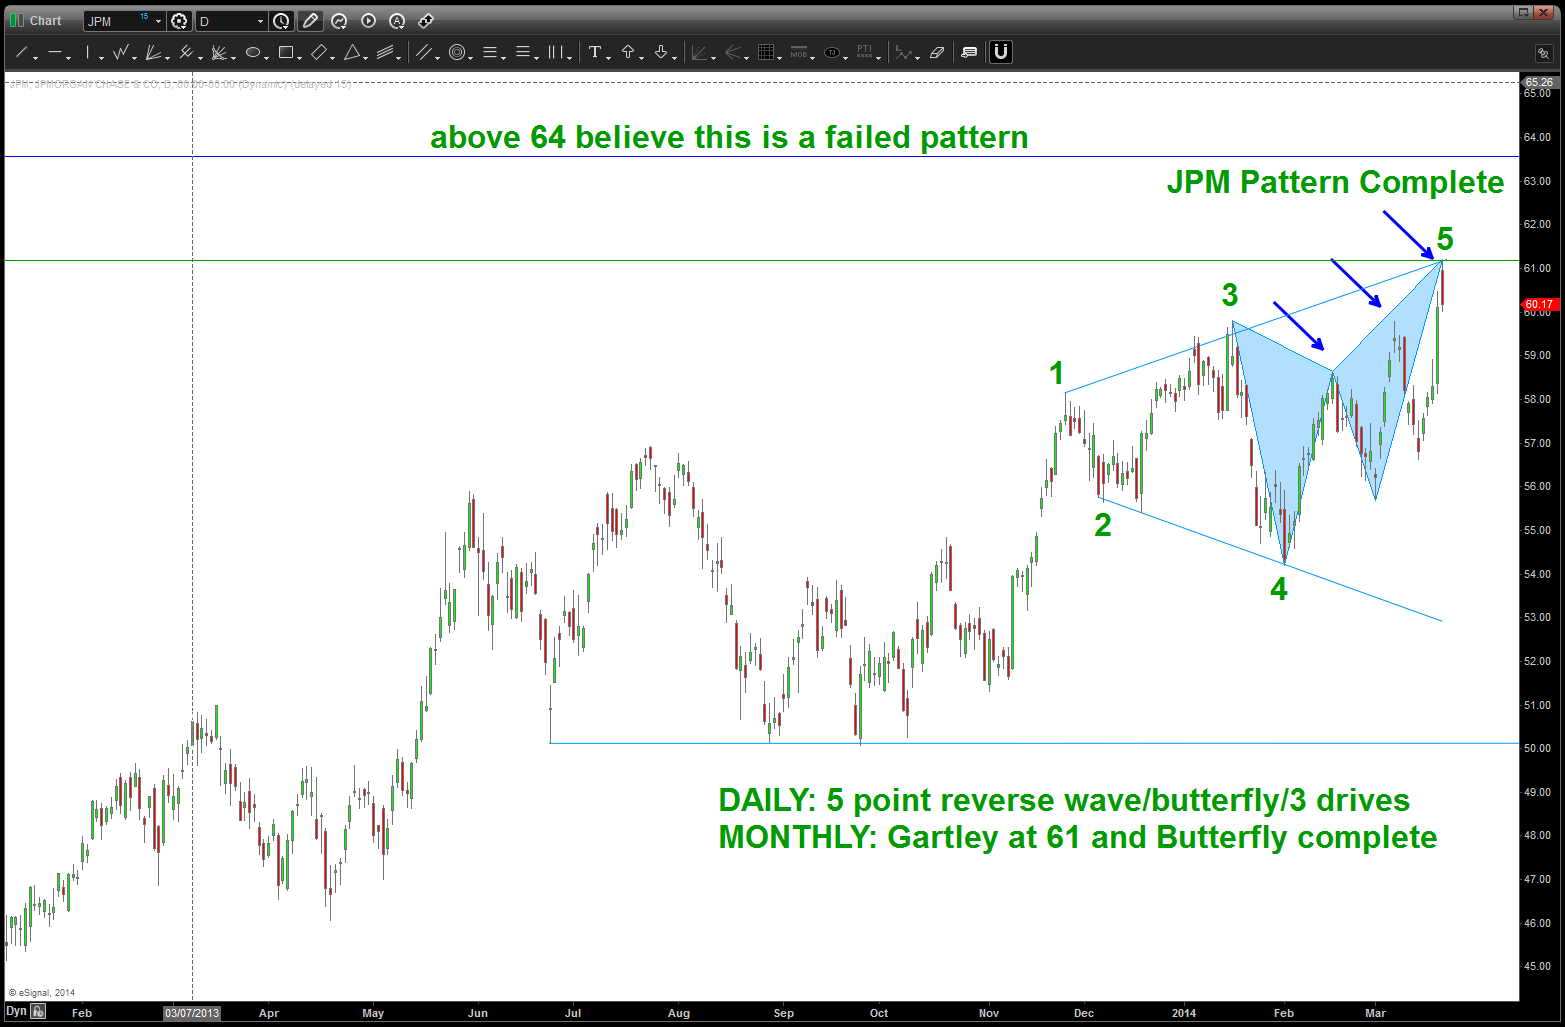
- Monthly Gartley Pattern w/ a Buttefly pattern inside of it.
- Daily 5 point reverse wave w/ a butterfly inside of it and inside of that butterfly is a 3 drives.
Folks, only probability but this pattern is complete. If we get a daily open/close above 64 I would assume this pattern had failed.