JPM updated w/ a SELL pattern complete
Posted on August 29, 2014 Leave a Comment
August 29 2014: when we use PATTERNS on weekly and monthly charts PATIENTS is a must. If you take a look at the thread below, the JPM PATTERN was identified back in November 20013 and then didn’t hit for 4 months. It hit, perfectly, and fell roughly 20 percent. The rally has been roughly 203 months and now we have hit a KEY area for this to be ready for the next move down. Last, remember, 64 is still a longer term target so this PATTERN could fail and attack that number. Either way, we have a Gartley (blue shaded area) and a three drives (black w/ green shaded triangles) after a MONTHLY Gartley and Butterfly Pattern .. probability is this level holds. We don’t know, we know we have a PATTERN and leave it at that.
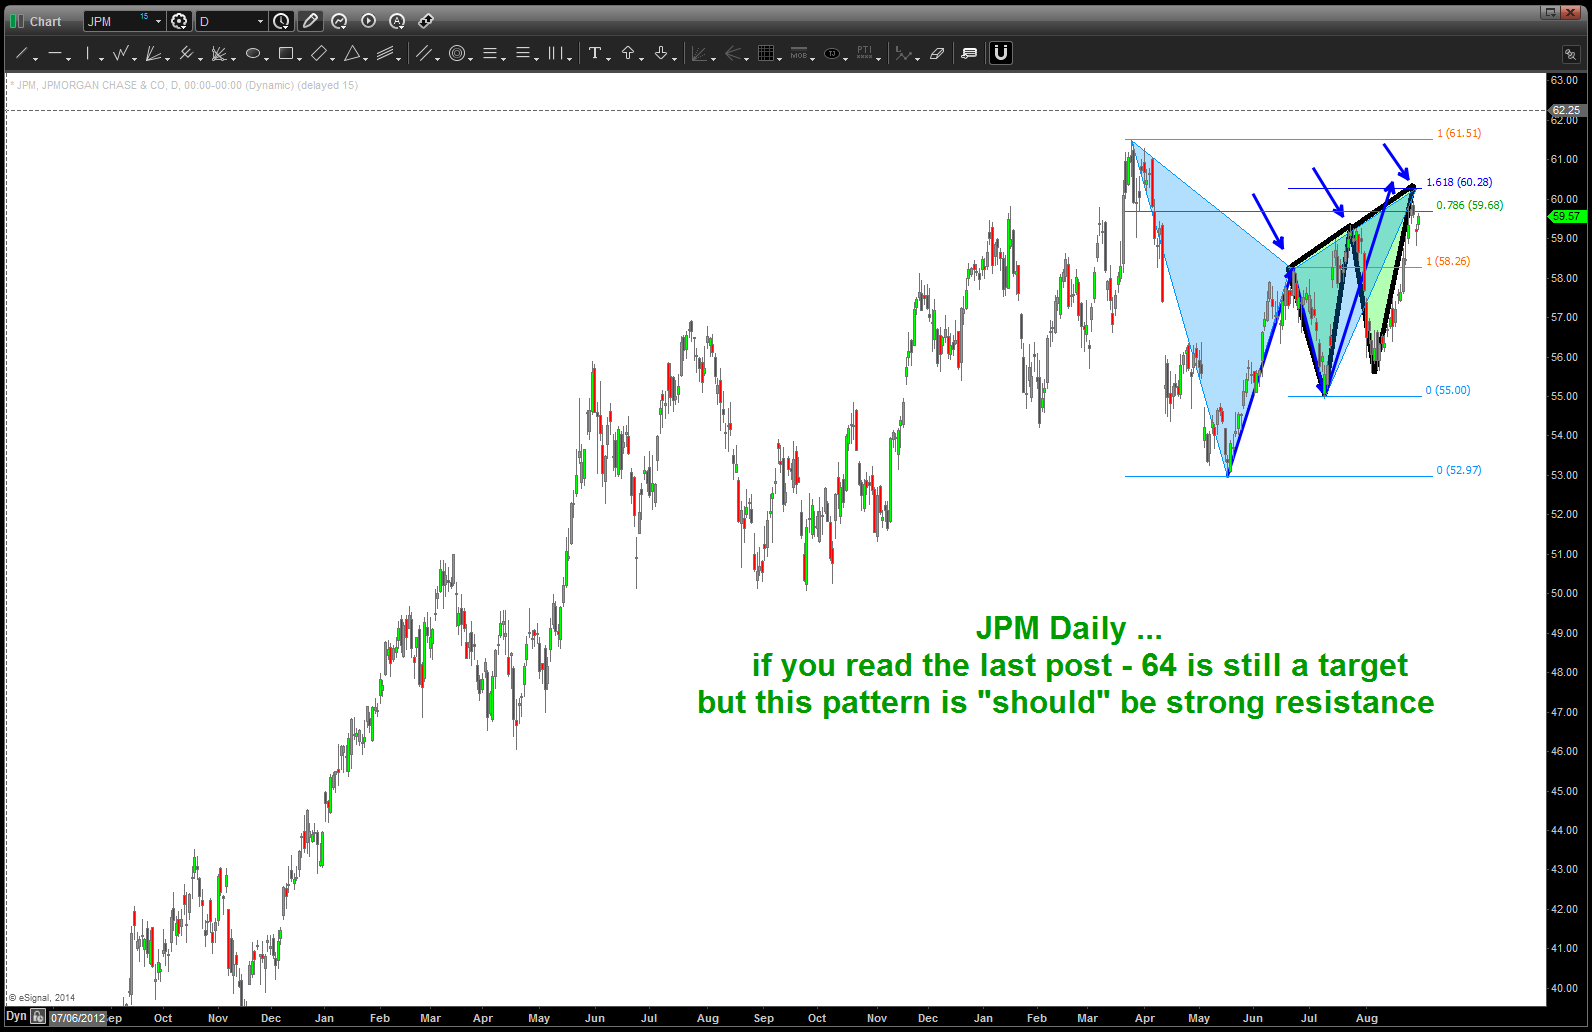
JPM Daily
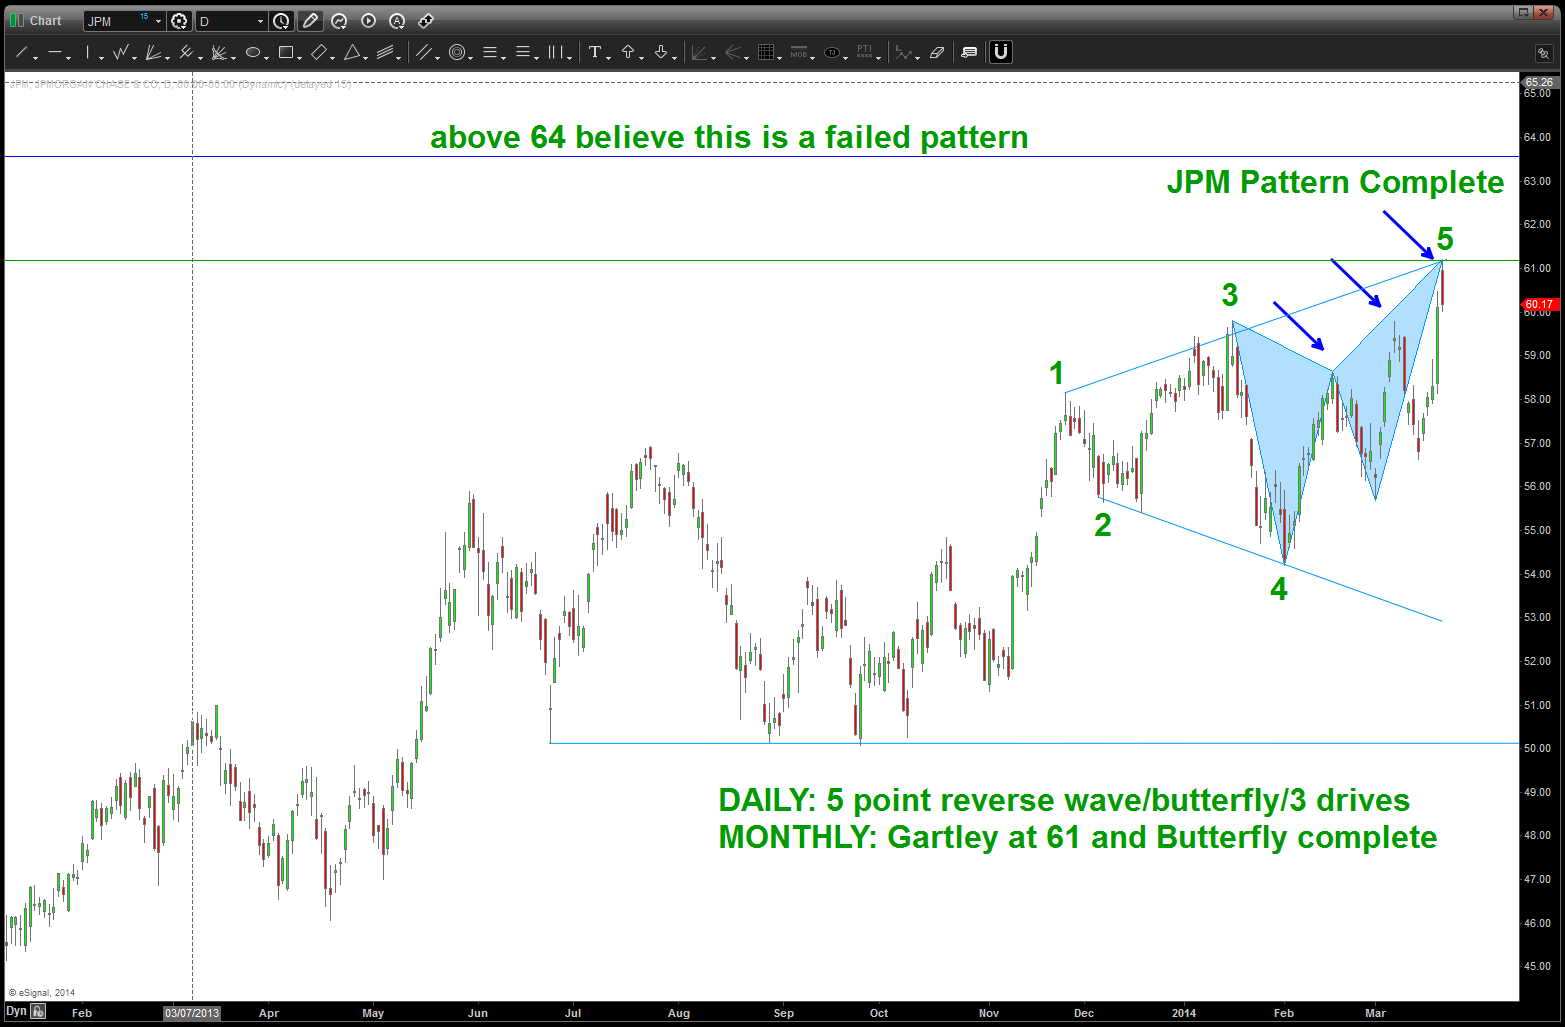
March 23 2014: in November 2013 we targeted this area as a SELL pattern:
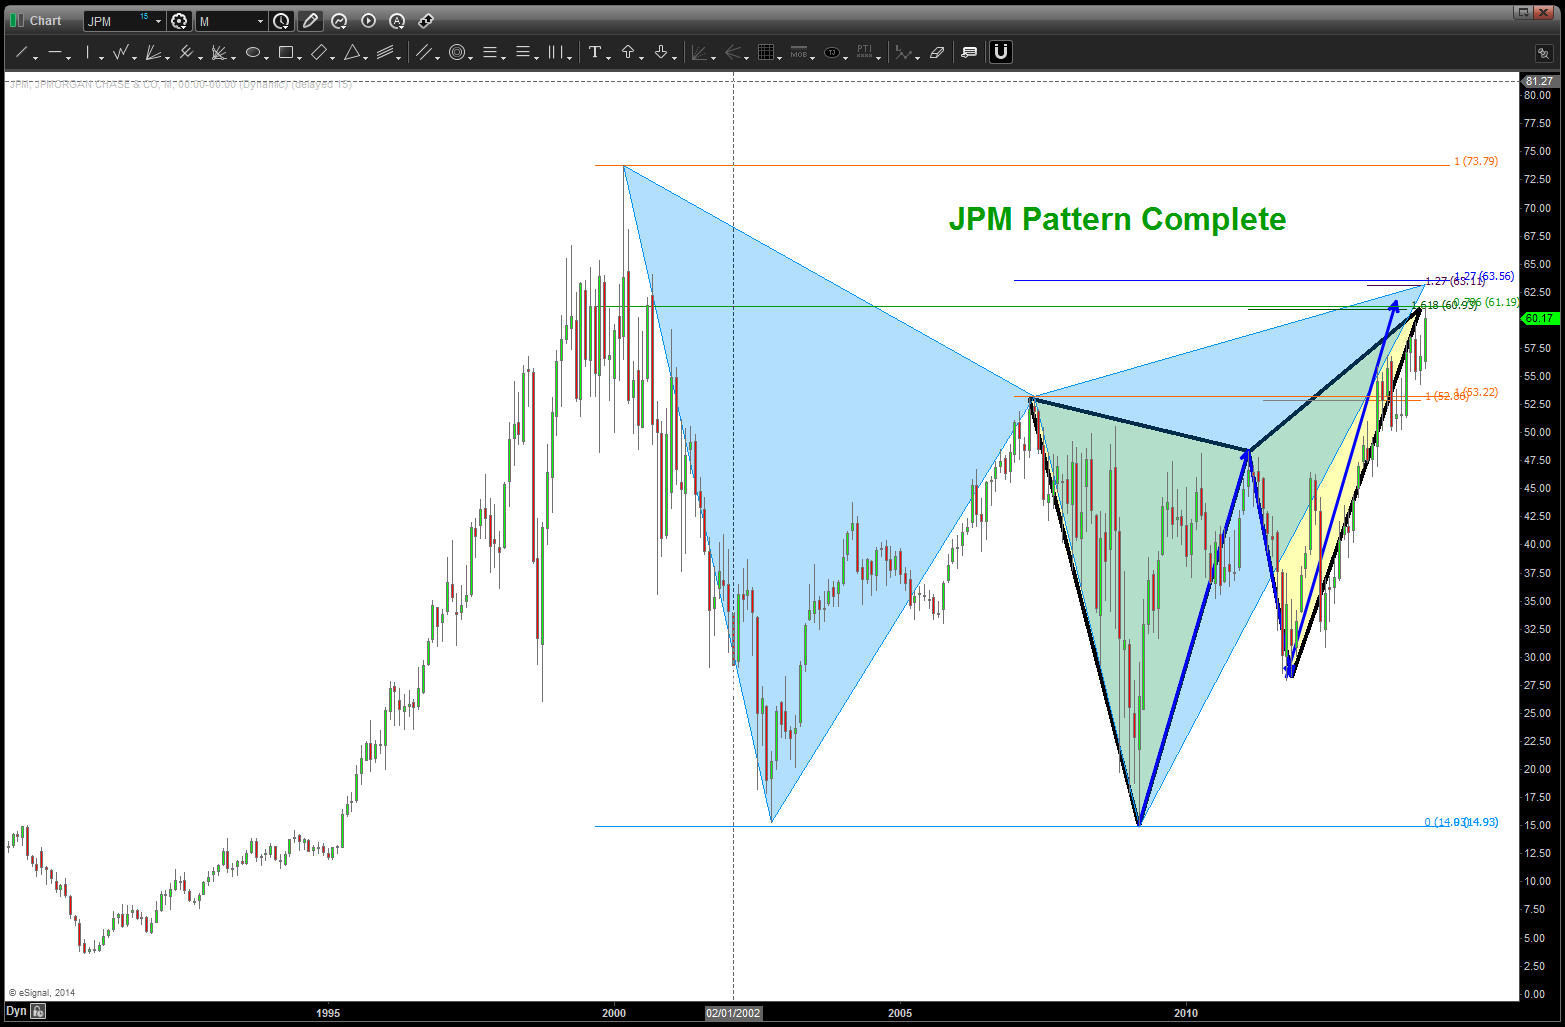
much like the movie Inception w/ the dream w/in a dream w/in a dream concept we also like PATTERNS to behave in the same manner. a pattern w/in a pattern w/in a pattern. all this does is increase the probability of a pattern working. does not guarantee it will work but does tip probability in our favor.
w/ JPM we have the following:
- Monthly Gartley Pattern w/ a Buttefly pattern inside of it.
- Daily 5 point reverse wave w/ a butterfly inside of it and inside of that butterfly is a 3 drives.
Folks, only probability but this pattern is complete. If we get a daily open/close above 64 I would assume this pattern had failed.
Interest rate forecast …updated
Posted on August 28, 2014 Leave a Comment
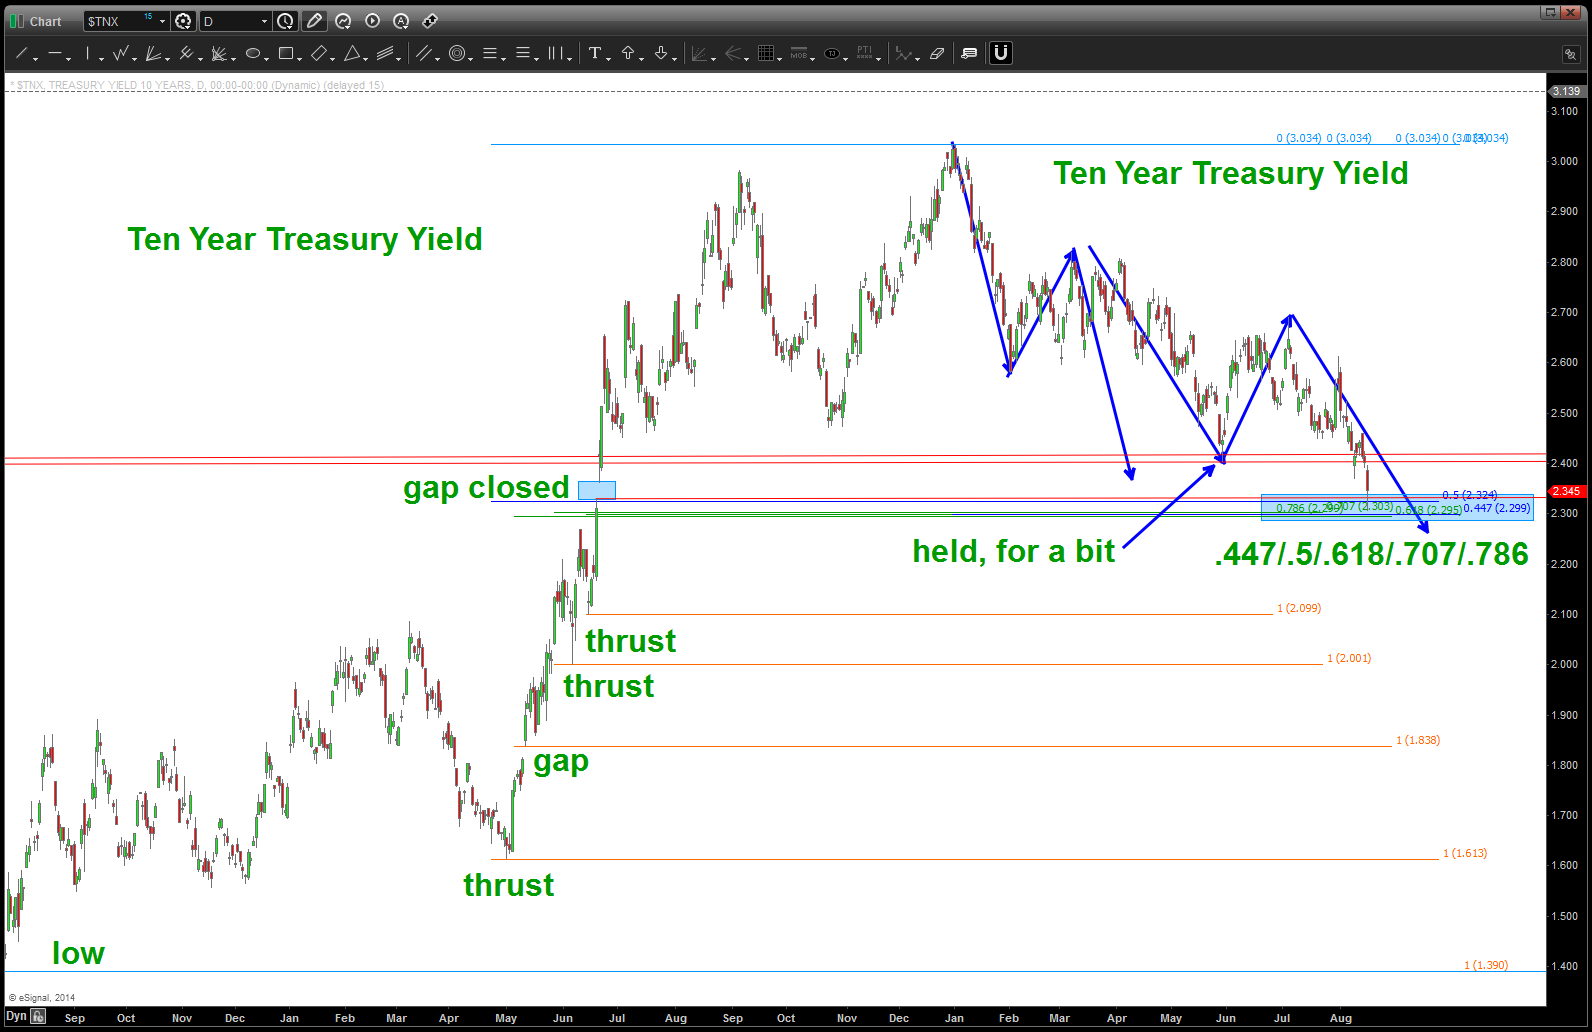
8/28/2014: the 2.358 level did not hold. In fact, in the way I look at the market, the PATTERN caused the gap. the gap below the pattern is a big deal. I’ve shown the projection/pattern that “caused” the low at 2.322. right now, looks like our low back on August 15, 2014 will be attacked.
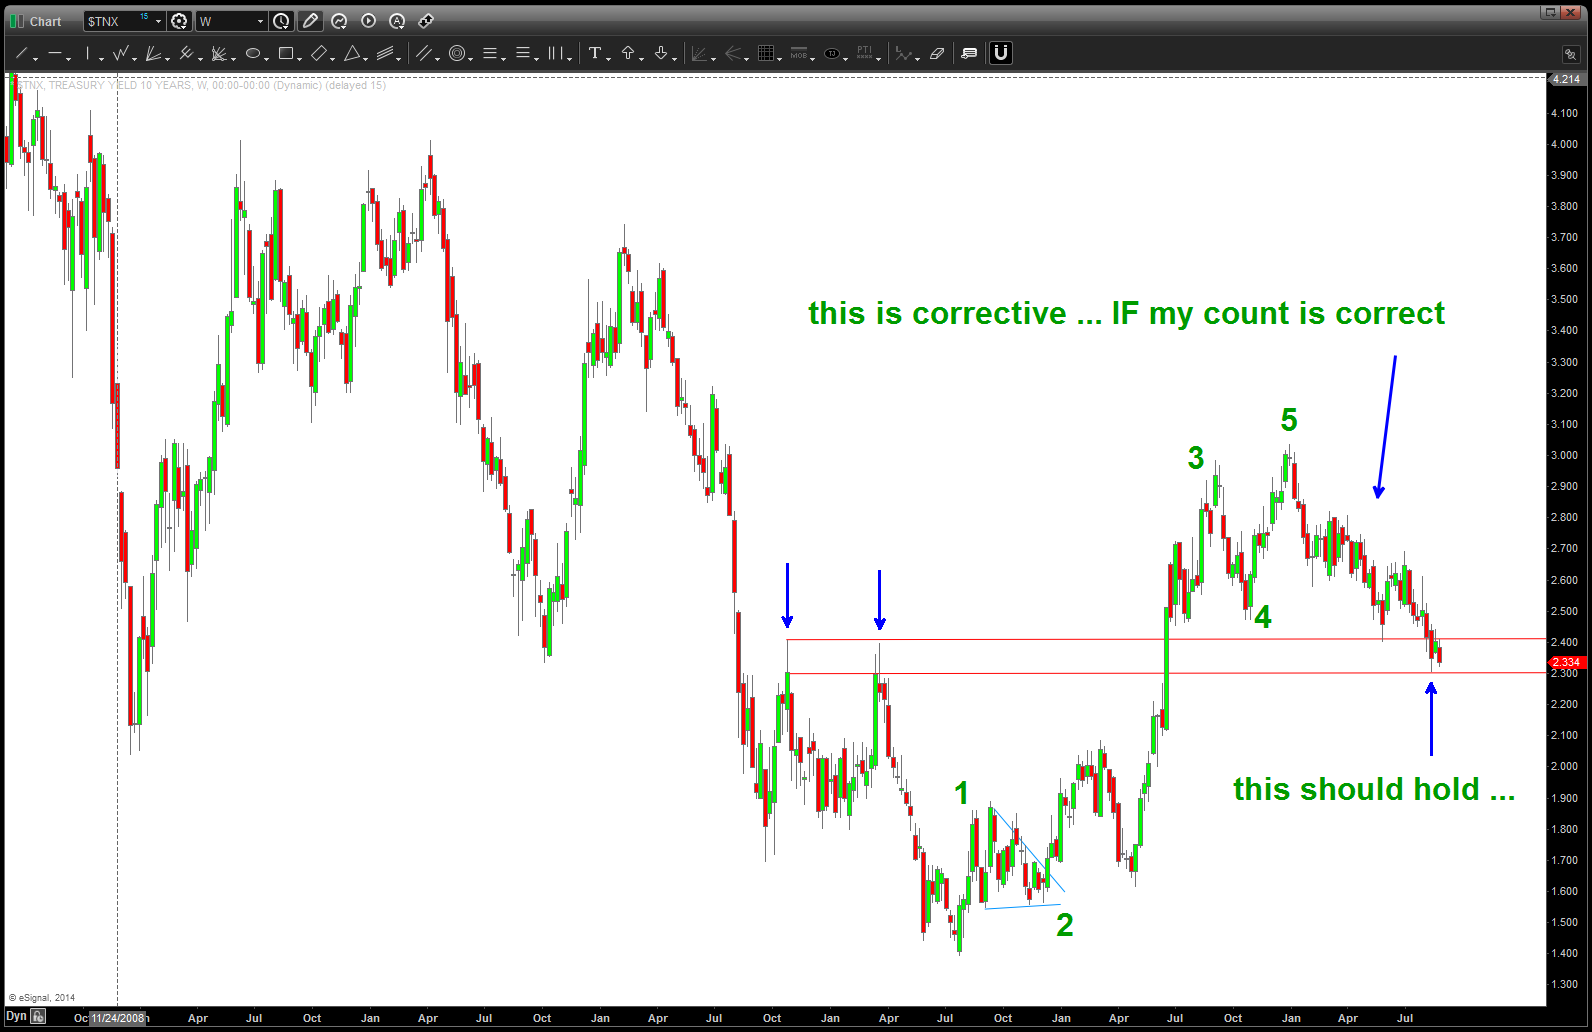
 I’m not trying to call for a increase in interest rates or a continued fall in interest rates. frankly, I don’t have clue about the fundamental aspects of what the Fed is doing or not doing. What I do know is PATTERNS and sometimes they work (which they do — alot) and sometimes they don’t. This pattern, below, clearly failed at the level we were expecting to hold. but here is the deal …on the way up w/ interest rates it was CLEARLY 5 waves up … so this means we are CORRECTING and there is, supposed (the operative word) be ANOTHER WAVE UP ….
10 year weekly
8/22/2014 – if you read below you’ll read “my bet is on the TEN YEAR holding this low and starting back up ….” If that is the case then we have a VERY NICE PATTERN appearing on the Ten Year Treasury Yield that has multiple confirmations going for it ….remember folks, this is a 5 minute chart.
also, I have “copy/pasted” the earlier this week post on Jackson Hole and the fixed income structure …
the PATTERN:
- it’s a nice corrective pattern a-b-c. expectation is that “c” is in work and “should” take yields down to 2.358.
- c = 1.618*a right at ….2.358.
- a 1.618 extension of the “b” wave takes us right to ….2.358
- a retracement from the “key” low that we have watched for a while is .618 at …. you guessed it …2.358.
when all of these numbers line up … in this case SUPPORT usually occurs.
make it a great weekend …
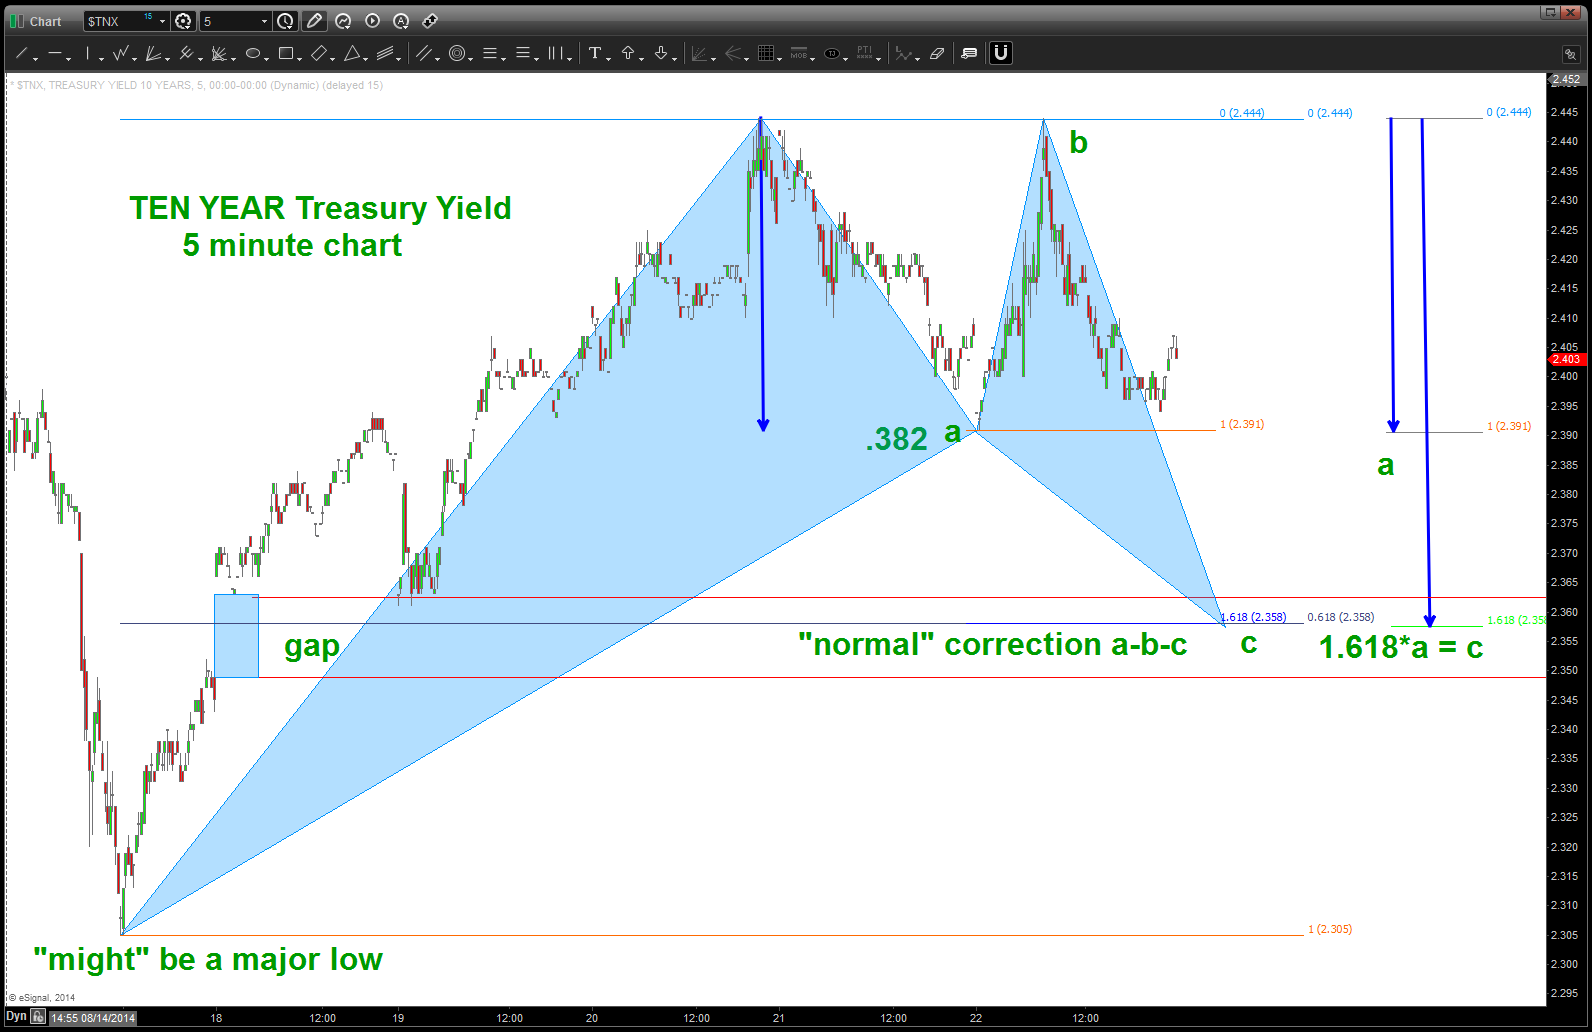
5 minute ten year rate PATTERN
one last … I have ABSOLUTELY NO IDEA what Janet Yellen and the FED did this week or what in the world was said in the meeting minutes. Frankly, I don’t care … PATTERNS, PATTERNS, PATTERNS.
CLIFF NOTES: folks, follow this link to catch up on the Fixed Income story: https://bartscharts.com//?s=fixed+income
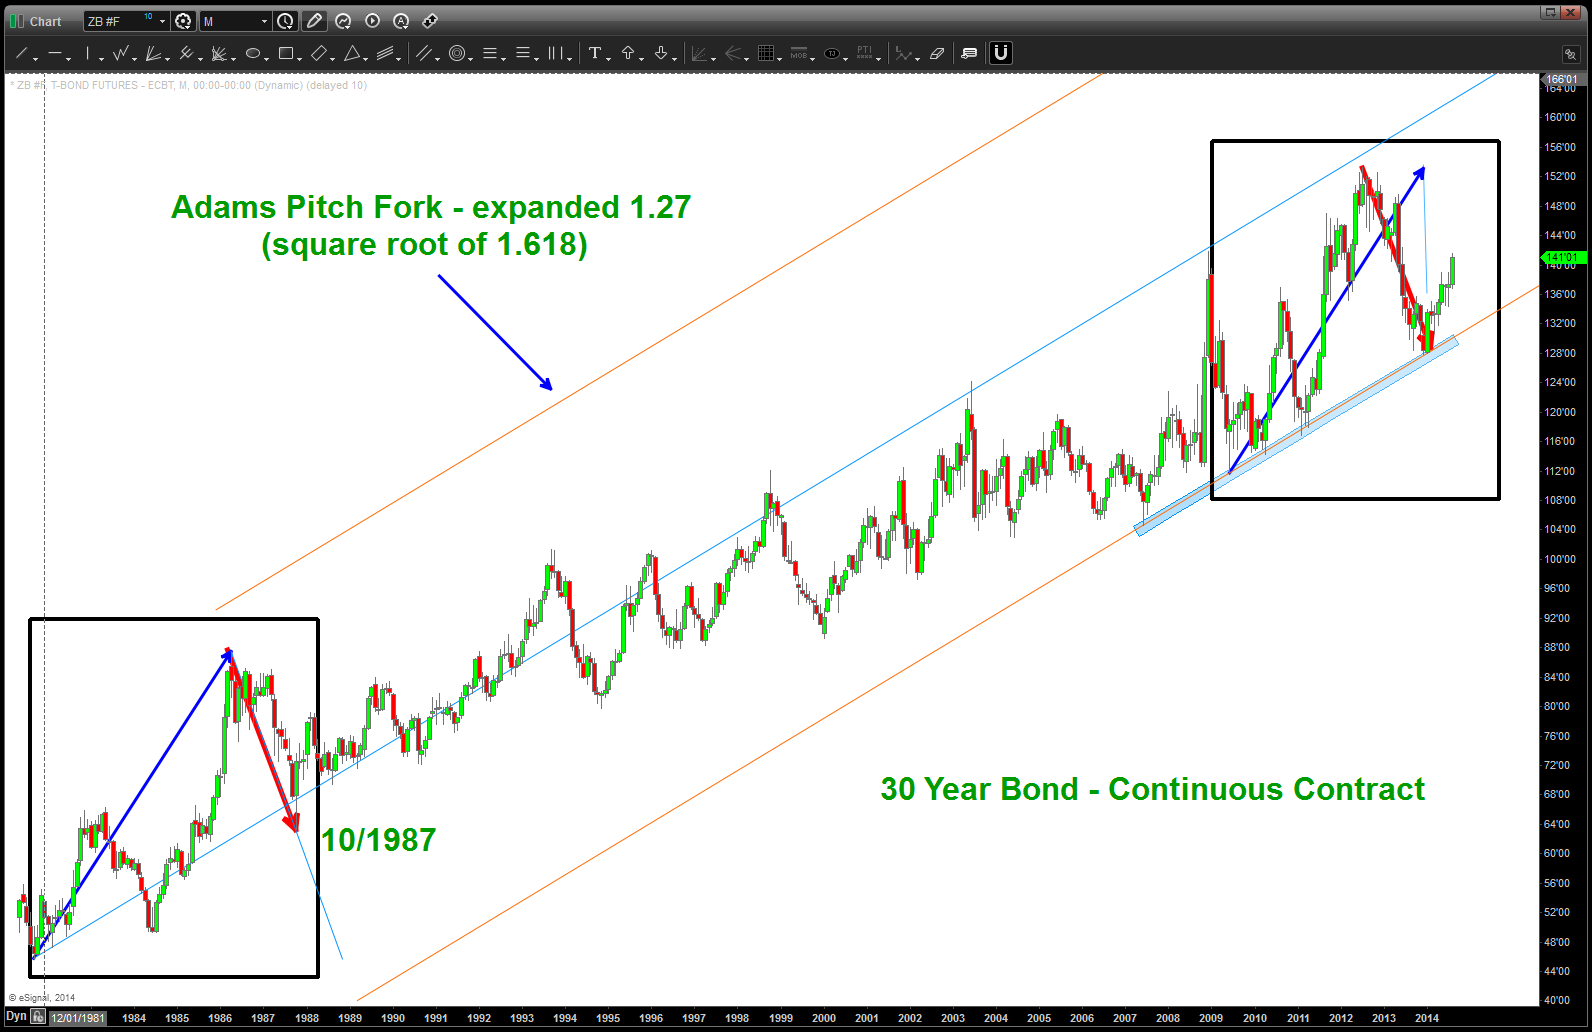
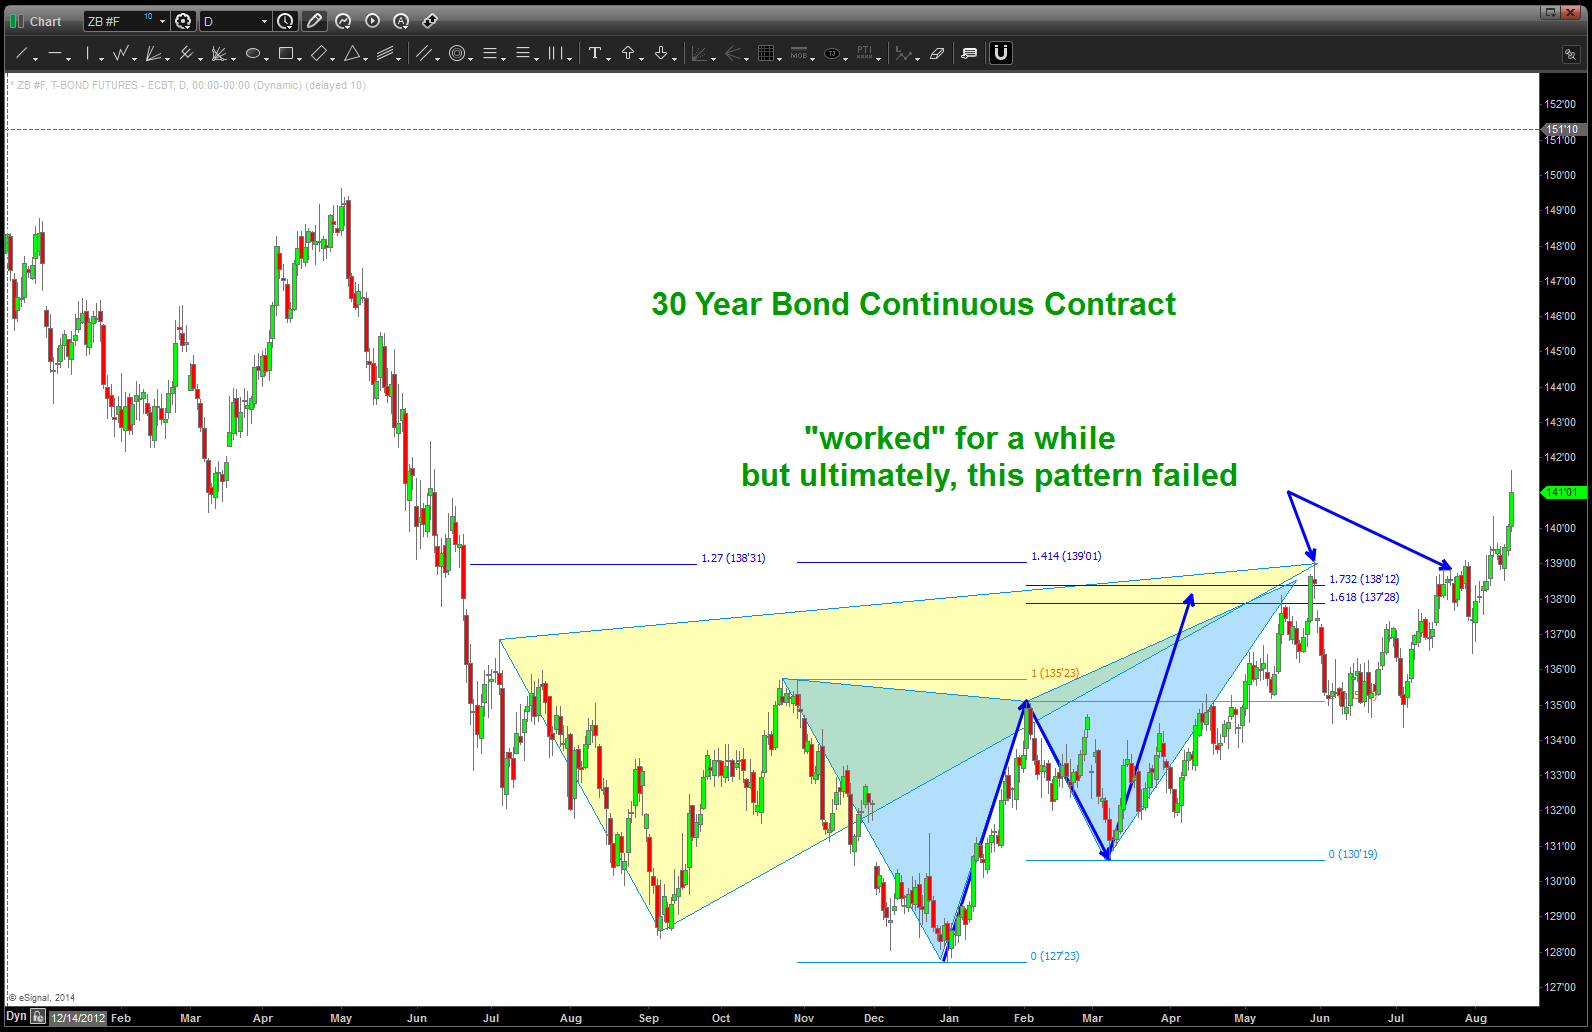
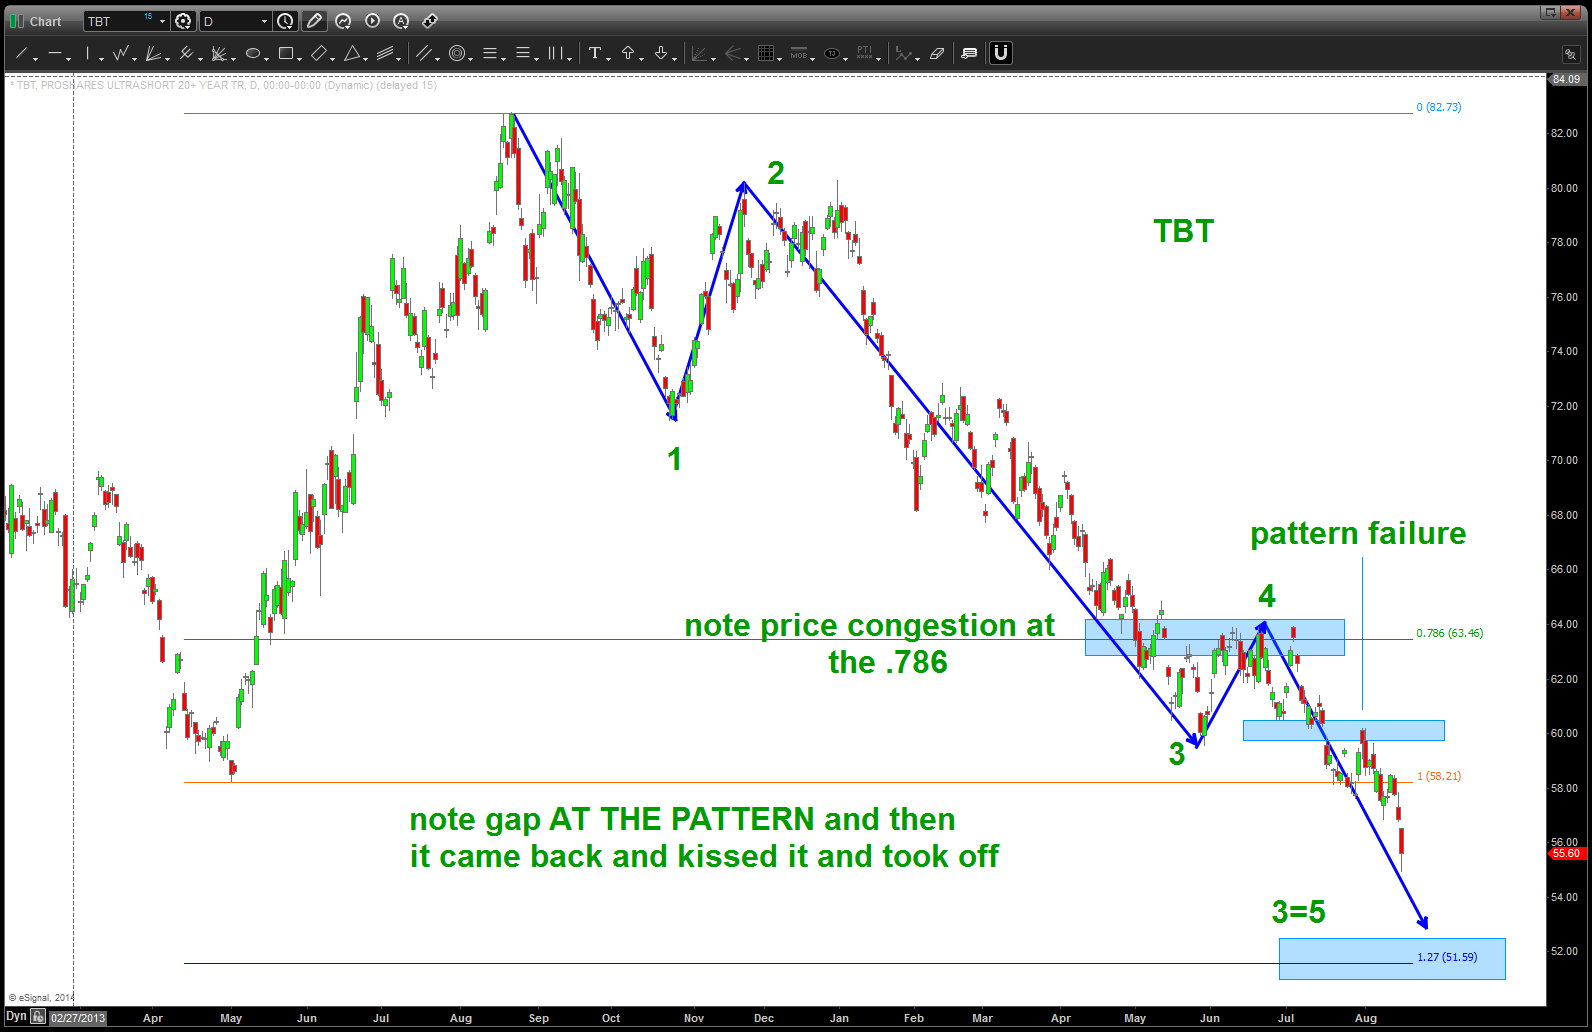
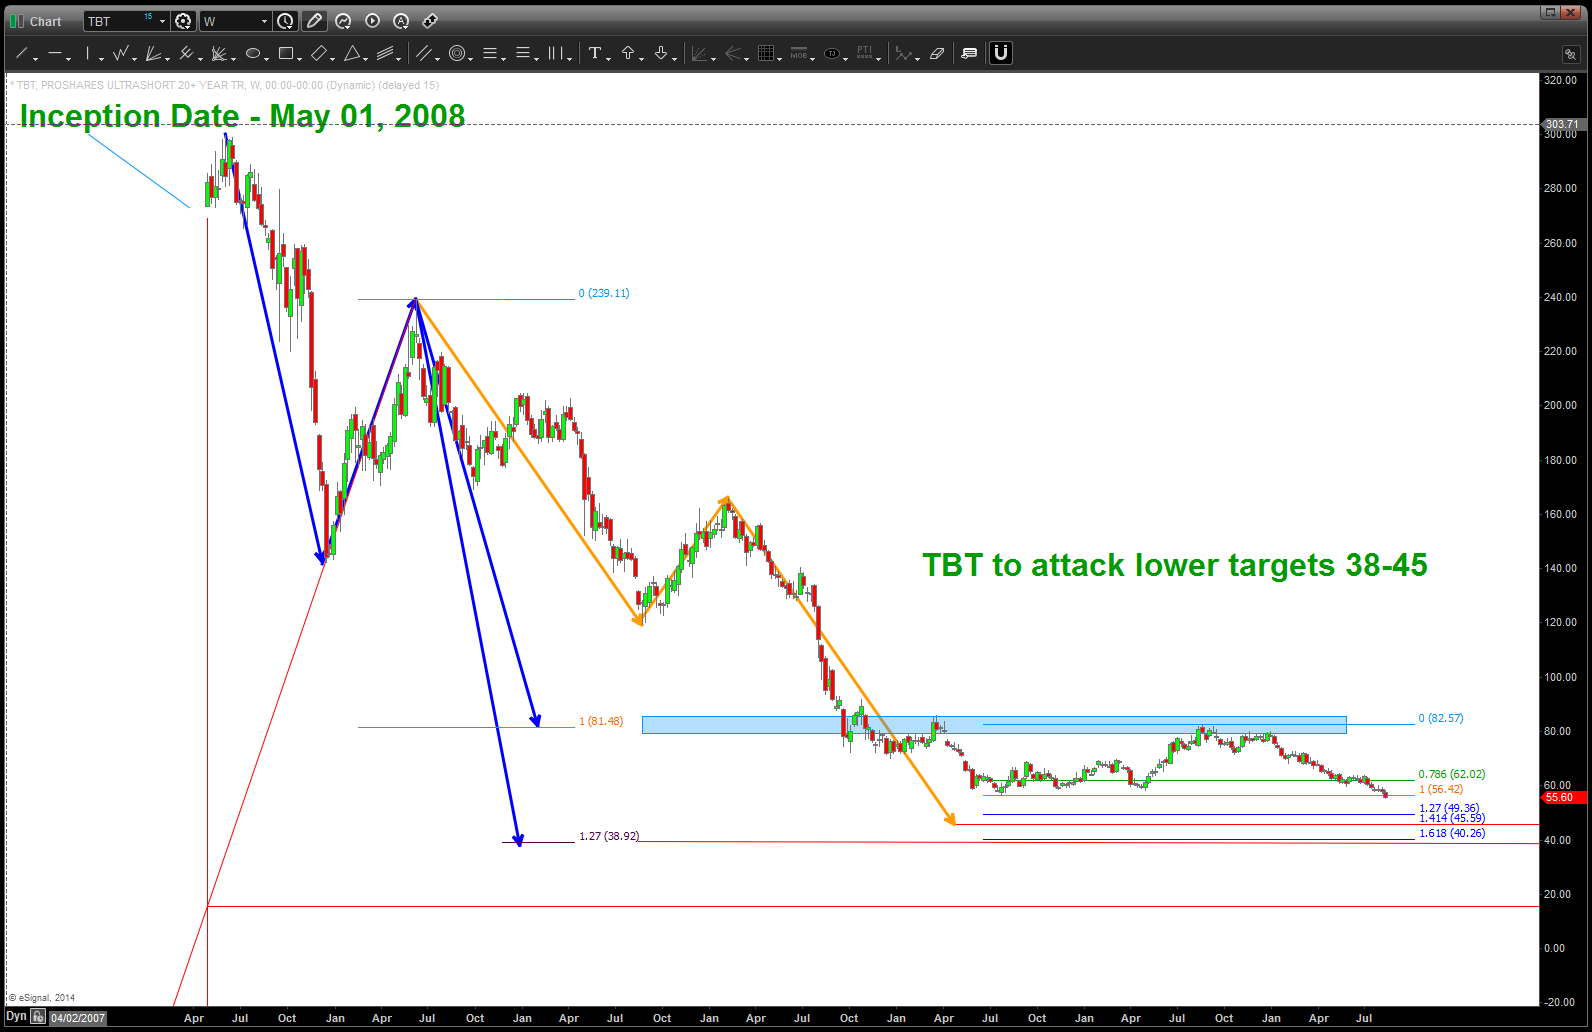
CLIFF NOTES 2: this is a tough one … the pattern in the fixed income market (30 year) failed and has gone much higher//the pattern on TBT failed. HOWEVER, the long standing target on the TEN YEAR Treasury Yield was hit on Friday. Quite frankly, I didn’t think it would get hit as the 2.4 level provide some nice support and then, ultimately failed. So we are at THE critical level for the rate structure on the 10 year. I’ll stand by my guns this is corrective in nature, but the Ten Year needs to stop here or we’ll vacuum lower and rates will continue to plummet. I also updated the 30 year count to show a potential NEW HIGH if this count is correct. I will be the first to admit that our pattern failed on the 30 year/TBT. In fact, we found the support for the long bond ( https://bartscharts.com/2014/01/04/thelma-and-louis-and-fixed-income/ ) and it was at a very crucial level at the time of that post. It held and since then has rocketed higher (lower rates).
CLIFF NOTES 3: we are at a CRUCIAL CRUCIAL LEVEL …. not trying to be wishy washy as we have to take a stand but I can see the case of either direction. But in order to take a stand and some risk – my bet is on the TEN YEAR holding this low and starting back up ….
CHEERS!

HI, I am fully aware the FED is leveraged beyond thunder dome !!!!
Fractal Present on the Utilities – check it out
Posted on August 25, 2014 Leave a Comment
August 25, 2014:
CLIFF NOTES: please see below to understand the importance of our recent high at 577. The long term PATTERN from the all time low completed. Now, we have the beginning formation of the trusted and true head and shoulders pattern on the DJ Utility Index. Why is this important …? Well, look below at the fractal that existed at the top in 2007-2008. It’s exactly the same PATTERN. So, in a nutshell:
- we completed a major pattern on the Utilities up at 577.
- a head and shoulders pattern is forming the right shoulder, now.
- the same FRACTAL is present at the time, here’s a cool video to show fractals at work: https://www.youtube.com/watch?v=ZVwoYVkg-m4
folks it’s a PATTERN — it WILL work or it WON’t but it’s a PATTERN.
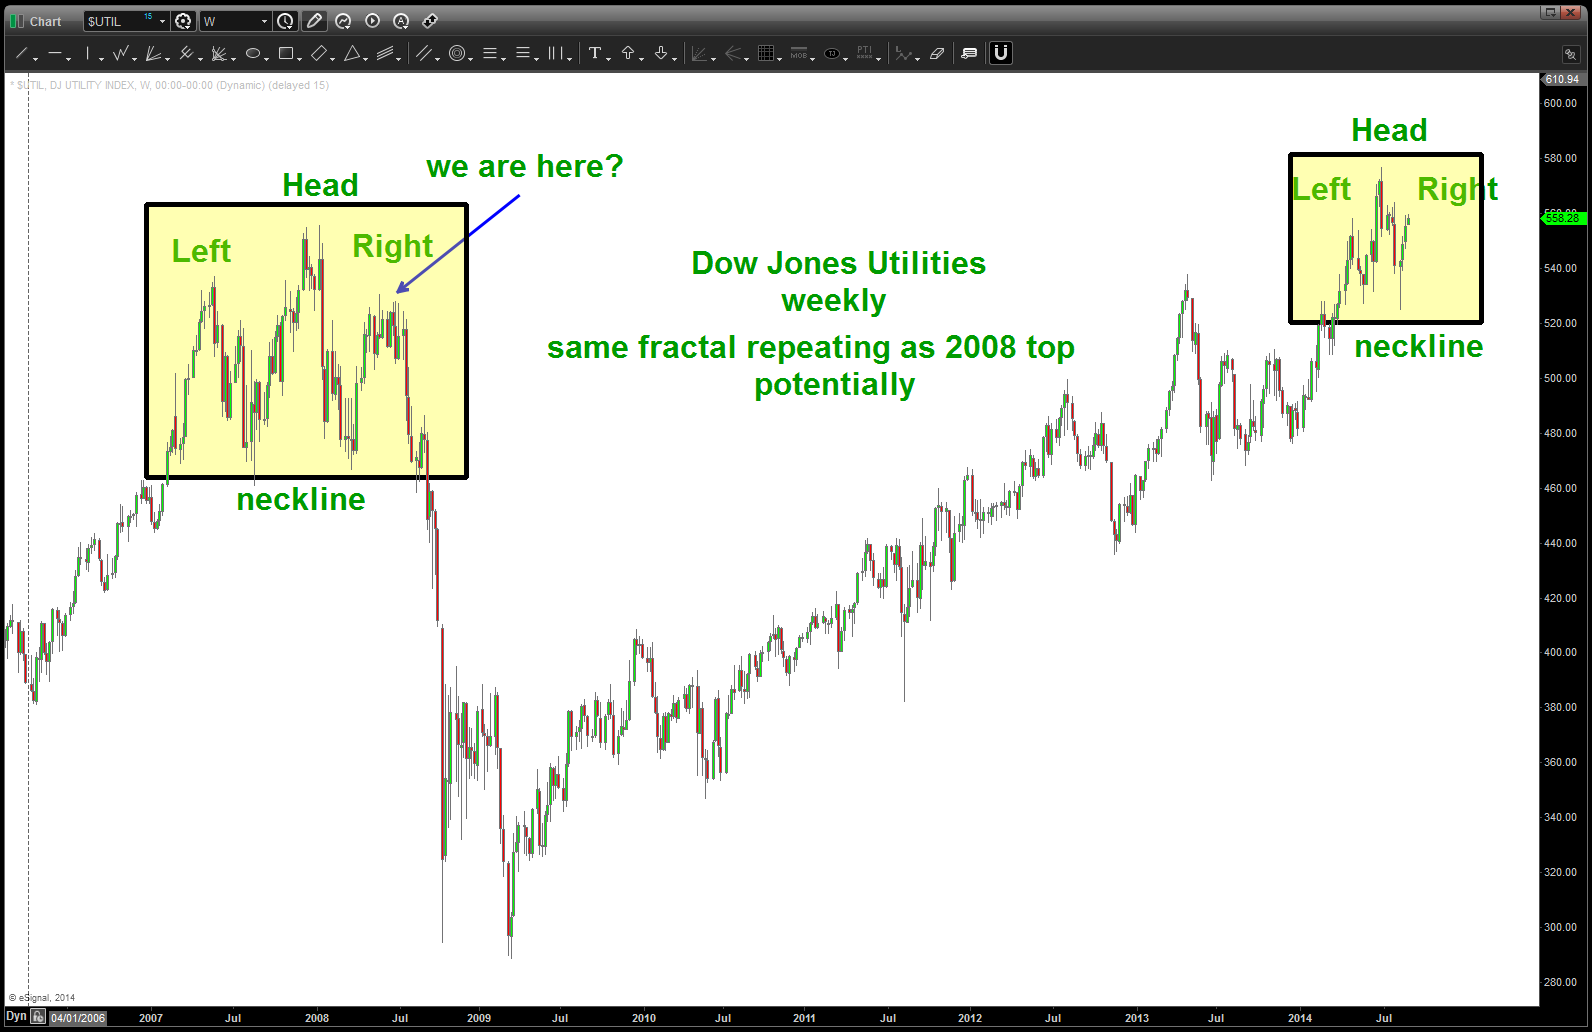
fractal pattern on the Utilities
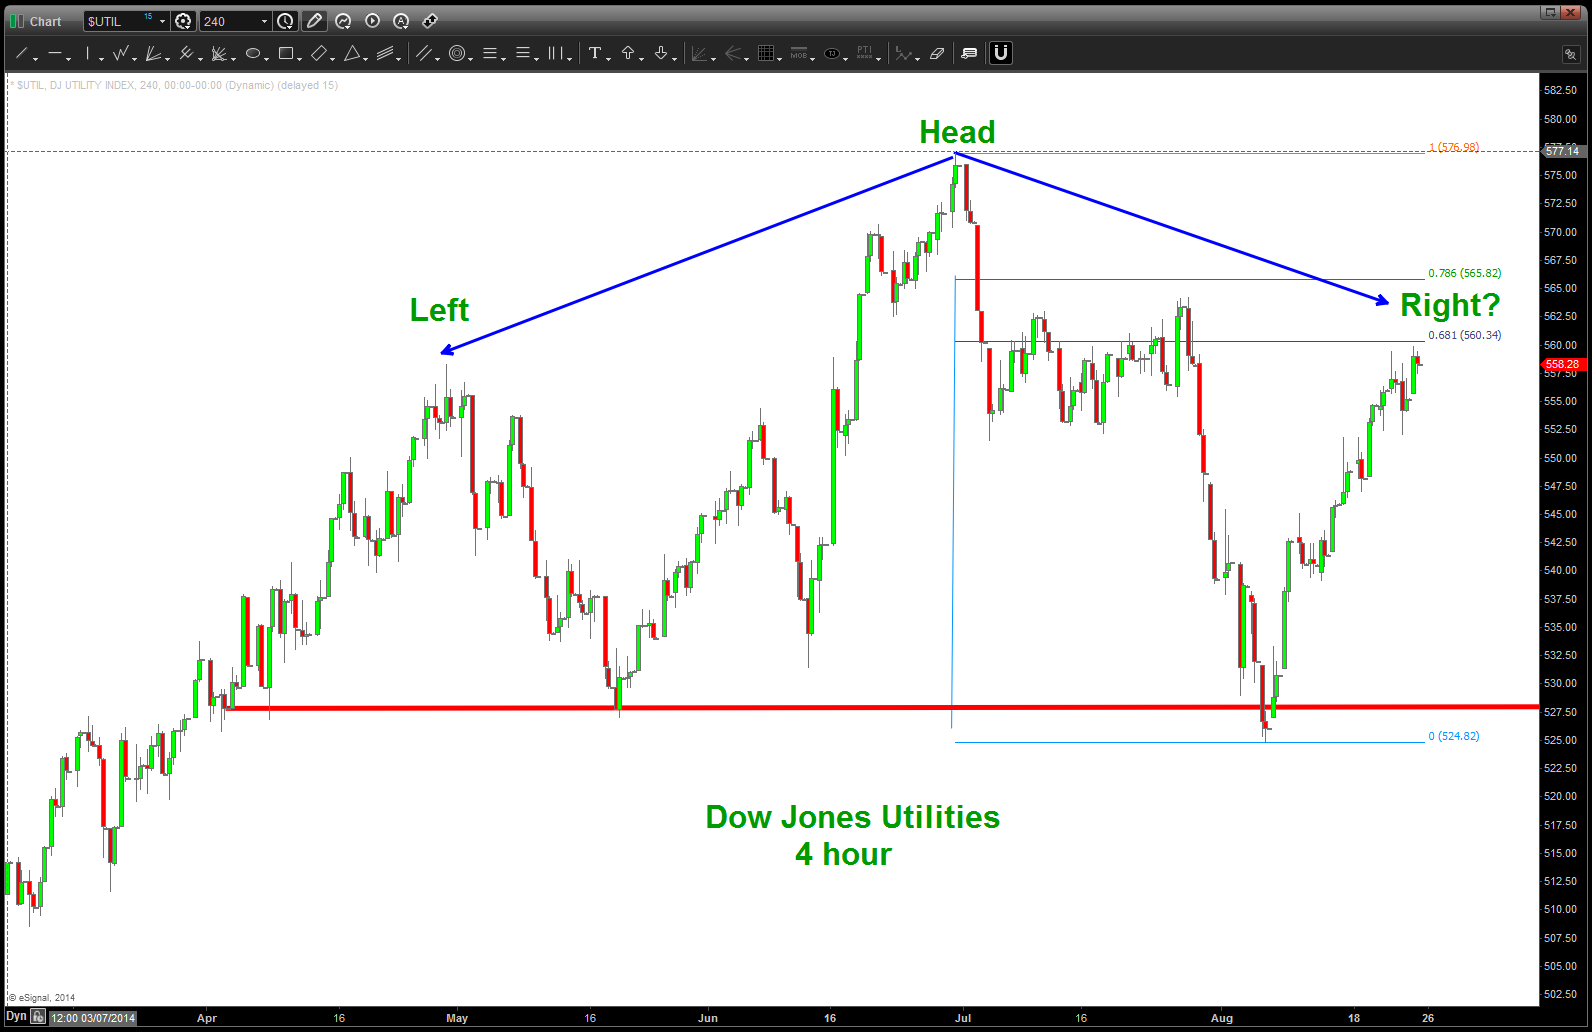
4 hour chart showing formation of potential head and shoulders
April 05, 2014
CLIFF NOTES: I am a patter recognition chartist. I am NOT trying to be overtly bullish or bearish. Just using this forum to show the PATTERNS that area ppearing.
On the DJ Transports we have completed a MAJOR AB=CD sell pattern w/ a 1.618 extension. That is bearish. It’s particularly bearish because the pattern using the former all time highs and lows. I am also showing the Utilities almost completing a very bearish pattern. Again … heads up folks, these are NOT 60 minute intraday scalping trades. These are MAJOR patterns that bear close watching.
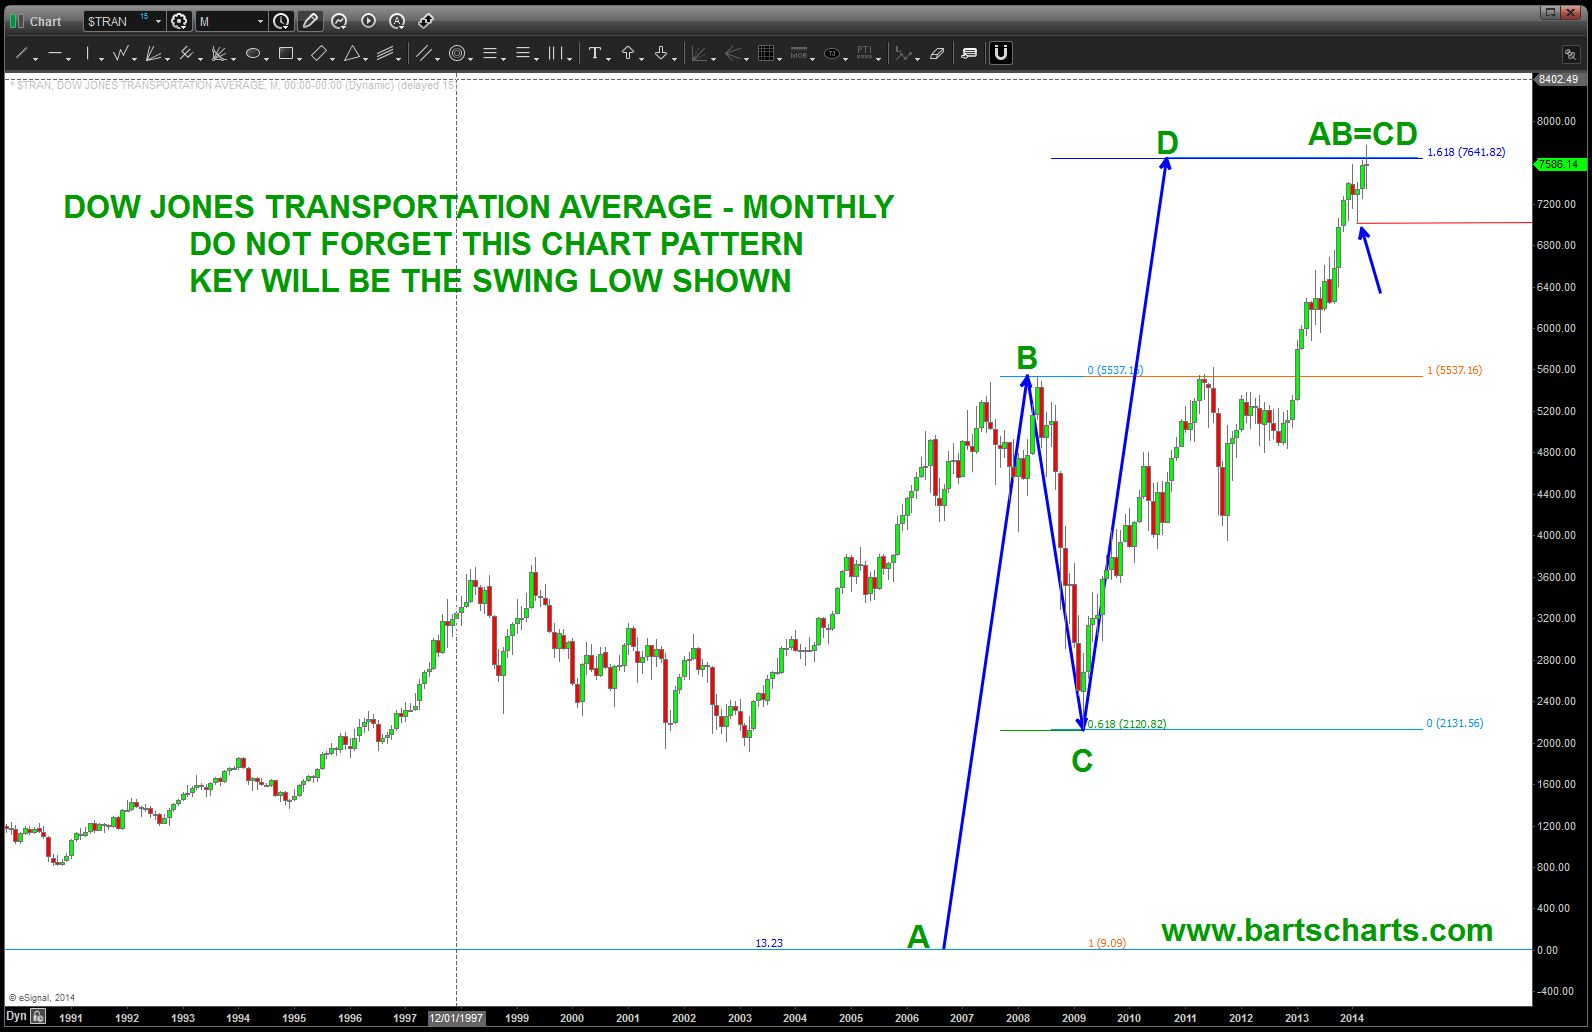
DJ Transports
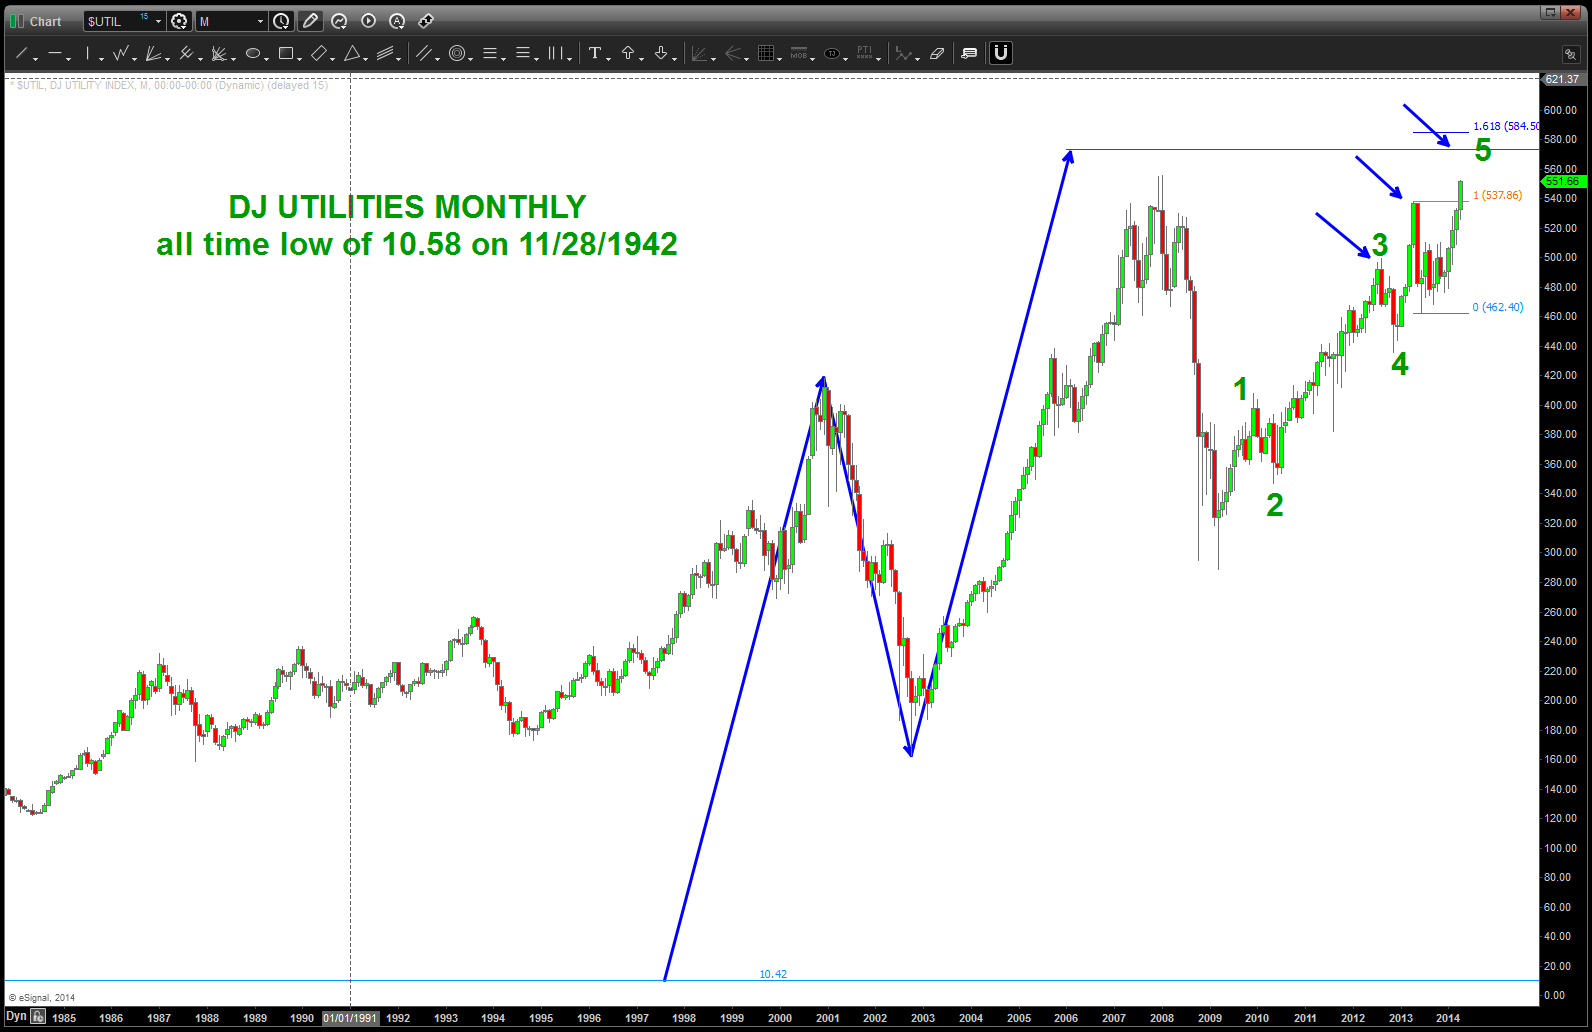
DJ Utilities
Palladium at major resistance …
Posted on August 24, 2014 Leave a Comment
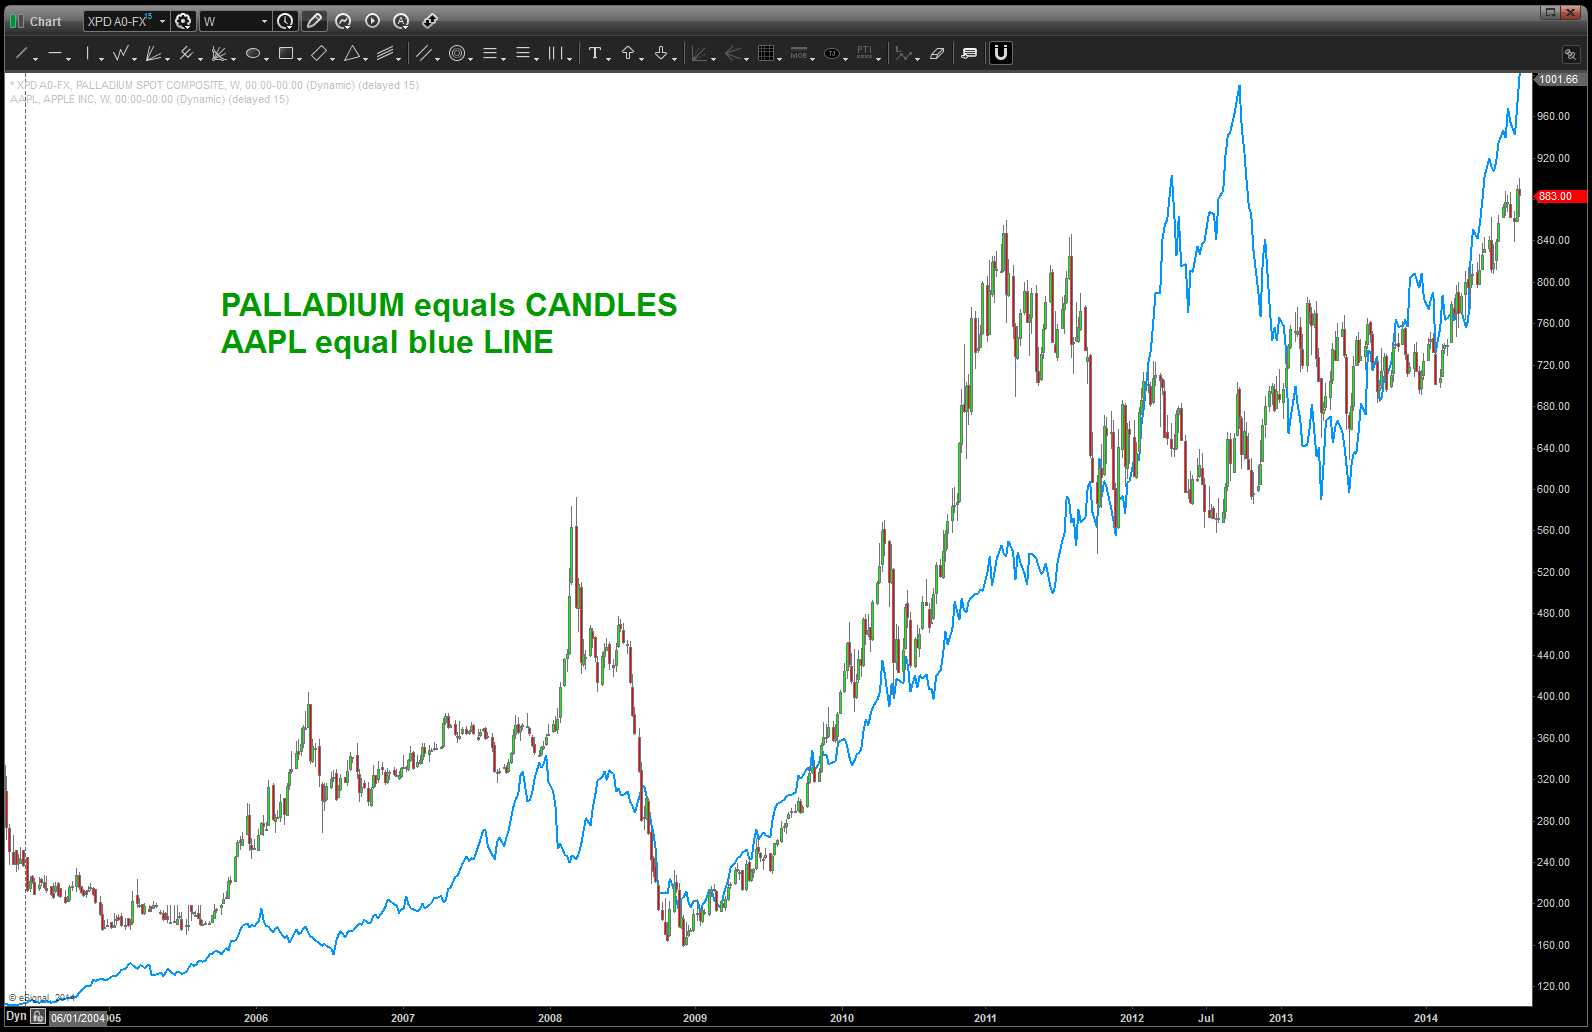
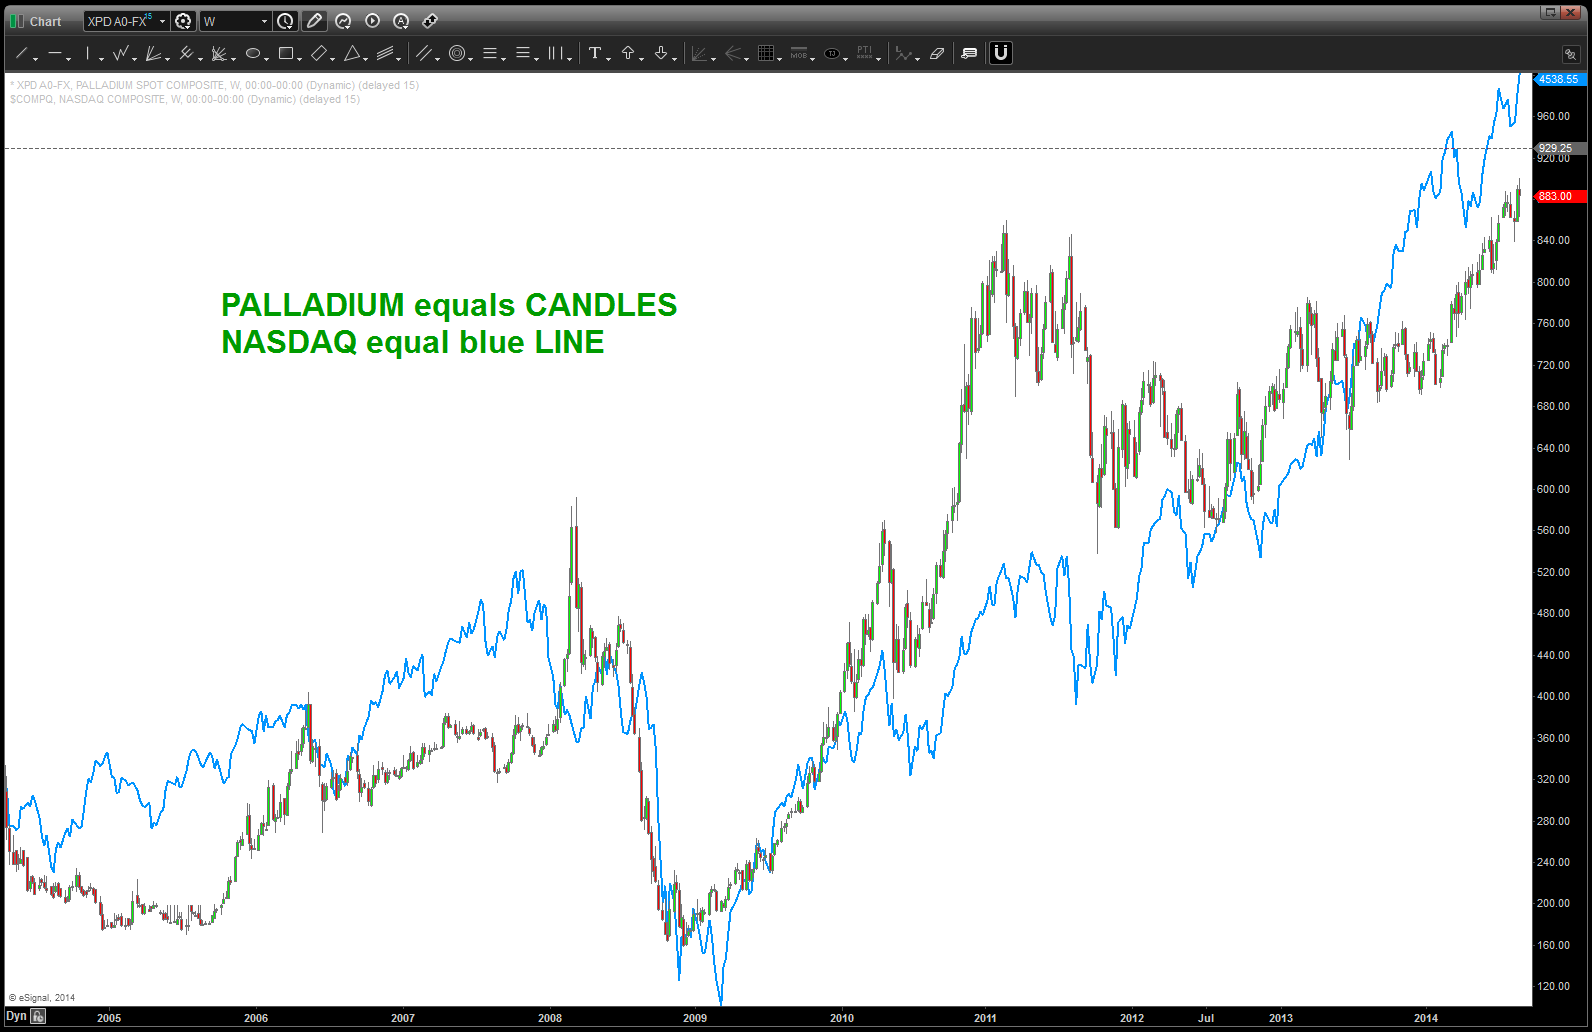
Cliff Notes: Palladium converging into to major resistance. This is important because it’s a nice little commodity to watch w/ regard to the NASDAQ and AAPL. In order to build the pattern we are going to to go step by step this morning into “why” Friday’s high was important from a PATTERN perspective.
1. First, here’s WEEKLY charts of 1) NASDAQ and Palladium and 2) AAPL and Palladium.
- notice that when palladium broke out of the consolidating triangle, AAPL took off.
- of late there has been a lead/lag relationship at times BUT the overall directional pivot is clear. As Palladium goes, so does NASDAQ and AAPL.
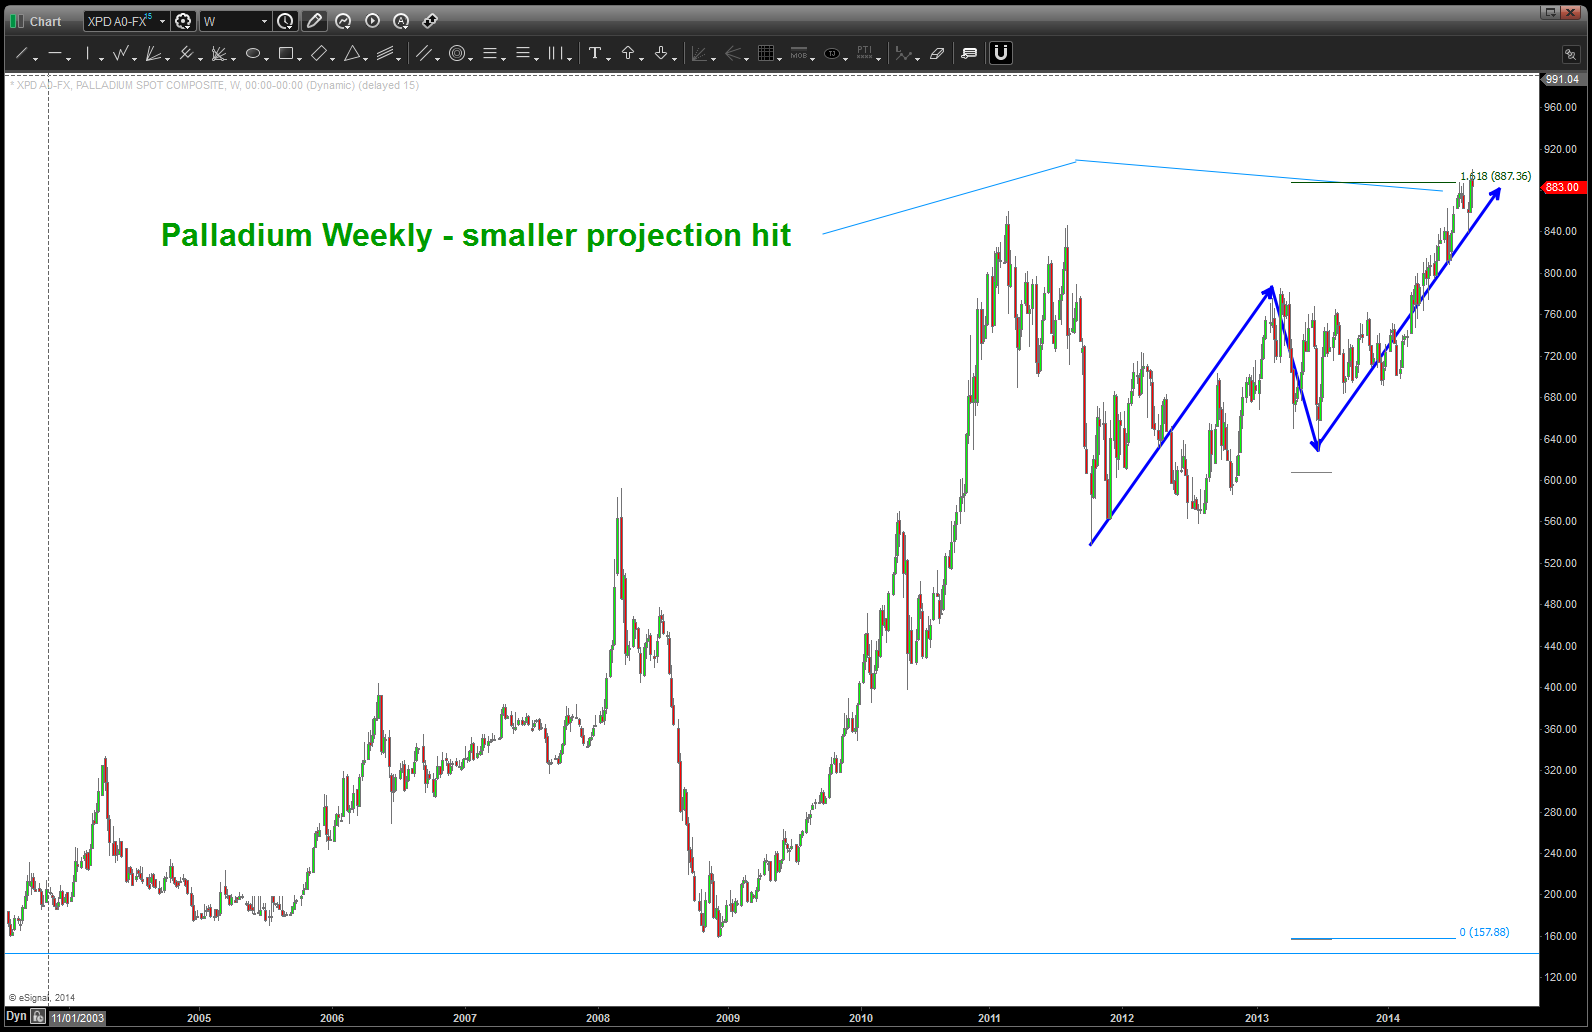
2. When constructing a PATTERN there are three things we do — PROJECT / EXTEND/ RETRACE. In order to keep this post brief I’ll do the basic stuff …
- PROJECT: note in the two charts below we have 2 “basic” projections coming into the same area. That warns of resistance.
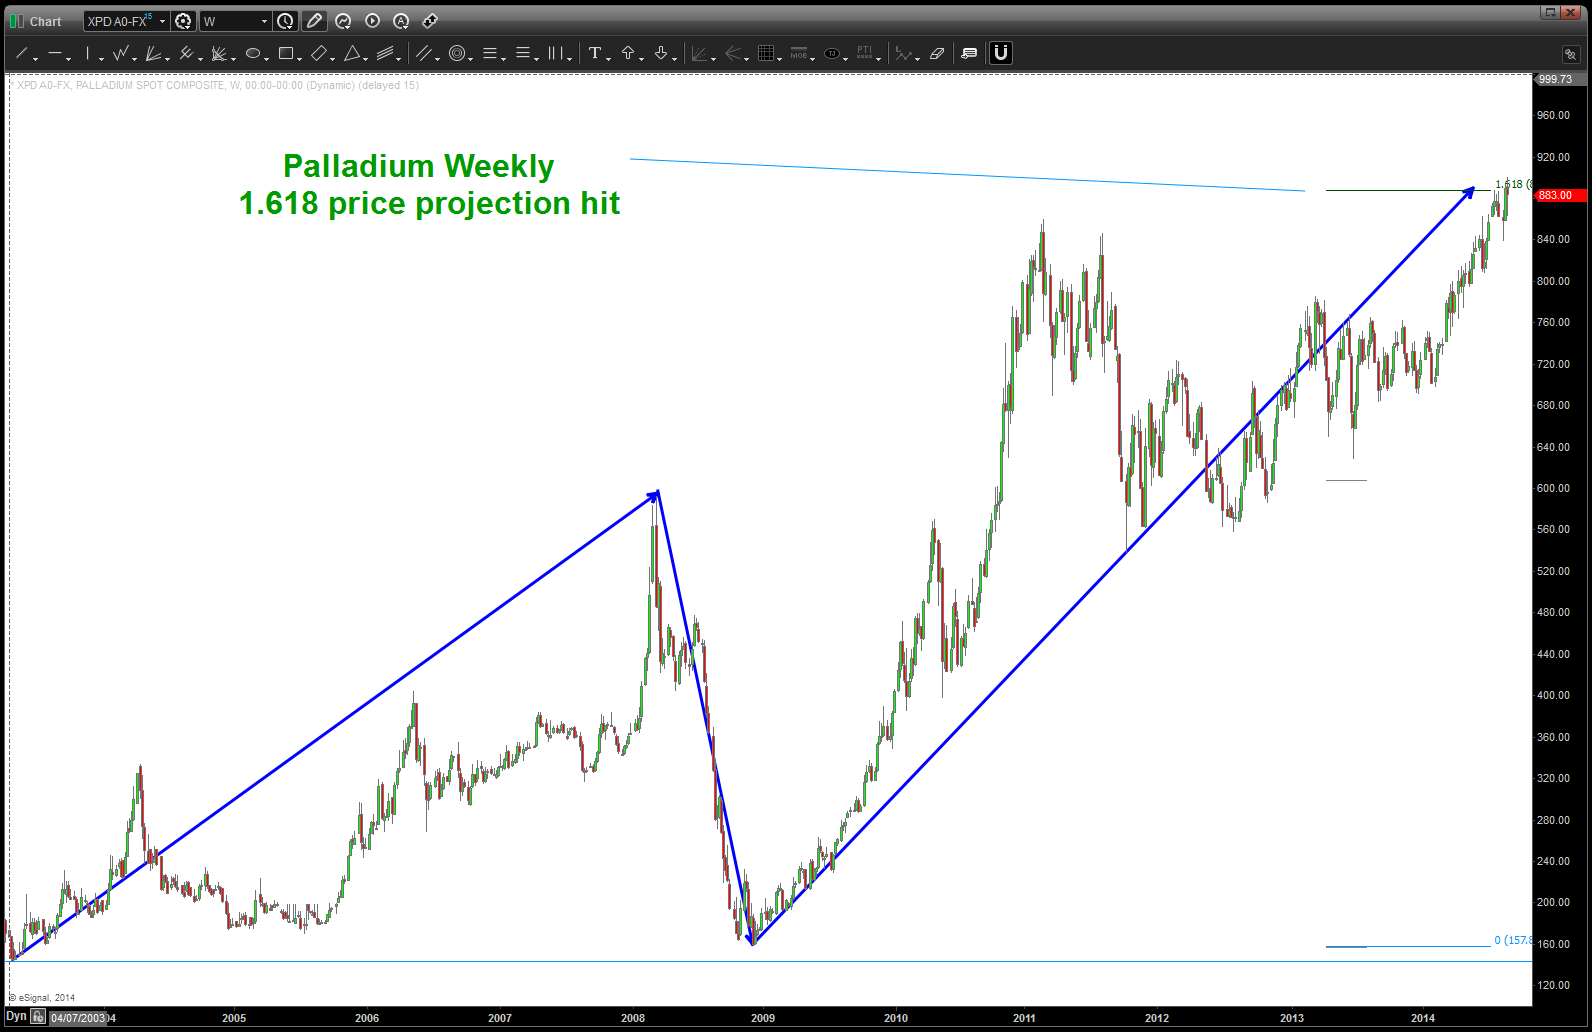
Palladium 1.618 Price Projection
- EXTEND: note, we used the middle point at 593 for the extension pattern. Also, note 1.68179 nd 1.732 are used. musical note and the square root of 3 …
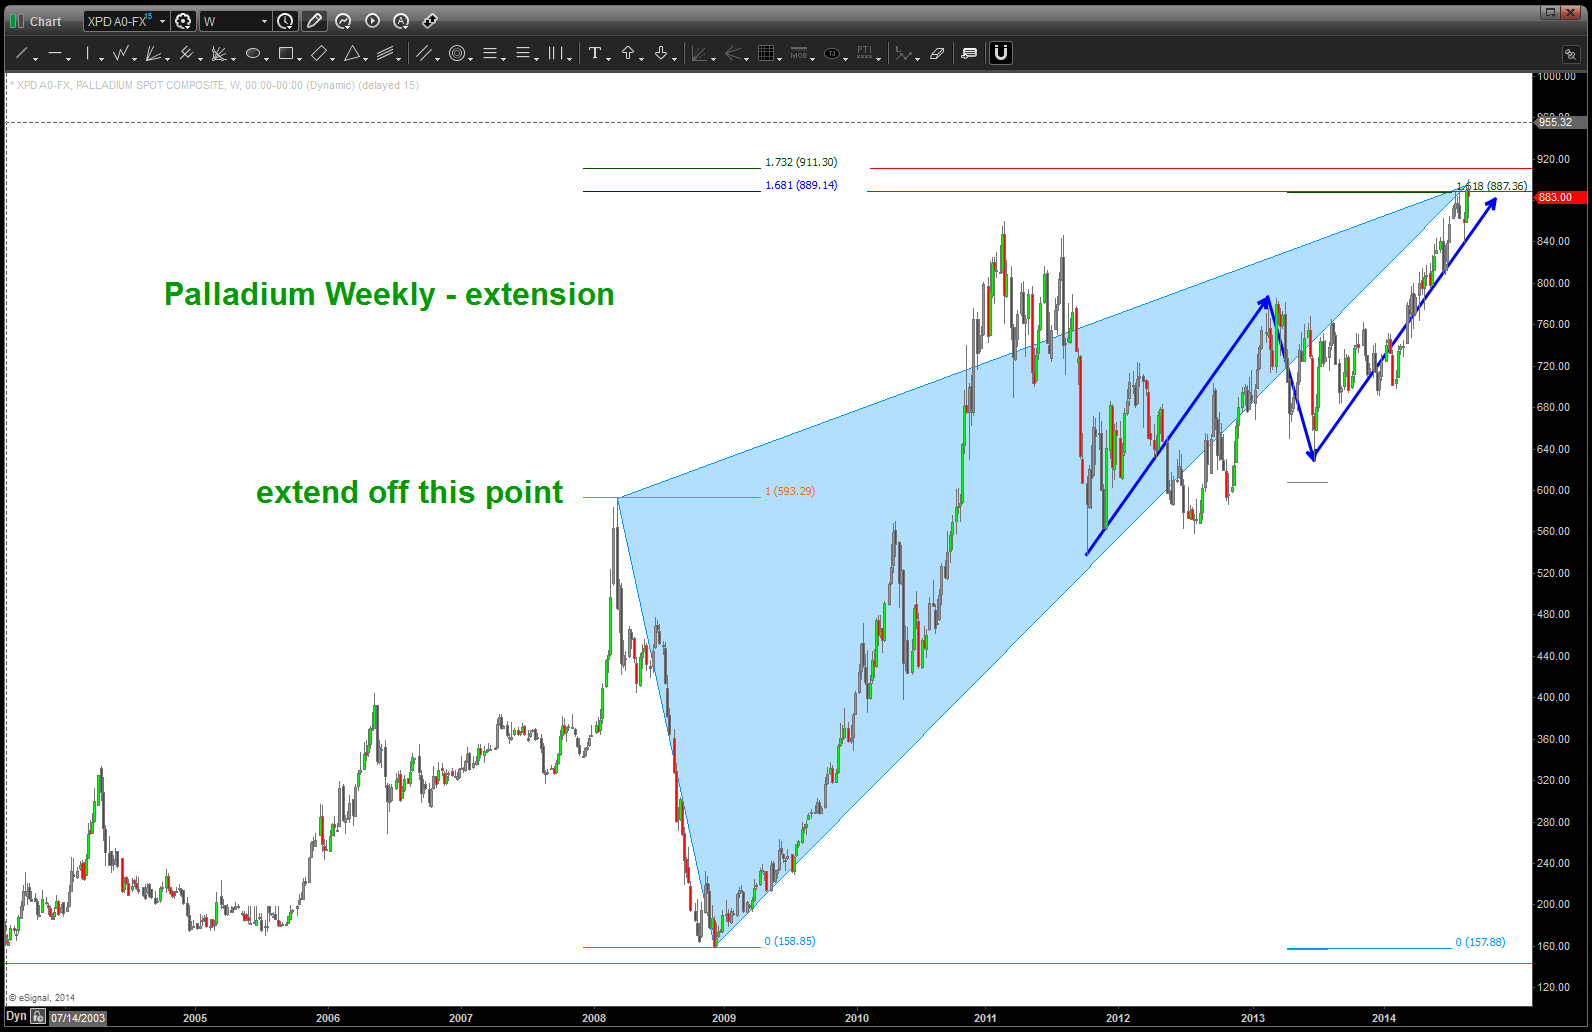
extension from 2008 (shaded light blue triangle)
- RETRACE: from the all time high we have a .786 retracement. This is NOT a fibonacci number. Here’s the math- 1.618/square root is 1.27 and 1/1.27 = .786.
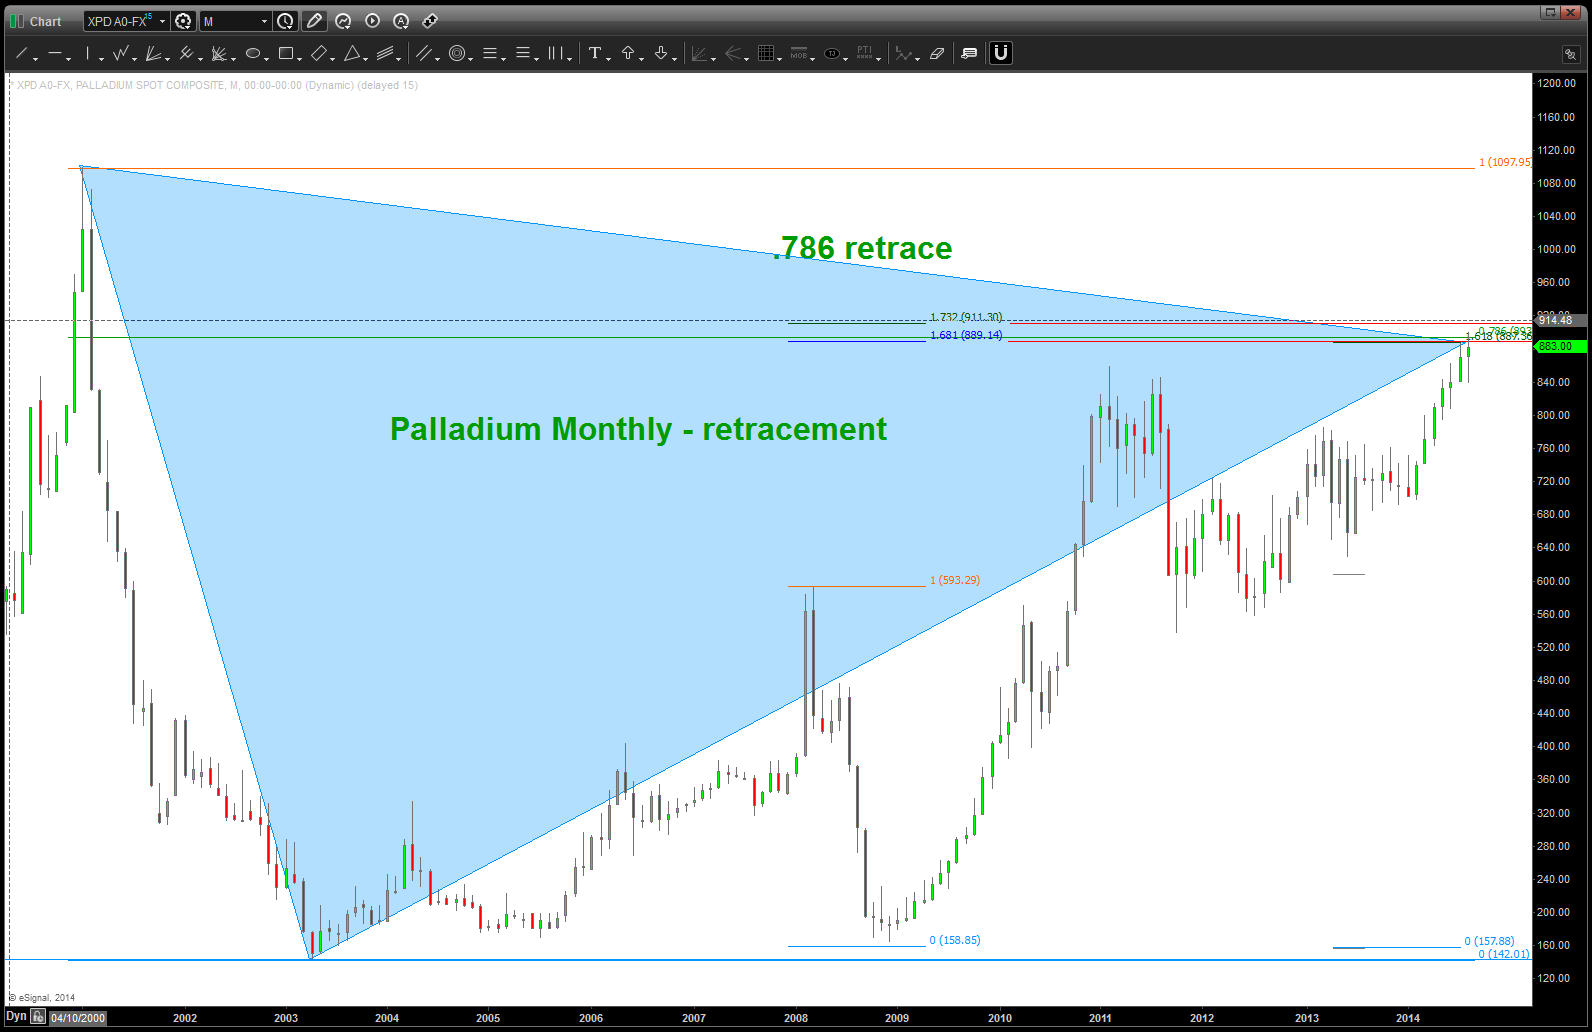
so … as you can see, we have a bunch of NUMBERS adding up to this being a big level for Palladium. And, while a case can be made that, since these are weekly/monthly nodes coming out, it SHOULD be a hefty amount of resistance. That being said, it could also BLOW RIGHT THRU EM’ and rip higher and higher. It’s just a pattern folks.
Last – the BUTTERFLY PATTERN is present. Connect two triangles together and that’s the butterfly pattern …
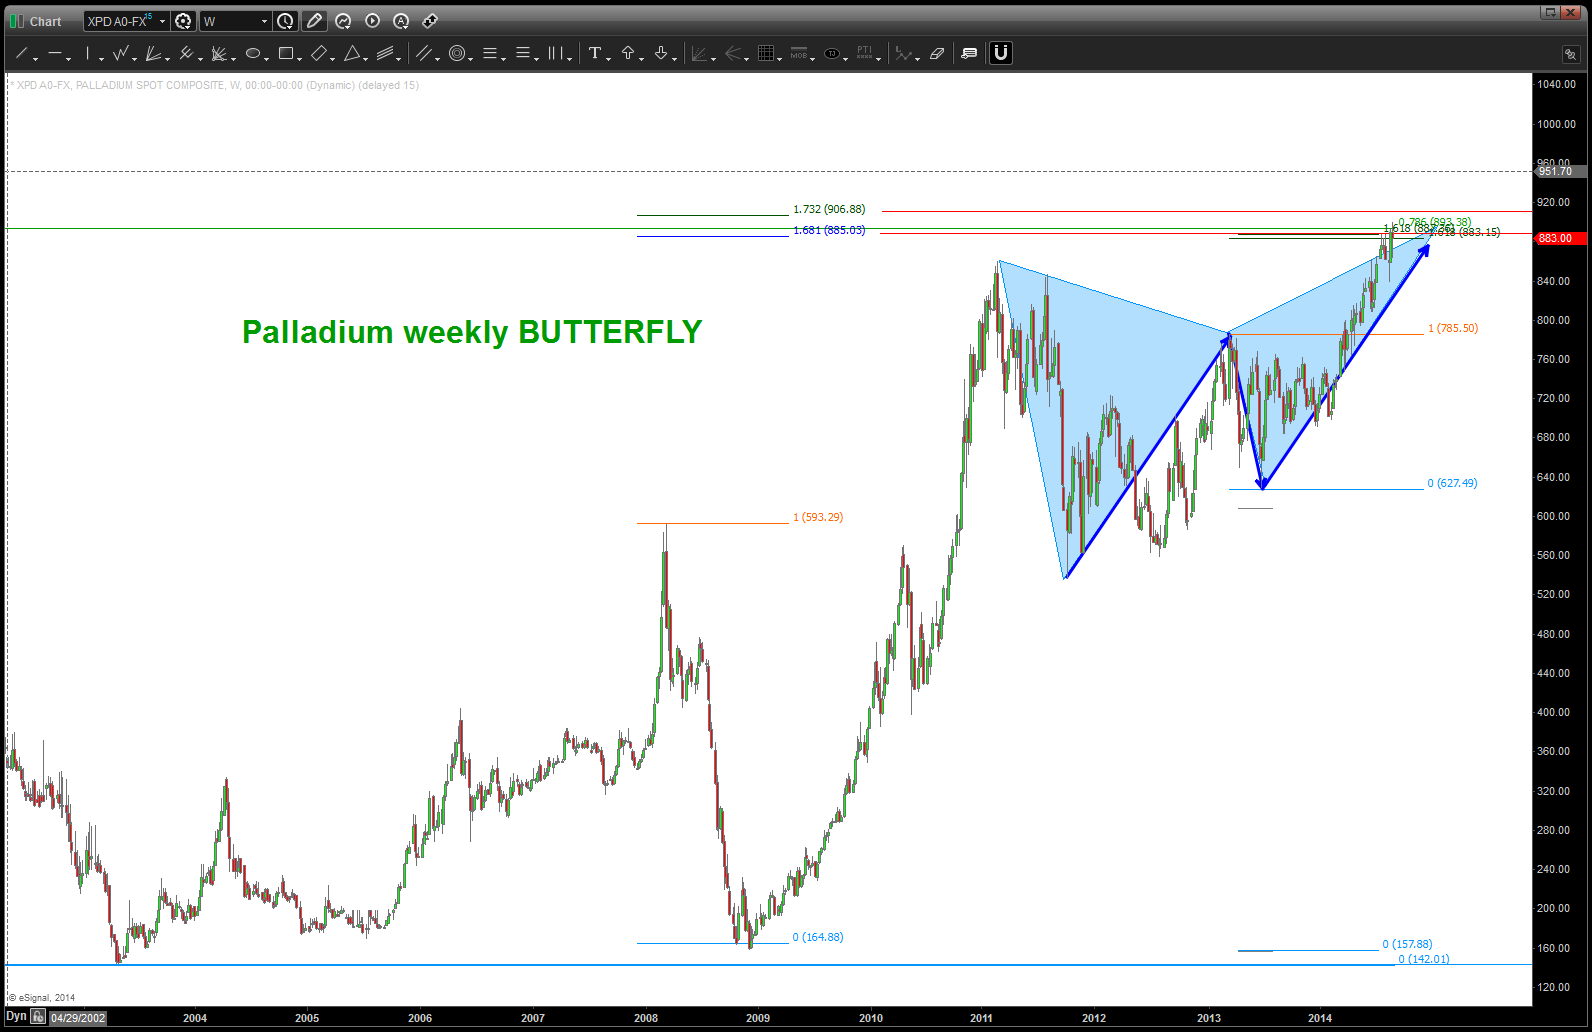
Butterfly SELL pattern
put it all together and here is the picture:
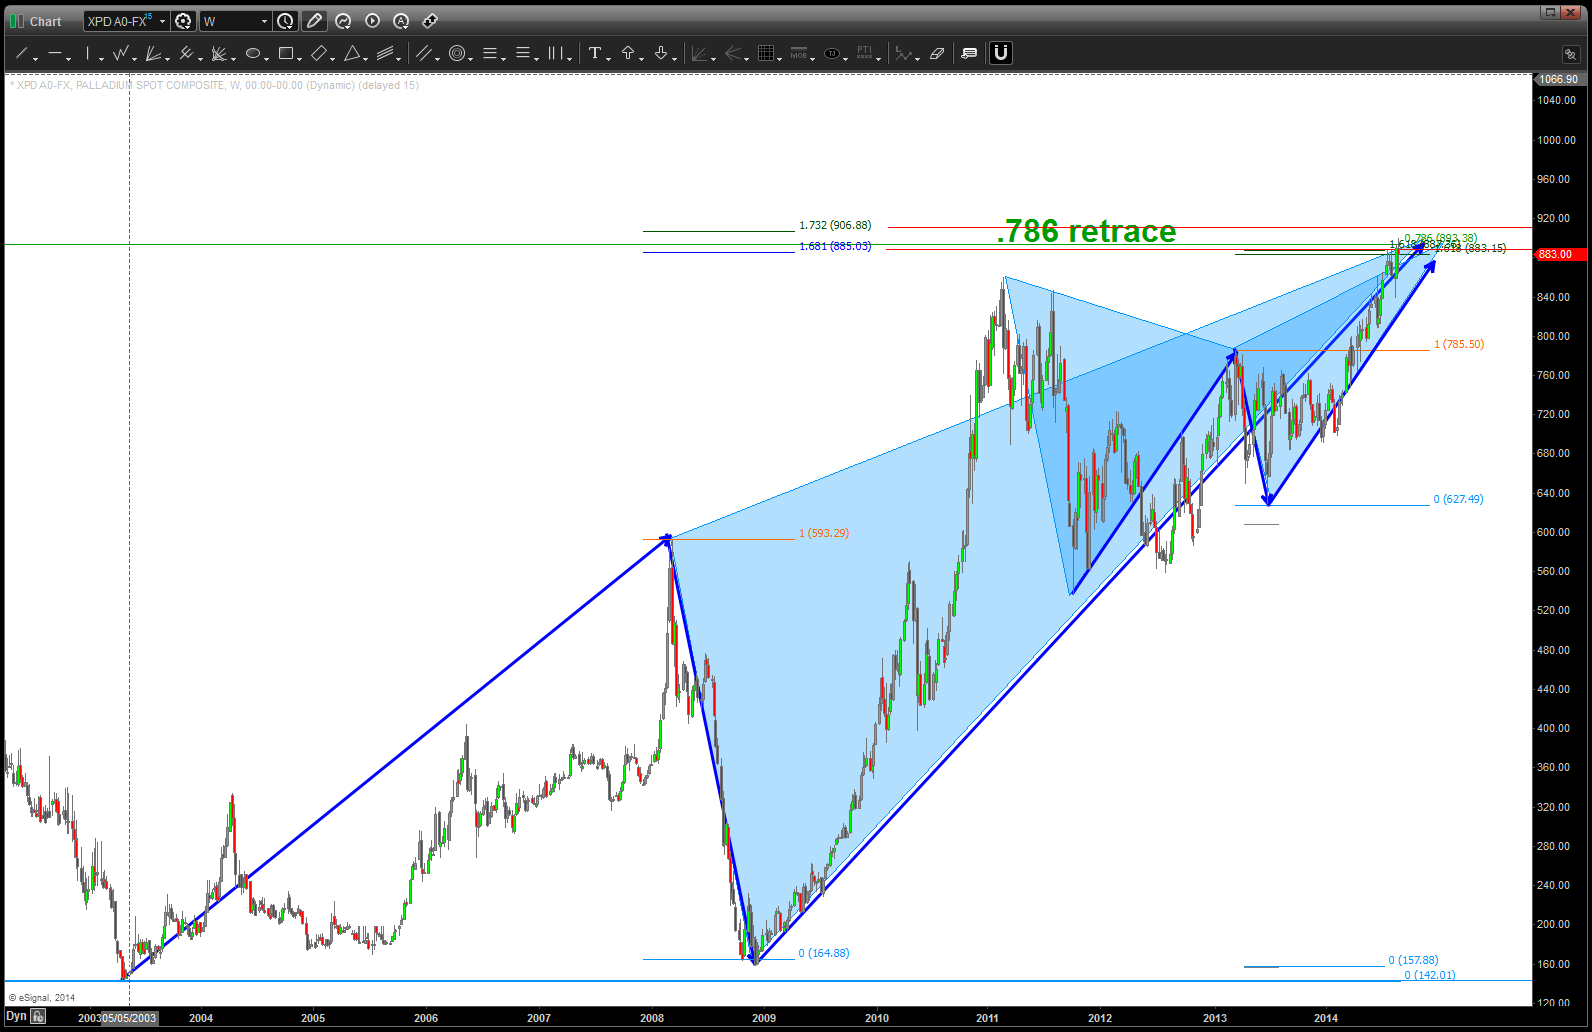
PATTERNS complete on Palladium …
here’s a potential count — note – 4 doesn’t CLOSE below 1 so I say “go for it” w/ regard to the count. Additionally, alternate targets provided at little higher. Sure seems like it wants to head up that way … ?
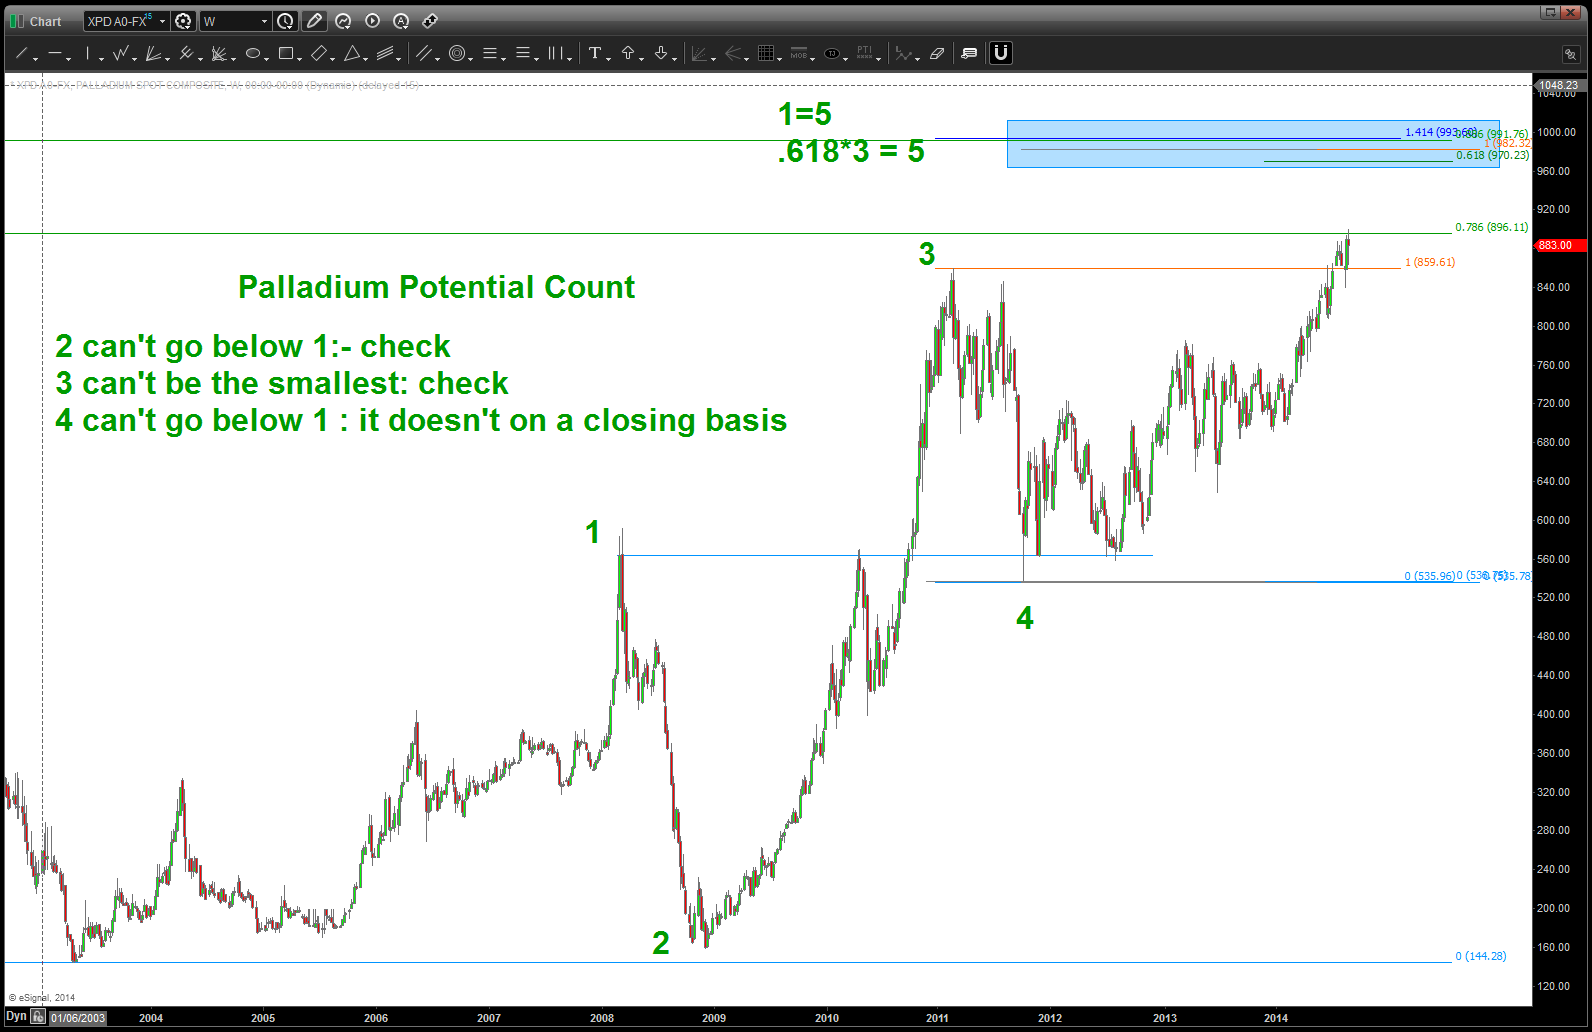
Palladium Count Potential
last thing we check is the “relative strength” using ratio analysis. in this case we have PALLADIUM / GOLD. When we overlay Gold on top of the ration there isn’t that big of a correlation. HOWEVER, when Palladium is overlaid (see below) we can see that this ratio is extremely important. And, what do we have on the ratio – a SELL PATTERN appearing, which, in the past, has caused Palladium to inflect. Stay tuned.
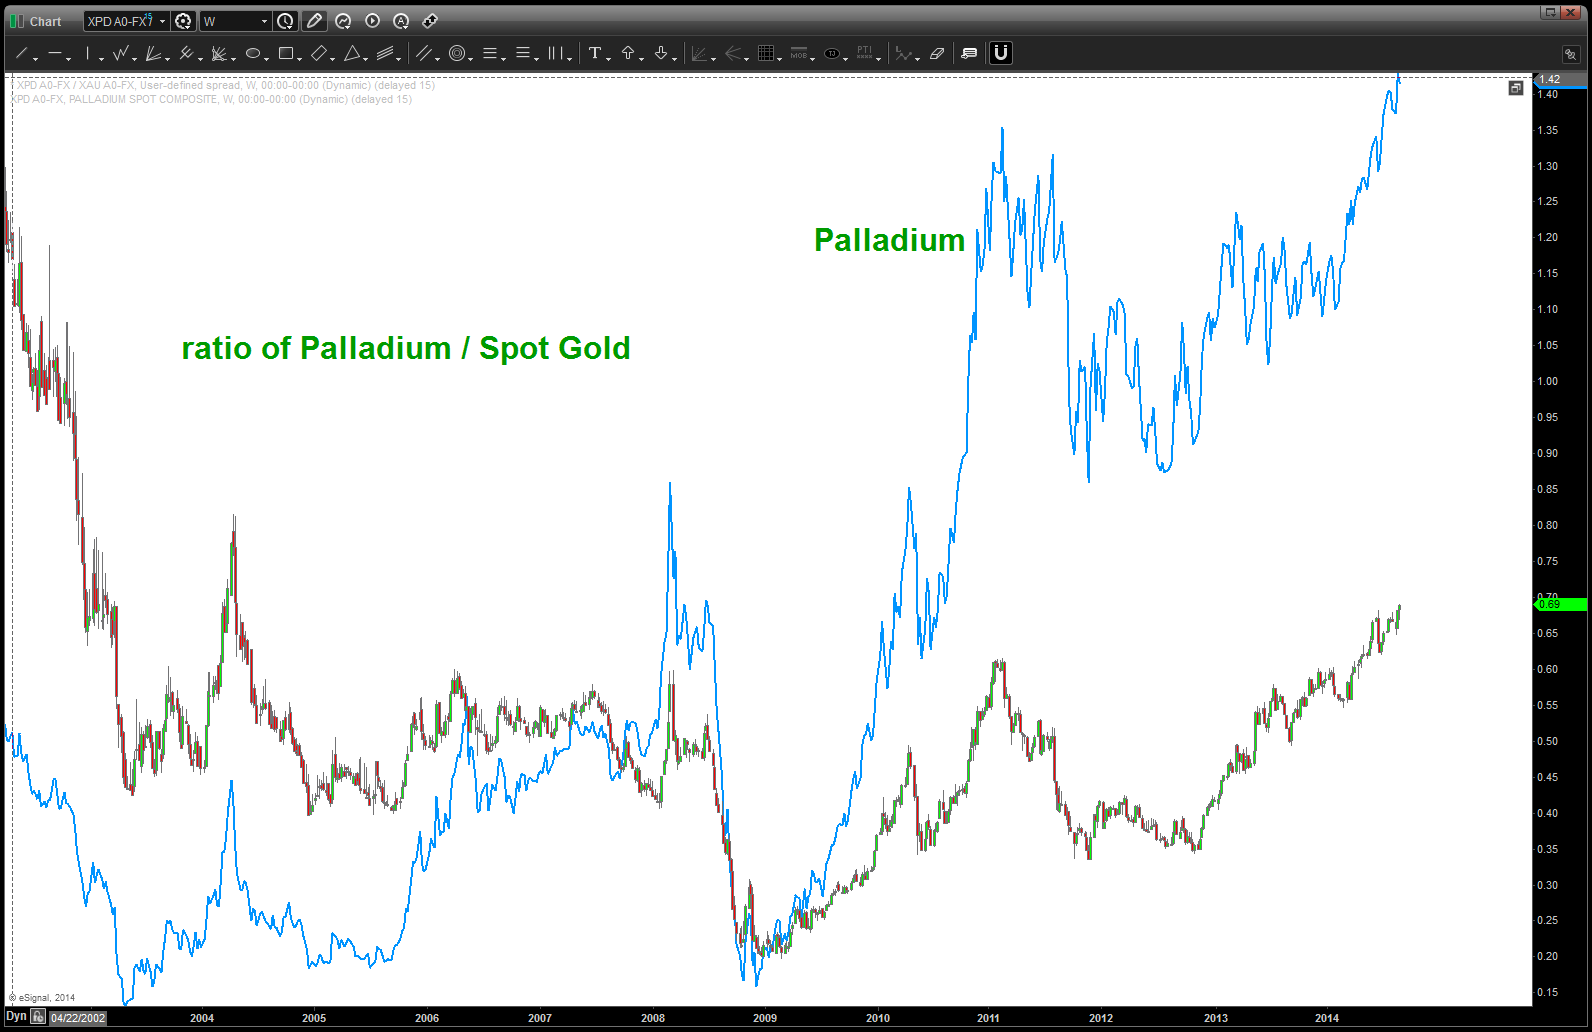
note, palladium prices overlaid and how the ratio is nicely synced w/ the highs and lows.
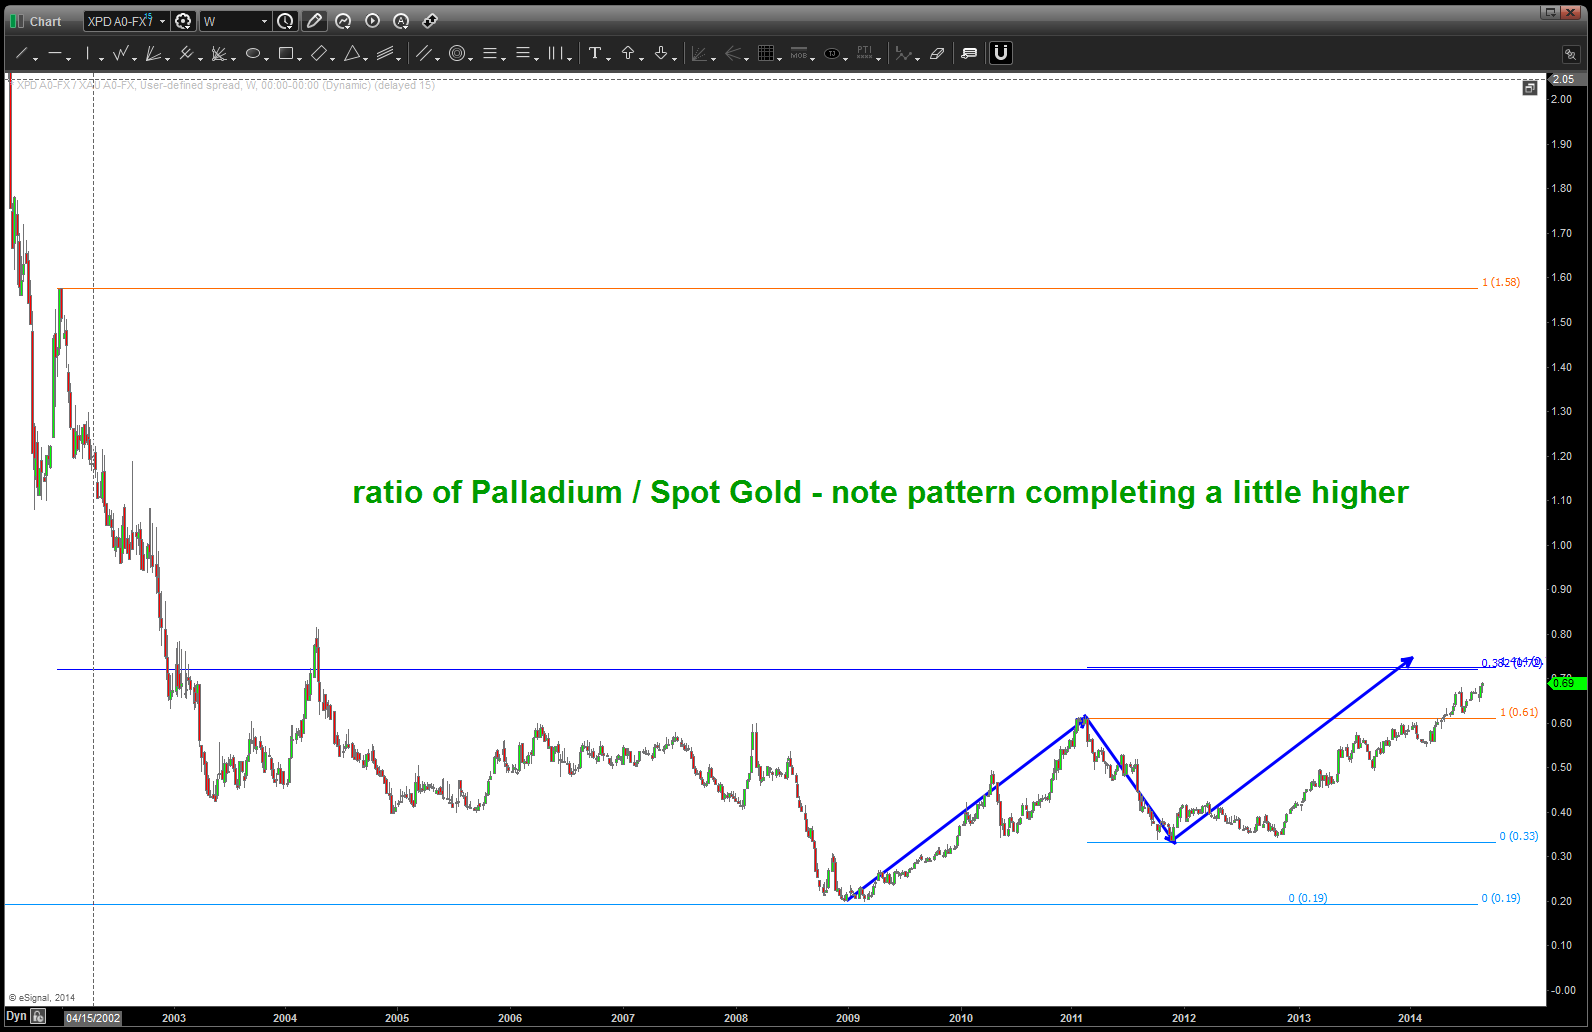
ratio of XPD / XAU – note pattern completing a little higher
So, there you have it … watch this important relationship, closely next week.
BART
Interest rate forecast …
Posted on August 22, 2014 Leave a Comment
8/22/2014 – if you read below you’ll read “my bet is on the TEN YEAR holding this low and starting back up ….” If that is the case then we have a VERY NICE PATTERN appearing on the Ten Year Treasury Yield that has multiple confirmations going for it ….remember folks, this is a 5 minute chart.
also, I have “copy/pasted” the earlier this week post on Jackson Hole and the fixed income structure …
the PATTERN:
- it’s a nice corrective pattern a-b-c. expectation is that “c” is in work and “should” take yields down to 2.358.
- c = 1.618*a right at ….2.358.
- a 1.618 extension of the “b” wave takes us right to ….2.358
- a retracement from the “key” low that we have watched for a while is .618 at …. you guessed it …2.358.
when all of these numbers line up … in this case SUPPORT usually occurs.
make it a great weekend …
5 minute ten year rate PATTERN
one last … I have ABSOLUTELY NO IDEA what Janet Yellen and the FED did this week or what in the world was said in the meeting minutes. Frankly, I don’t care … PATTERNS, PATTERNS, PATTERNS.
CLIFF NOTES: folks, follow this link to catch up on the Fixed Income story: https://bartscharts.com//?s=fixed+income
CLIFF NOTES 2: this is a tough one … the pattern in the fixed income market (30 year) failed and has gone much higher//the pattern on TBT failed. HOWEVER, the long standing target on the TEN YEAR Treasury Yield was hit on Friday. Quite frankly, I didn’t think it would get hit as the 2.4 level provide some nice support and then, ultimately failed. So we are at THE critical level for the rate structure on the 10 year. I’ll stand by my guns this is corrective in nature, but the Ten Year needs to stop here or we’ll vacuum lower and rates will continue to plummet. I also updated the 30 year count to show a potential NEW HIGH if this count is correct. I will be the first to admit that our pattern failed on the 30 year/TBT. In fact, we found the support for the long bond ( https://bartscharts.com/2014/01/04/thelma-and-louis-and-fixed-income/ ) and it was at a very crucial level at the time of that post. It held and since then has rocketed higher (lower rates).
CLIFF NOTES 3: we are at a CRUCIAL CRUCIAL LEVEL …. not trying to be wishy washy as we have to take a stand but I can see the case of either direction. But in order to take a stand and some risk – my bet is on the TEN YEAR holding this low and starting back up ….
CHEERS!
HI, I am fully aware the FED is leveraged beyond thunder dome !!!!
IBB last bit of juice squeezed out … ?
Posted on August 22, 2014 Leave a Comment
08/22/2014 – had the target below on my “alert” but forgot to post so I’m a couple days late. Recommend closing the long from 240 ish and step aside. It’s been a good ride DOWN and UP. Note, below you will see the “high” print and the geometry behind that short and then WAITING for the BUY pattern to appear and logically get a little more juice from IBB and now step aside. Could it go higher — absolutely. It could also go lower …both sides have been played so don’t test your luck. Ha Ha Ha Ha …
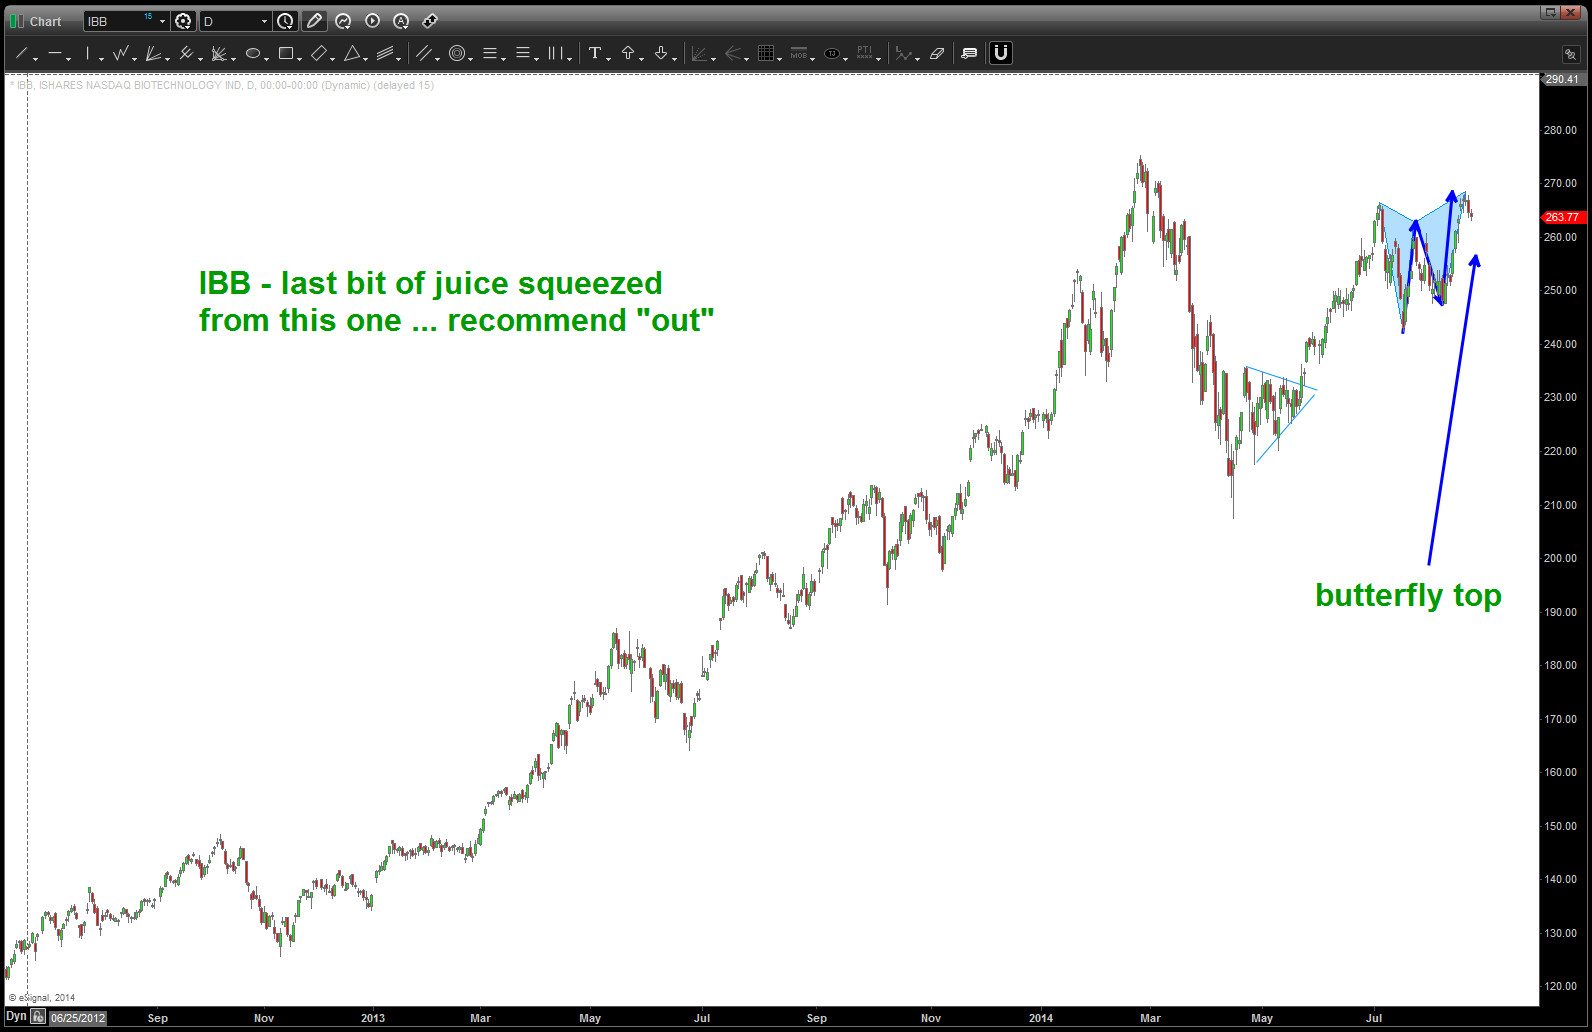
IBB … don’t be greedy, take some off
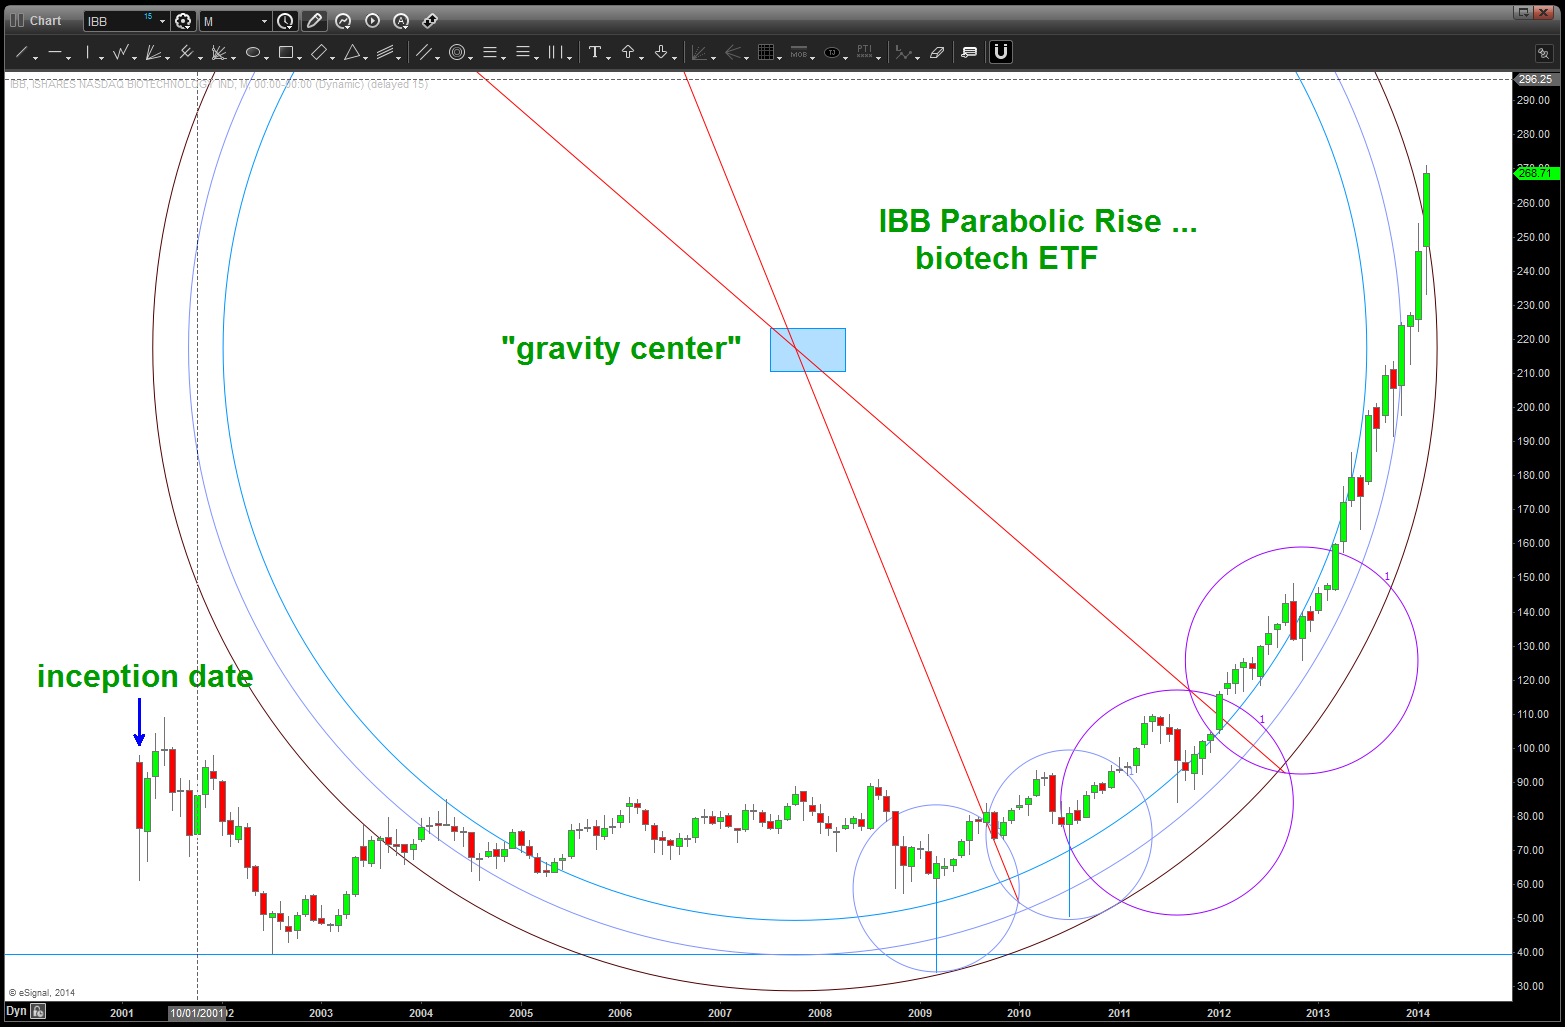
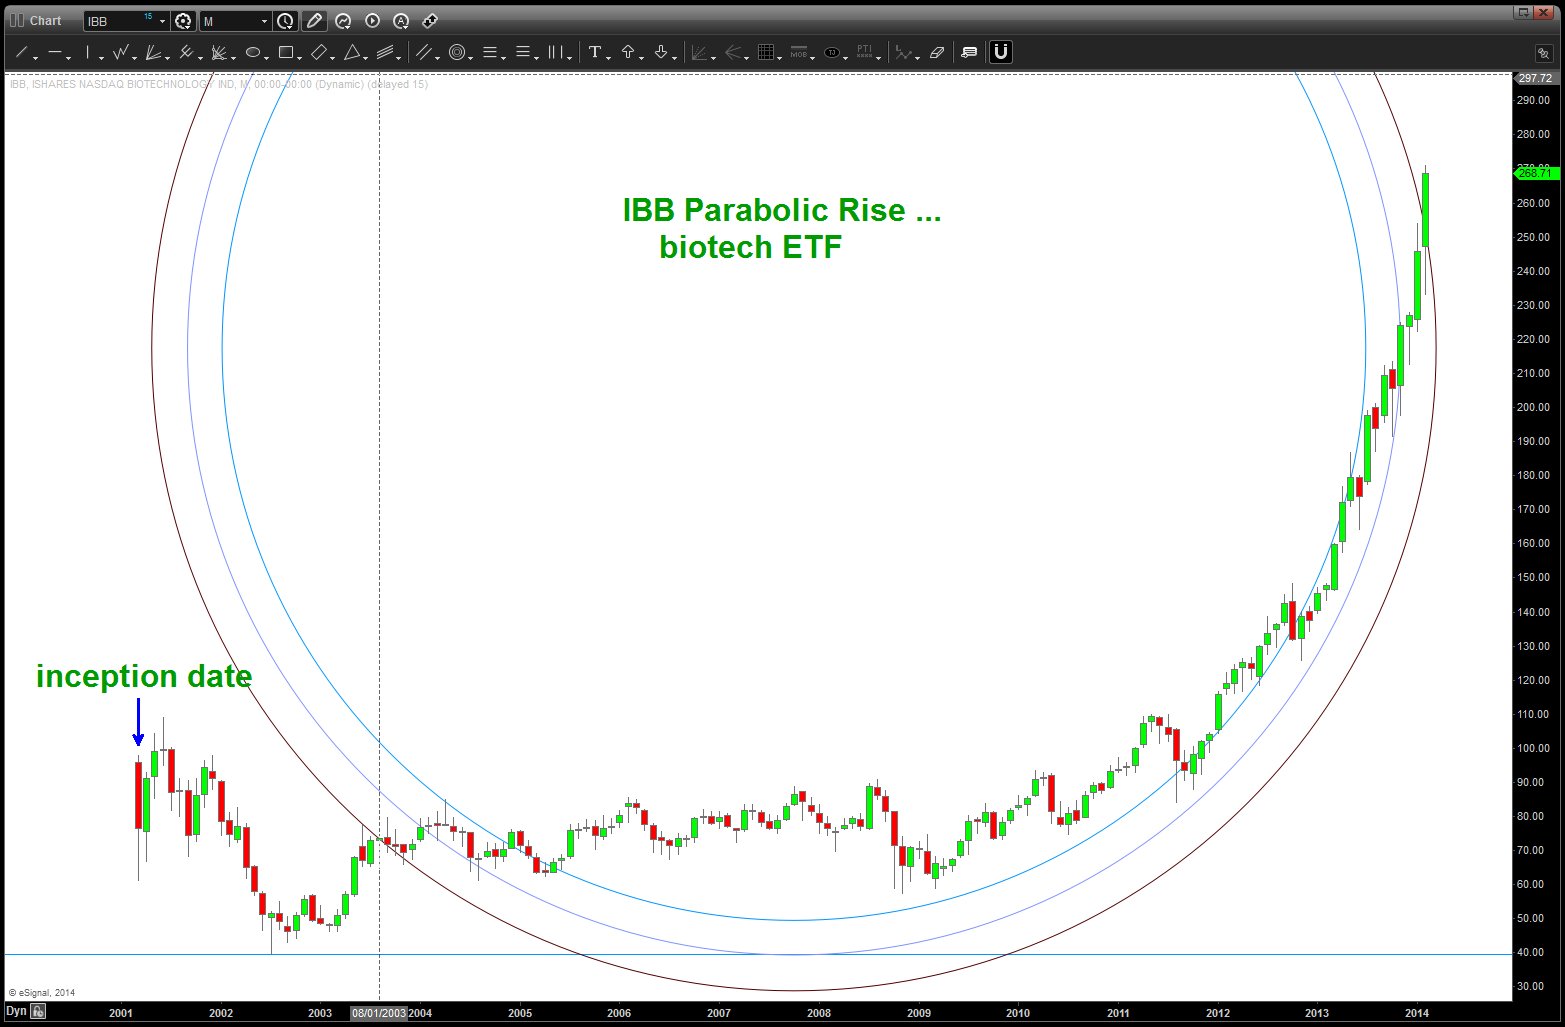
08/02/2014 – IBB has completed a PERFECT buy (price and time equality) PATTERN and believe the result will, more than likely, give us a good flavor for the rest of the equity market in general. Why? Well, this was a PARABOLIC move and if it keeps going then the “overall” mindset of the equity market might fall in line. Might or might not … anyway, IF you are long THEN the level 246 should be on your mind. If we close below on a daily basis would recommend looking at this position long and hard. IF the pattern works THEN risk is anything below 246. Watch this …
I was asked to take a look at IBB again and decided to re-post the below. Look folks, as much as the below is a work of art I’ve also been wrong on the patterns. it’s all probability and the patterns are always CORRECT? Why, because they LET YOU KNOW WHERE YOU ARE WRONG! And, when you become an advanced pattern recognition trader, IF (the big if) you execute correctly THEN you know that you’ve done everything you can do to manage risk and your not SURPRISED or HAPPY when one works or SURPRISE and SAD when one doesn’t. The PATTERN will work or it wont …off my soap box.
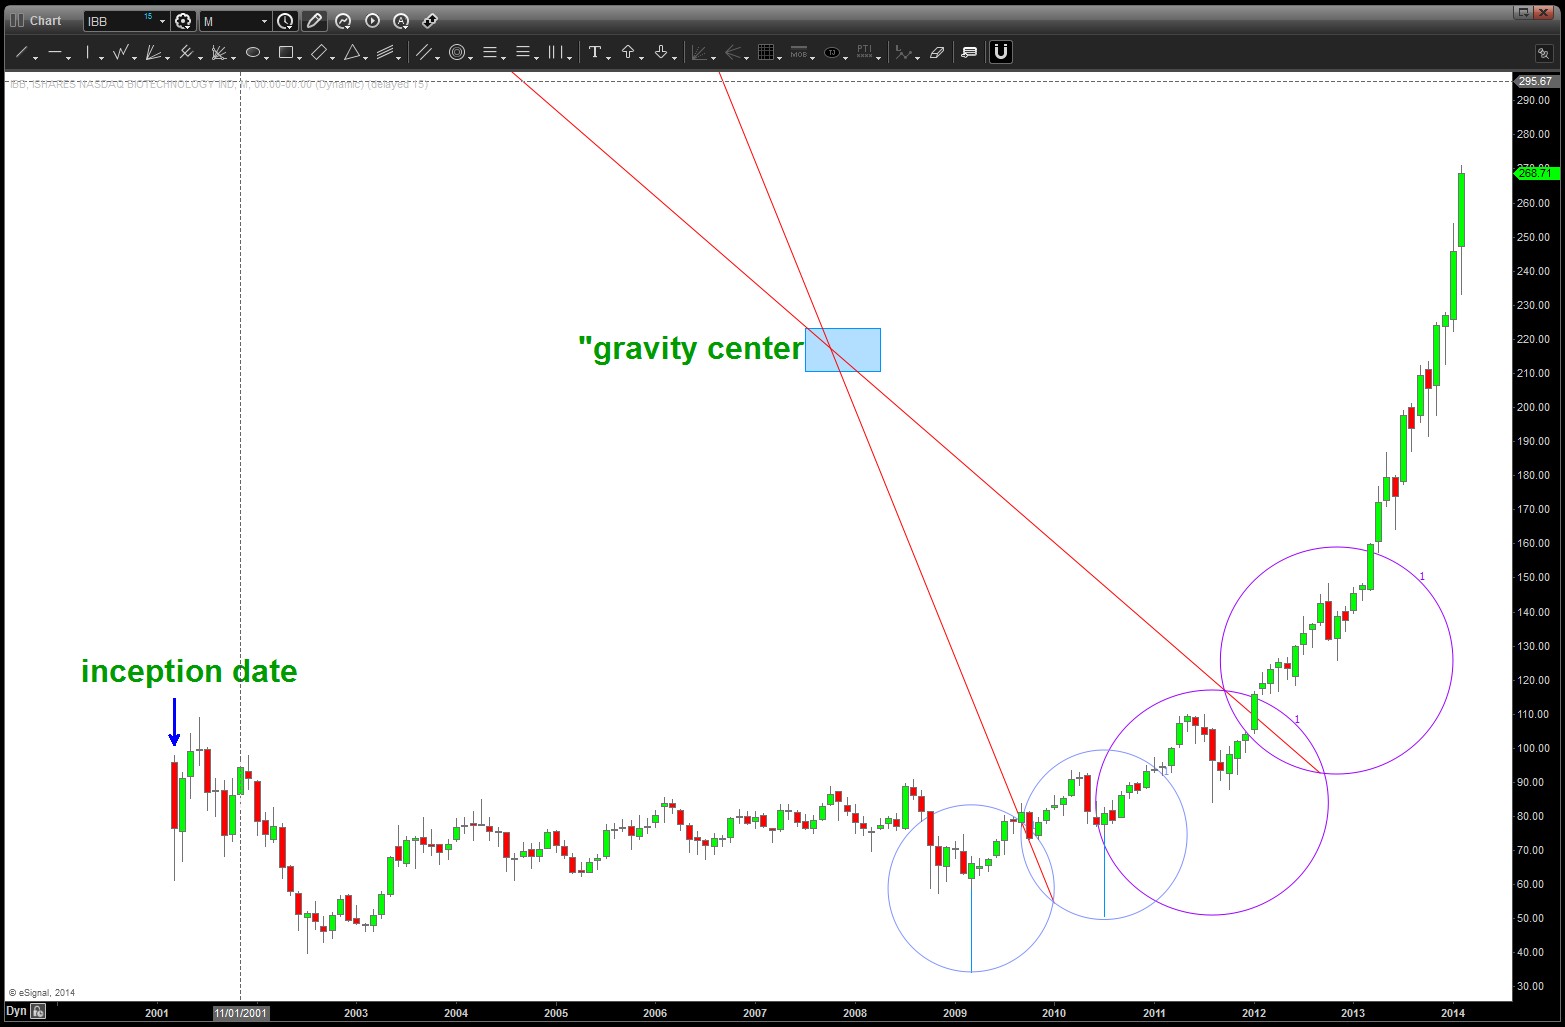
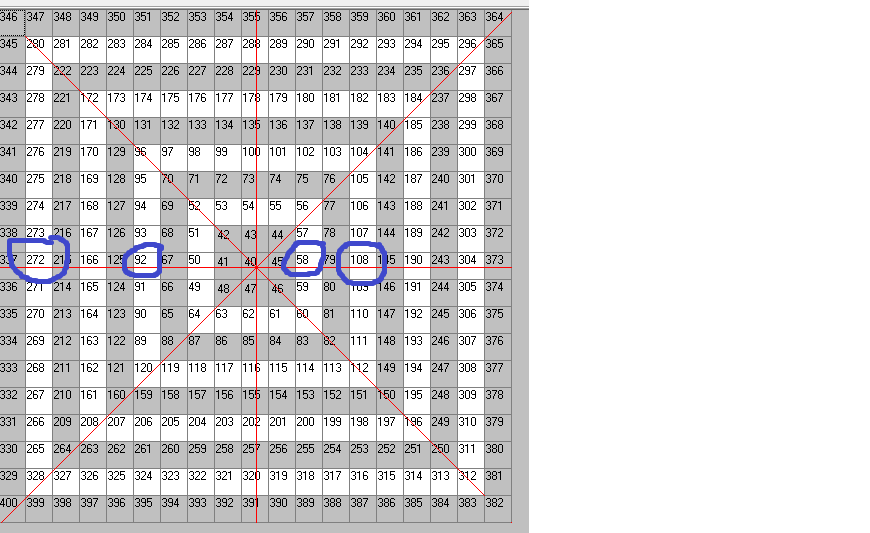
Anyway, take a peak at the below and try to follow me … let me know if you have any questions. Sir Issac Newton is still correct about this thing called gravity.
Everything you learned in elementary school geometry is all you need …
Rock on, ok?
Bart
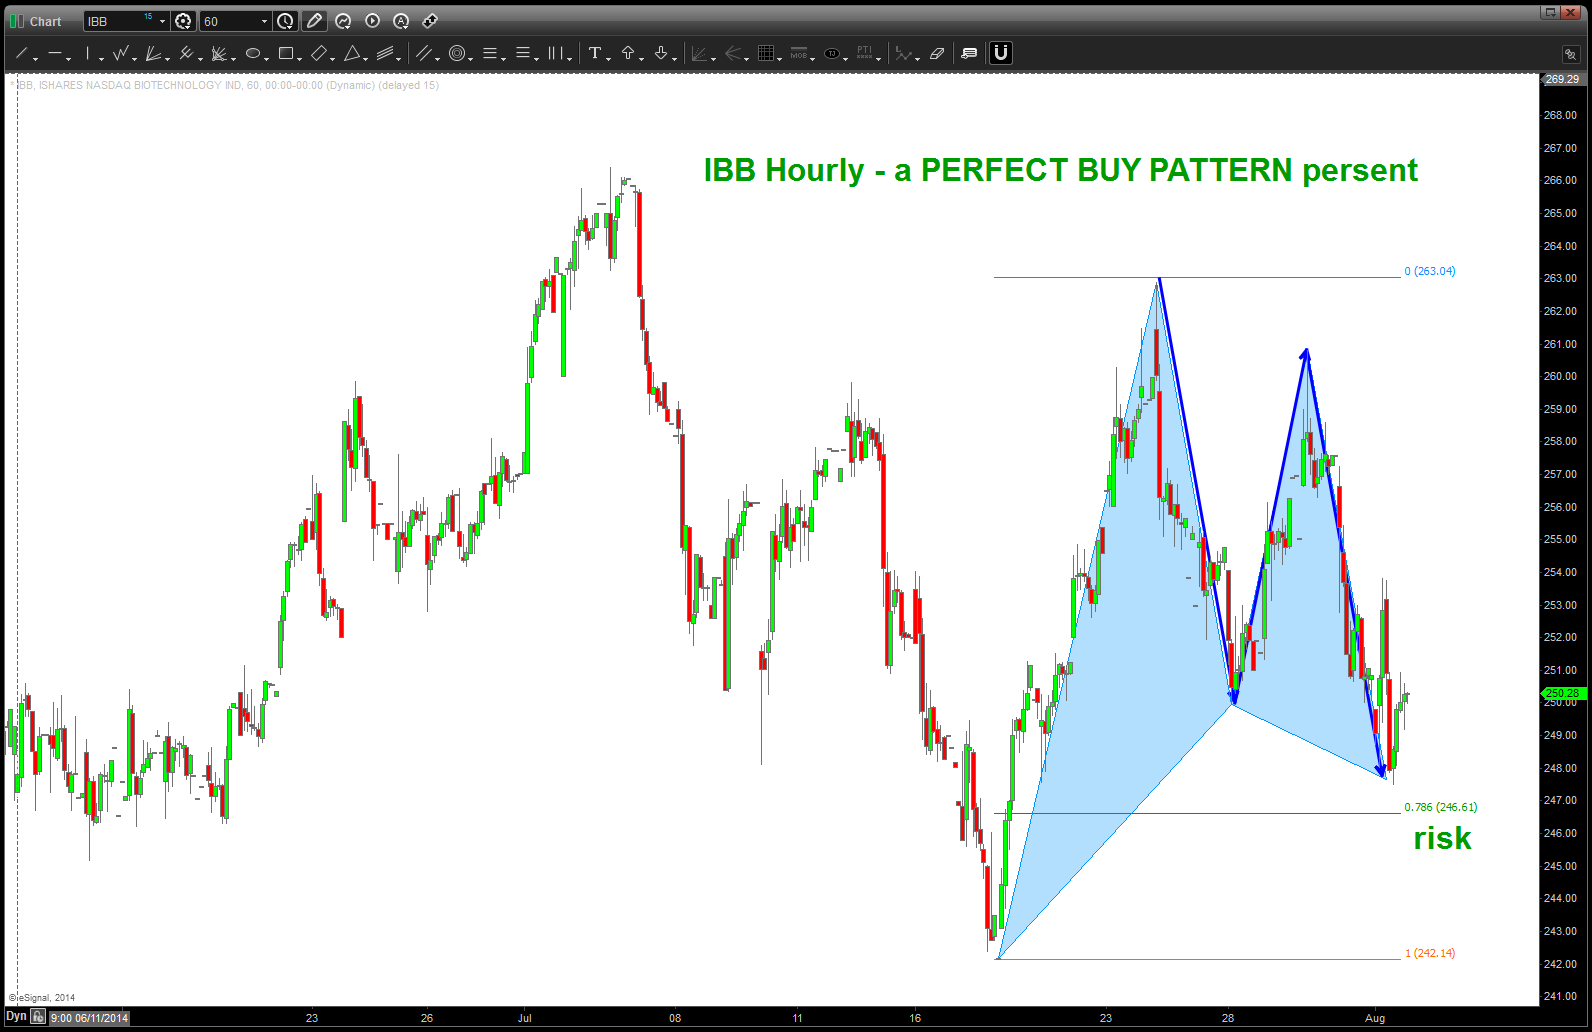
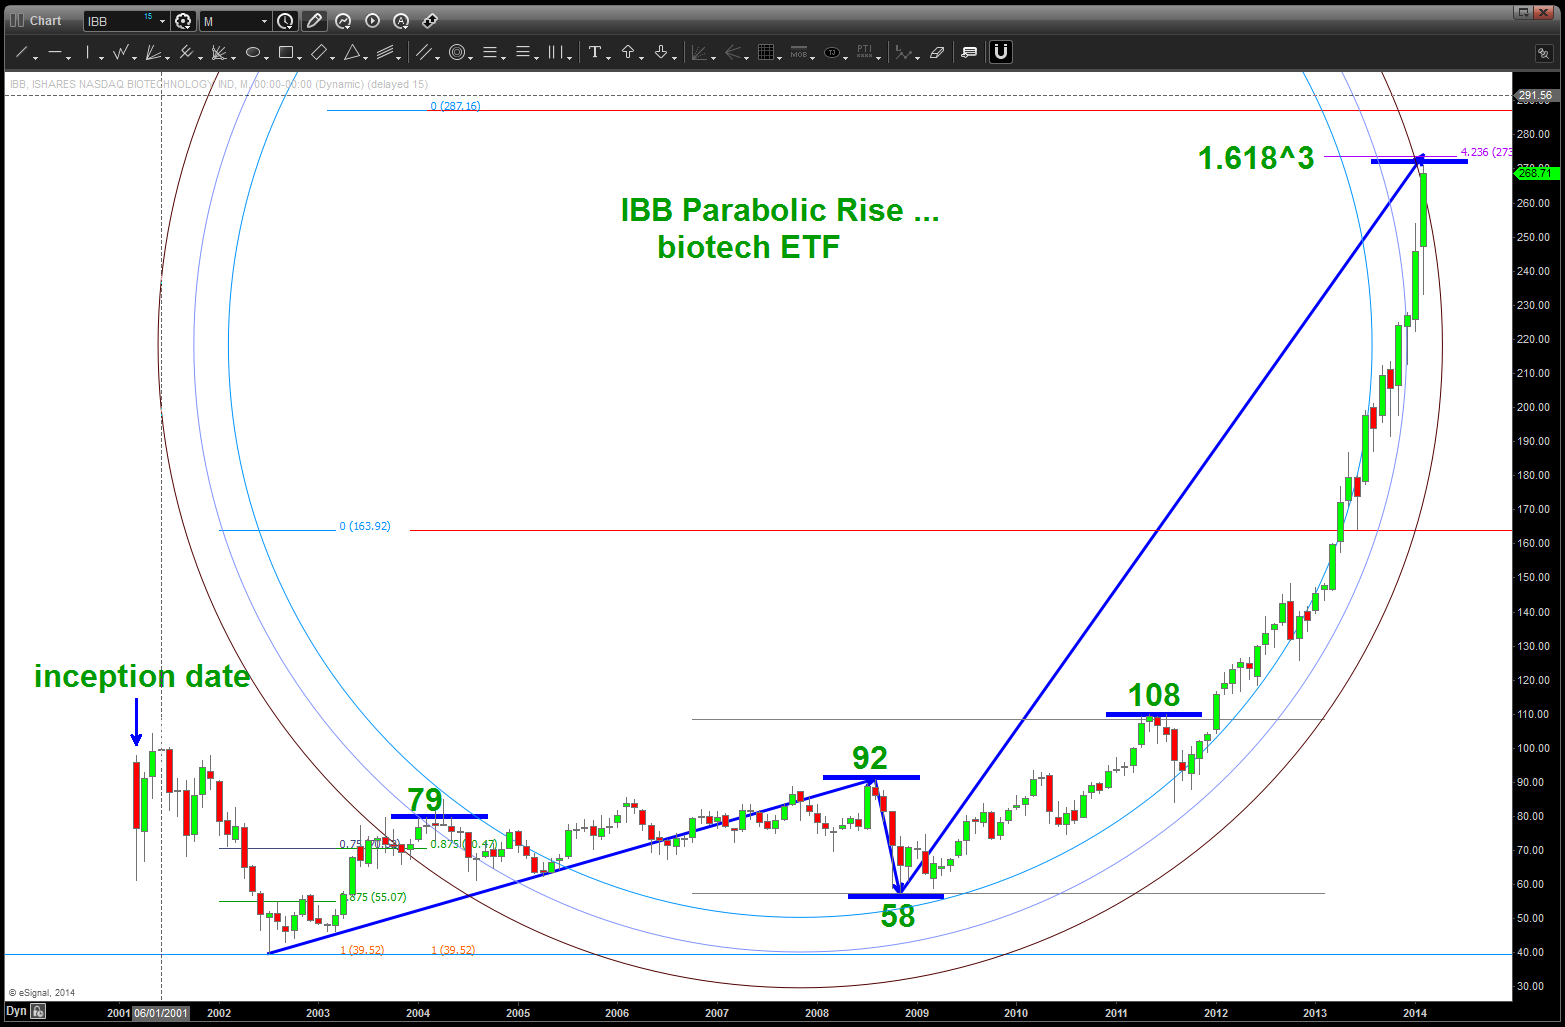
they don’t come any nicer than this BUY pattern on IBB
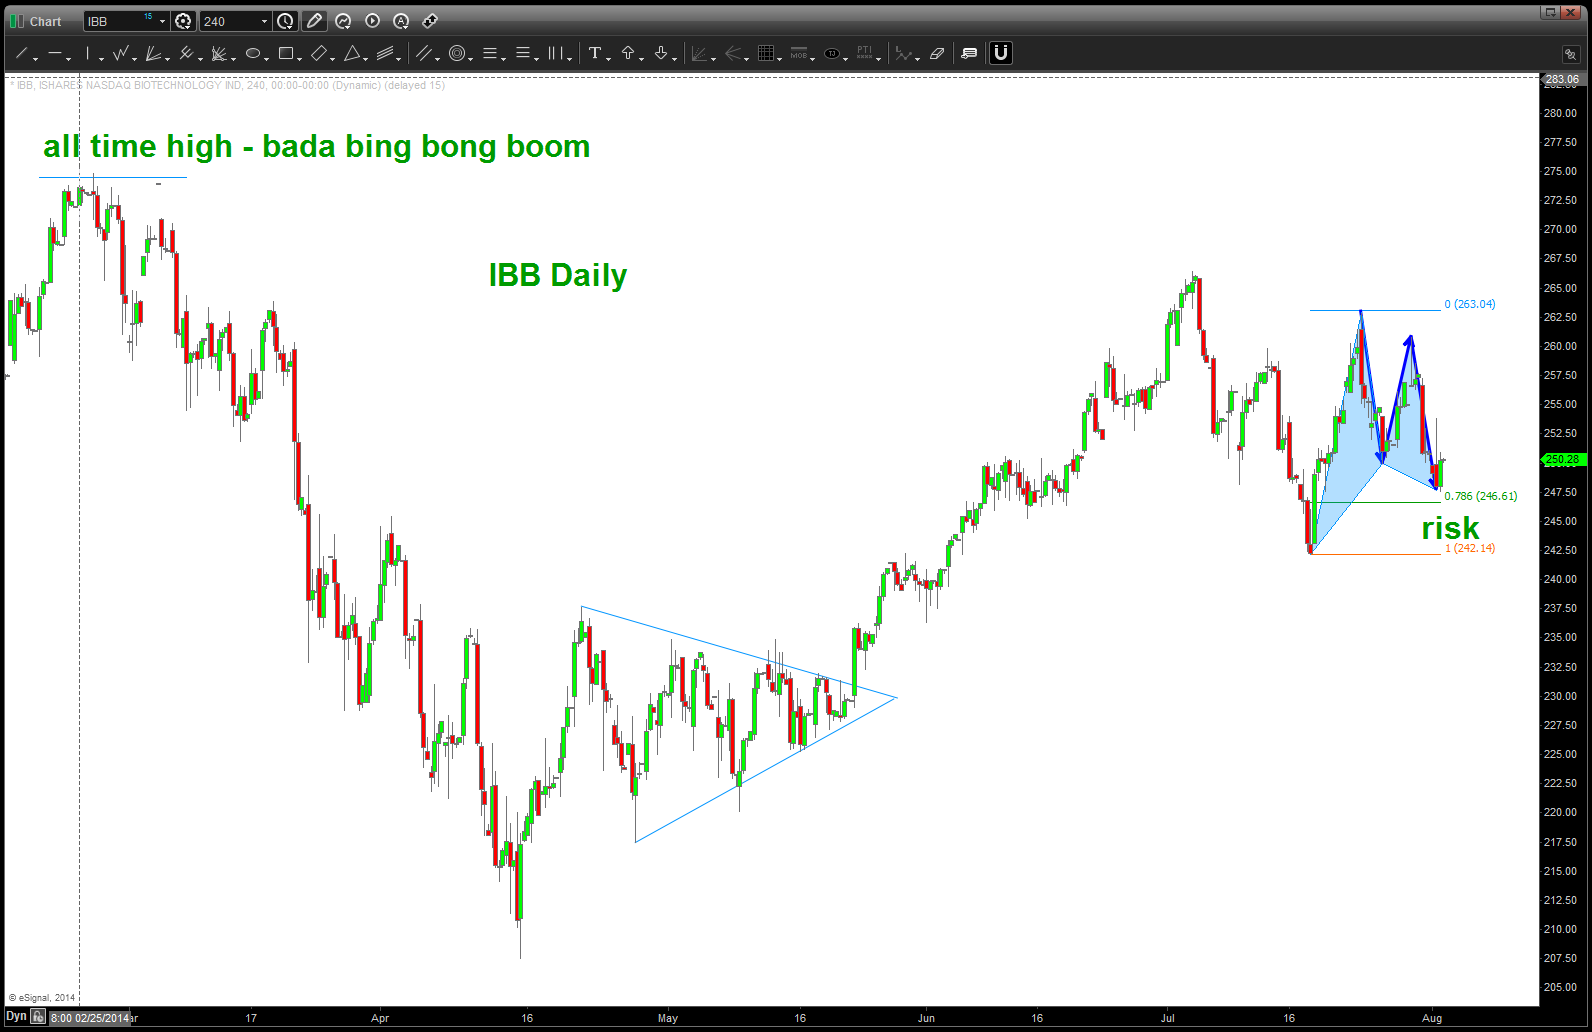
IBB Daily showing 1) all time high and 2) the BUY pattern present
CLIFF NOTES (my wife says I’m to verbose and geeky (she’s correct) so she always says “just give me the cliff notes”)
- IBB Biotech ETF is in the parabolic stage. Very tough to develop targets in this type of environment (straight up) but an attempt is made.
- At the first sign of a daily signal reversal candle would look at closing a lot or all of any long position // take a crack at a short – it’s going to be a marvelous ride down
DETAILS:
if you click on the link below, you’ll see “real time” the EXACT high on APPLE using simple geometry we learned in elementary school:
per the title of this post, the basic effect of gravity has yet to be proven wrong. what goes up WILL come down unless we blow thru the earths atmosphere and cruise along in space w/ Sandra Bullock. And, why not? the stock market is NEVER going to come down and it’s different this time ….
but alas, someone has to try … the charts below are an attempt to 1)call for caution w/ regards to this parabolic rise and 2) demonstrate some techniques to obtain price targets. Full disclosure – don’t be impressed w/ AAPL. (see my GOOG posts) It’s simply PATTERNS and some work and some don’t. Most of the time they do …it’s an edge, I believe in that edge and the rest is history. ENJOY …
sure looks like the NASDAQ in 2000 … parabolic UP and then down hard …
All Ordinaries .. wonder why it has that name? Sell Pattern inbound …
Posted on August 22, 2014 Leave a Comment
CLIFF NOTES: if you read this blog then you know the pattern. Just like the German DAX the Aussie All Ordinaries showing a beautiful SELL pattern. It will WORK or NOT .. but here it is …
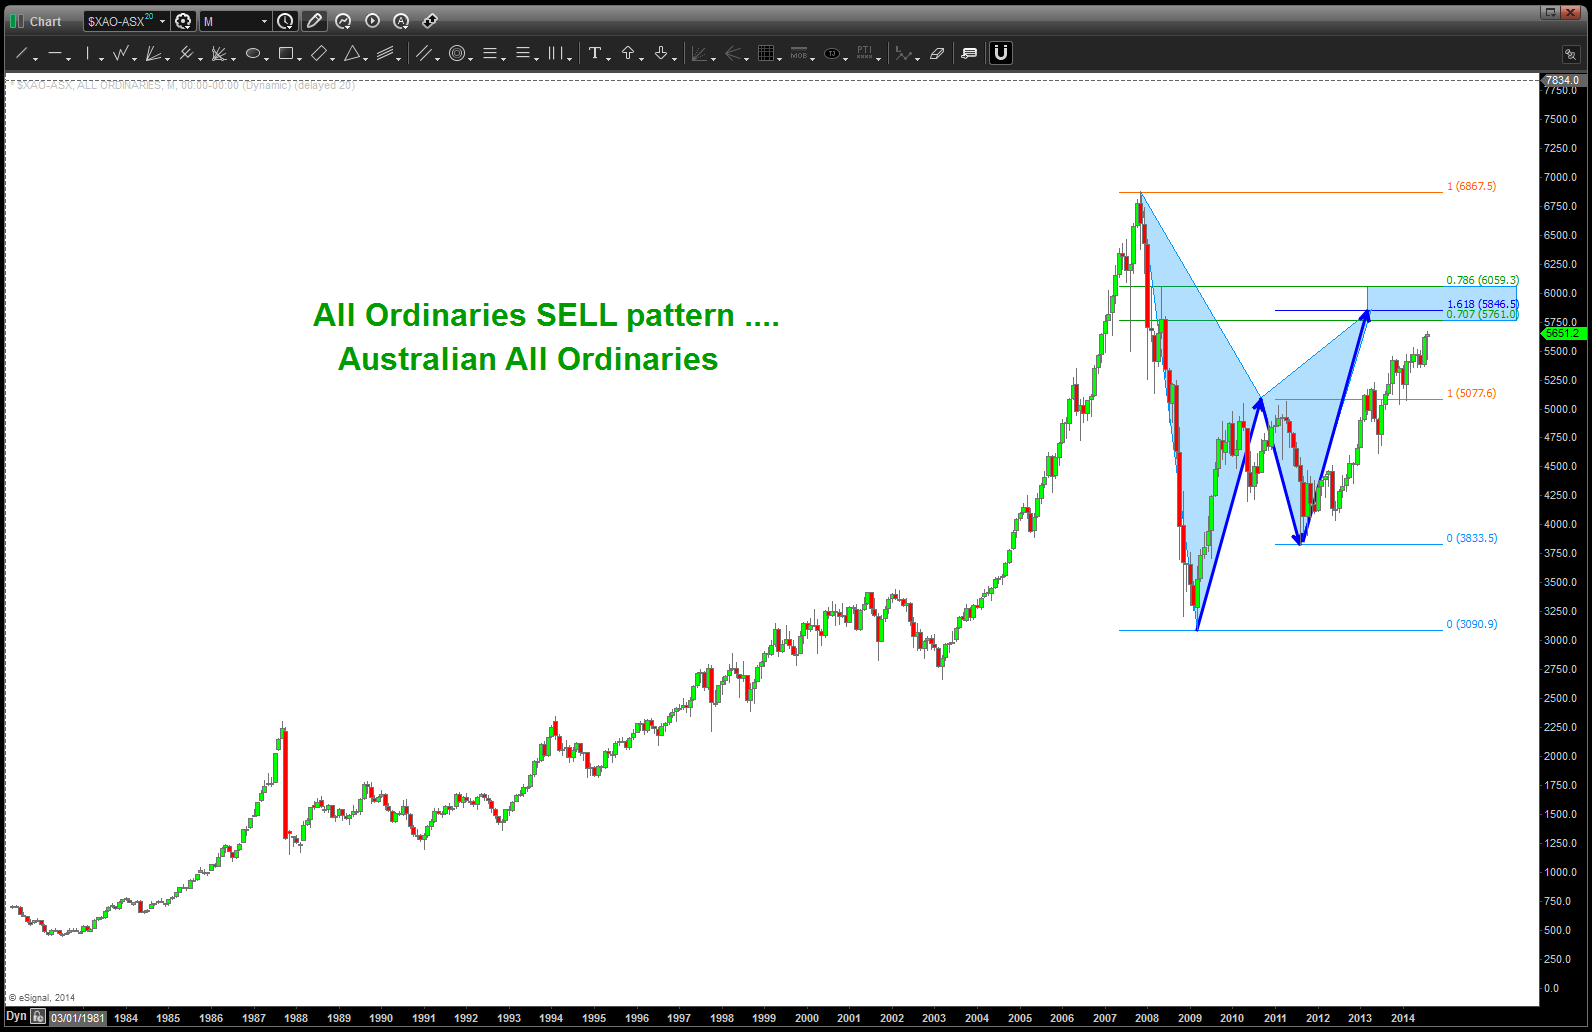
Aussie All Ordinaries
hey, OBTW, it’s a MONTHLY chart above …
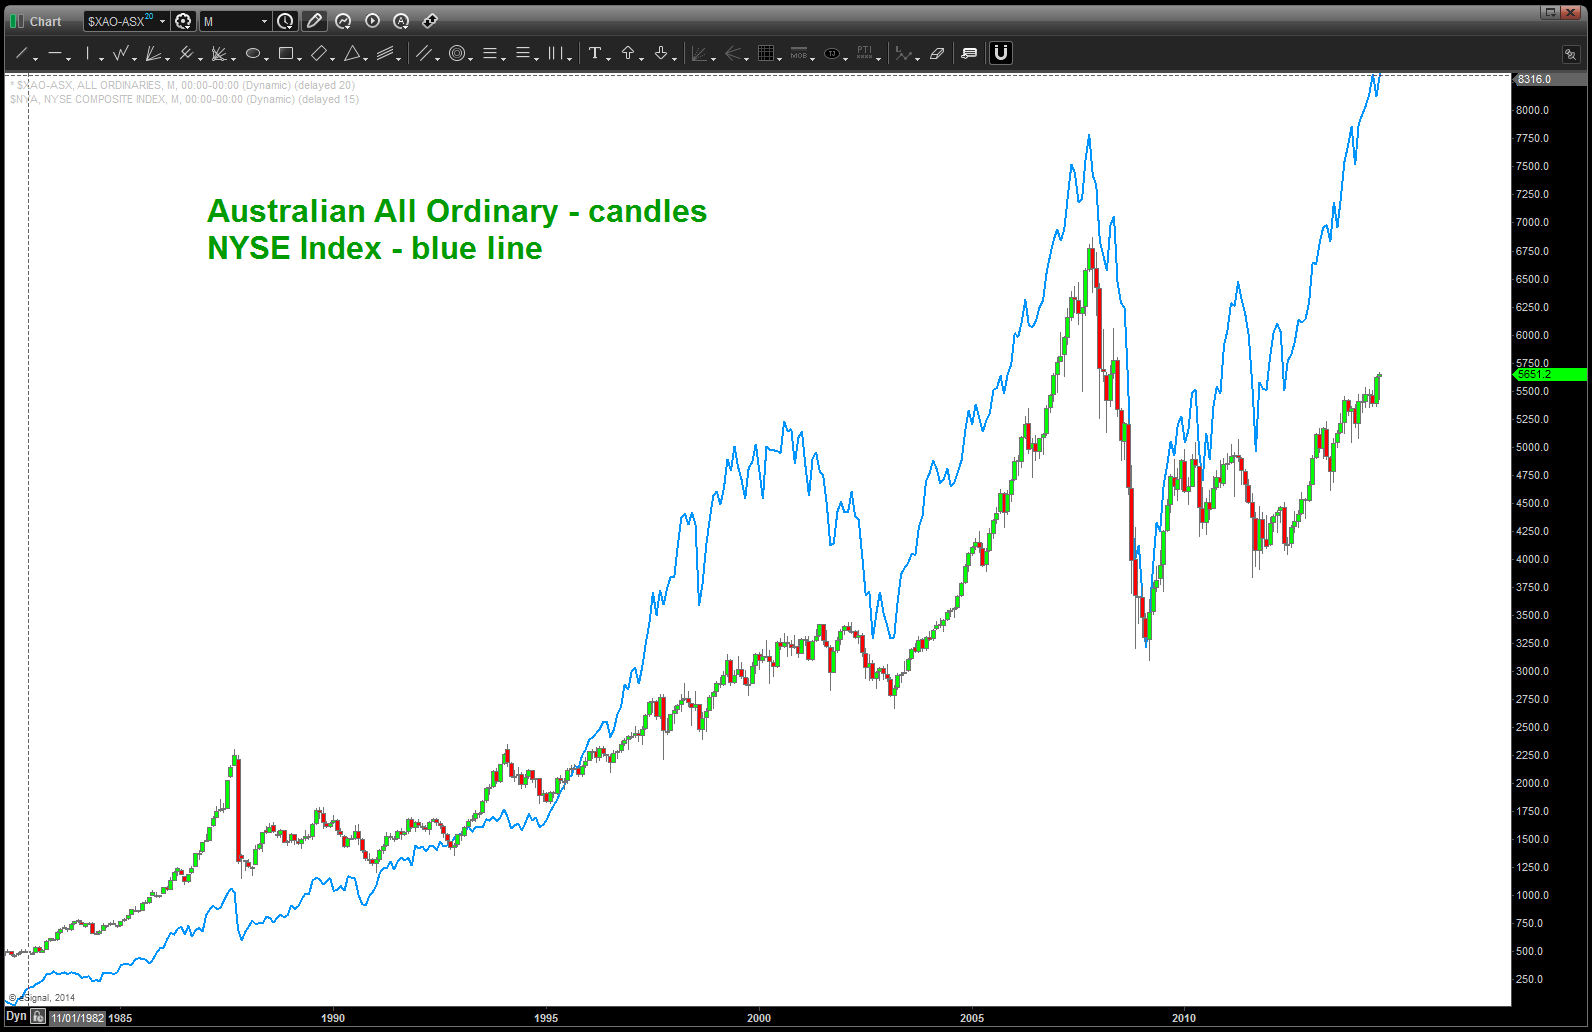
here’s the NYSE Index overlaid on top of the Aussie All Ordinaries — quite the divergence, hugh?
BAC – now that our 17 Billion dollar fine is behind us …
Posted on August 21, 2014 Leave a Comment
CLIFF NOTES: BAC (Bank of America) – not so fast. Here’s the monthly chart showing “why” BAC finally bottomed in/around 2 bucks. I see major resistance coming in 1) mirror image foldback potential, 2) daily sell signal (shown below) and 3) a monthly pattern culminating in around 21-13. Believe anything above 24 is an abomination and … that would be the “long term risk” Here’s the rub … this SELL pattern is one that should be BOUGHT for a long term run in BAC. If our mirror image foldback is correct, we’ll get a plunging low and then BUY it ….
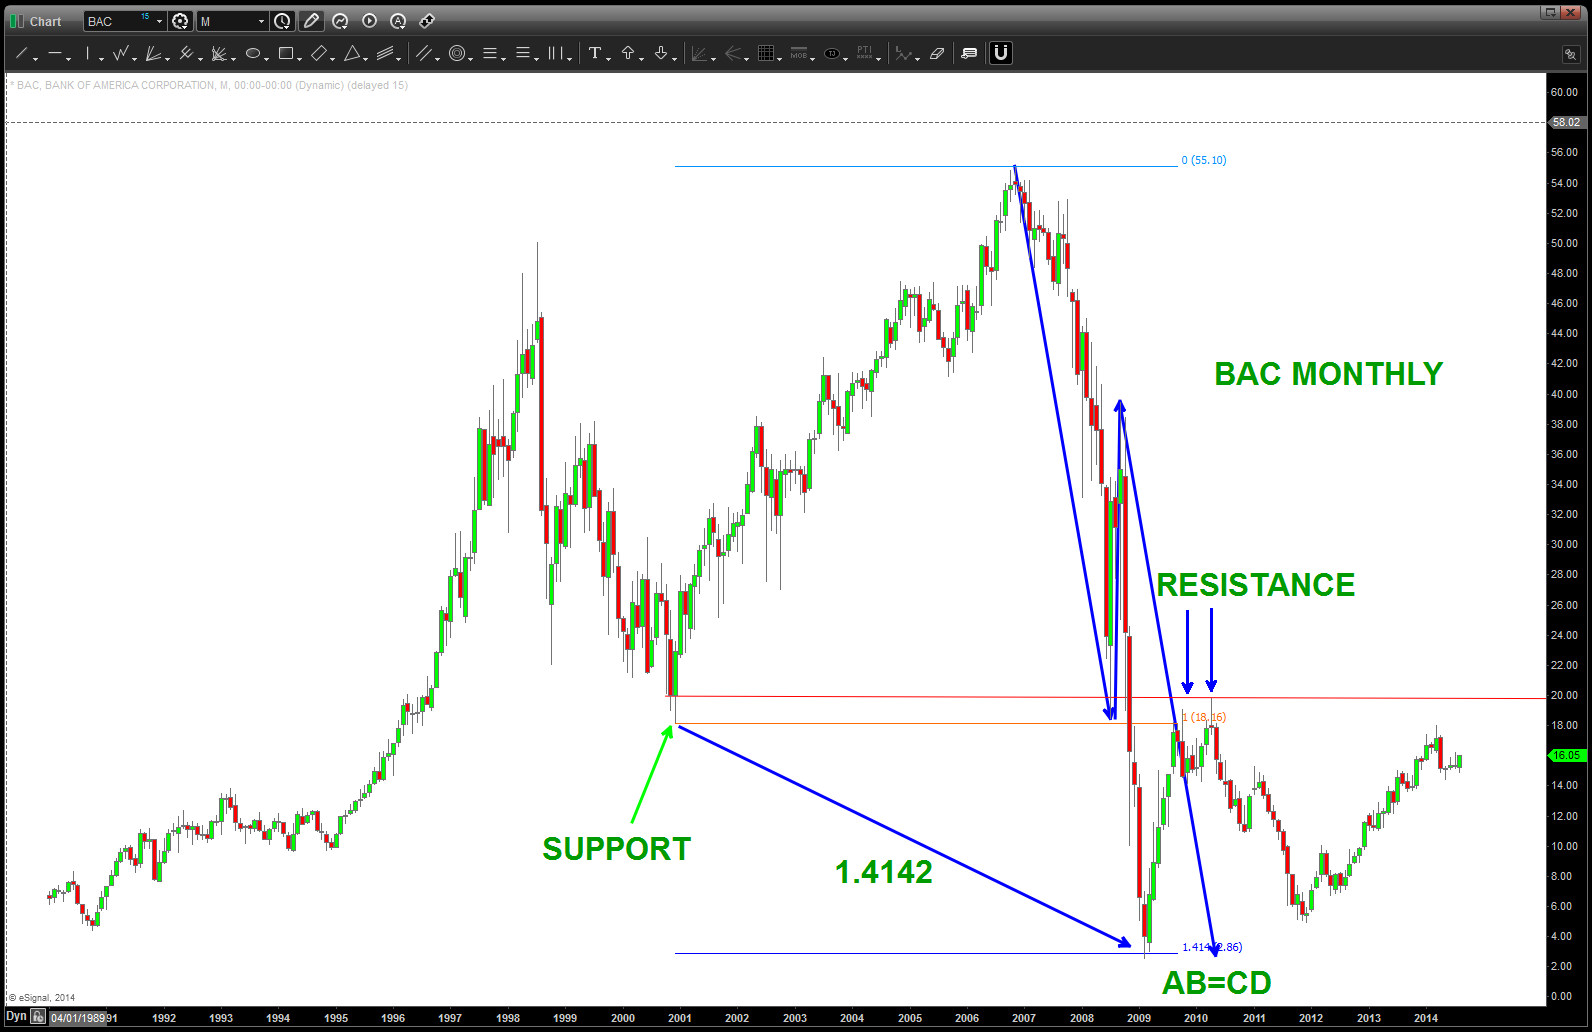
PATTERNS behind the low in BAC
here’s the longer term pattern:
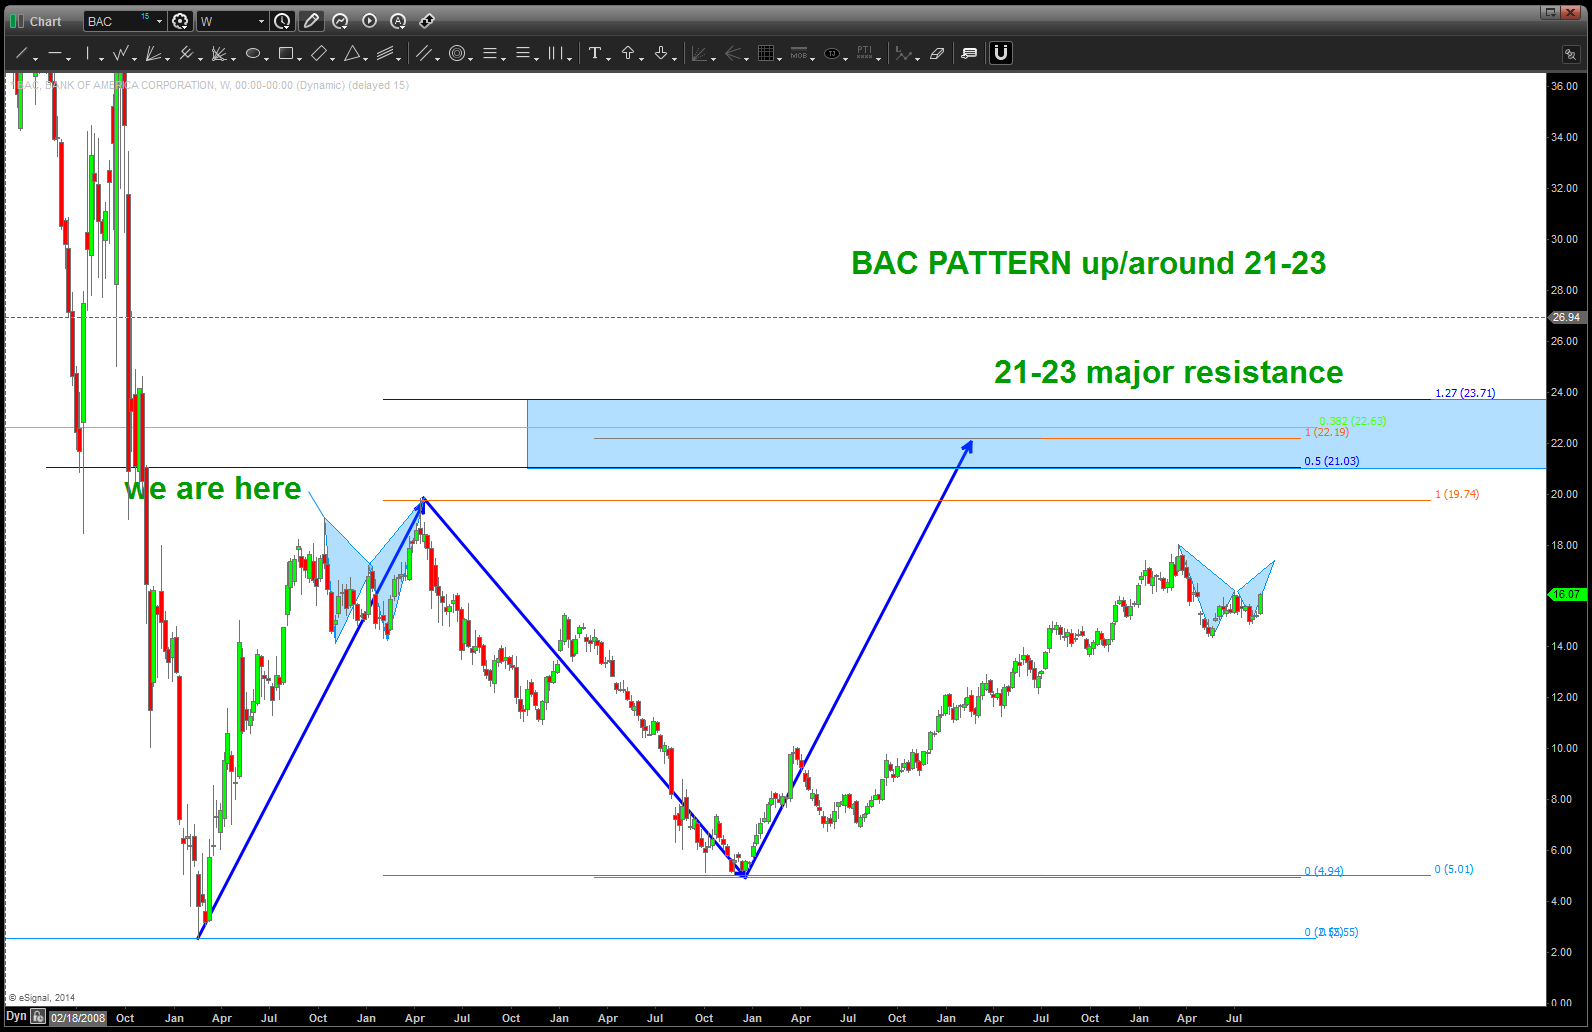
BAC PATTERN up at 21-23
here’s the foldback pattern that would be “perfect” to let us know where we are …
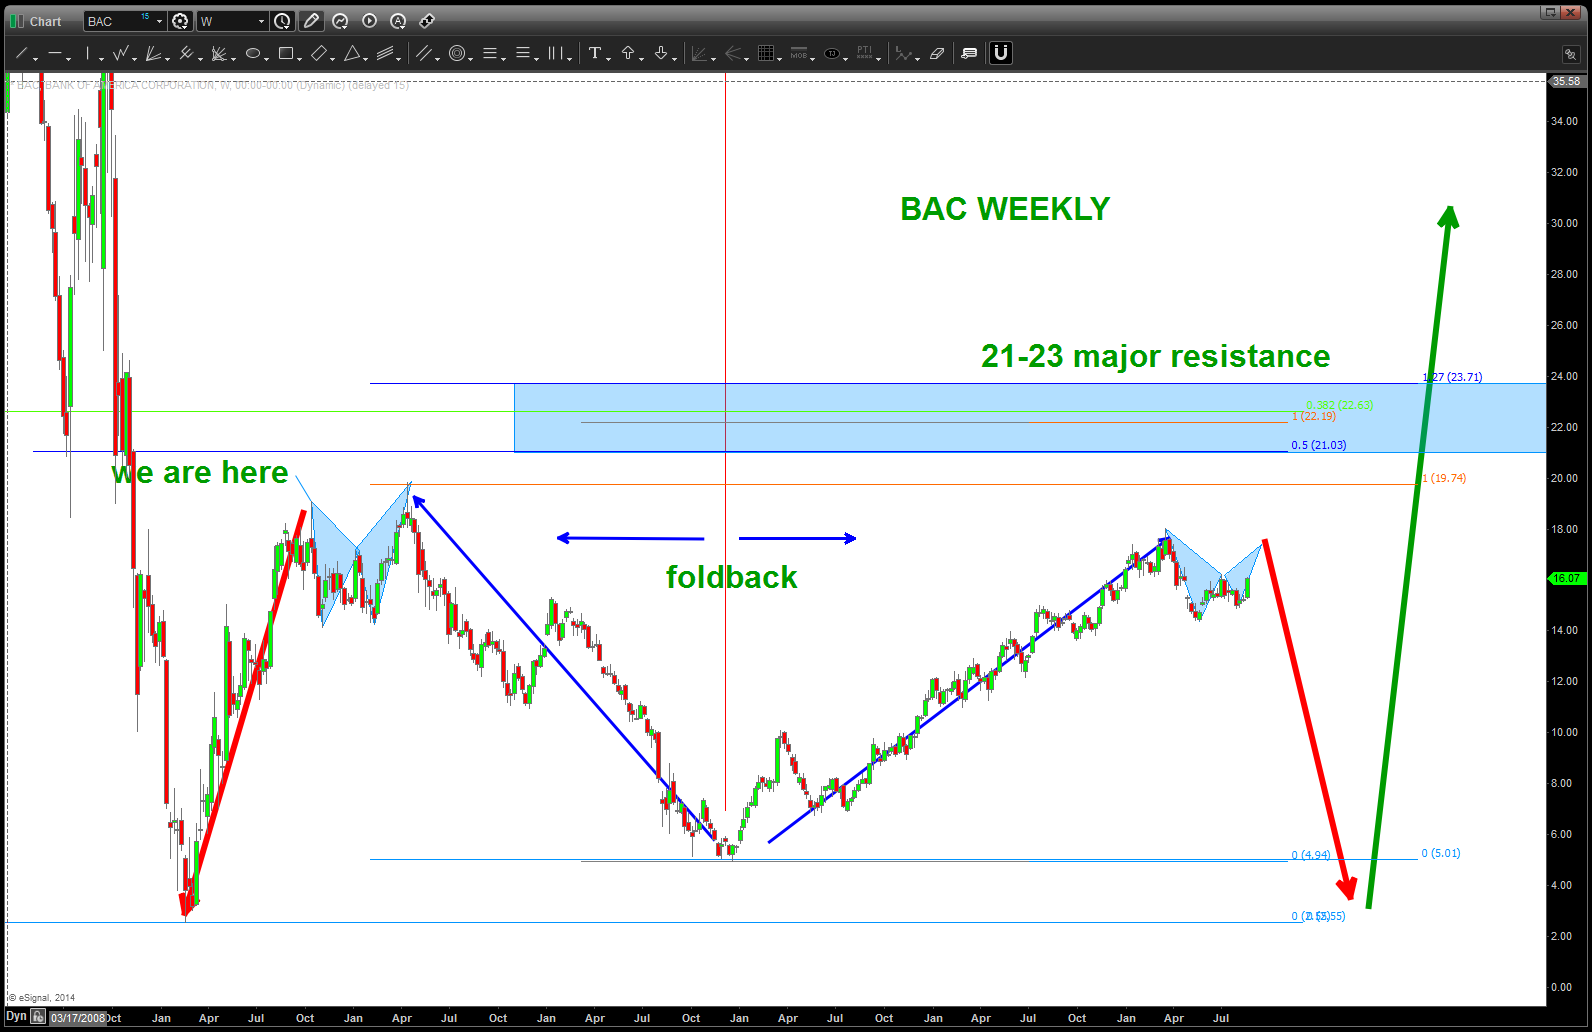
BAC foldback pattern
here’s where I think the “first” sell opportunity is w/ the current structure and move occurring …
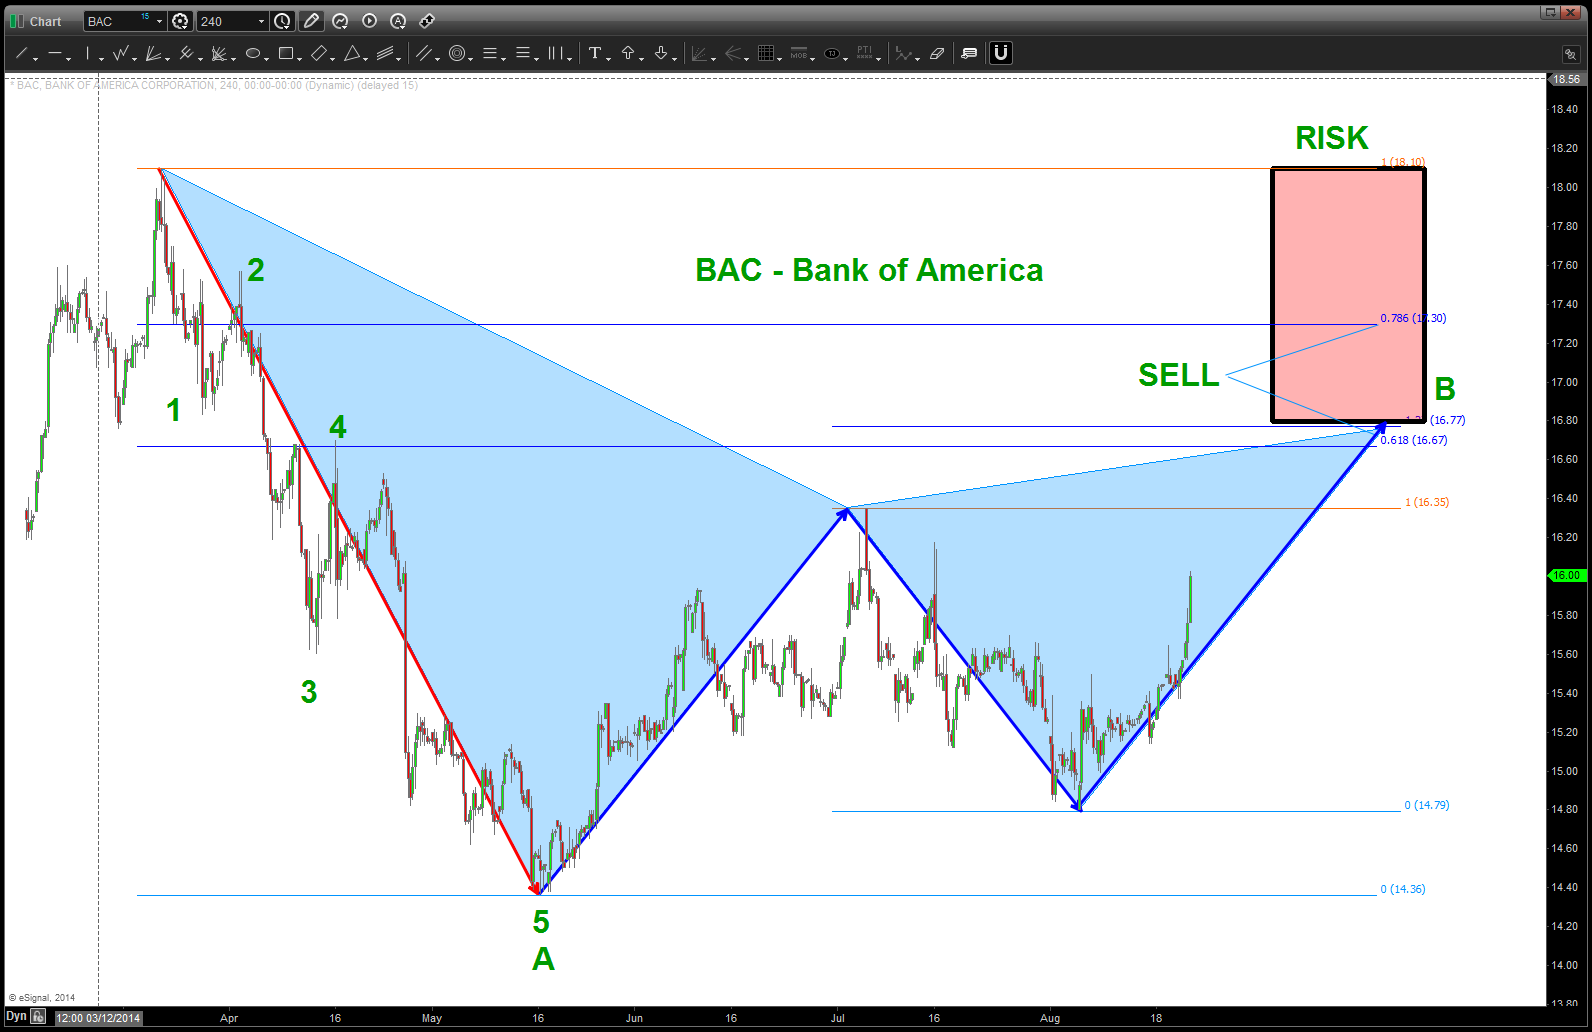
if the foldback is going to work THEN here’s an opportunity level to get in on it
#ouch
Posted on August 21, 2014 Leave a Comment
Cliff notes: major pattern from all time low on HD got smoked at 85-87. HOWEVER, let’s take a look at what the long term is showing …it’s showing 5 waves folks so in/around here 105-110 or 130 this should represent an end of move. But for now … anyone got a “cut man” for the corner?

hey … NOTICE he’s smiling … got run over by HD but still smiling! 🙂
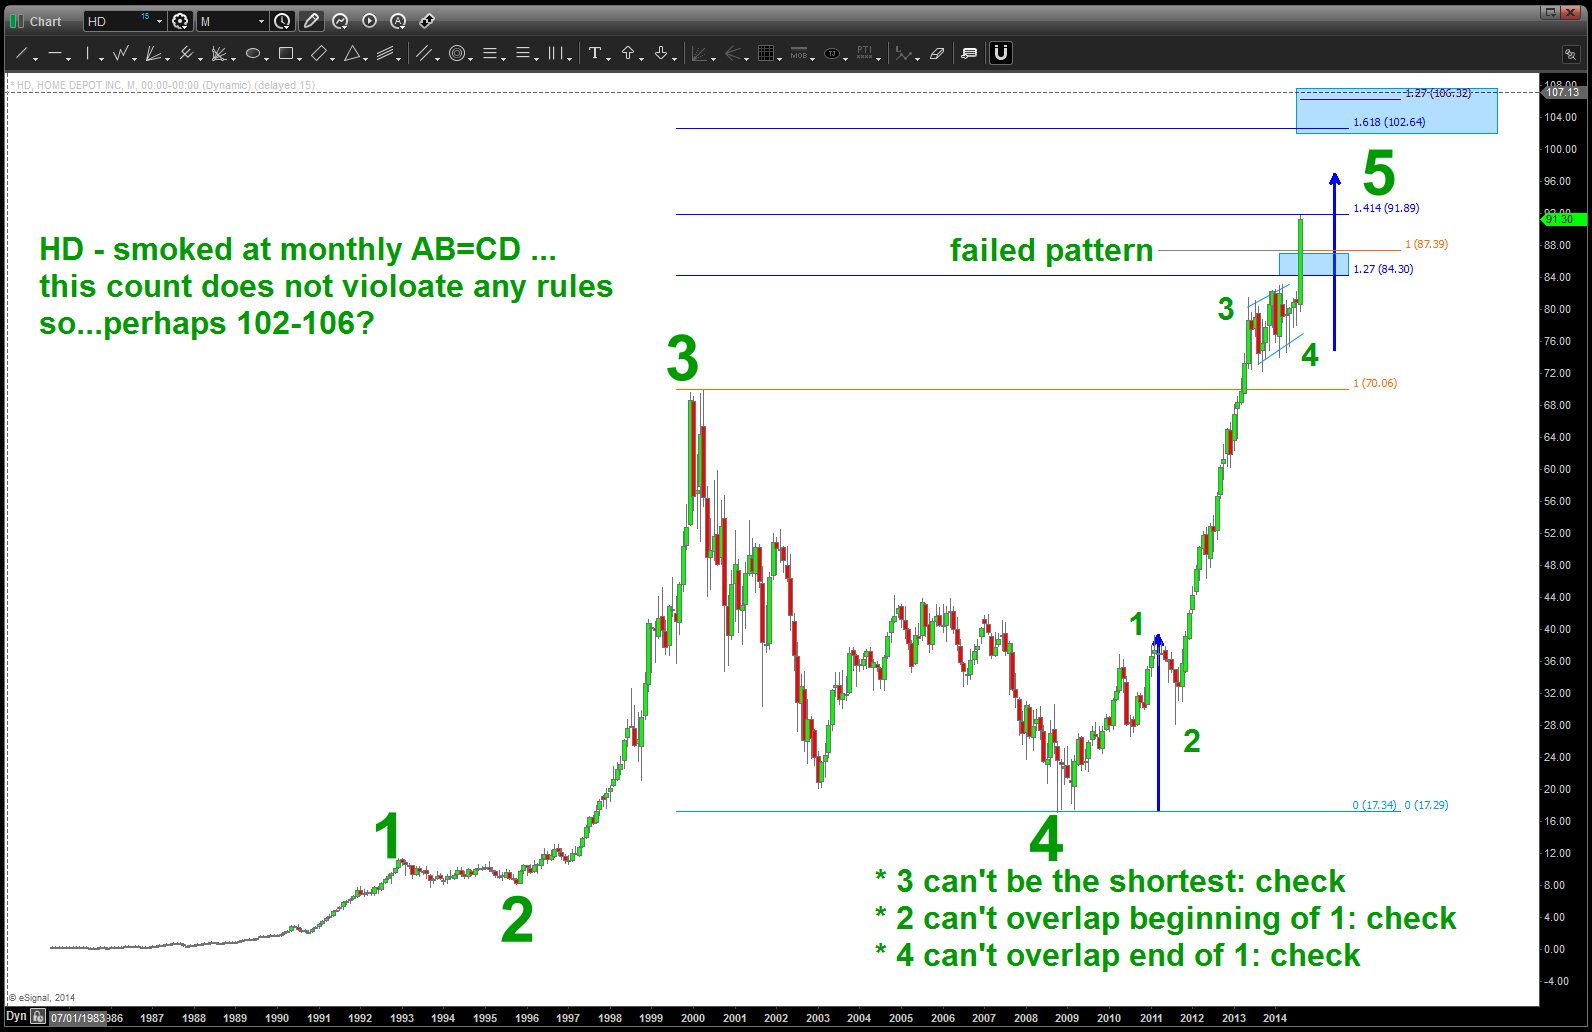
I see 5 waves …
Gorilla’s put dynamite down for now …reload after dollar pulls back. (the dynamite is the 4 trillion/day FX market)
Posted on August 21, 2014 Leave a Comment
Summary: perhaps, it’s my background as a Naval Aviator for 11 years. I just read a post about “fighter pilots and organizations” and one of the points was the art of the debrief. so, as I post “stuff” on this blog I attempt to make it all “real time” because those snap shots allow me to “adapt and overcome” (my favorite Naval Aviation saying) and see where we are in the game plan moving forward.
Cliff notes: the first target we had for the dollar index has been taken out but we have another target, shown below, that “should” cause resistance/pull back. Folks, this thing could break wide open and explode (reference HD pattern) but I’m looking to “enter” and will wait for a pattern to form so I can MANAGE RISK. I will not “just enter” and put a random stop “there” …. no, I will wait and wait and wait and wait and wait till the pattern appears. So, here’s another one below:
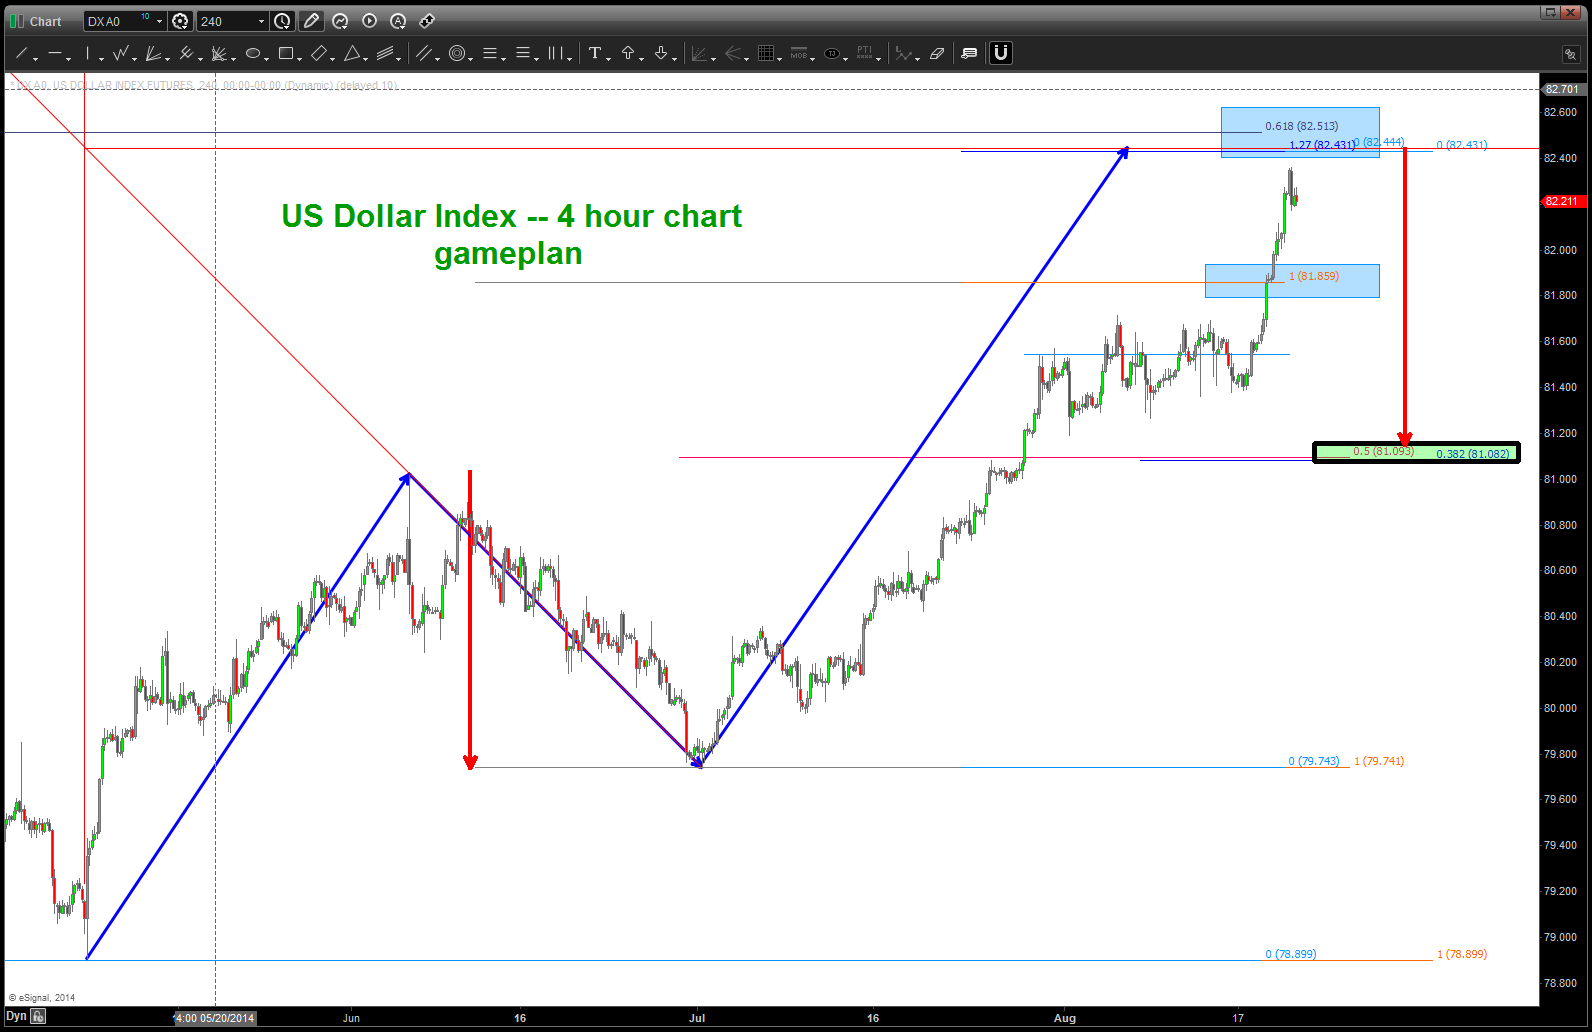
a POTENTIAL gameplan …up to 82.40-82.50 and then BUY at/around 81.09
Euro makes up, roughly 50%+ of the index so what is going on there ….?
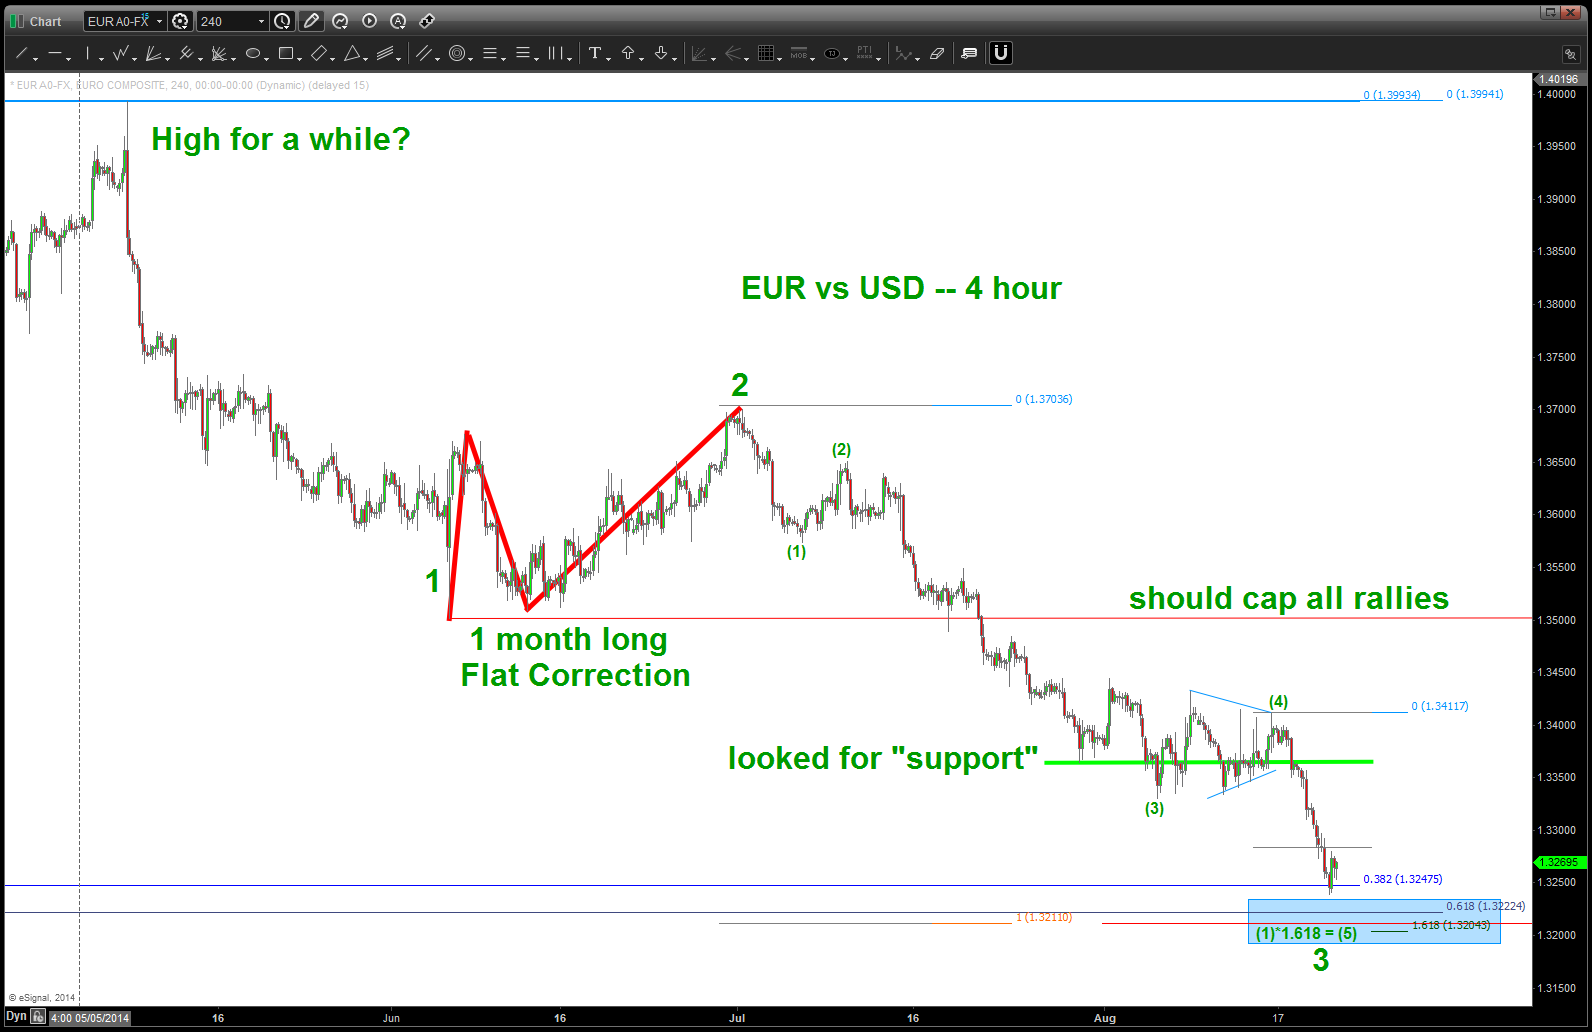
EURO vs USD – finishing a 3rd for a bounce … ?
how about the Swissy …?
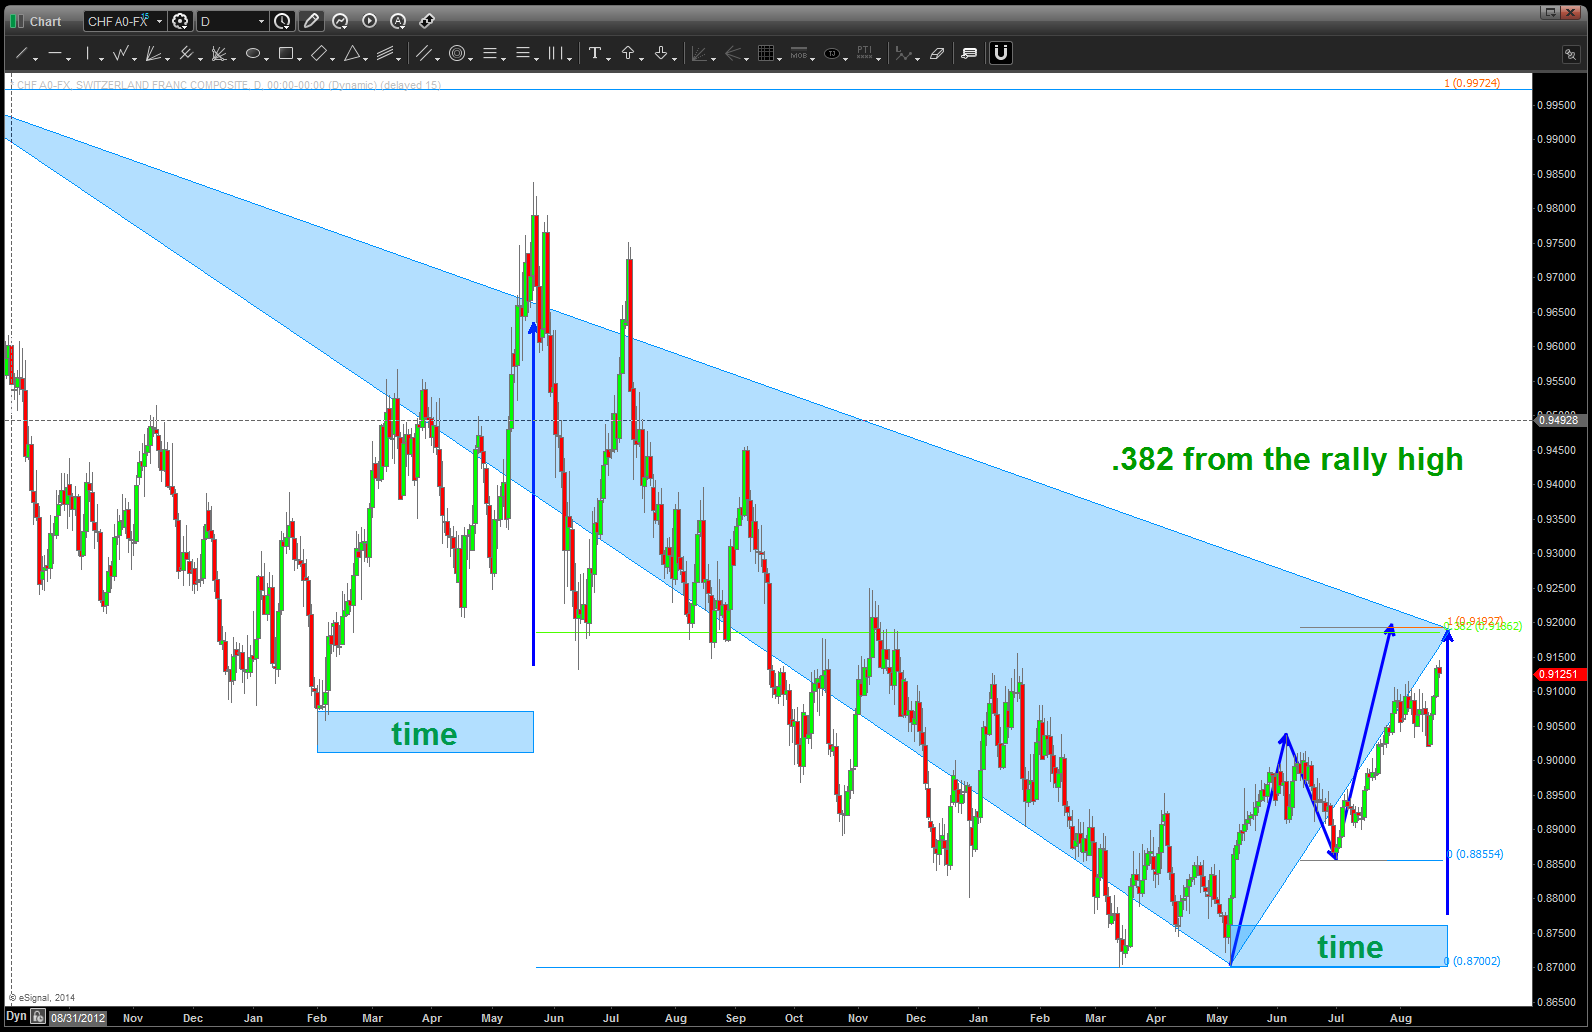
Swissy … pattern just a little higher?
how about the GBP vs USD?
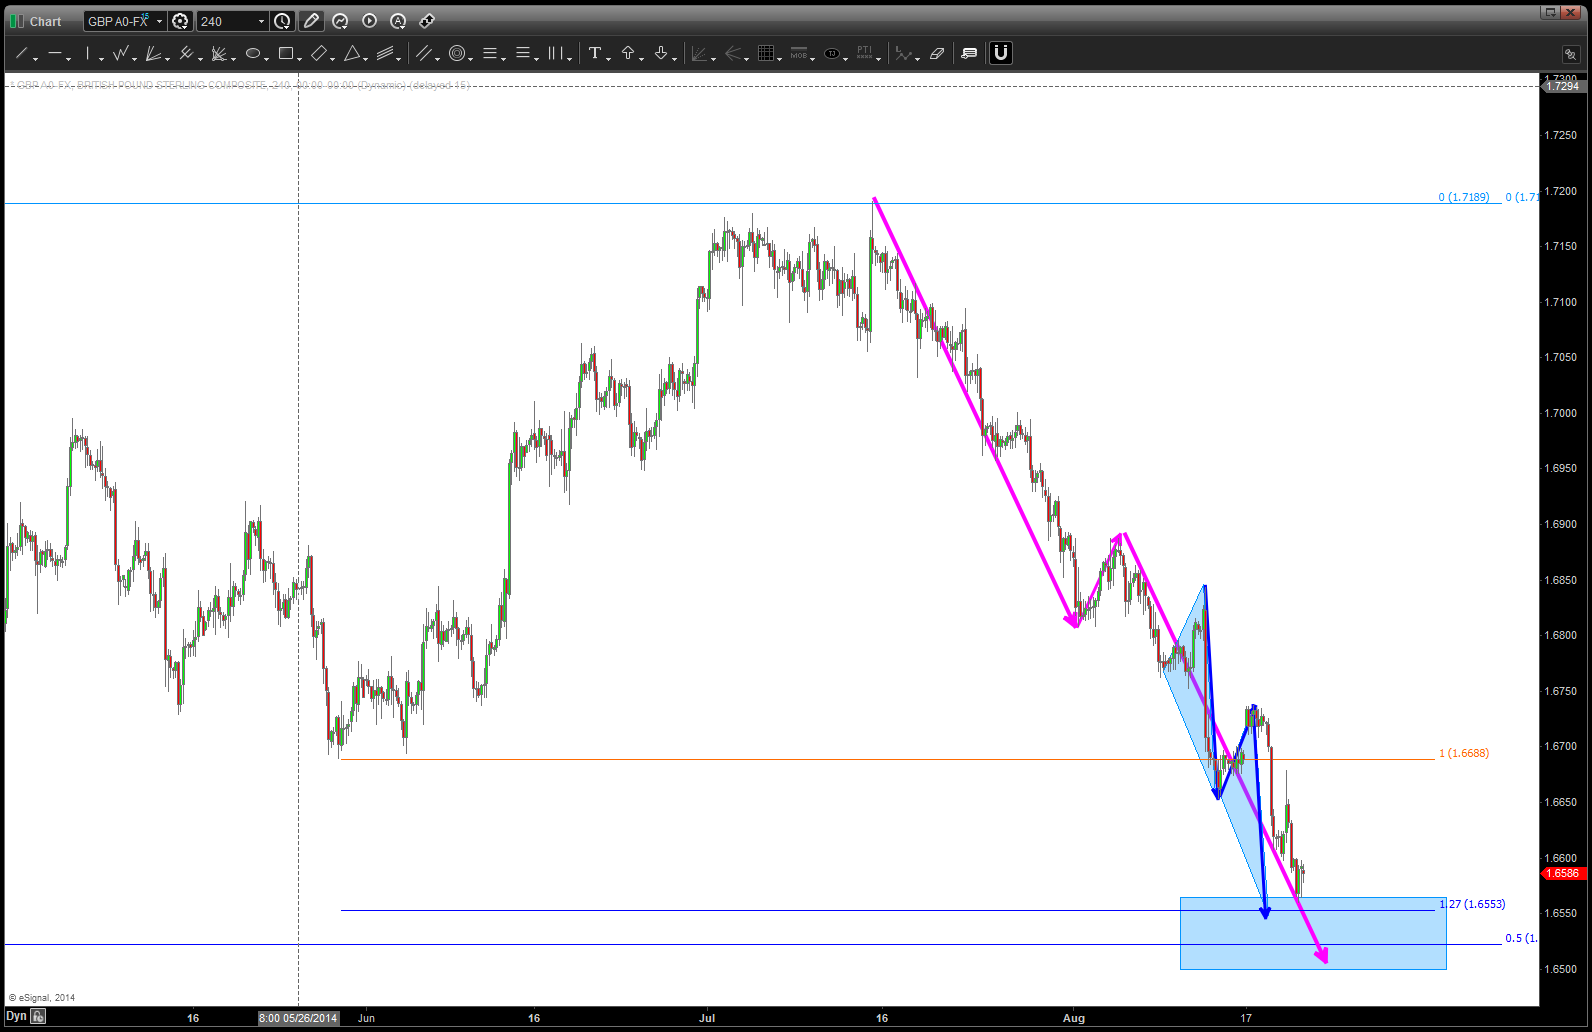
GBP showing some signs of a little lower … bounce
YEN vs USD …. nice little pattern up here (note NK225 yet to hit .786 and make higher highs …)
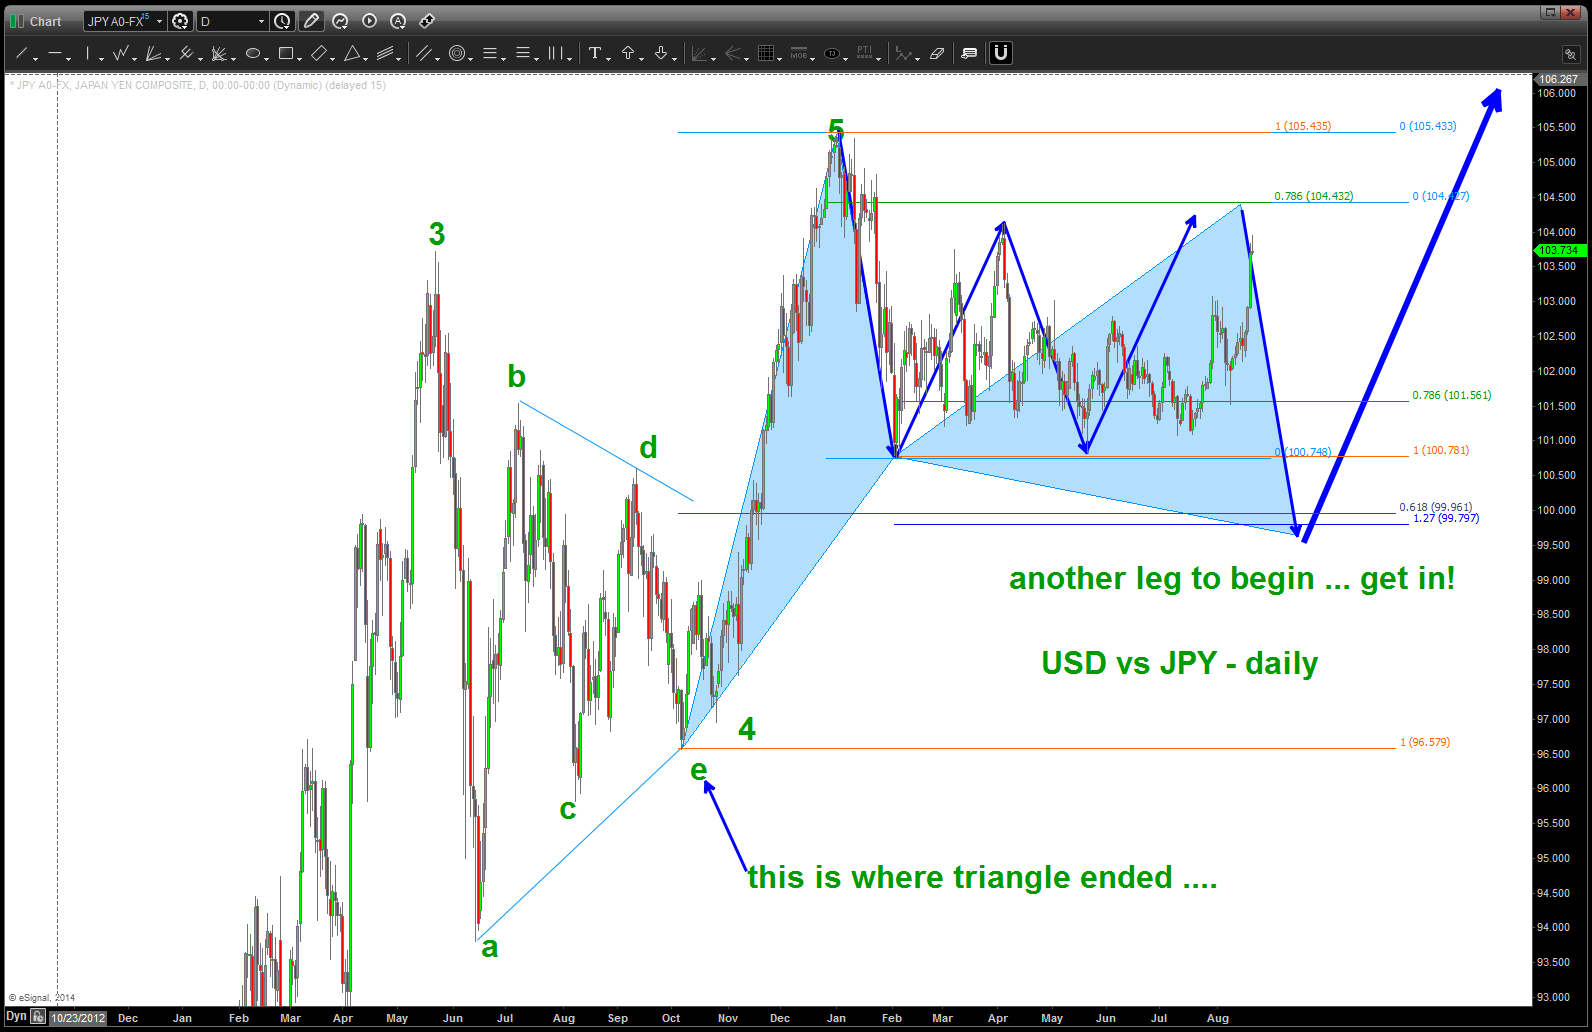
if we lose 104.43 to the upside then big potential the next move has occurred, looking for gameplan above to unfold
USD vs CAD — either a flat to end at 1.0850 or lower. Key is simple .. WATCH FOR 5 WAVES TO UNFOLD DOWN and then BUY at/around levels indicated for another run …
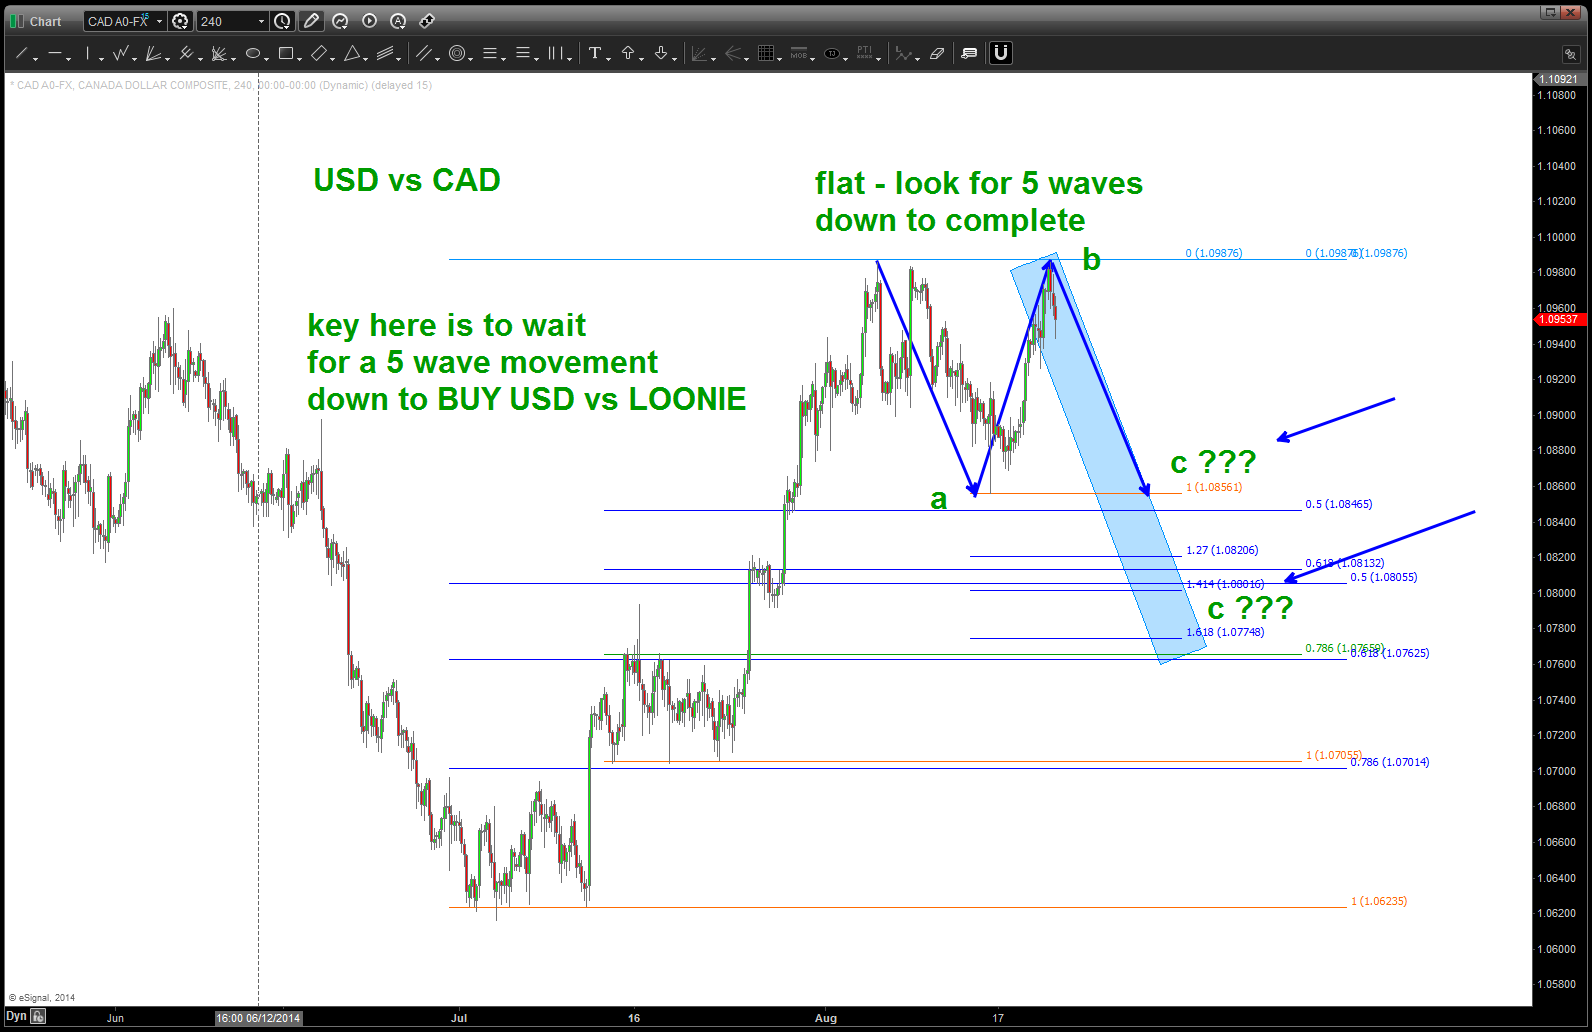
USD vs CAD
Aussie vs USD ….
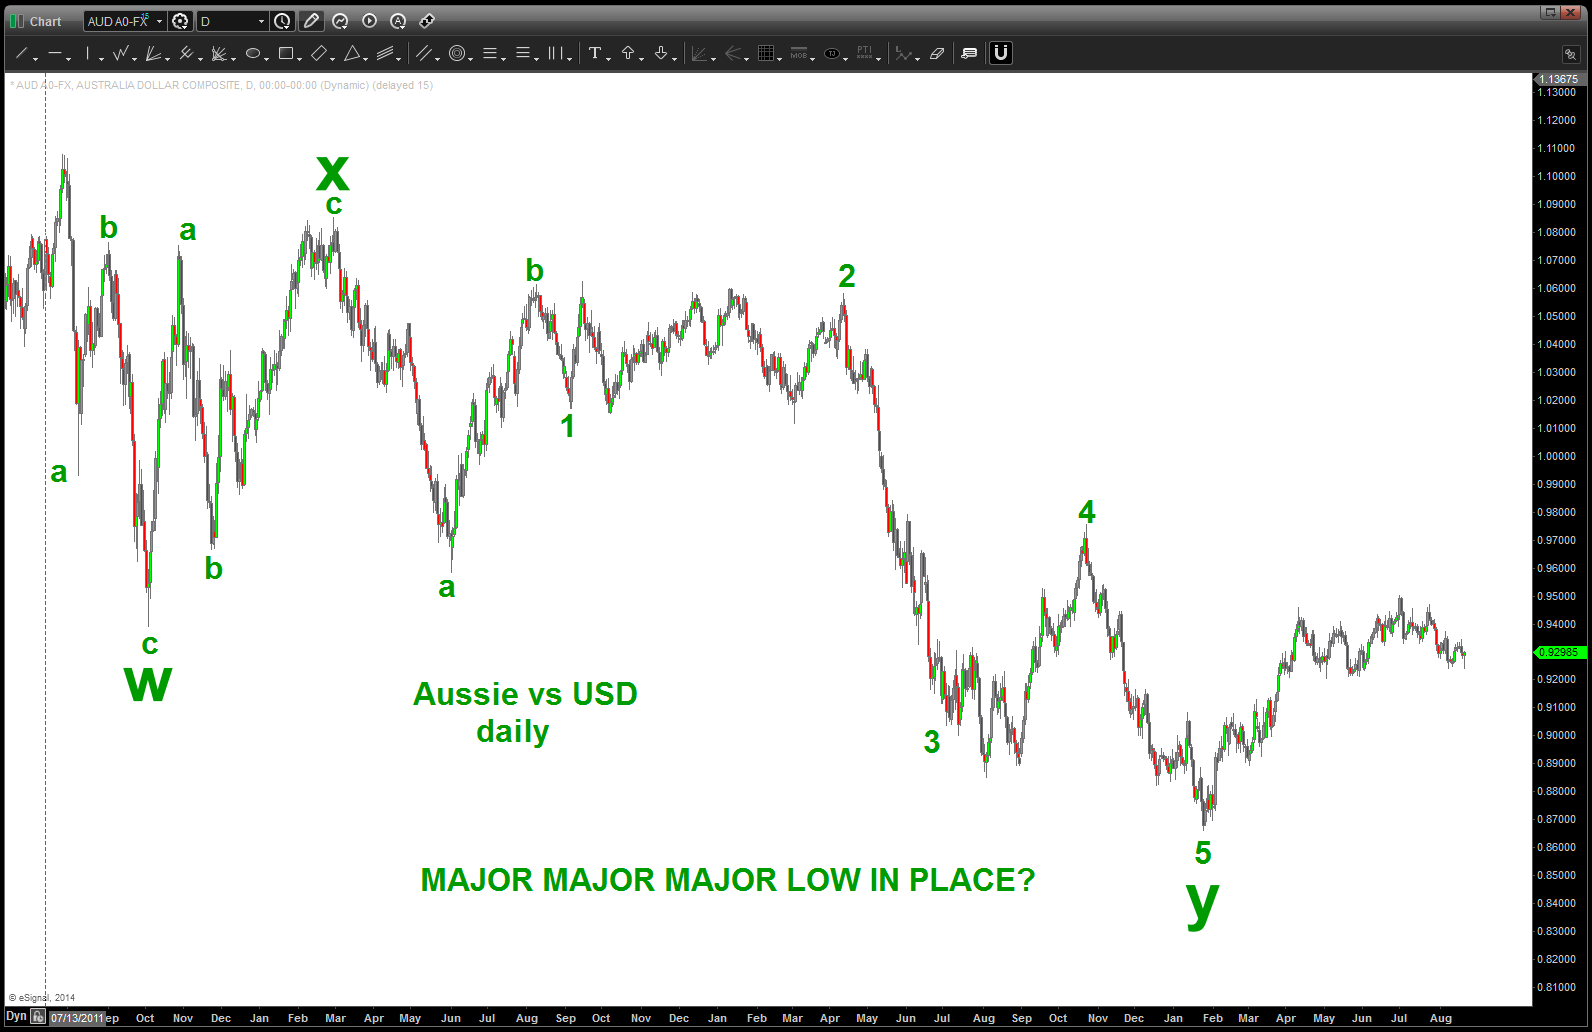
AUSSIE major low …?
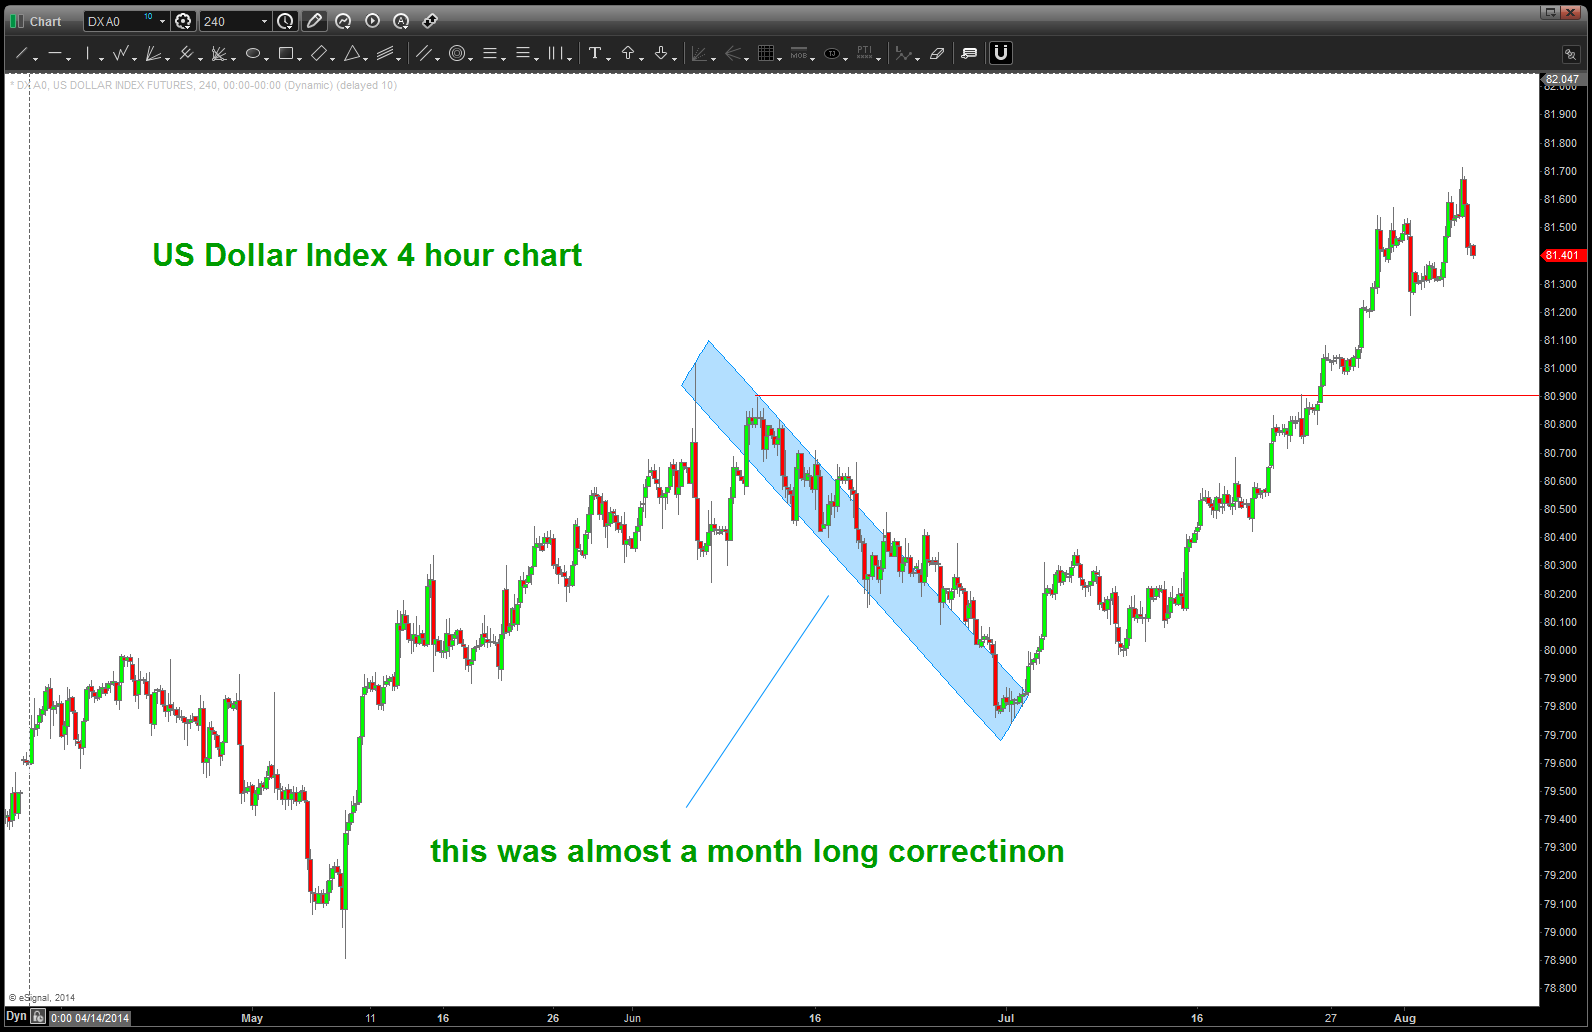
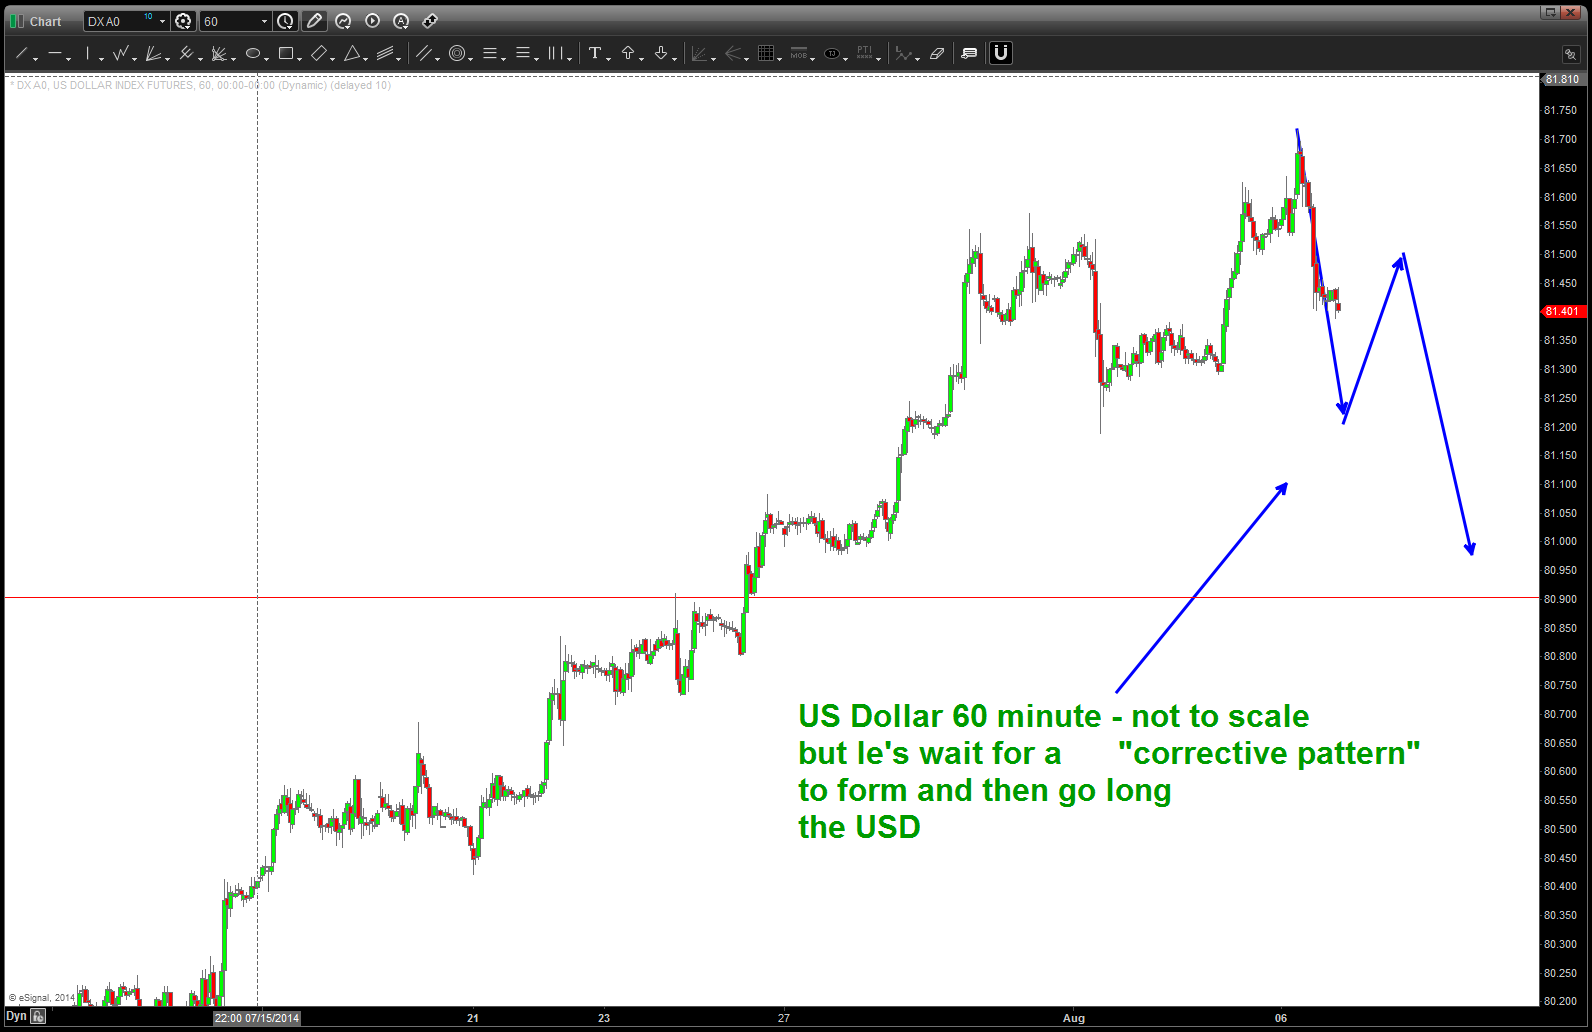
the post below is from February 13, 2014 and I believe it’s important to rehash the most recent moves in the US Dollar. Believe this move has room to go, however, we need to patiently wait for a corrective pattern to form.
this move in the dollar is real so try to get long in the most risk adverse manner possible. as you can see from the post below as the 79 level was repeatedly getting tested I did, admittedly, start to question my strong dollar scenario. that was surely one ugly level for a while but I do think the dollar will strengthen into the low 90’s target that we have been calling for.
take your time and go thru the post below …some AMAZING geometry. Also, remember, ALL of my charts are REAL TIME w/ no backward look .. they are as I saw it.
Bart

February 13, 2014
used GOOGLE to look for a picture of Gorillas Juggling dynamite – this is the best I could find
Early in my career I had the wonderful opportunity to get training from Joe Di Napoli (www.fibnodes.com) Highly recommend learning some of his techniques but, most importantly, his understanding of the market structure and the players in the game. One of his favorite sayings is we must realize that “you are entering into a world where the market is truly a caged gorilla juggling dynamite and – the dynamite is lit!”
Additionally, if you have been reading this blog you’ll realize it’s focused 1) 100% on PATTERNS and 2) it’s unique value is tying PATTERNS into the circle of life (fixed income, equities, commodities, FX). W/in the context of the circle, the gorilla is the Foreign Currency Market. According to the Bank for International Settlements – the preliminary global results from the 2013 Triennial Central Bank Survey of Foreign Exchange and OTC Derivatives Markets Activity show that trading in foreign exchange markets averaged $5.3 trillion per day in April 2013.
The Dollar Index is somewhat important as it represents a basket of 9 currencies – the Euro representing a vast majority of it at 58%.
For all intensive purposes – it’s been “stuck” in a 4 cent range but PATTERNS suggest we are “prepping” for a big move … so, in order to get a “feel” for where we MIGHT be let’s go back to the “beginning” at 71 ish and work thru to present…
PATTERN at after the 71 low
more detailed look at the mirror image foldback present in the US Dollar
CLIFF NOTES: the BULLISH thesis is that after the 5 waves down from 121, a 3 wave (at a minimum) corrective pattern should ensue (A-B-C) and therefore the bounce has farther to travel. Additionally, it could mark a MAJOR low and we are starting back up for 5 waves. The BULLISH consensus for the US DOLLAR is that this move UP is not complete. Please see this chart below … and, notice the EXACT move up from the PATTERN shown above at the “2 or B” level.
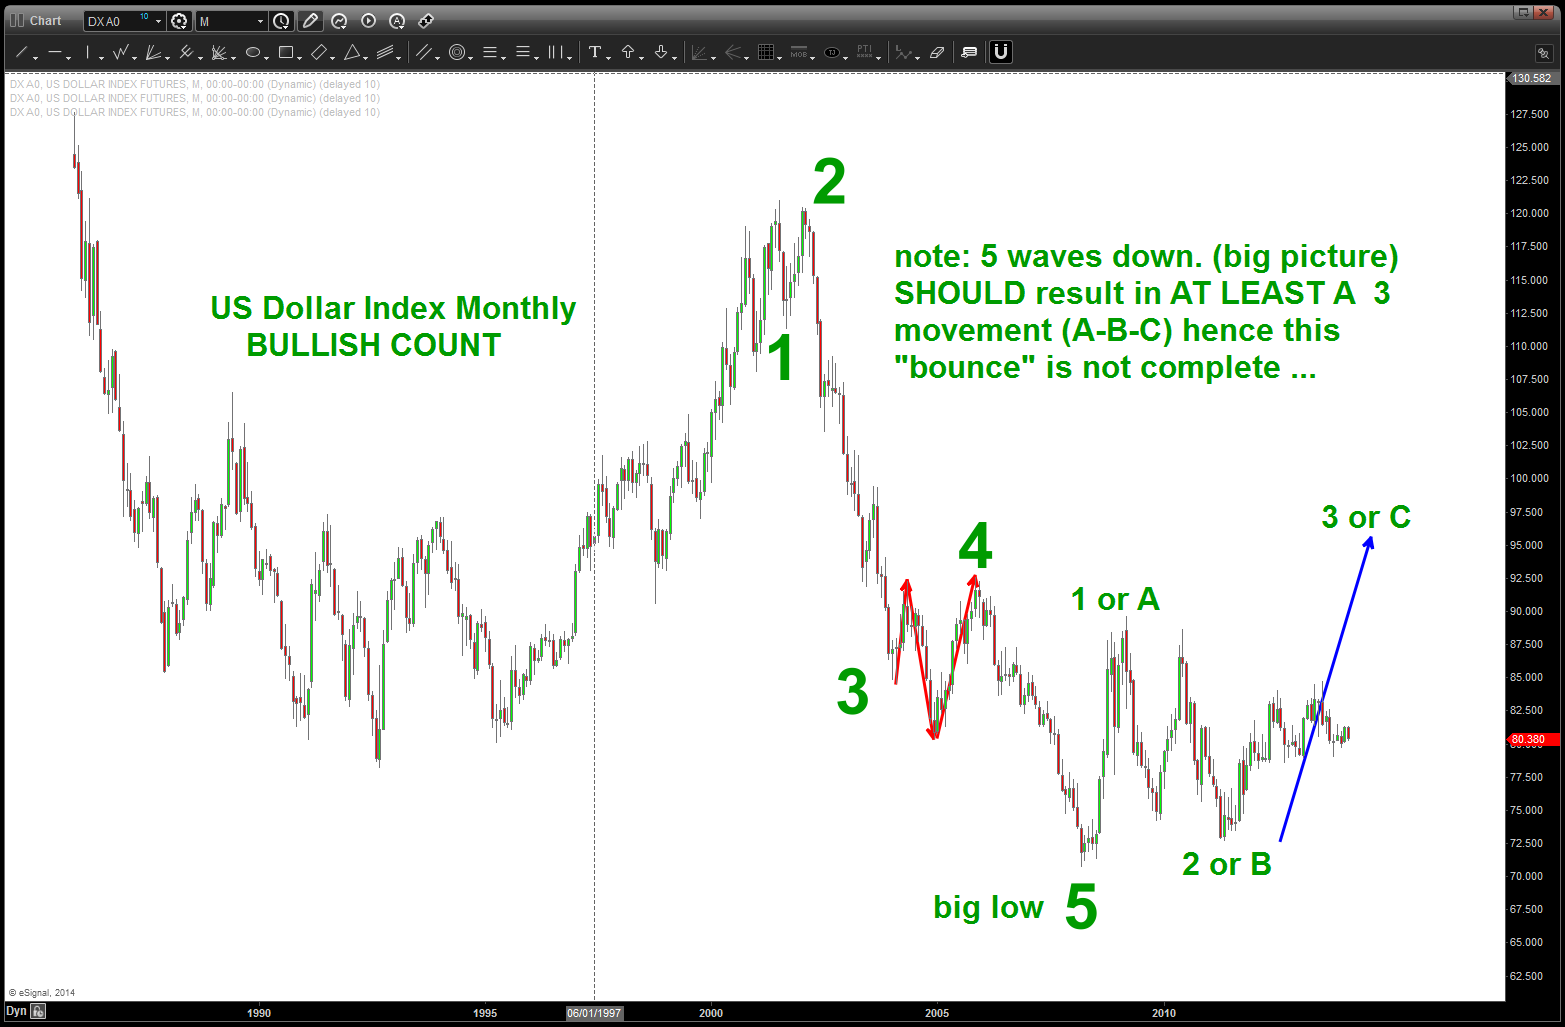
note a clear 5 waves down should lead, big picture, to a 3 wave move up (at a minimum)
so where are we now? Without showing an “elaborate” count, we can see by the chart below that we smacked right into a “big picture” .618 price projection that had it’s genesis from the 71 price low.
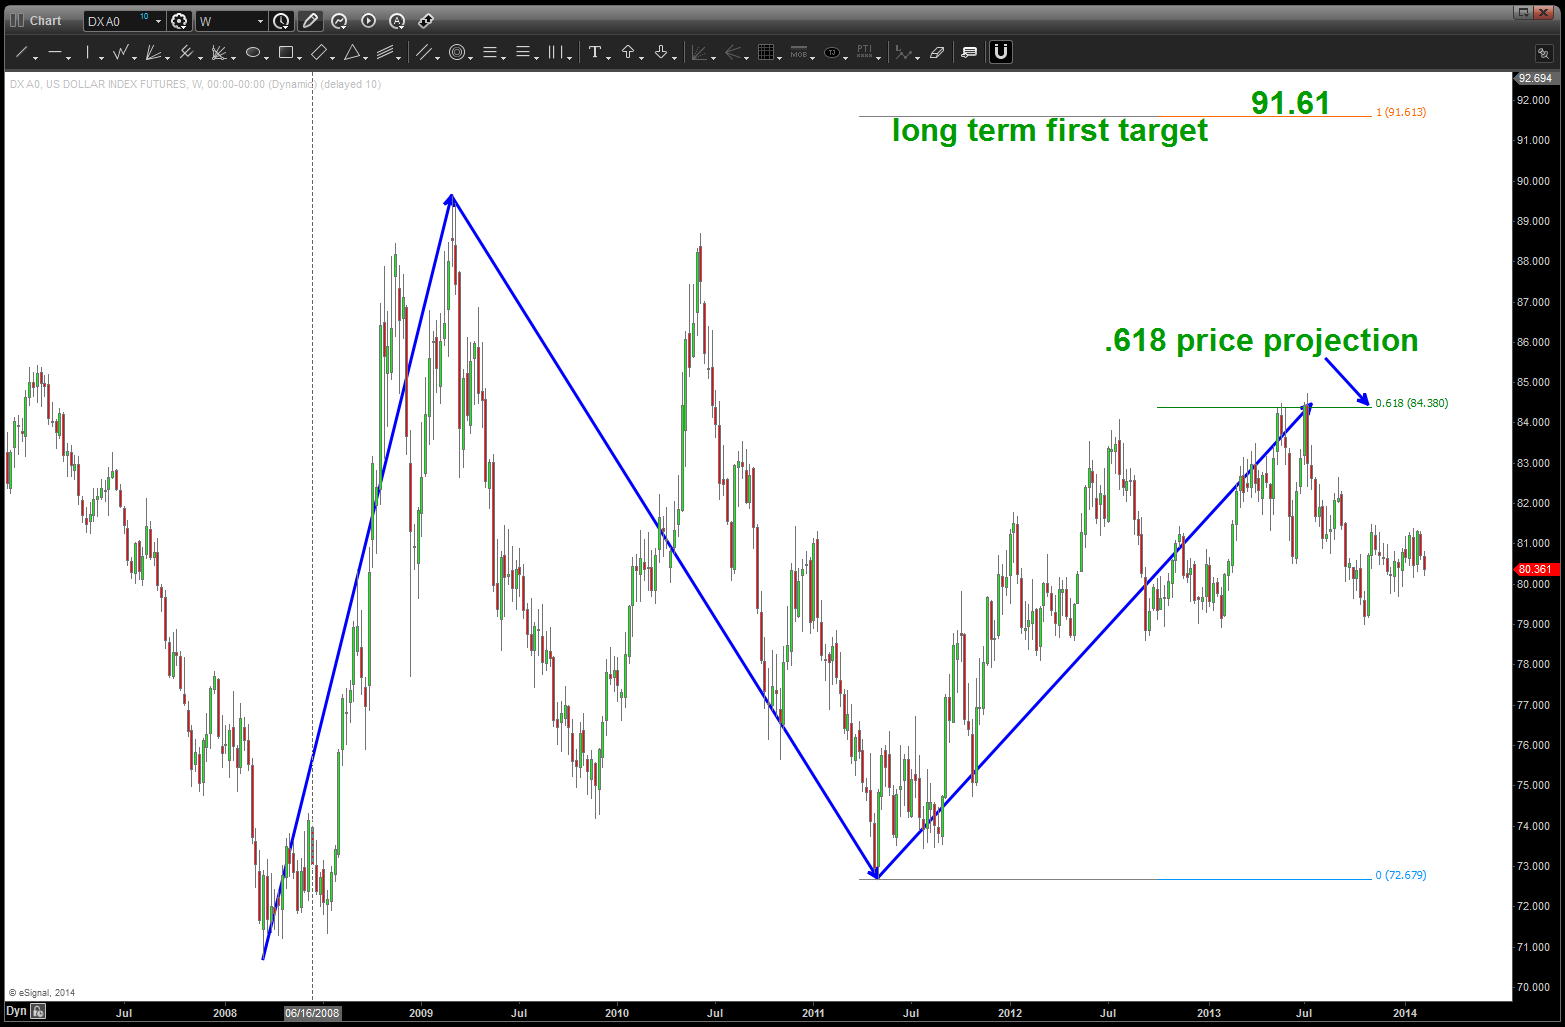
.618 price projection on the US Dollar causing the resistance
here’s the possible bullish count from the “2 or B” low that shows a POTENTIAL 3rd wave underway. IF the count is correct, then the 79 level has to hold and is very crucial as it suggest that the 3rd wave should begin …soon and UP we go.
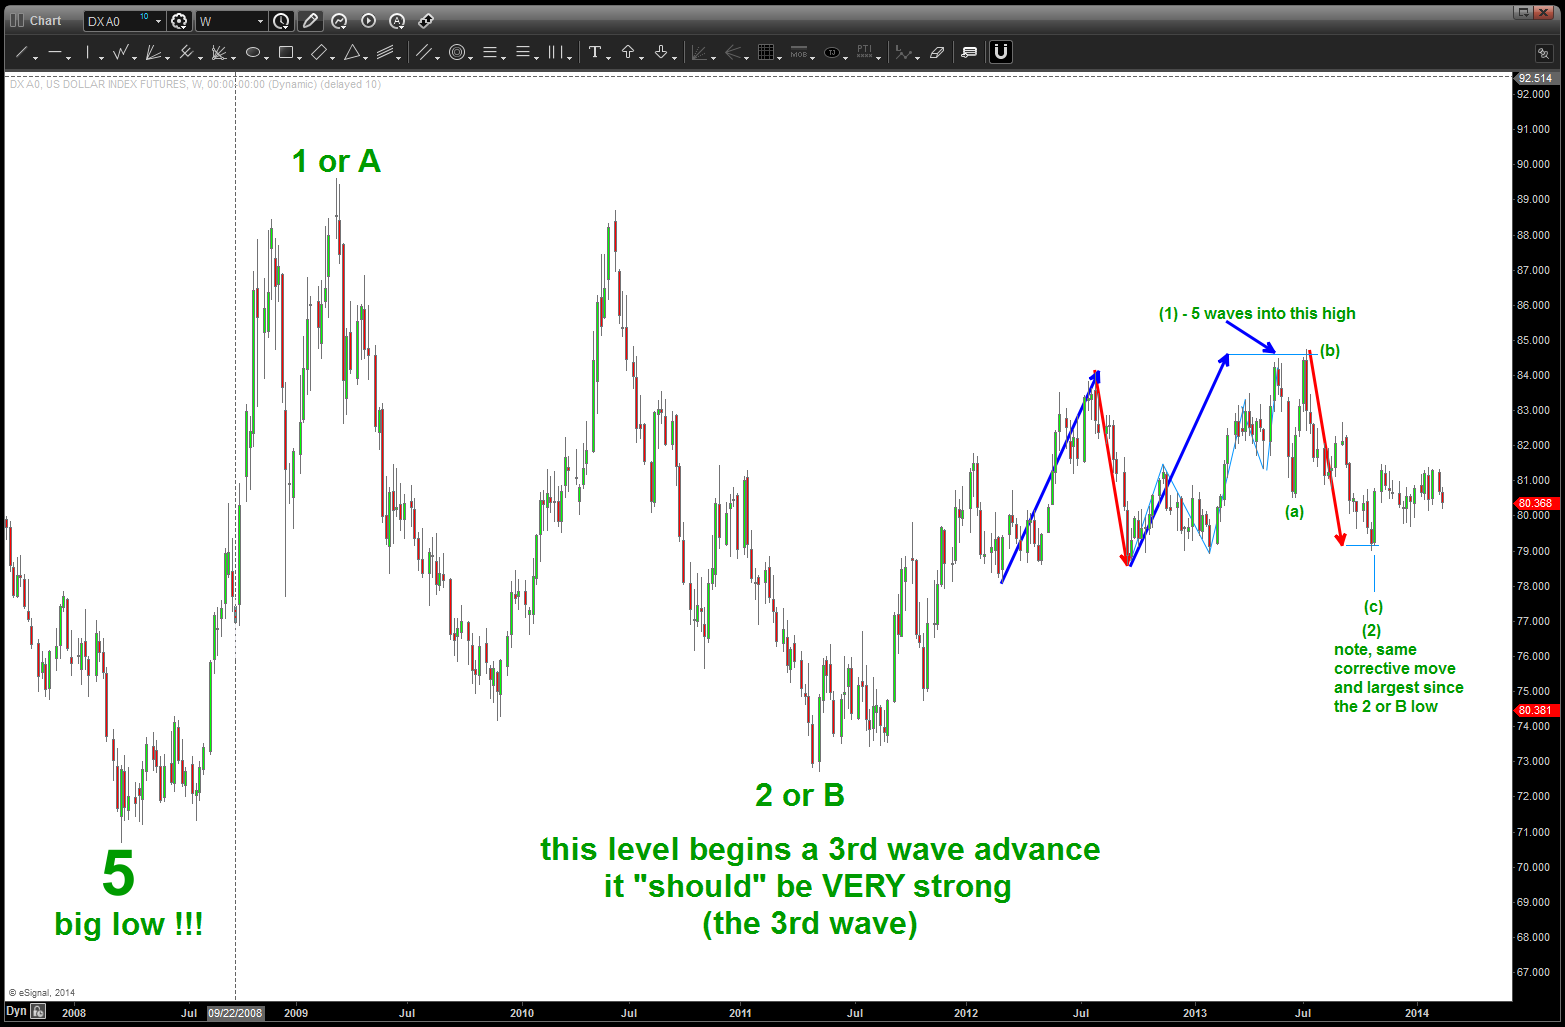
potential count showing a bull move
now, we need to drill down one more time frame – that of the 240 minute chart to see what we have going on. YES, we have a BULLISH PATTERN on the US Dollar at 80.05-80.08. In order for this entire thesis to be correct, then I believe this pattern needs to hold for the strength in the US Dollar to begin…
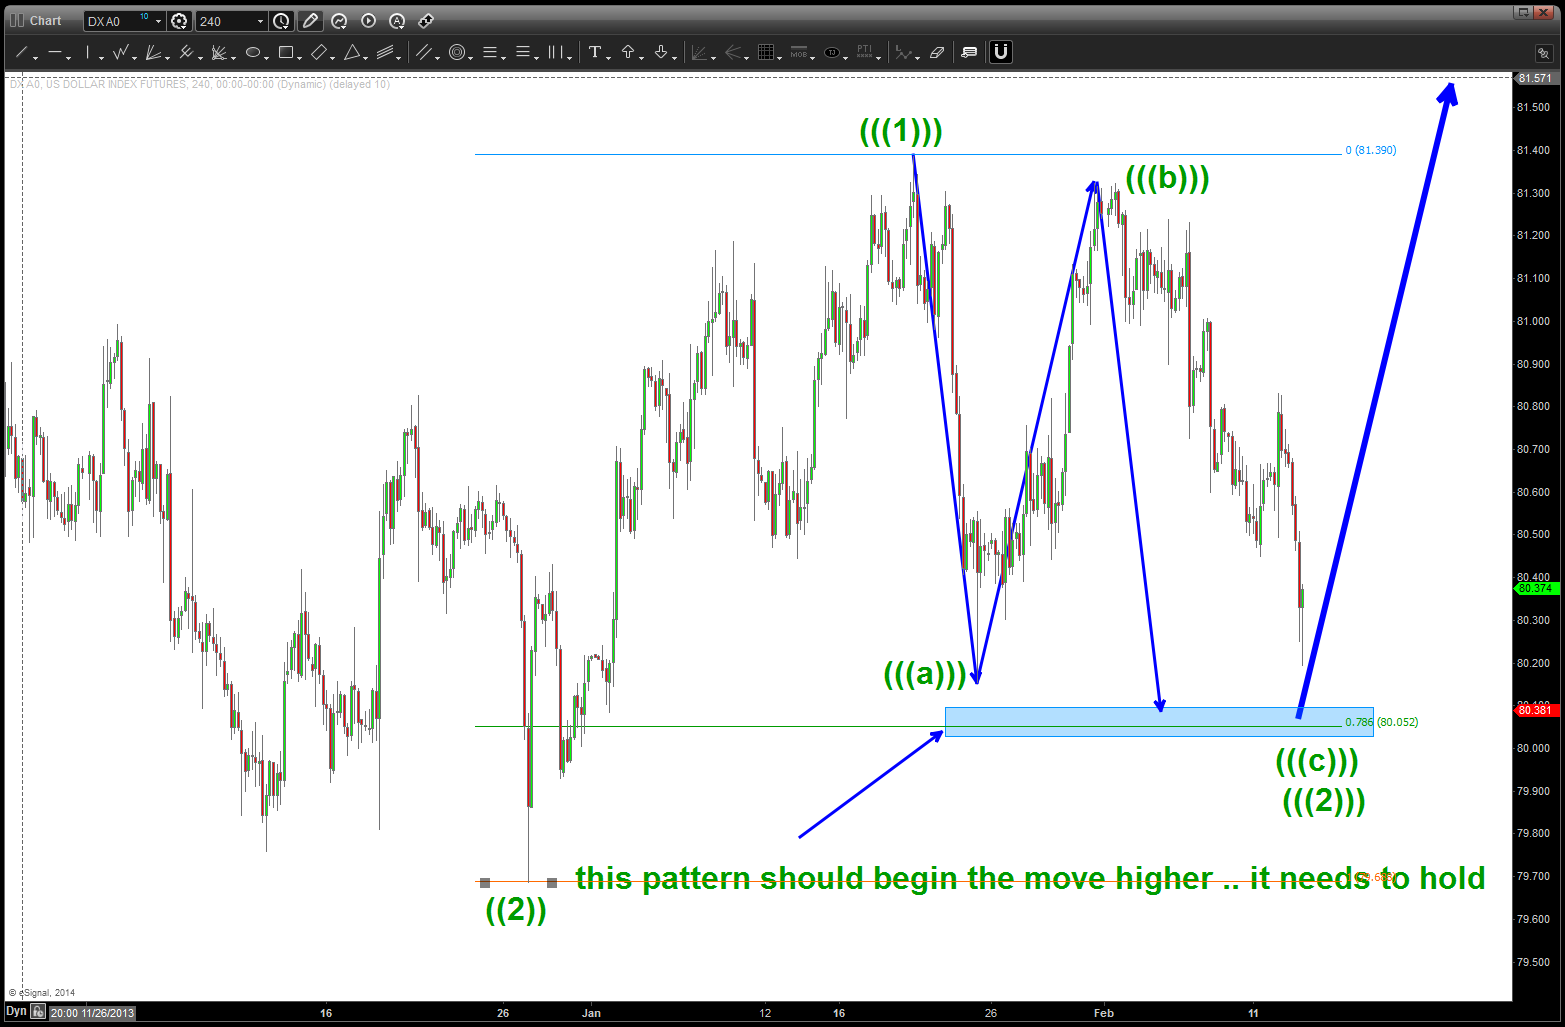
BULLISH BUY PATTERN PRESENT]
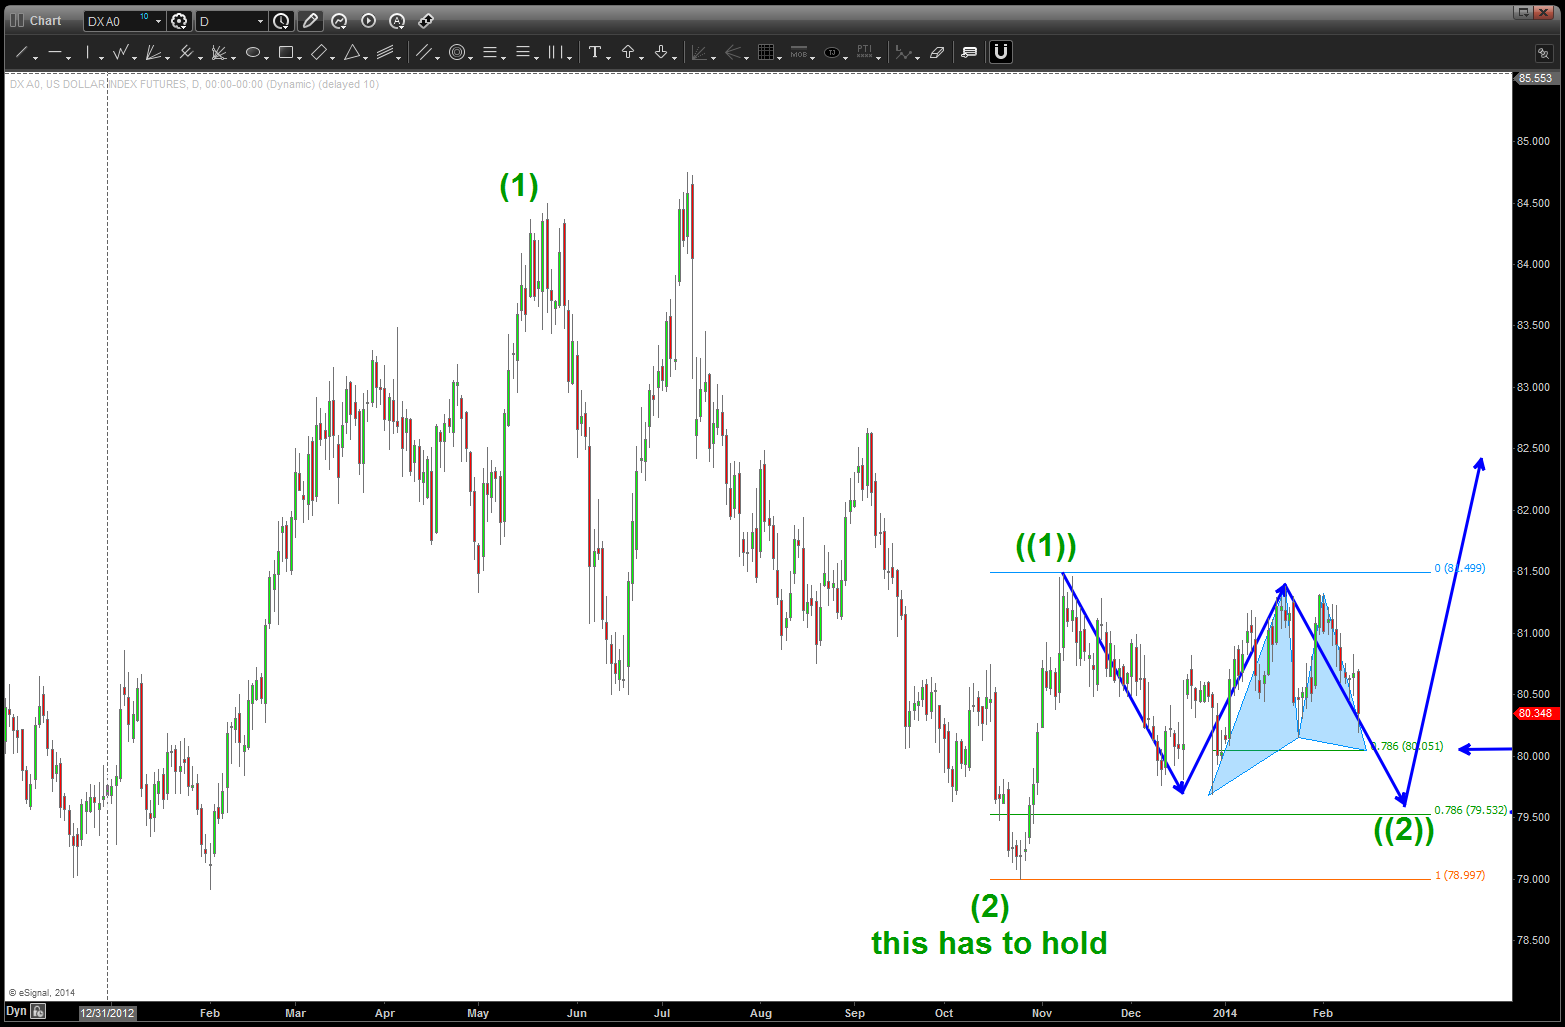
the last BULLISH PATTERN present …
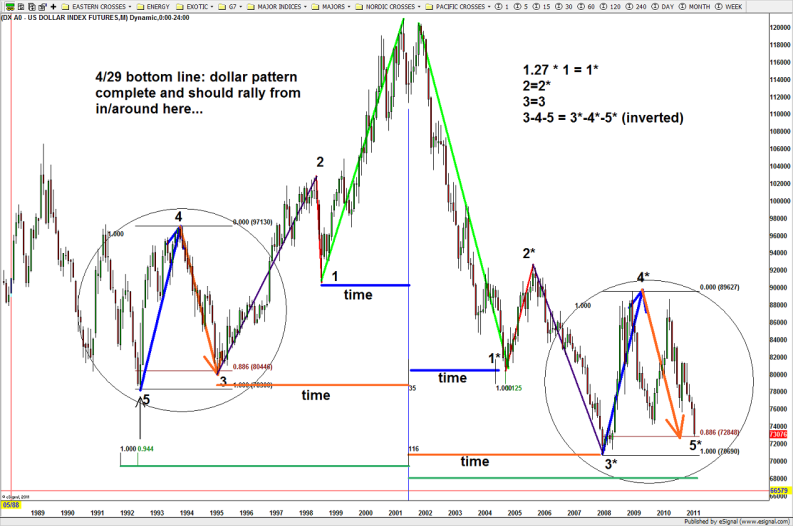
PATTERNS fail …they are an EDGE and over time they have been statistically proven to give us an edge. But, what if this pattern does fail? Take a close look at the following two charts … I have not shown this before, but we need to take into account the 5 wave move down from 121 and the .618 price projection — they are starting to form a huge B wave triangle. The 5 wave move into the low is a BIG BIG A and then current structure is forming a BEARISH TRIANGLE w/ the ‘c’ portion just completing (due to the exact nature of the .618 price projection) and ‘d’ and ‘e’ to come …also note the purple trend lines. One forms a head and shoulders and the other is showing the support for the US Dollar since the ‘b’ wave low …
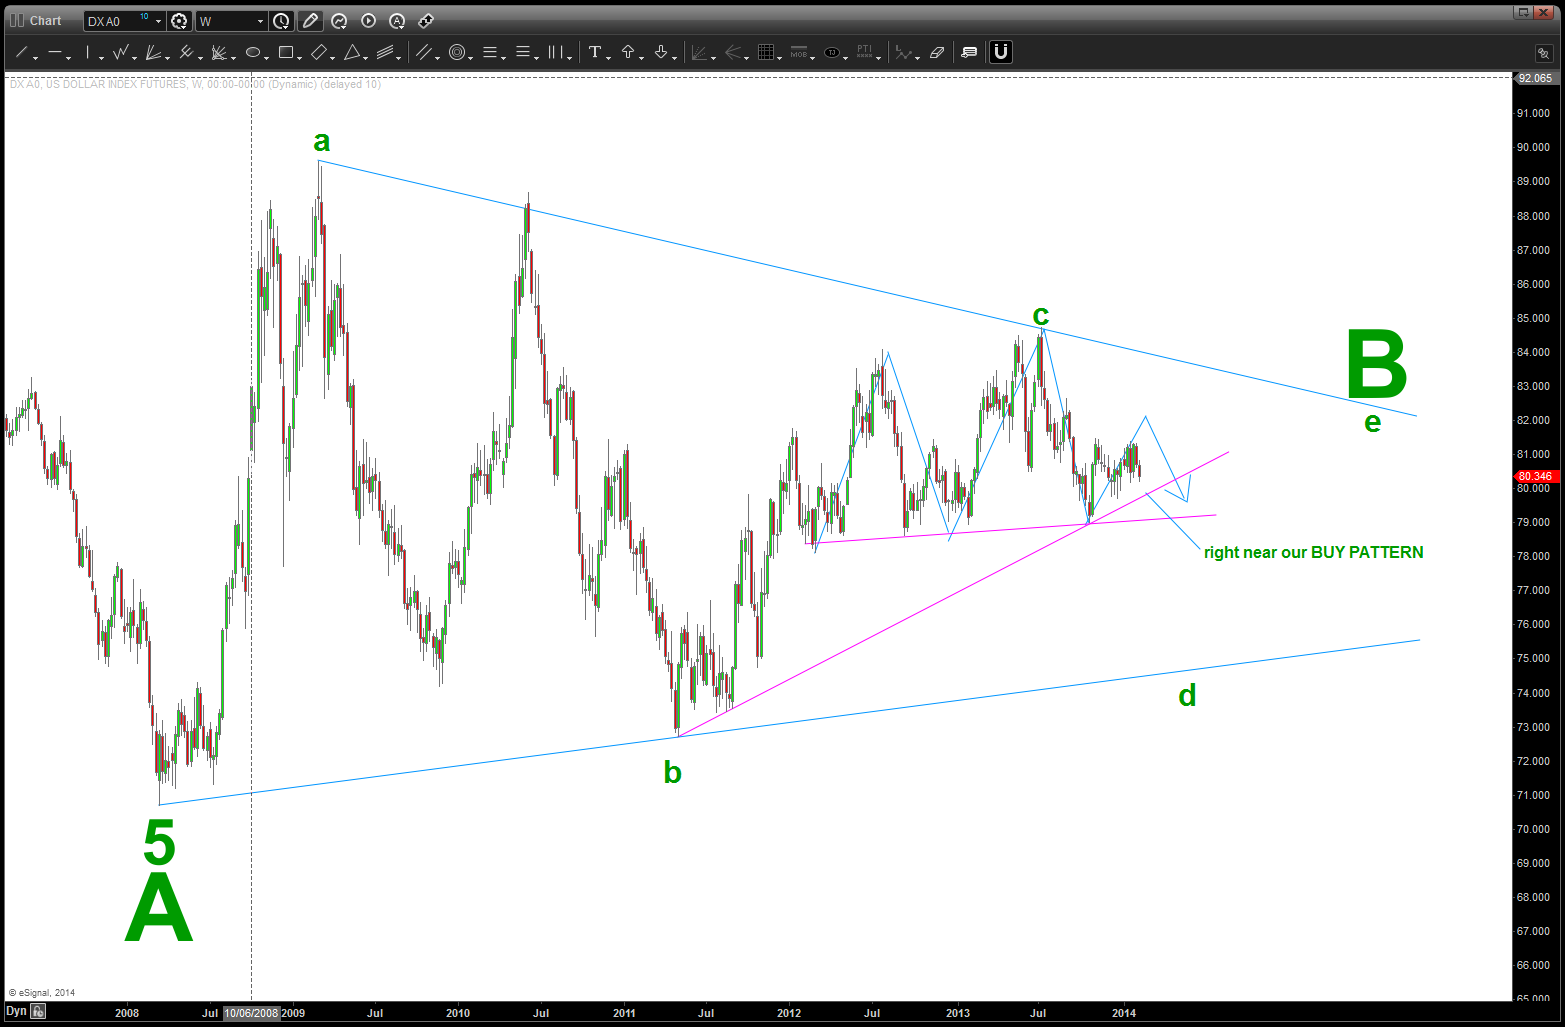
do we have a multi year bearish triangle forming?
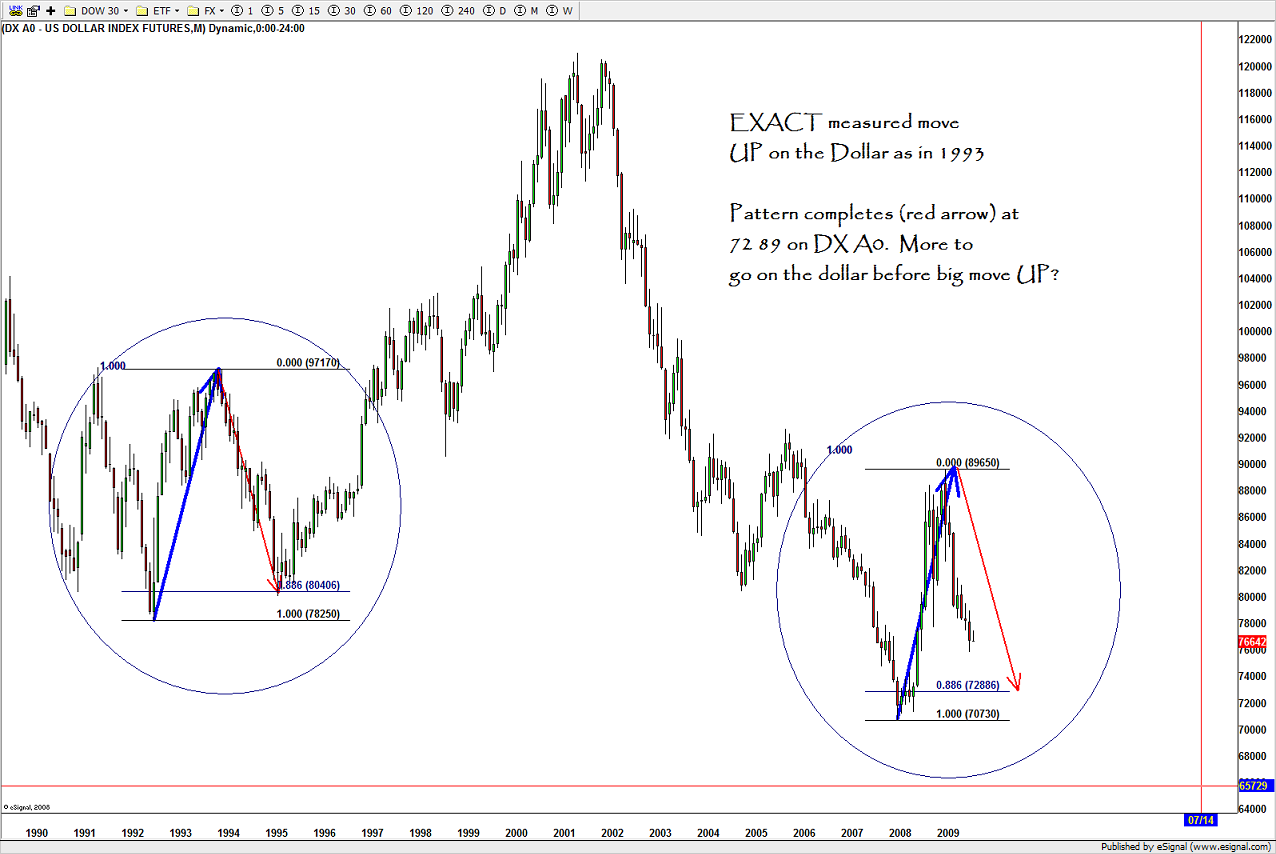
here’s one last thing to consider …. take note of the measured move UP move from the past and what happened after it completed … a bearish omen?
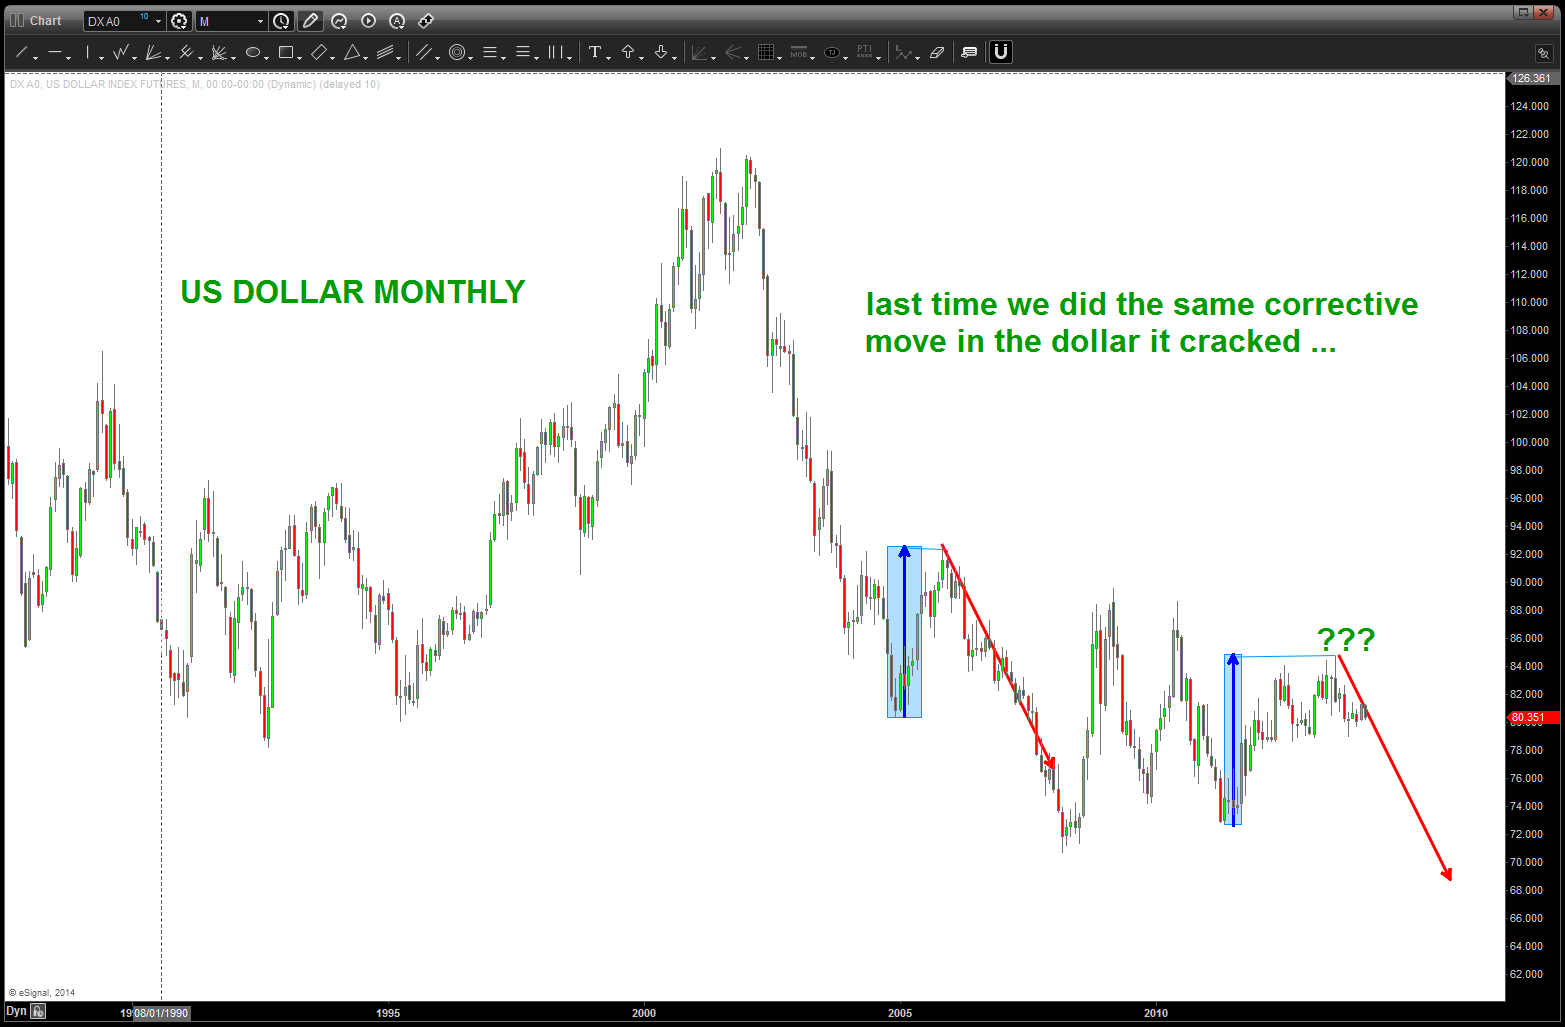
a measure move omen ?
CLIFF NOTES:
- w/ the deflationary forces present, the dollar SHOULD strengthen. A well formed count supports that and a PATTERN very very close also holds that thesis as correct and positive. The first is the once completing at 80.05 on a shorter time frame and then 79.53 on the daily. They need to hold – w/ the 79.53 as the major pattern if the bullish thesis is correct. Remember, w/ our rules we could go all the way down to 79 again so, for all intensive purposes the 79 level is the line in the sand. We have two symmetrical BUY patterns present …
- HOWEVER, if we lose the 79.53 level THEN it will open up some serious selling. PATTERNS will then shift to the B wave triangle thesis …
- Last, we have MAJOR patterns complete across the indices and they are “acting” like the double tops that formed in 2000 and 2007. We have the Dow Jones Transports finishing a pattern from the late 1800’s, we have a potential generational low in interest rates complete and PATTERNS suggest one more wave lower in the commodities …
It’s all coming together and one of the circle of life gorilla’s is going to drop their stick of dynamite and big old explosion is going to occur …
