Gold and Silver Update ….and some more of the metals
CLIFF NOTES: a case is made, below, that inflection points in the ratio of GOLD/SILVER cause big movements in the spot gold and silver prices. Also, it appears that Gold lags. We are at a resistance level which “might” be one of those inflection points so expect the metals to get moving NOW or SOON. Probability points “lower” across the board for the metals.
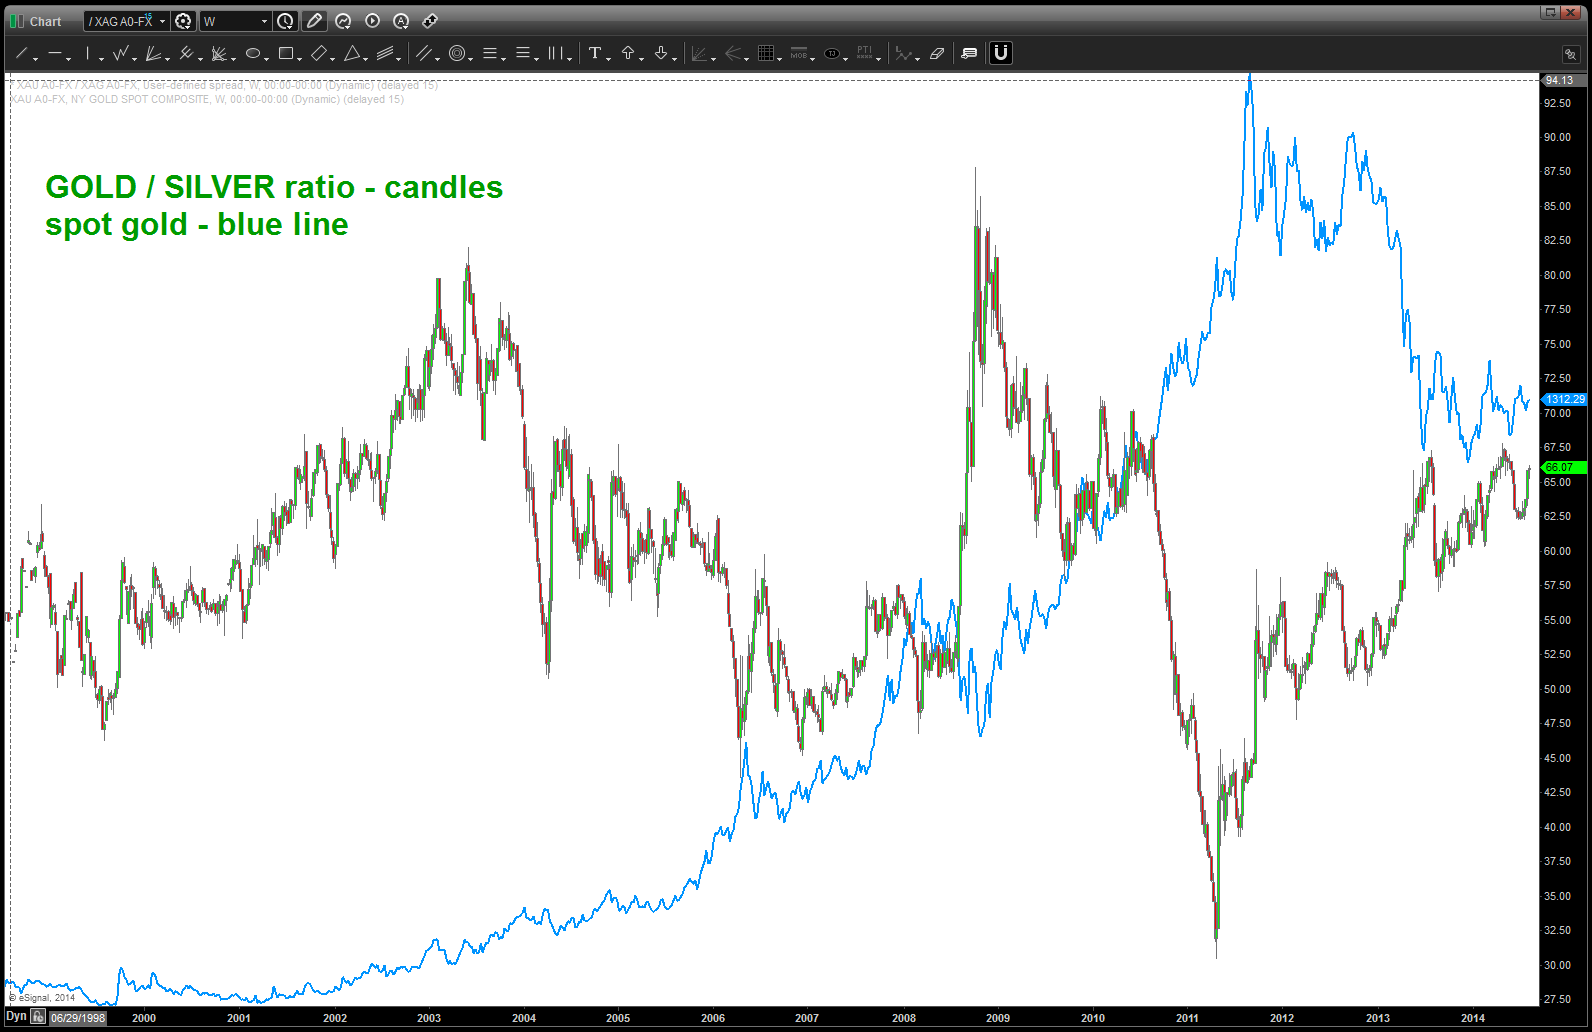
Ratio Analysis – we love using the patterns w/ ratio analysis and, of note, is the noticeable strength in Gold vs Silver the past couple weeks. So, our first chart is going to be the relative strength of spot gold / spot silver. Basically, when the candles are going DOWN then SILVER is “stronger” and when the candles are going up GOLD is “stronger.” After looking at this chart one thing stood out … it really didn’t matter which direction the relative strength ratio was moving, but when the ratio shifted and one of the assets noticeable started to our perform or under perform THEN we had an inflection point in silver. Below you will see a set of three charts showing you the PATTERNS that were present in these ratio’s which, if we knew about them, might have helped us position ourselves – based on other patterns and technical factors — on the long or short side of the spot silver or spot gold market or both.

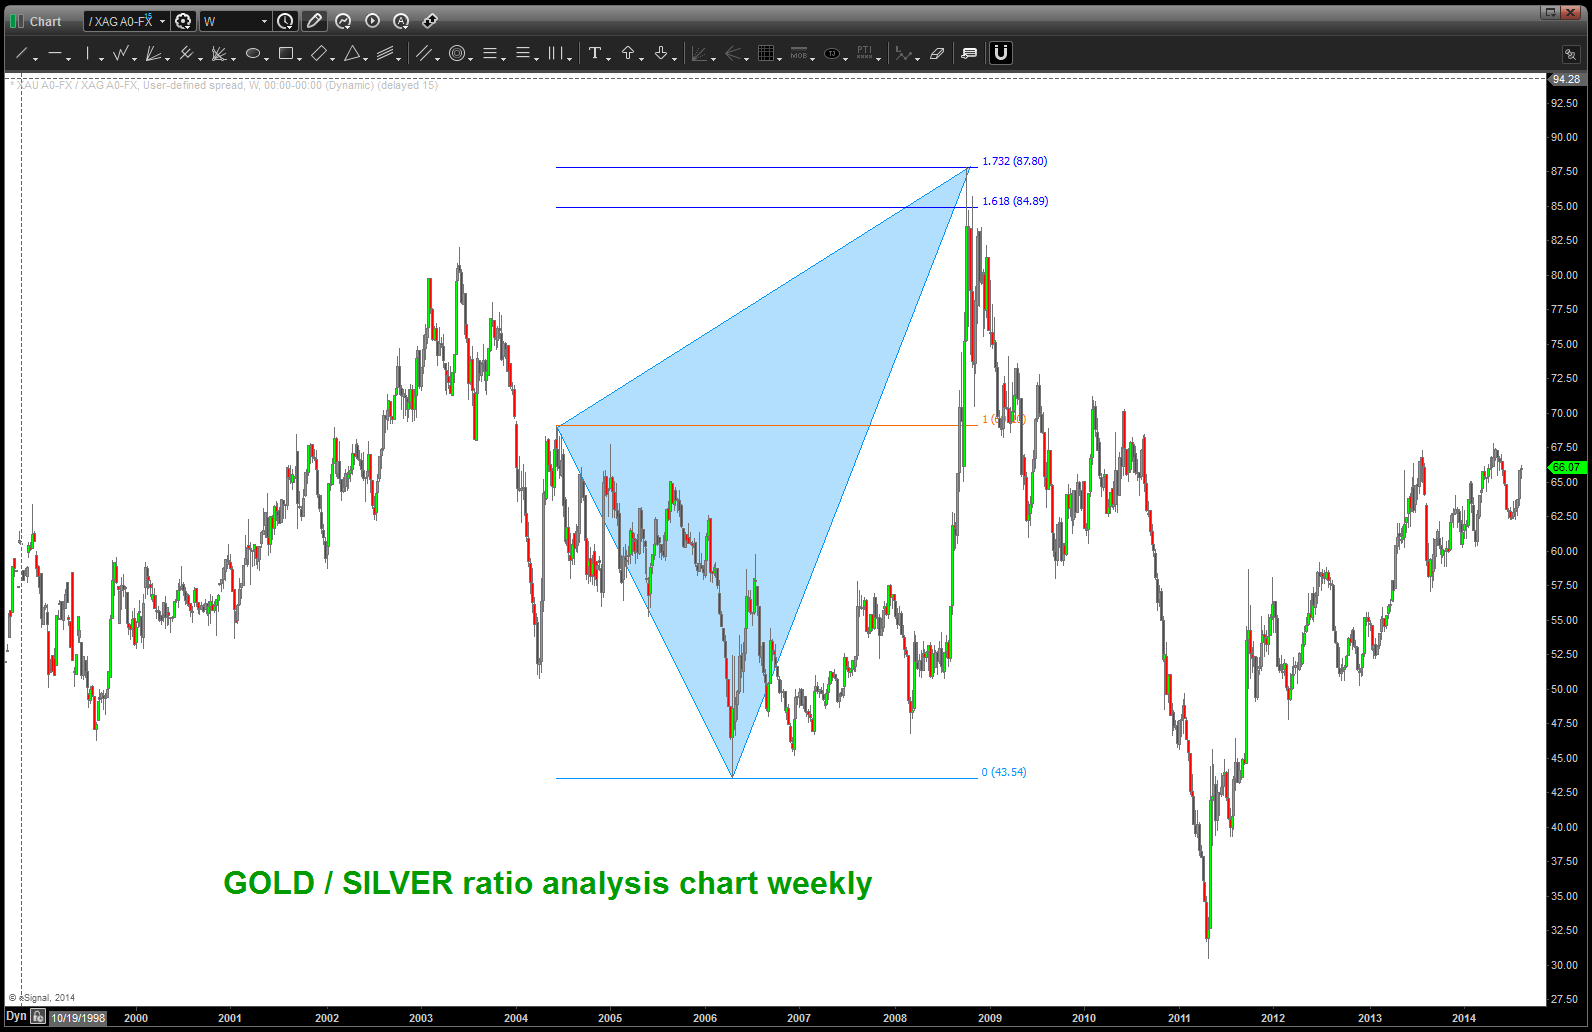
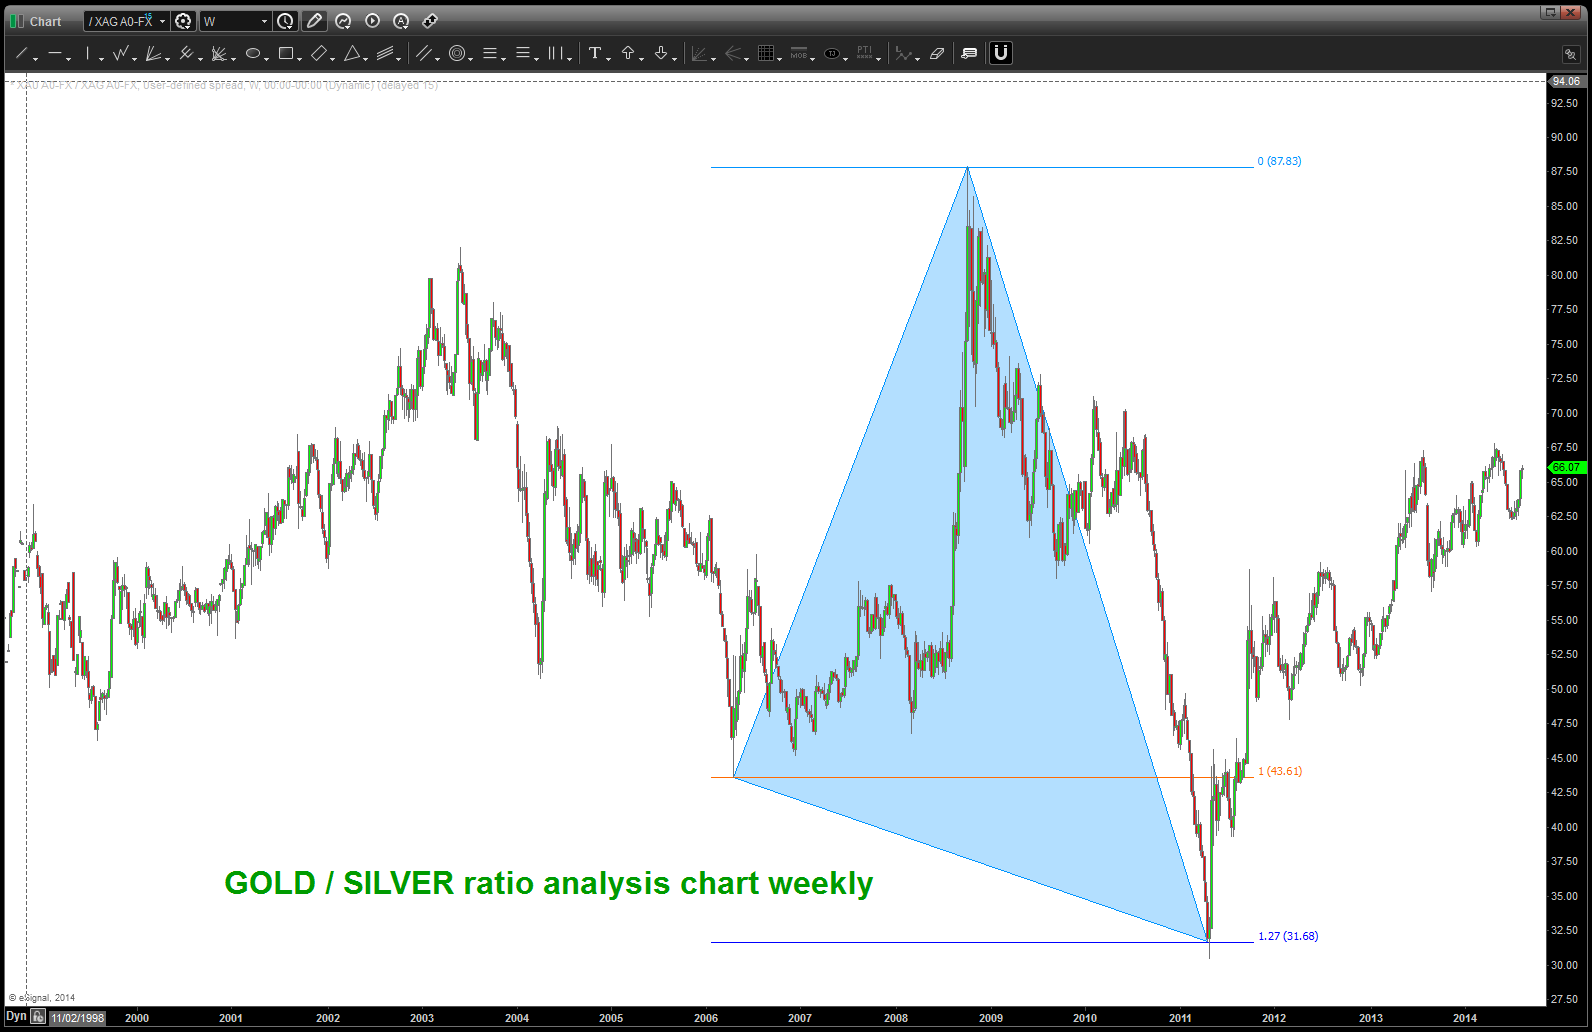
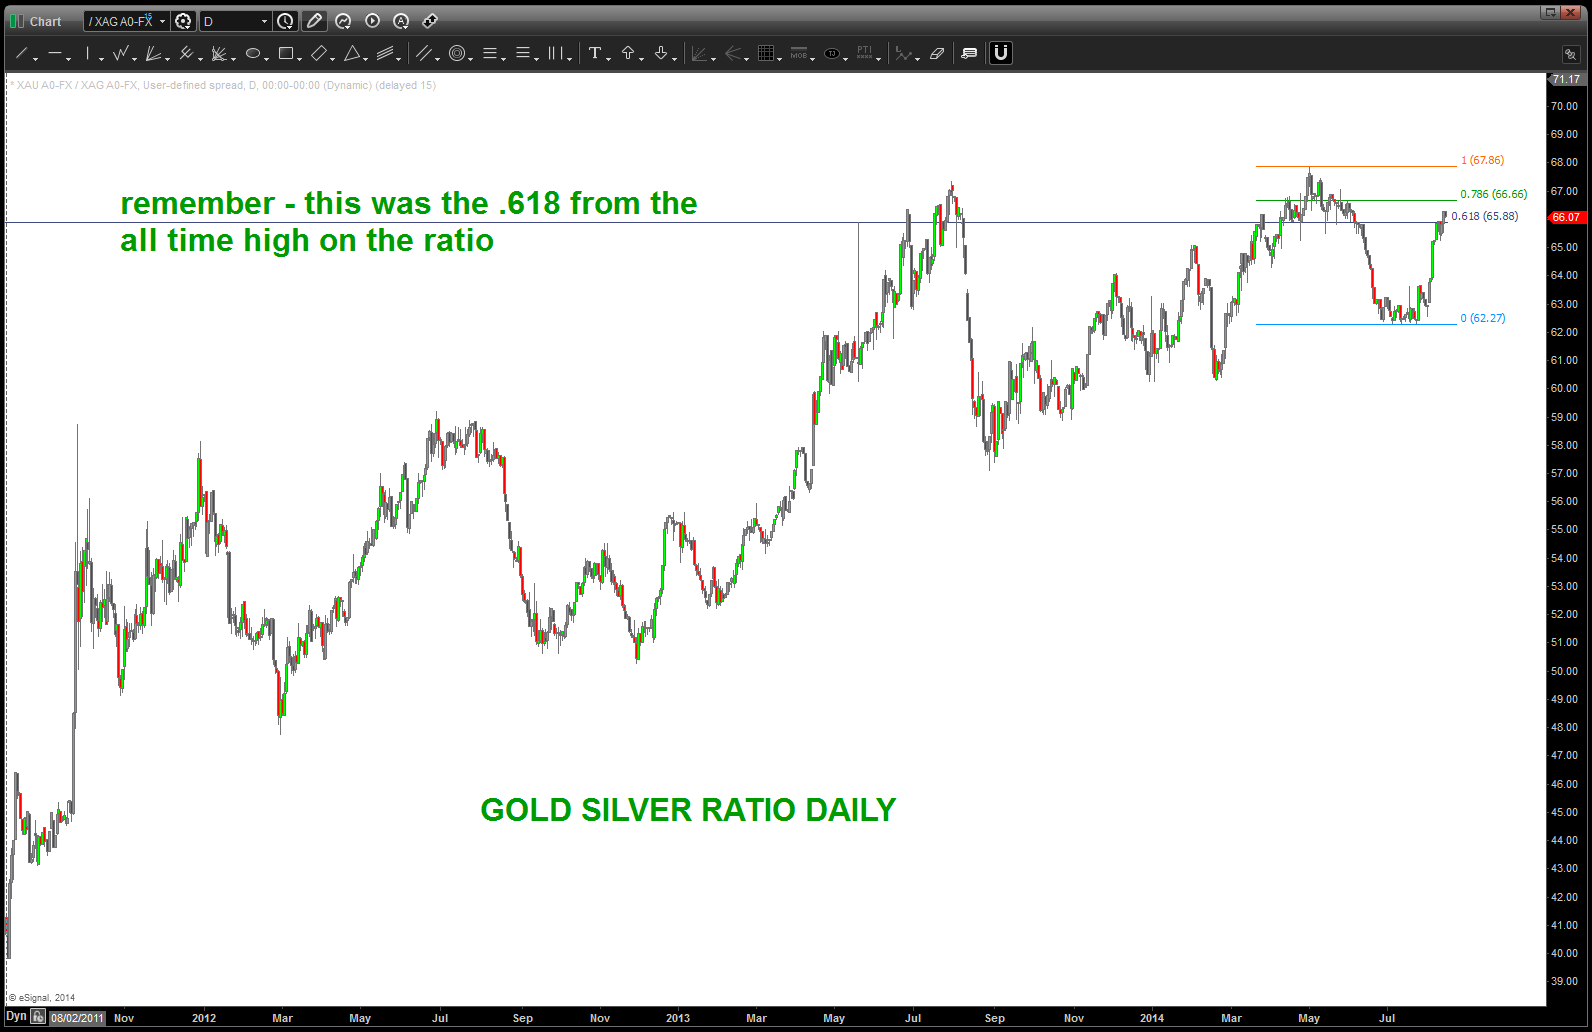
so where are we now …? Just using basic measured moves we can see that EVERY move in this ratio has been “used” before so our trick is to find out which one might work or not. Note the downward blue and orange arrows … then note the crash and how the vectors were almost perfect. so … we “should” do either the black or the purple measured move UP –right? note we are at the .618 of the gold/silver ratio and the black arrow would take us up to the .786. One of those two levels “should” hold and cause an inflection in the ratio. See below:
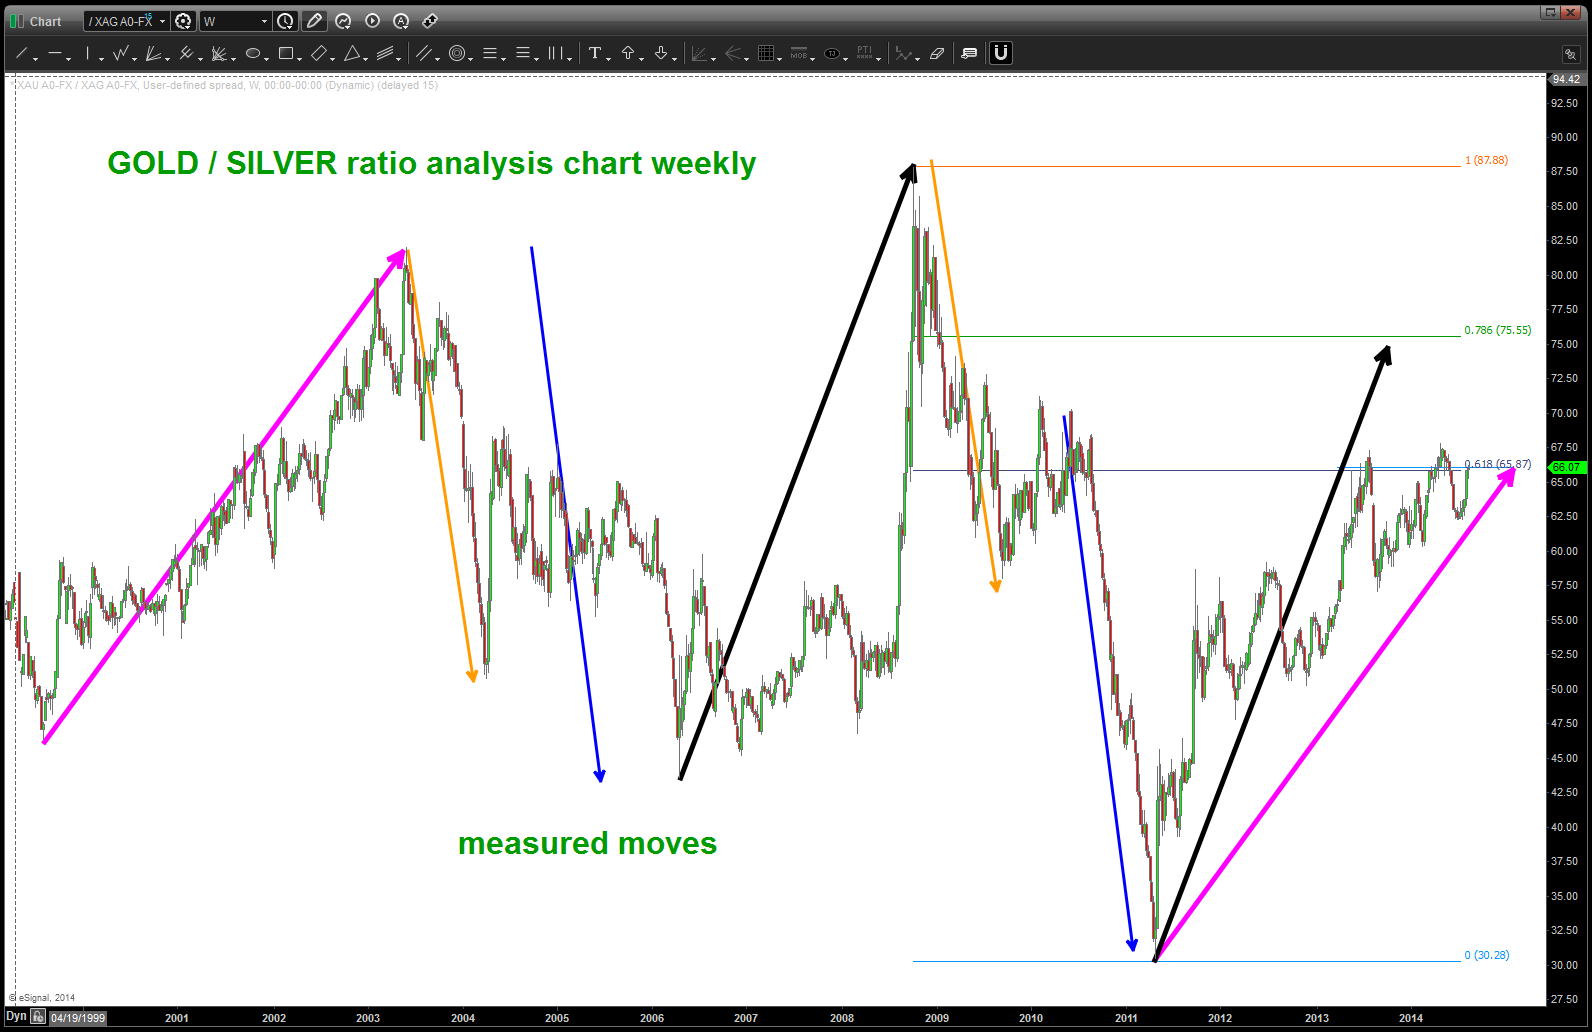
note the measured moves – that’s all we are using
so – now that we can see resistance ahead, has the ratio really helped pinpoint inflection points?
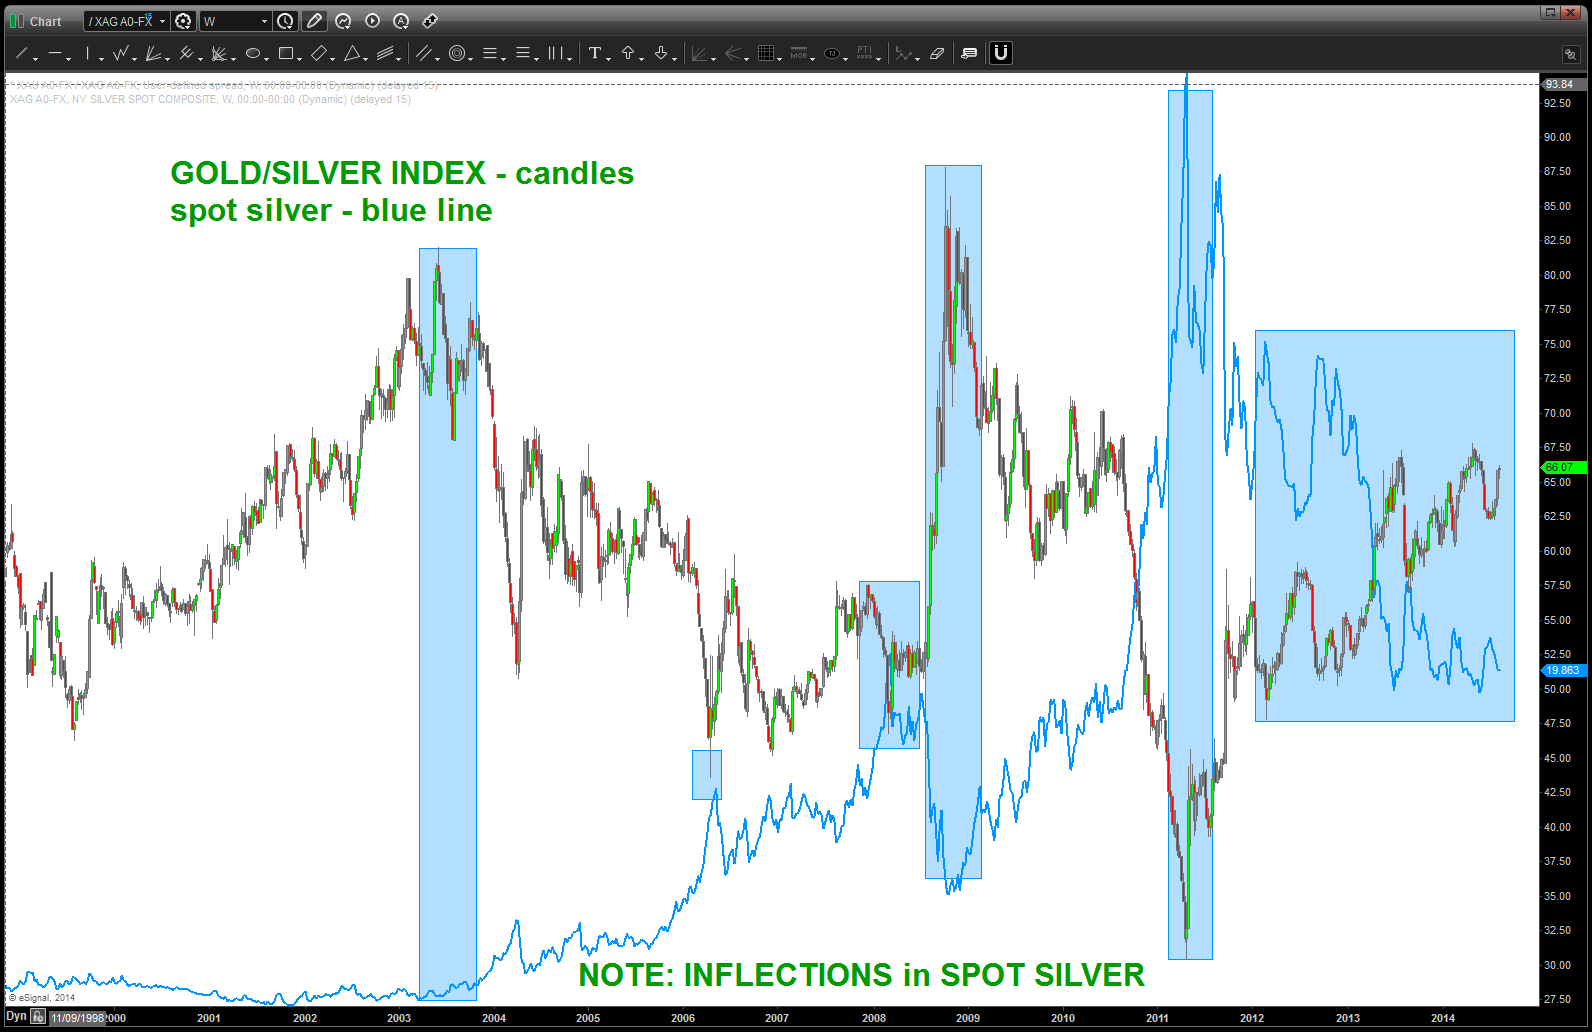
spot sliver – blue line – overlaid on ratio of gold/silver
what about Gold? Well, take a peak … the key thing I see is that while it’s not as “precise” from a timing perspective it appears that GOLD LAGS THE INFLECTION IN THE RATIO …
here’s the daily:
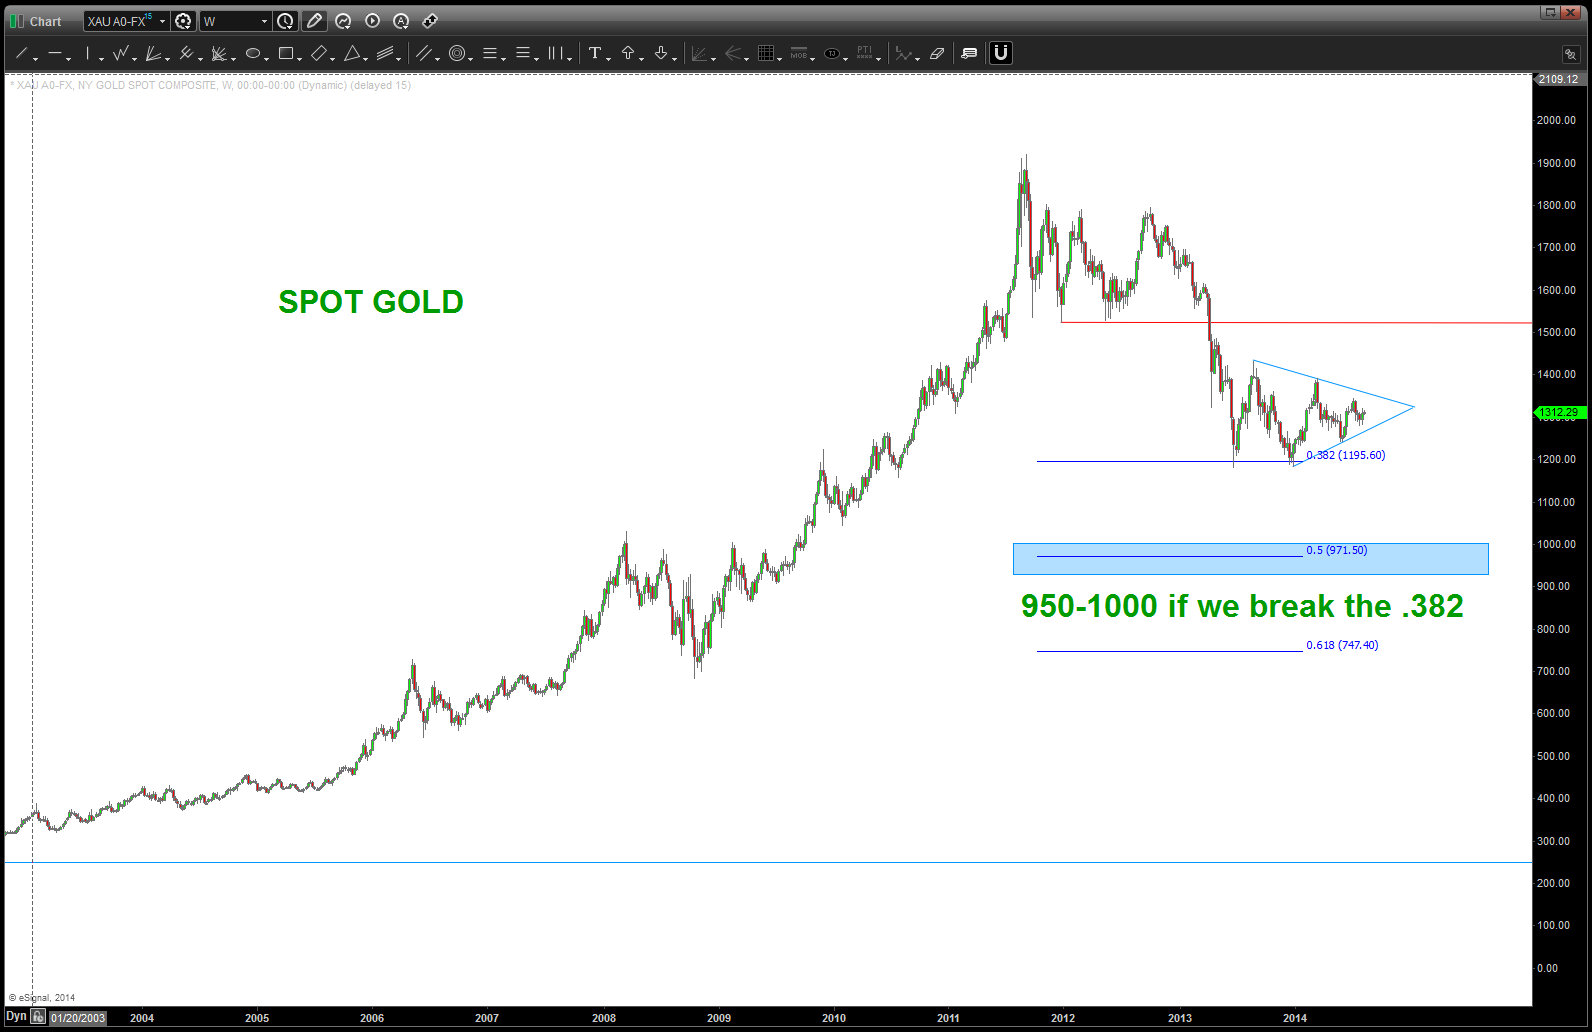
Now, let’s take a look at the metals individually. Folks, below is a great chart .. it shows the pegged price of gold from 1913 and, guess what, roughly 1200 is the .382 retracement. So, in the context of this long run in gold prices (100 years in the making) Gold is holding the .382 retracement which is EXTREMELY BULLISH. So, if you don’t believe me here’s the chart:

SPOT GOLD since 1913
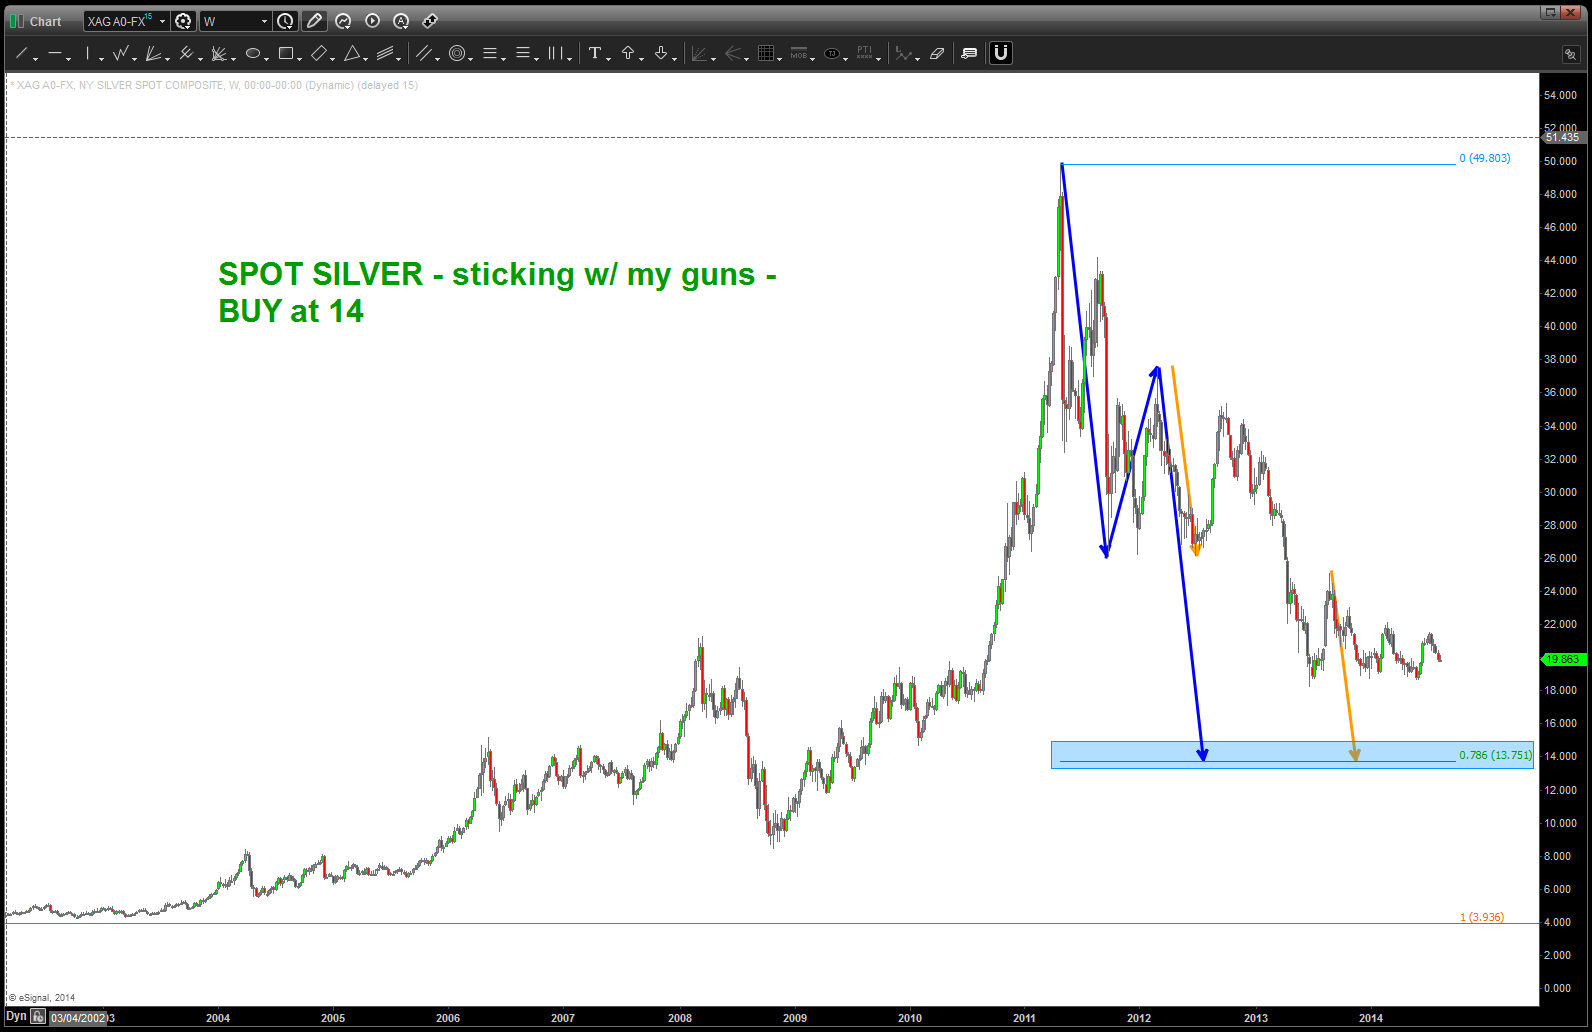
if we do break that level – look for 950-1000. Spot silver – sticking w/ my guns here and a buy at 14.
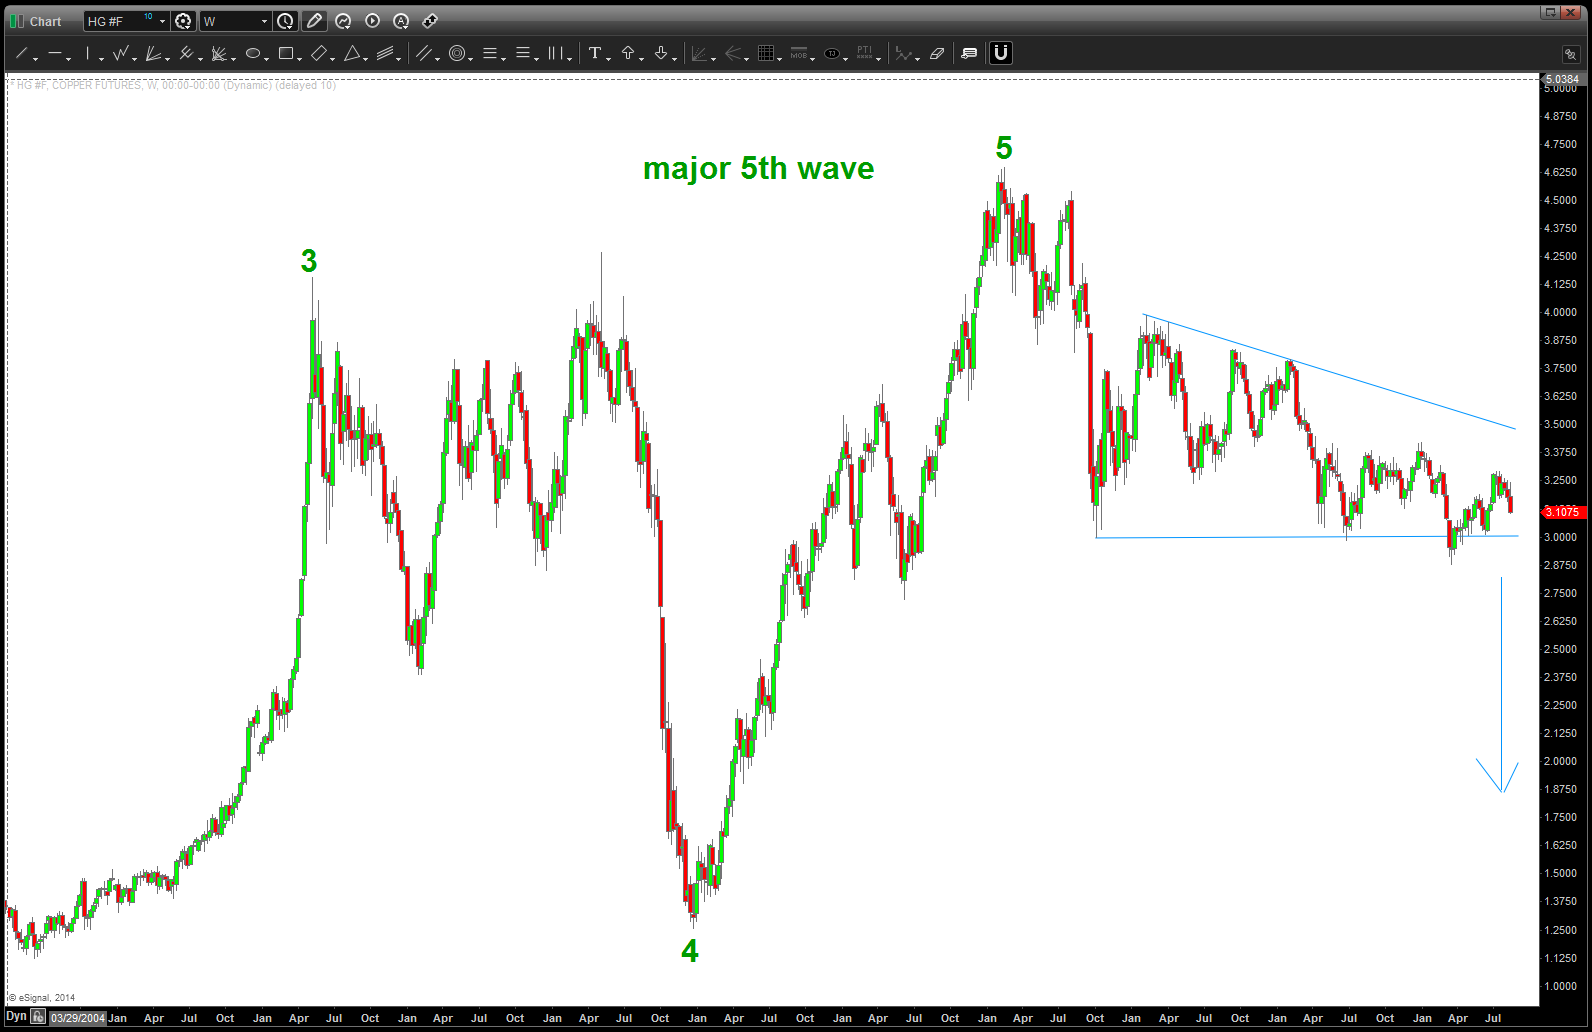
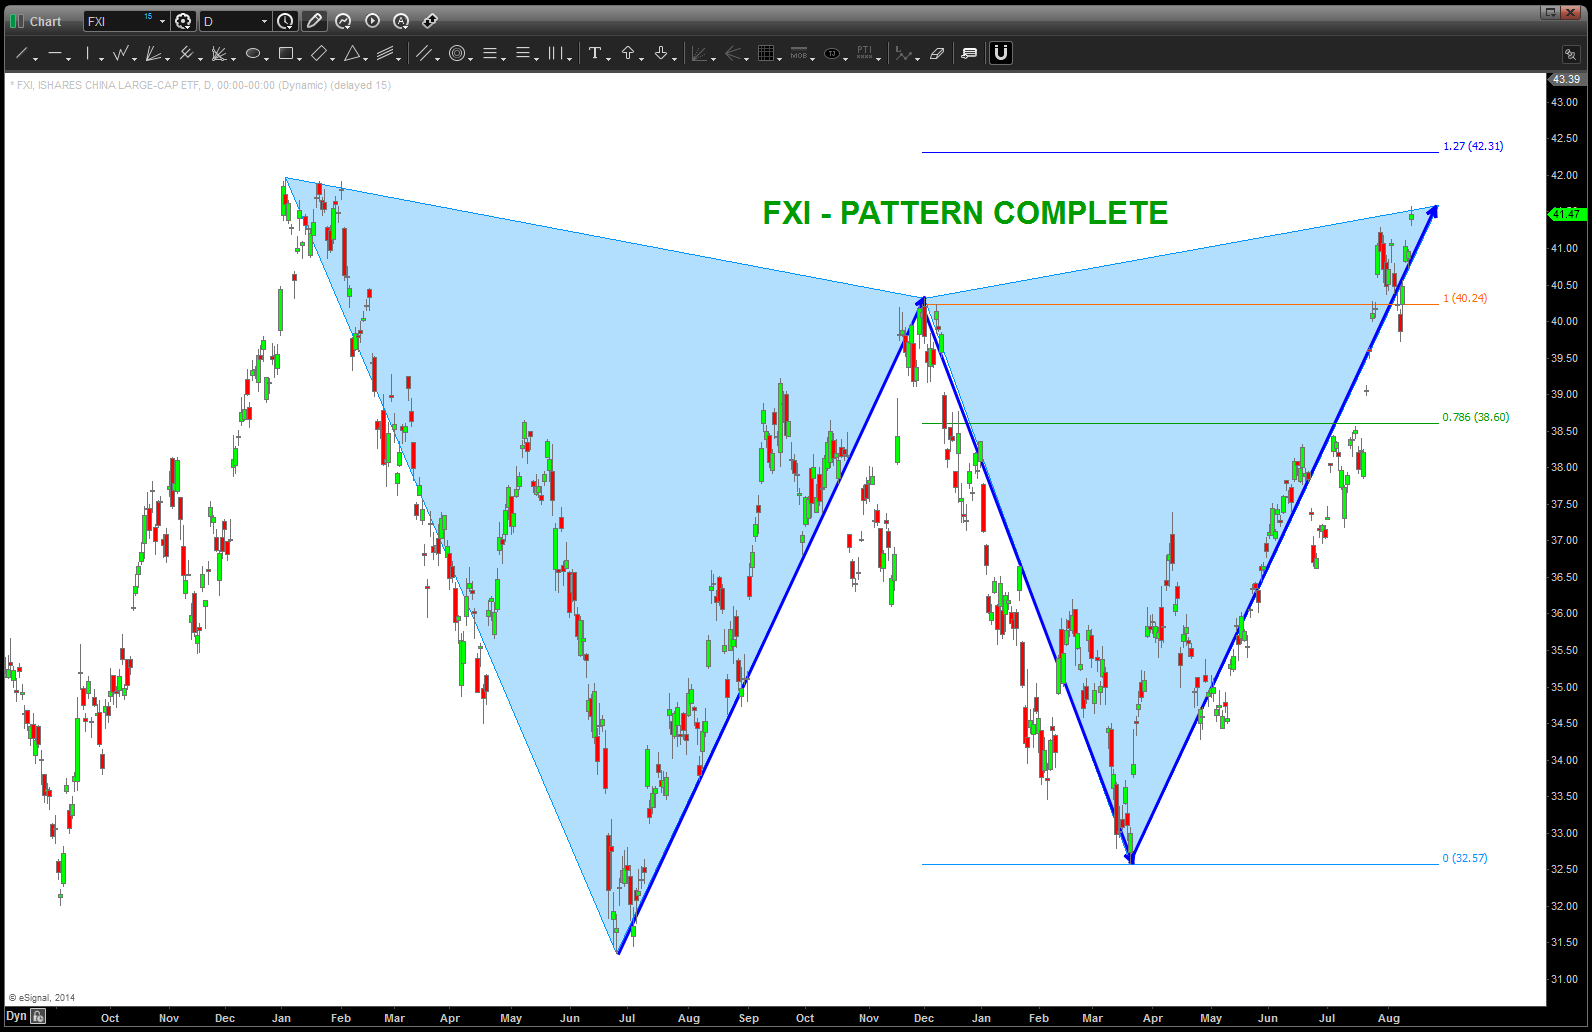
Copper – folks, still sticking w/ a MAJOR 5 wave move in copper complete. More to the downside and, remember, how FXI (China) likes/mirrors copper ….