is the Sun going to set or rise in Japan (aka the Land of the Rising Sun)
CLIFF NOTES: for the reasons shown below, 102.70 is the KEY level for the USD vs JPY. If we exceed this level, then believe the USD will begin to soar again vs the YEN.
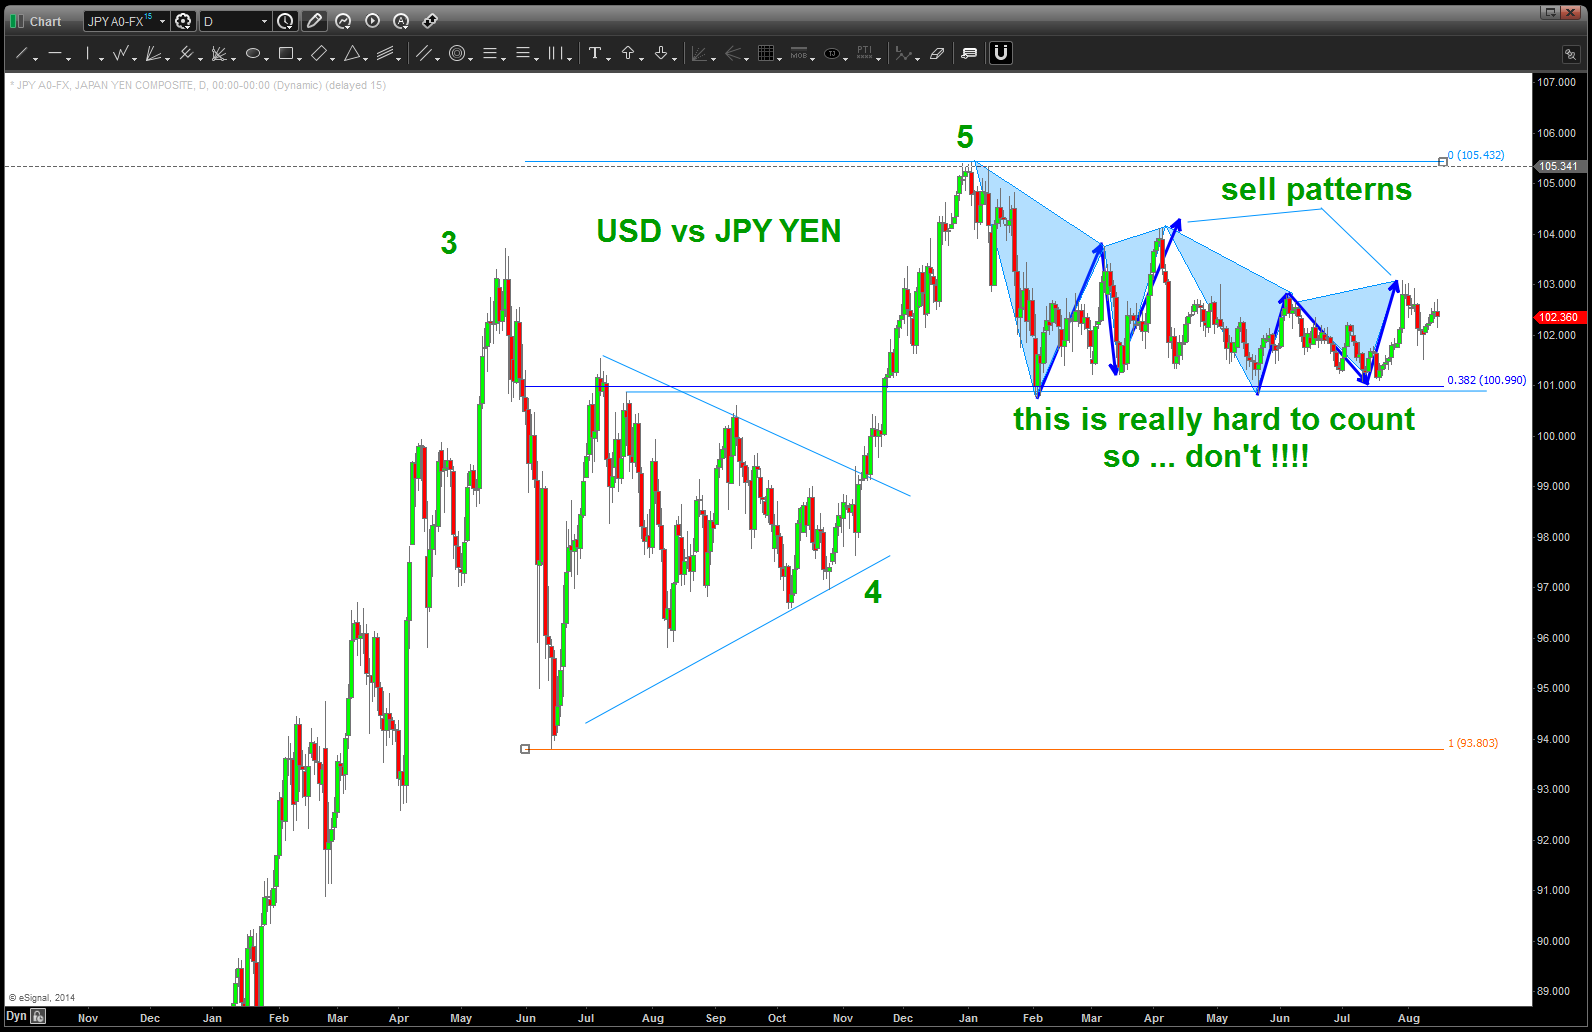
Going to try and work thru the entire “Elliott is good // Elliott is bad argument” by simply saying when it’s an easy count use it and when it’s not .. it’s probably correcting and if you can’t “see” it immediately then bail to another technical tool box. In the case of the USD vs JPY the weekly and daily count CLEARLY shows 5 waves up from the all time high of the JPY vs $$$.
We made the high around the first of the year and the pair has been consolidating/correcting ever since … the BULLISH aspect of this correction is it has held the .382 from the wave 4 triangle low … that’s bullish for the USD vs JPY.
What’s interesting to note is we have had two sell patterns that have “worked” but have not been able to drop below the 101 handle ….take a peak:
now … here’s where Elliott can help you. In the chart below we have dropped down to a 2 hour chart and we have two potentialities occurring … either we have a 3 that subdivided and 4 just completed which calls for this pair to fall (JPY strength) OR we have a a-b-c correction complete and the USD might begin to skyrocket against the JPY (which OBTW will cause the Nikkei 225 to skyrocket also …the GOOD THING – we know exactly where we are w/ regards to 102.70. Check it out:
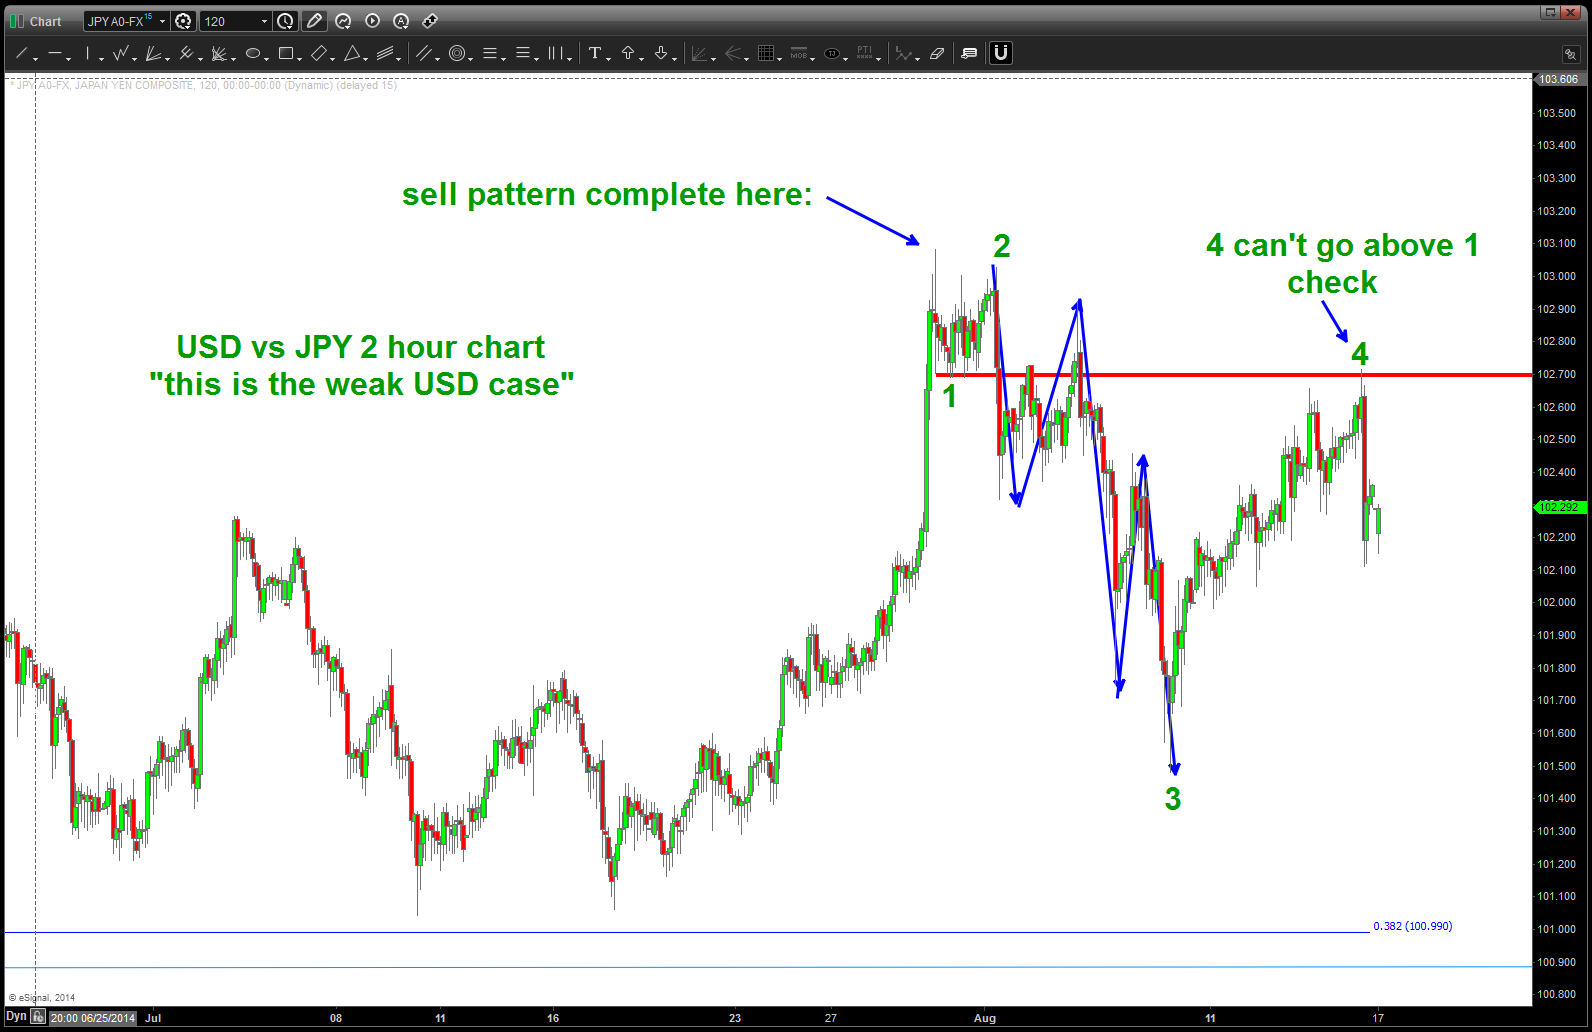
this is showing 4 complete and we should be going DOWN
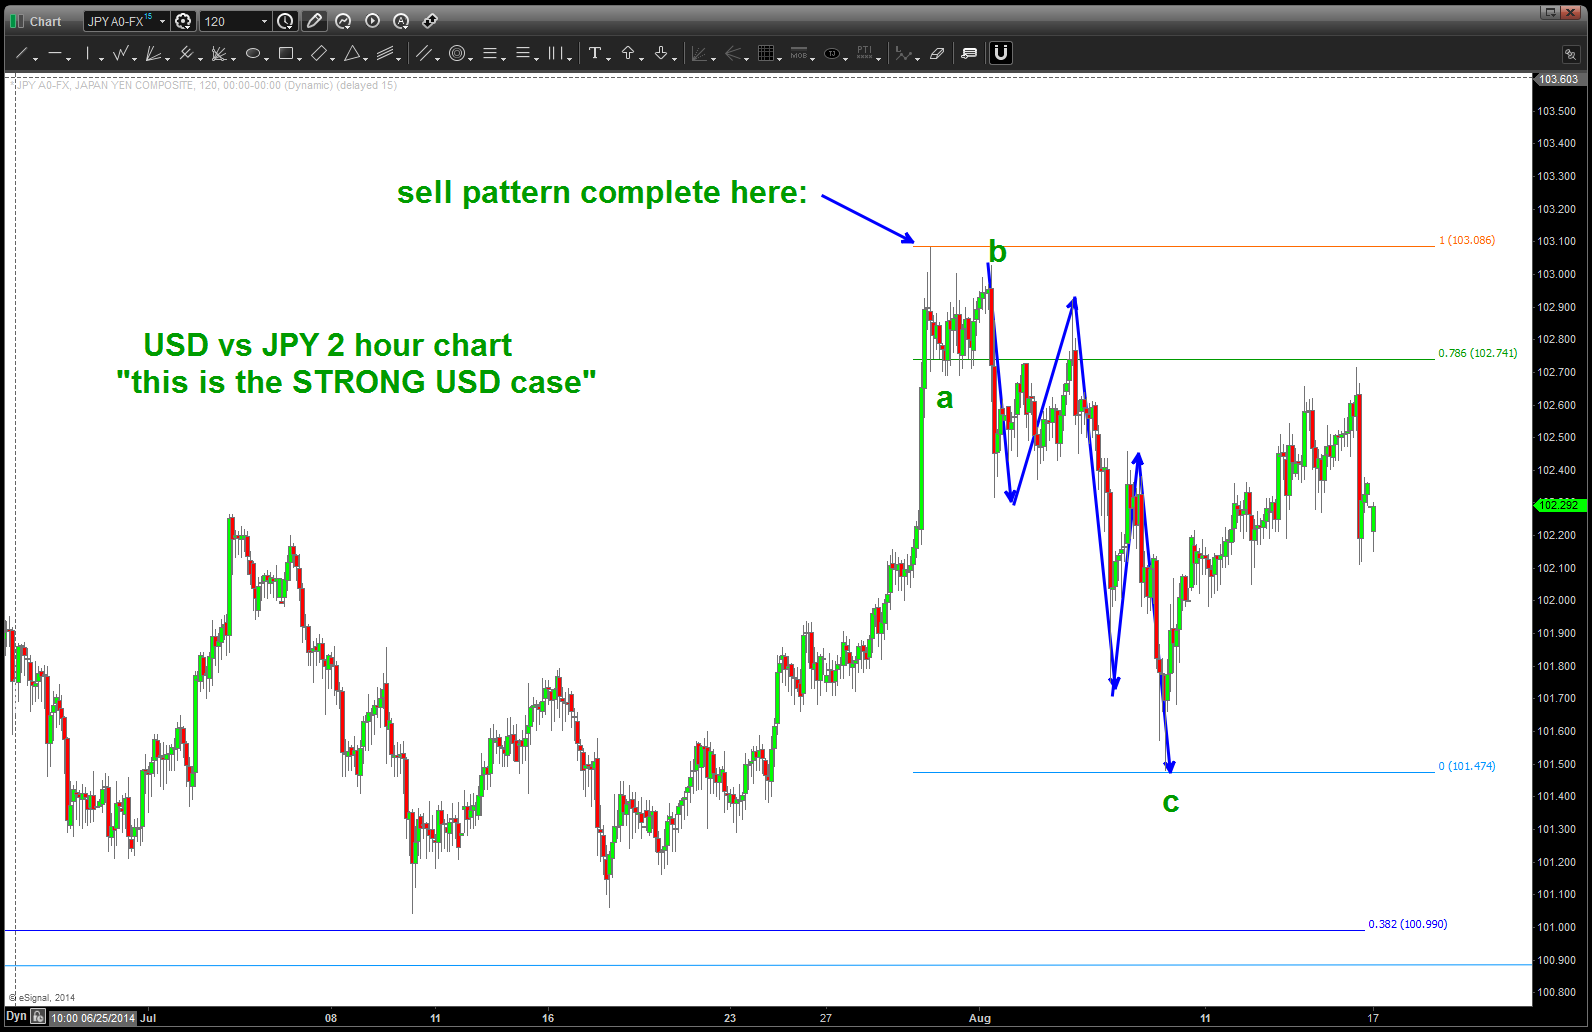
this is the STRONG dollar case and we completed an a-b-c correction and it’s going to take off
now, below is the NK 225 futures (continuous) overlaid on top of the USD vs JPY. NOTE THEY ARE ALMOST MIRROR IMAGES OF EACH OTHER …
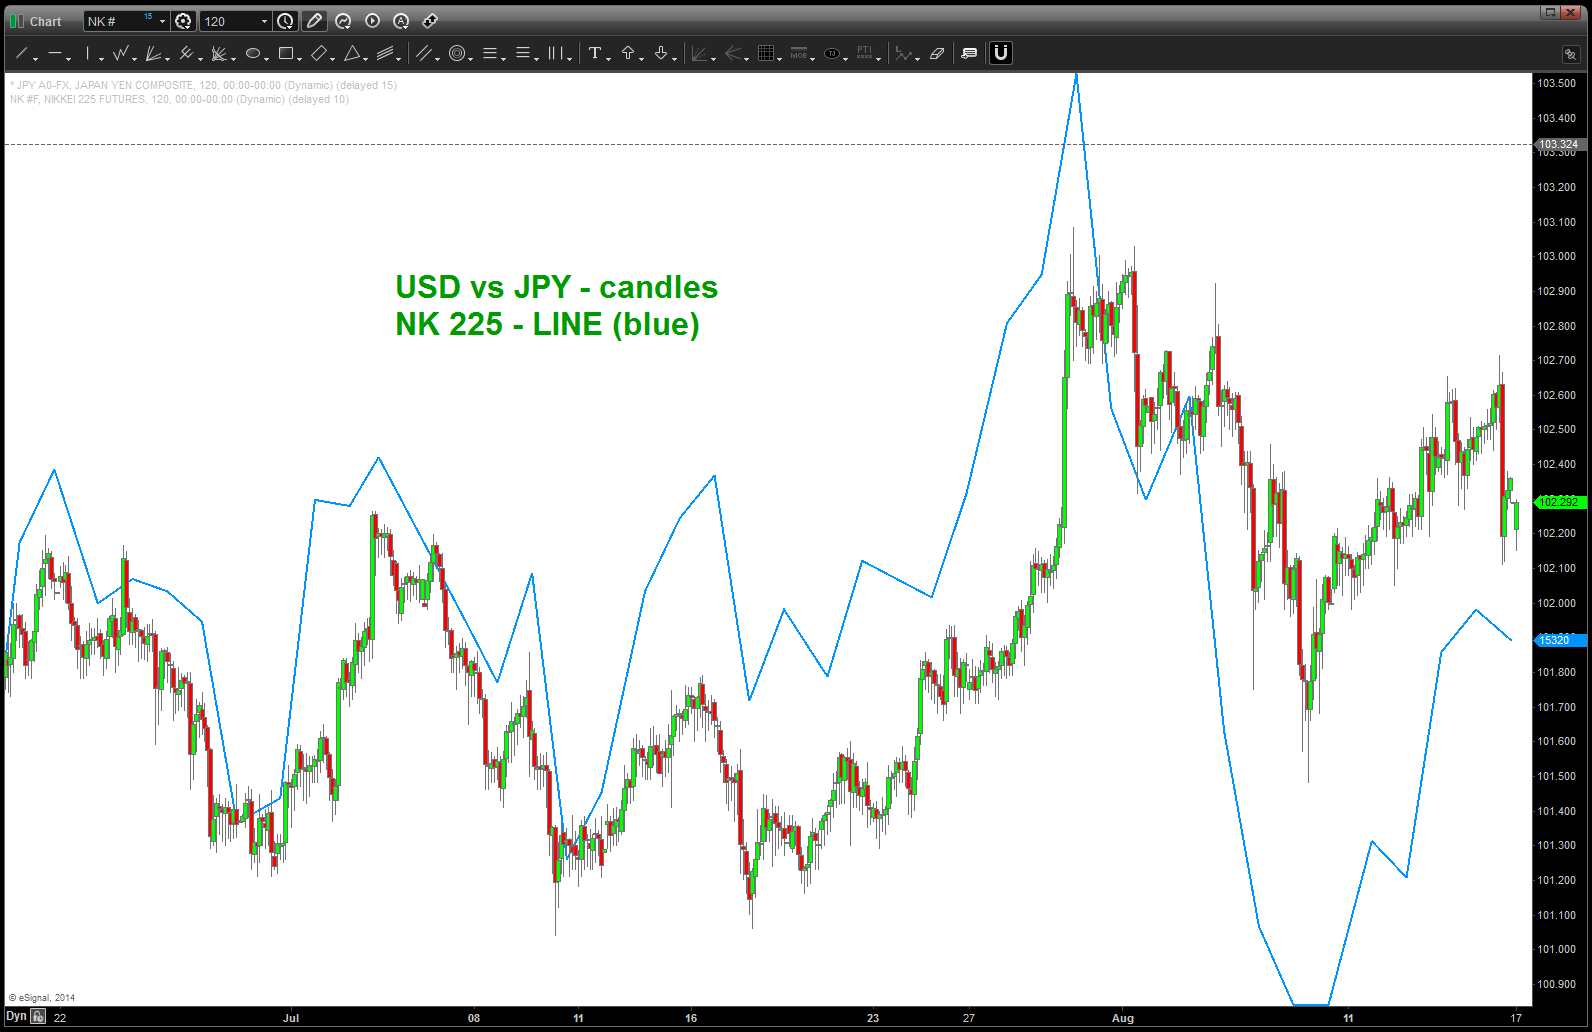
NK 225 overlaid on USD vs JPY (notice how synchronized they are)
last thing .. notice the TIME component of this correction. Since the all time low of the USD vs JPY (10/2011) the corrective timing has been about right for this most recent correction. TIME is a big deal so, perhaps, we won’t see any lower in the USD vs JPY and it’s time to rumble? My eye tells me the pattern in PRICE isn’t quite done going lower but we have to trade what we see and not believe. Standing by w/ levels above noted …
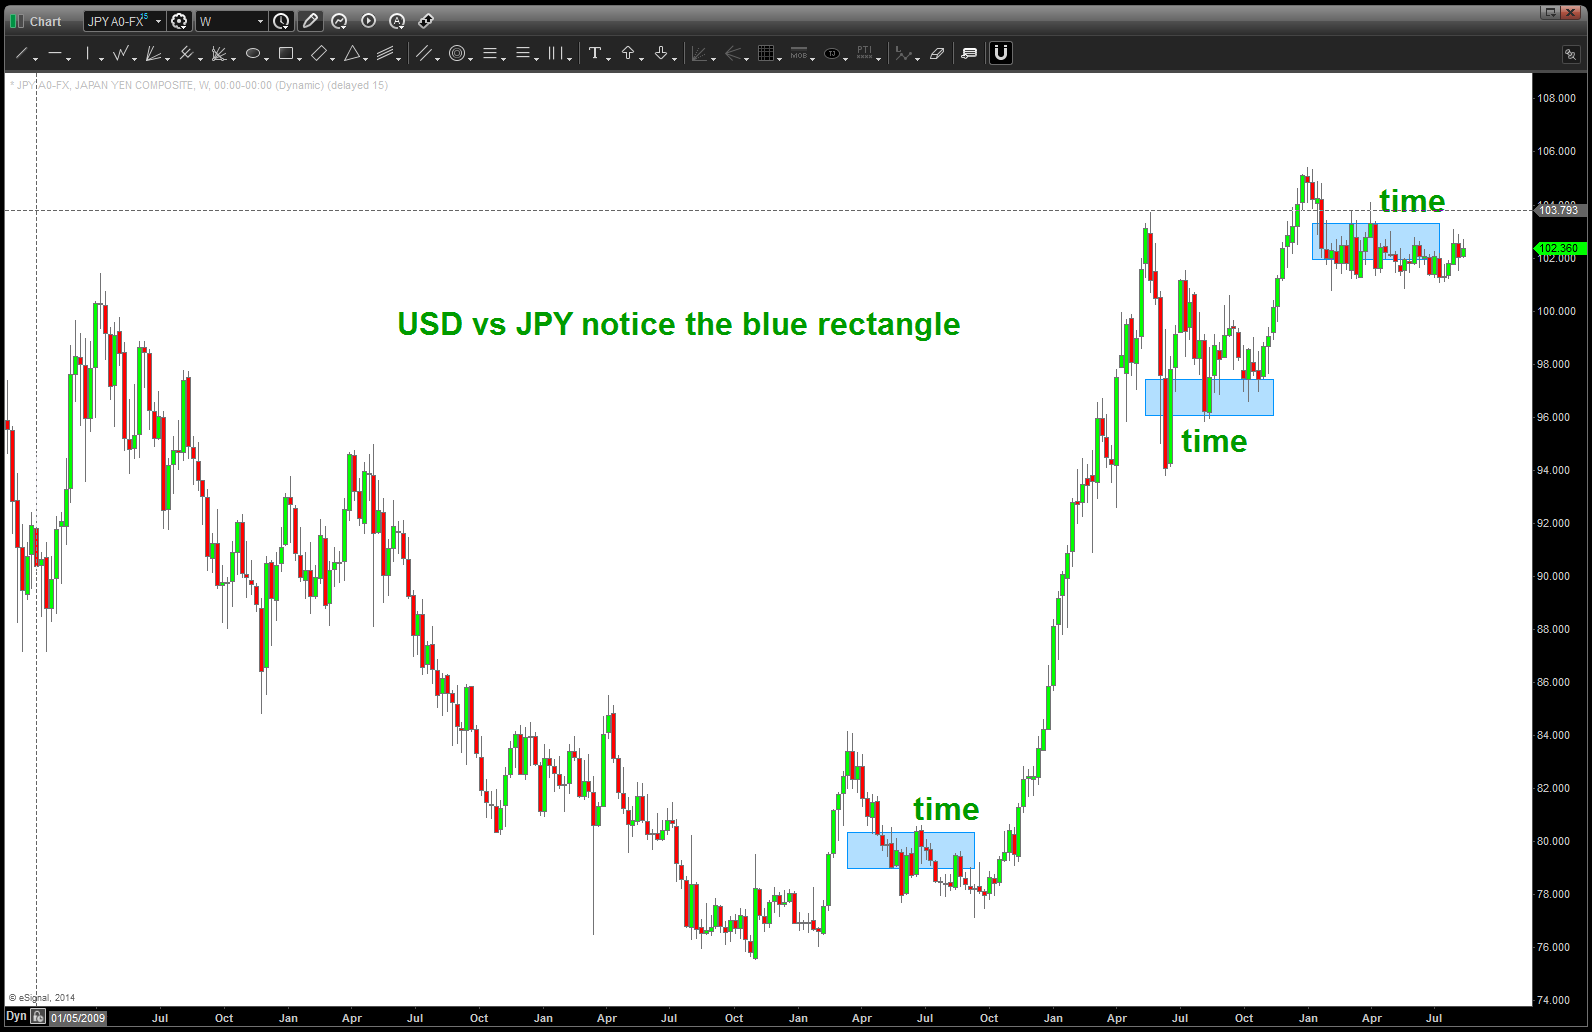
the TIME component of this correction is complete
