VooDoo or Sound Principles? Who cares …
Posted on August 19, 2014 1 Comment
for any of you who have followed this blog will attest – I simply live and die by the patterns. They are an edge …and edge is simply something that is more likely to happen than not. If I manage risk then the edge supports making money in the markets. I DO NOT care how one enters the market …there are more ways to enter the market than one could think and the brightest minds in the world are on the street coming up w/ all kinds of ways to make money in the market.
what works for me …? PATTERNS based on the fact that there is a collective ENERGY/VIBRATION to the market. And this ENERGY/VIBRATION repeats itself and because is vibration and energy then it will abide by the mathematics of musical theory, sacred geometry, square roots and blah blah blah …
my mentor and friend Mike Jenkins (www.stockcyclesforecast.com) taught me this very SIMPLE but POWERFUL method …. it’s total voodoo OR not ….
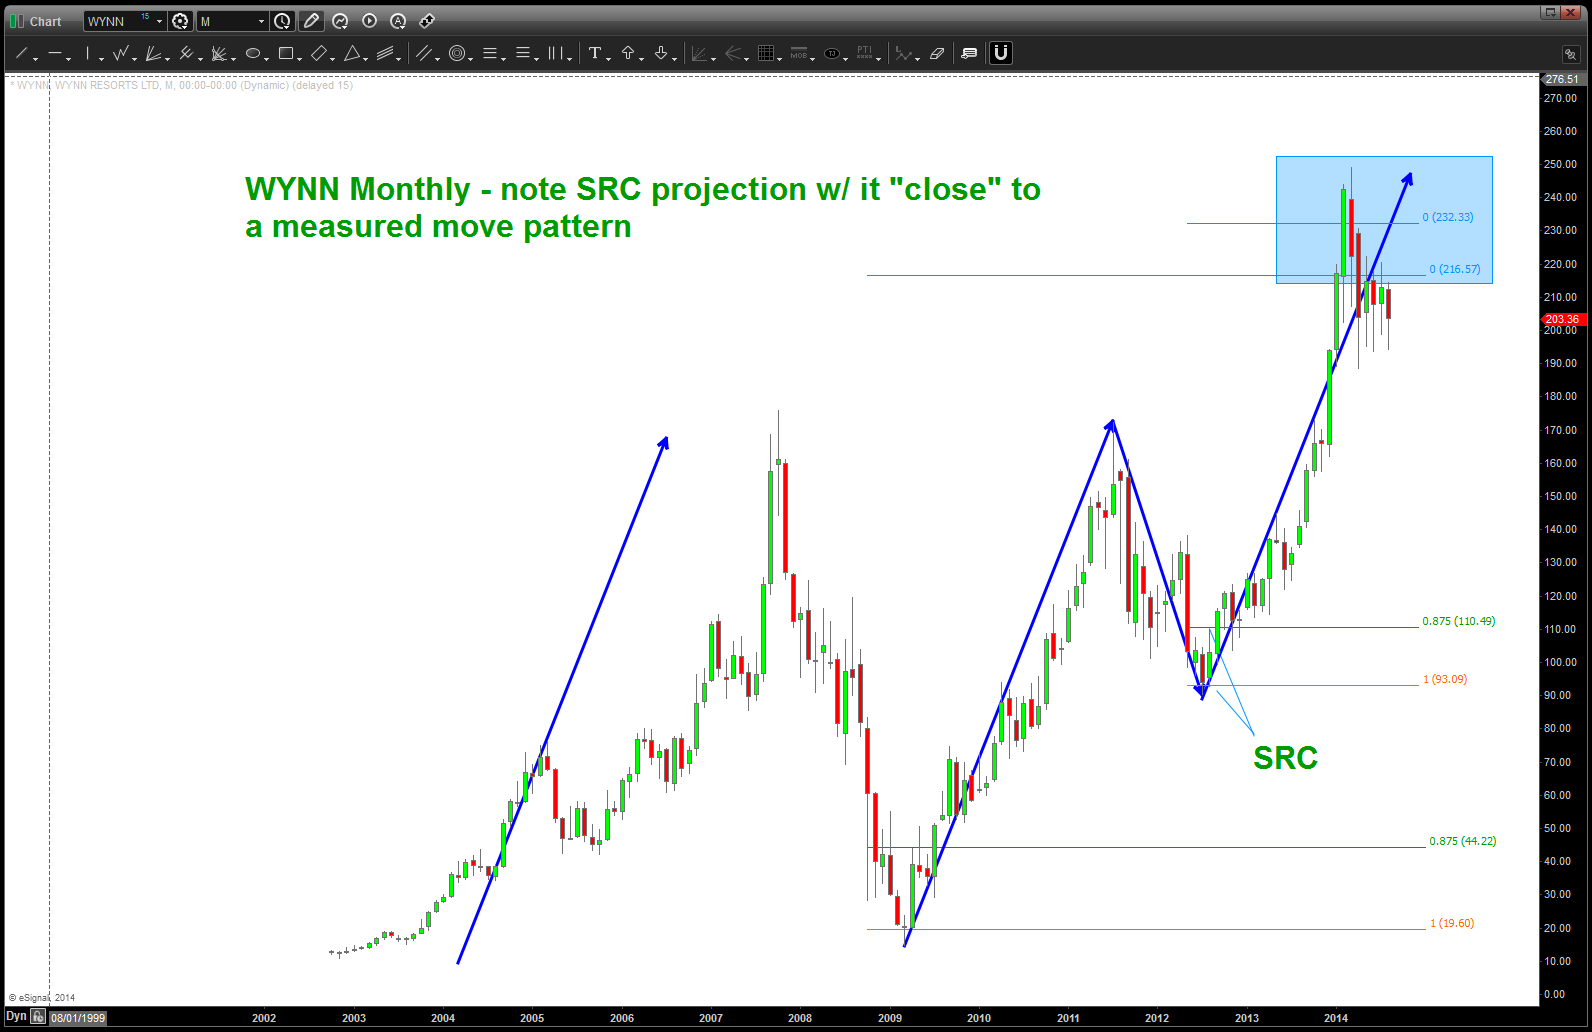
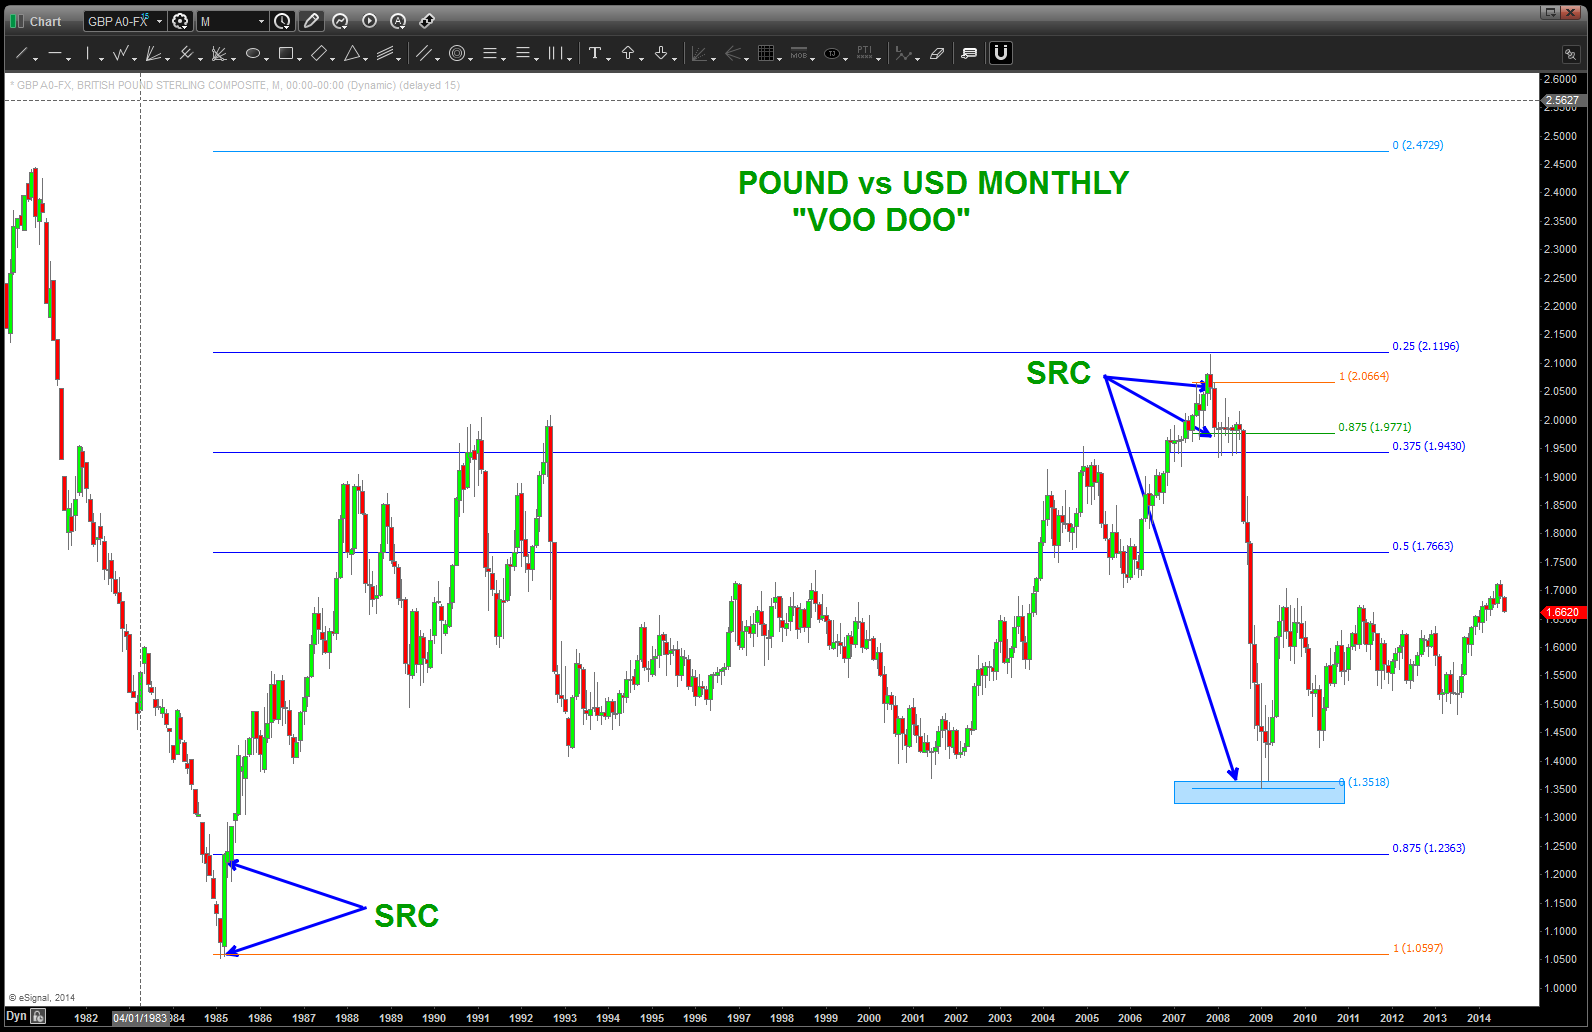
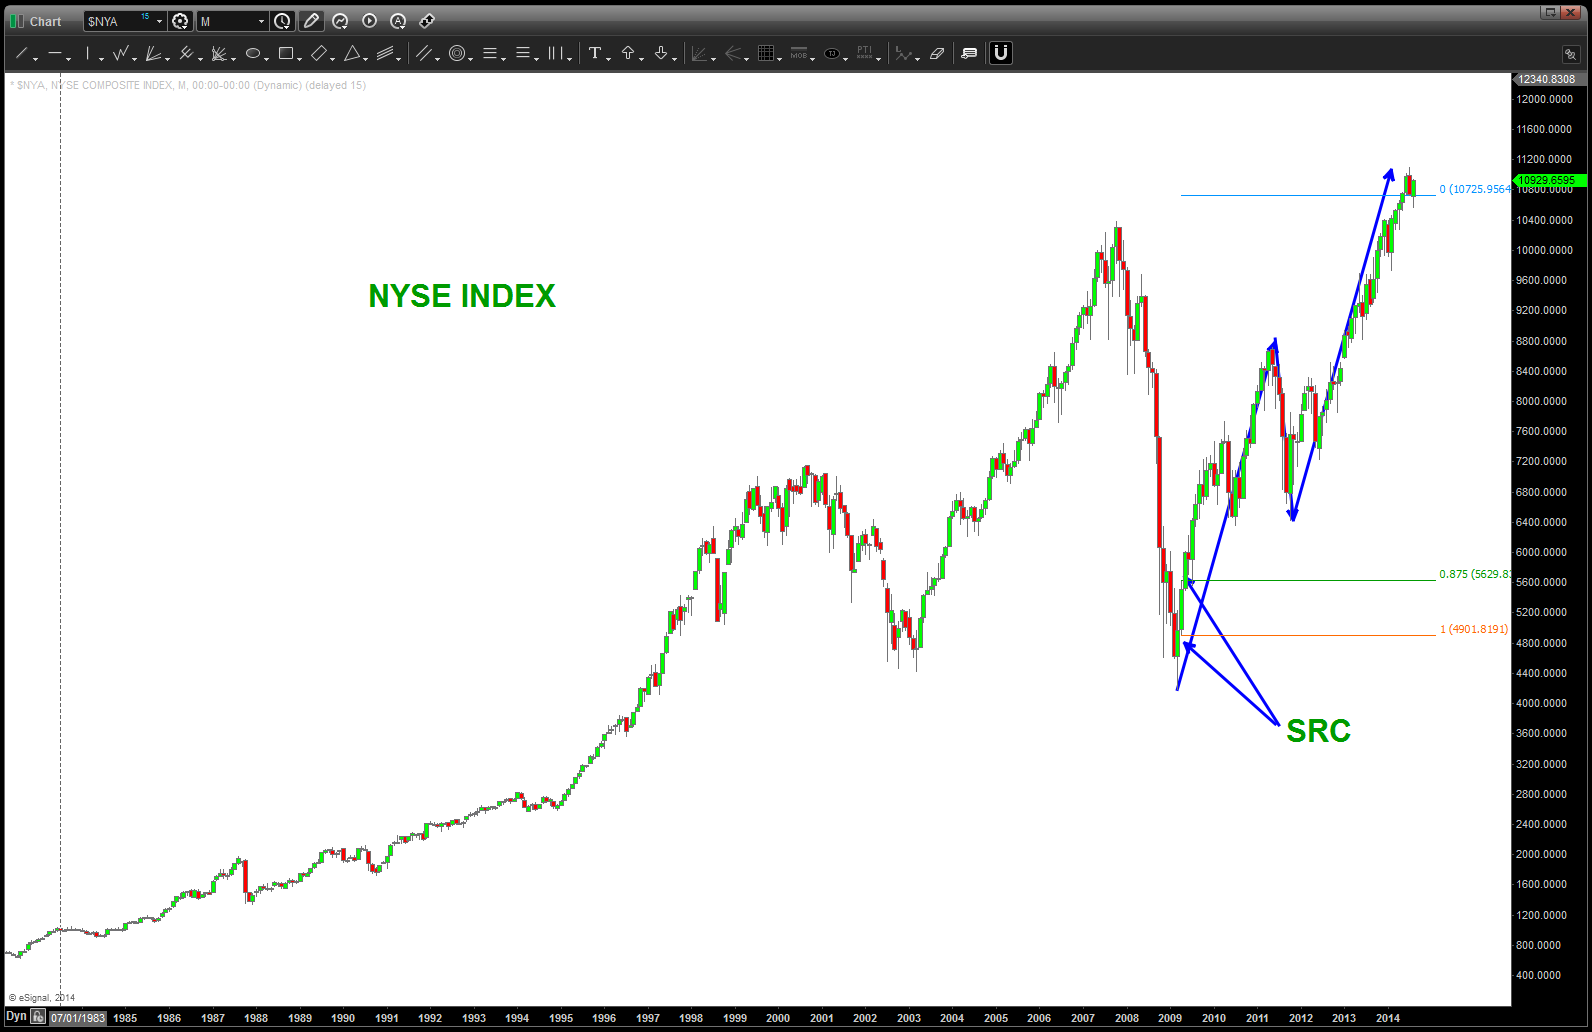
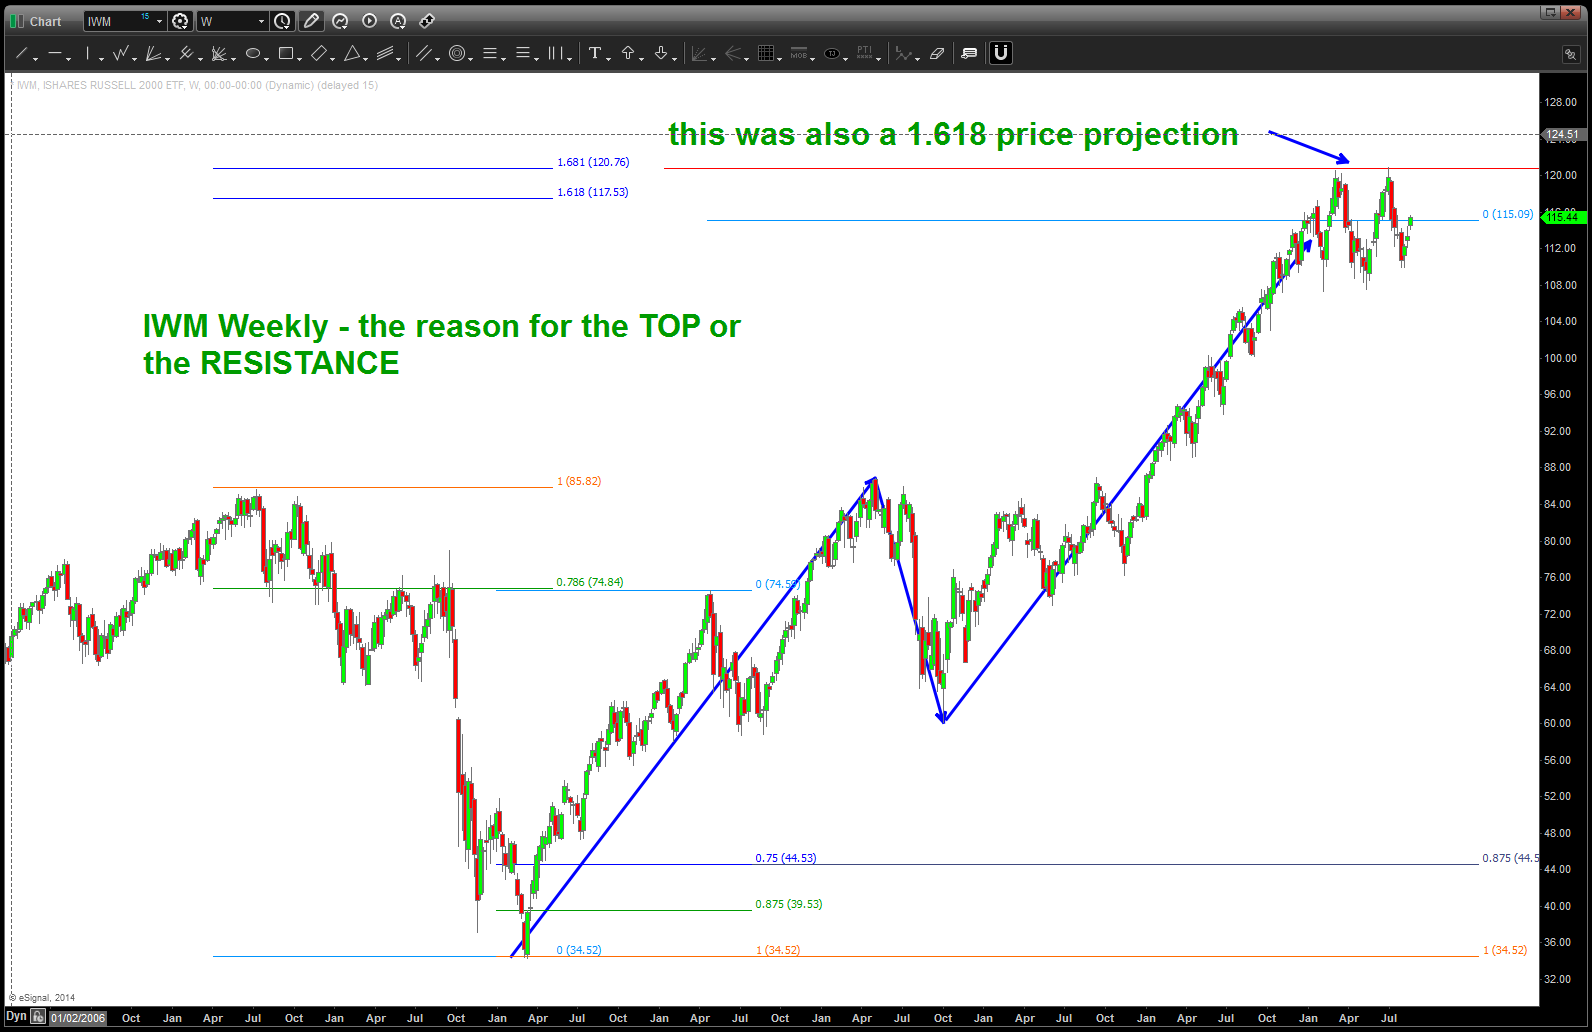
1. The Signal Reversal Candle on a LONG TERM chart is very very important. It’s the candle that erases the “emotion/energy/vibration” of the proceeding bull or bear market. It “usually” occurs on a MONTHLY chart.
2. Once you have a well defined MONTHLY SRC then, IF YOU BELIEVE THE MARKET IS MUSICAL (cliff notes: I do) THEN you simply use that SRC as the seed and define it as the UNIT which will define a run UP or DOWN.
3. In this example of the S&P you can see the SRC and how we simply sub-divided it and PROJECTED up into the 1996 area. That target “completes” this run …
4. As you are well aware this is an EDGE! Right … it’s a target and an edge that MIGHT work or MIGHT not but, I’m certainly aware of this target. Look at what happened to the PATTERN on HD – it got smoked today. That same pattern STOPPED IN ITS TRACKS – the DAX, Boeing (BA), WYNN, IBB (buy), etc etc ….so, it’s all probability and that’s OK, for me. Also, don’t use it alone … work your own technicals, moving averages, oscillators, fundamentals – whatever – but be aware of these levels.
5. Last thing – I’m going to pick two or three securities that I have NEVER done this before and just do this technique and see what happens. Not that many, but a couple because, well I’m tried after Bikram Yoga.
Hey, hope you are having a great week!
Bart

1/8 th intervals of the Signal Reversal Candle
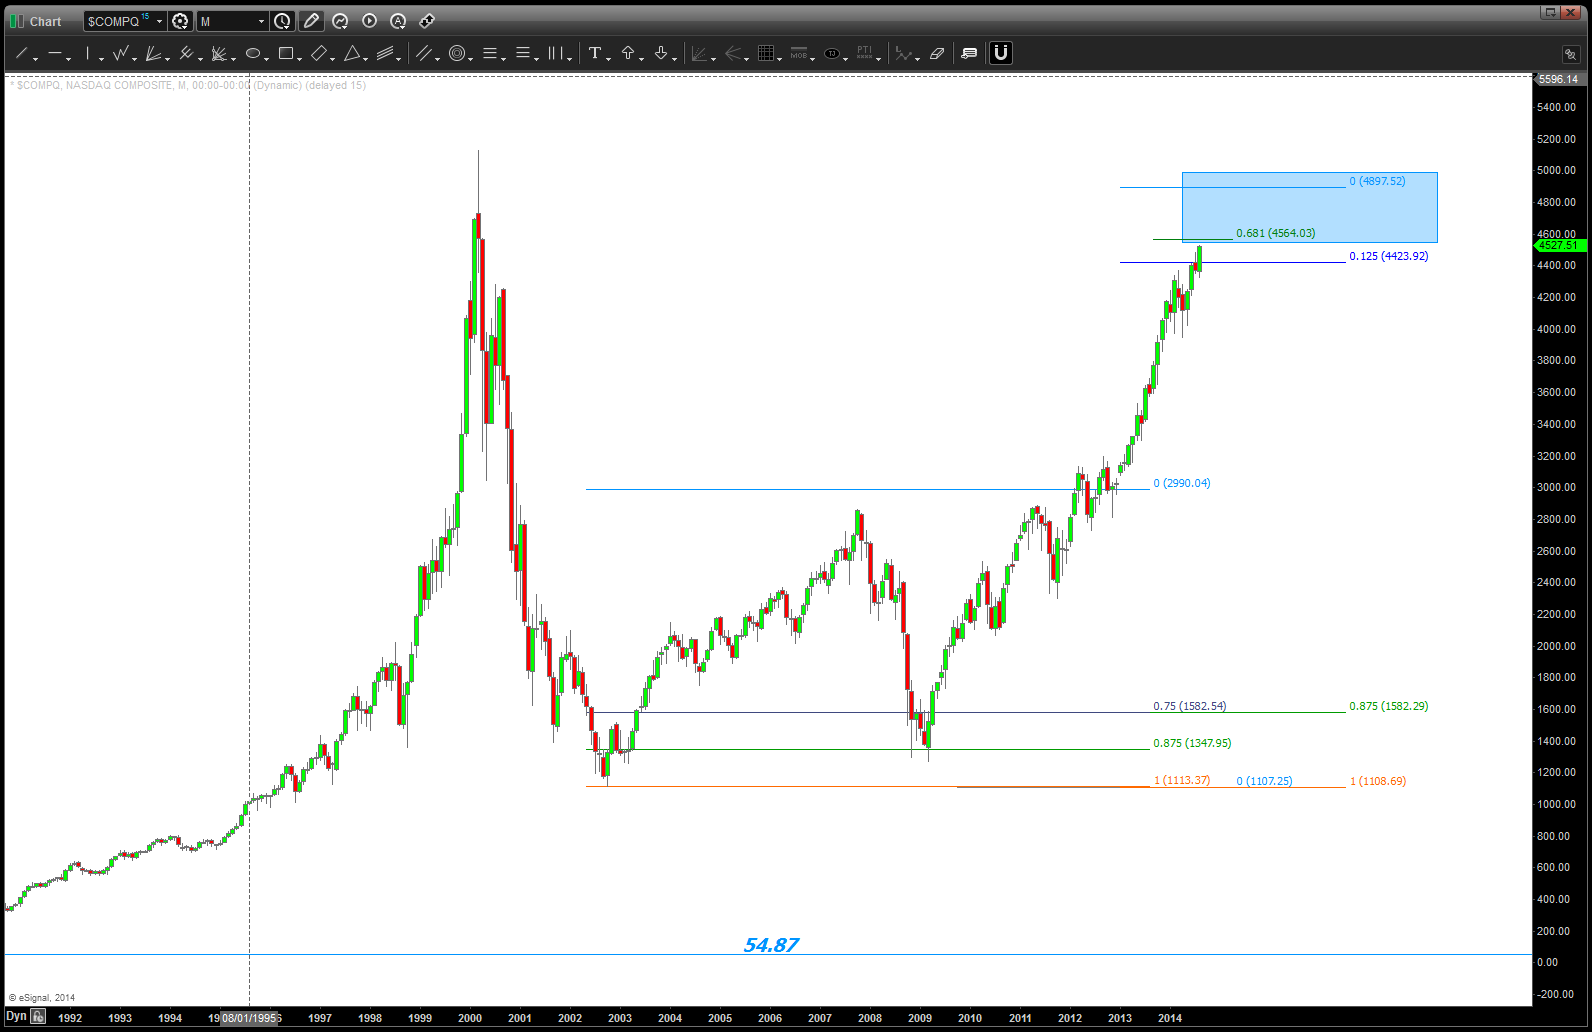
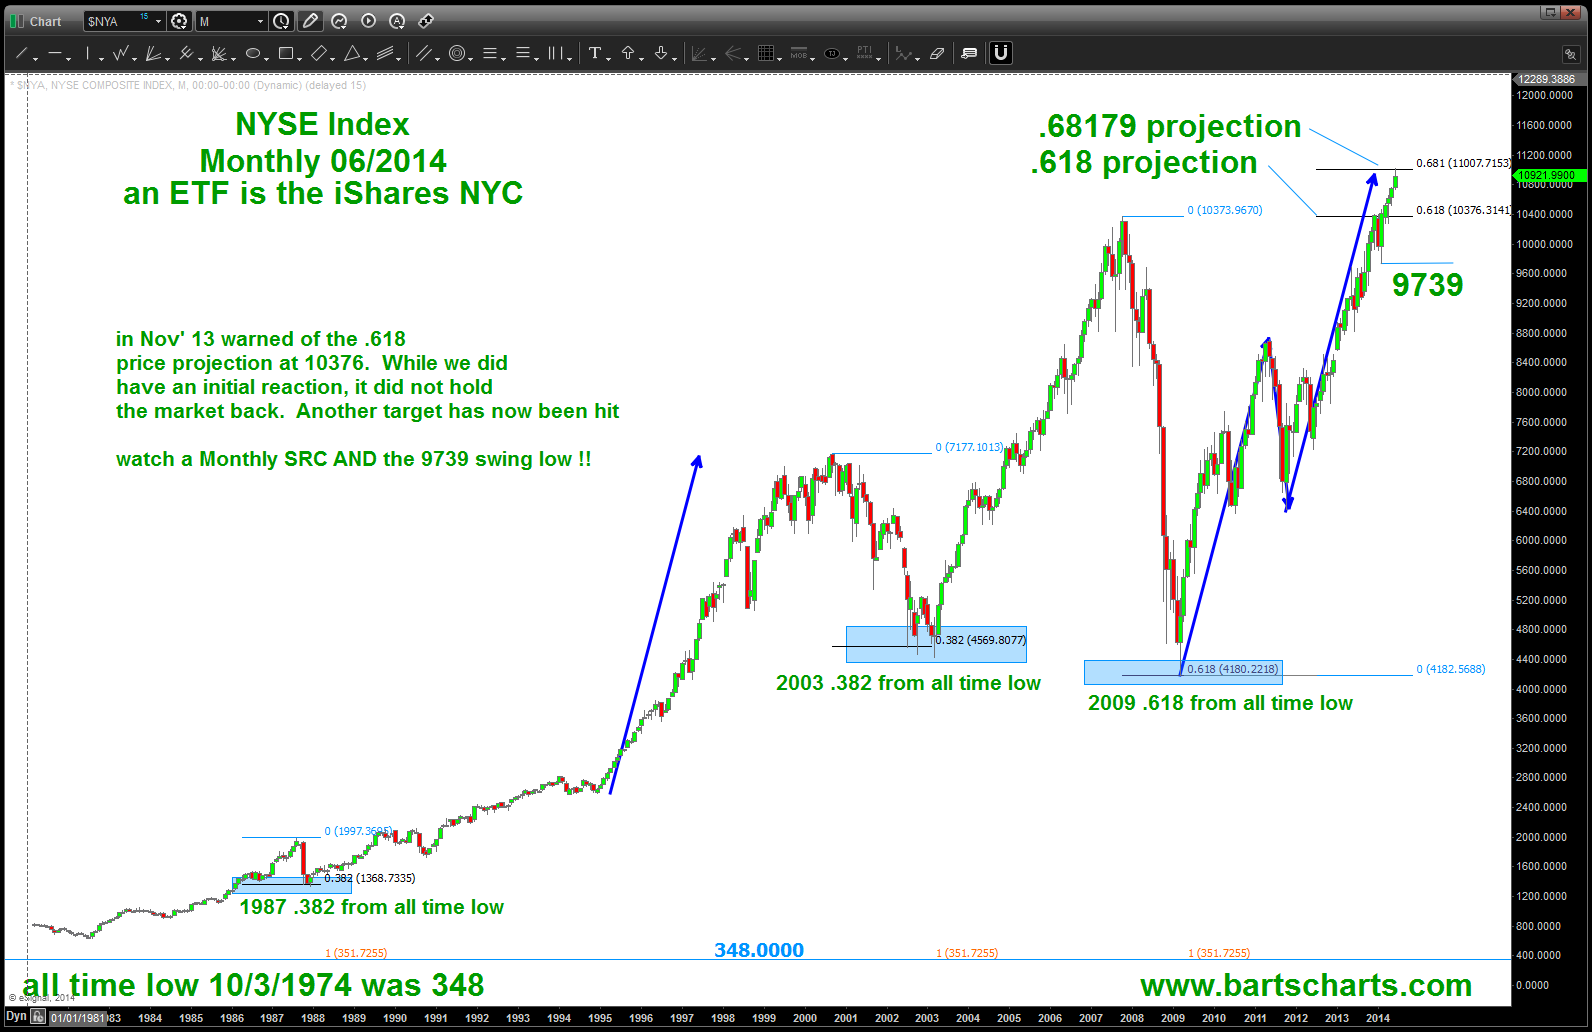
NASDAQ targets … note the .68179 target
in my mind, the only Voo Doo out there is the Federal Reserve …
GN
a “relative strength ratio” revisted …about to fall off a cliff?
Posted on August 19, 2014 Leave a Comment
CLIFF NOTES: the XLP/$NYA ratio, when it inflects UP or DOWN, has been responsible for every major pivot in the US Equity Structure over the past 14 years. It is sitting on a cliff of support, which if lost, will signify a move OUT OF “risk adverse” asset class of staples and I would expect the entire equity complex to explode in a phase transition of parabolic proportions. Stay tuned … if it holds, then perhaps the SELL pattern on the $NYA will hold and a “normal” and “needed” correction will ensue. Trying to be to the point and point readers in a less looked at aspect of institutional rotation and flow of funds.
Let’s start at the beginning w/ definitions –
New York Stock Exchange Index ($NYA):
- An index that measures the performance of all stocks listed on the New York Stock Exchange. The NYSE Composite Index includes more than 1,900 stocks, of which over 1,500 are U.S. companies. Its breadth therefore makes it a much better indicator of market performance than narrow indexes that have far fewer components. The weights of the index constituents are calculated on the basis of their free-float market capitalization. The index itself is calculated on the basis of price return and total return, which includes dividends.
- The two biggest benefits to investors of the NYSE Composite Index are (a) its quality, since all its constituents have to meet the stringent listing requirements of the exchange, and (b) its global diversification, with non-US companies accounting for more than one-third of market capitalization. NYSE-listed foreign companies have their headquarters in 38 different countries, with the most foreign issuers from Canada, China, the U.K., Japan and Mexico.
Consumer Staples (XLP)
- Essential products such as food, beverages, tobacco and household items. Consumer staples are goods that people are unable or unwilling to cut out of their budgets regardless of their financial situation. Consumer staples stocks are considered non-cyclical, meaning that they are always in demand, no matter how well the economy is performing.
- Consumer staples can be a good option for investors seeking slow and steady growth.
Ratio Analysis using Technical Patterns:
- Numerator / Denominator
- If we want to see if a certain (security vs sector) or (security vs security) or (sector vs sector) or (whatever) we put one on top of the other. IF the ratio goes UP then the top “thing” is stronger. If the ratio goes DOWN the bottom “thing” is stronger
XLP/$NYA :
- w/ the definition of staples above, one would think that “institutional money” would rotate into defensive names during times of volatility, corrections or bear markets.
- if we plot the ratio above THEN when XLP/$NYA goes DOWN we can think the party continues … when it completes a bottoming pattern and goes back up then a defensive rotation should occur signifying relative strength increasing and a move into the staples.
So, w/ the definitions complete, let’s see where we are:
In the charts below you can see that, back in June we saw a pattern completing in/around the 10900-11080 level. It did in fact hit and the market sold off. The broader indices are making new highs and the bullish aspects of this current picture are unquestionable strong. On an intraday basis, we are approaching a key level at 10988. If we are going lower then I would expect it too hold as resistance.
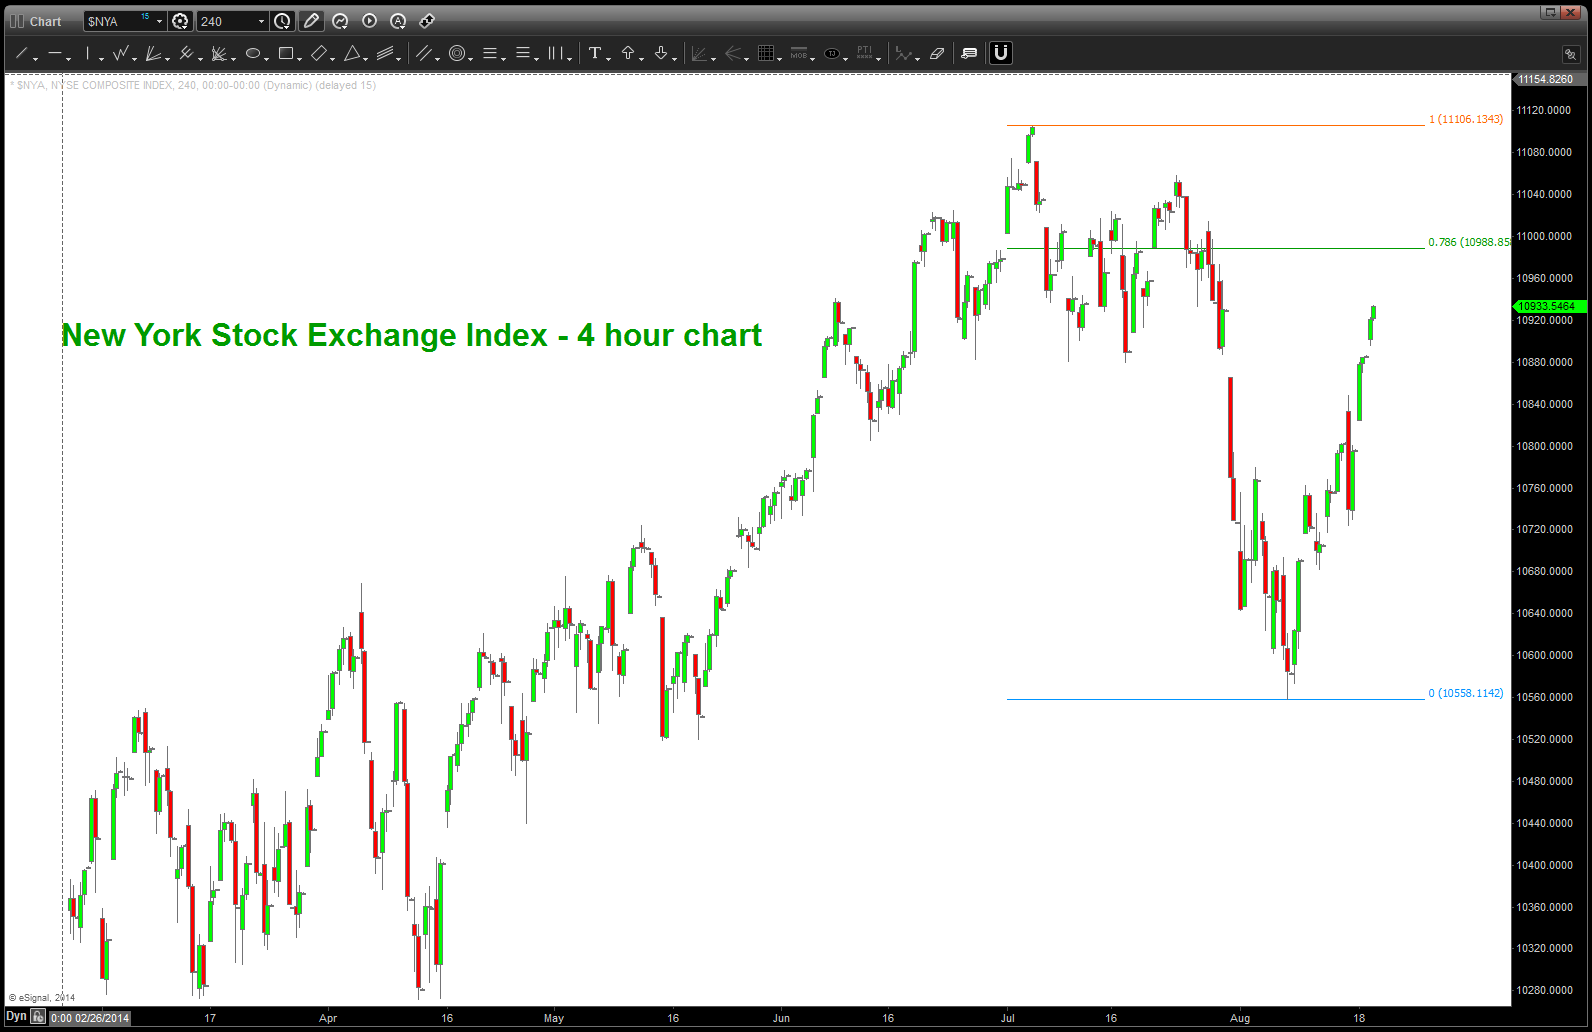
NYSE Index 4 hour chart
here are the charts from June 2014.
doing some geometry work, but basically showing resistance as noted in the above chart.

now, what about the ratio? Is that telling us anything of importance? Well, yes.
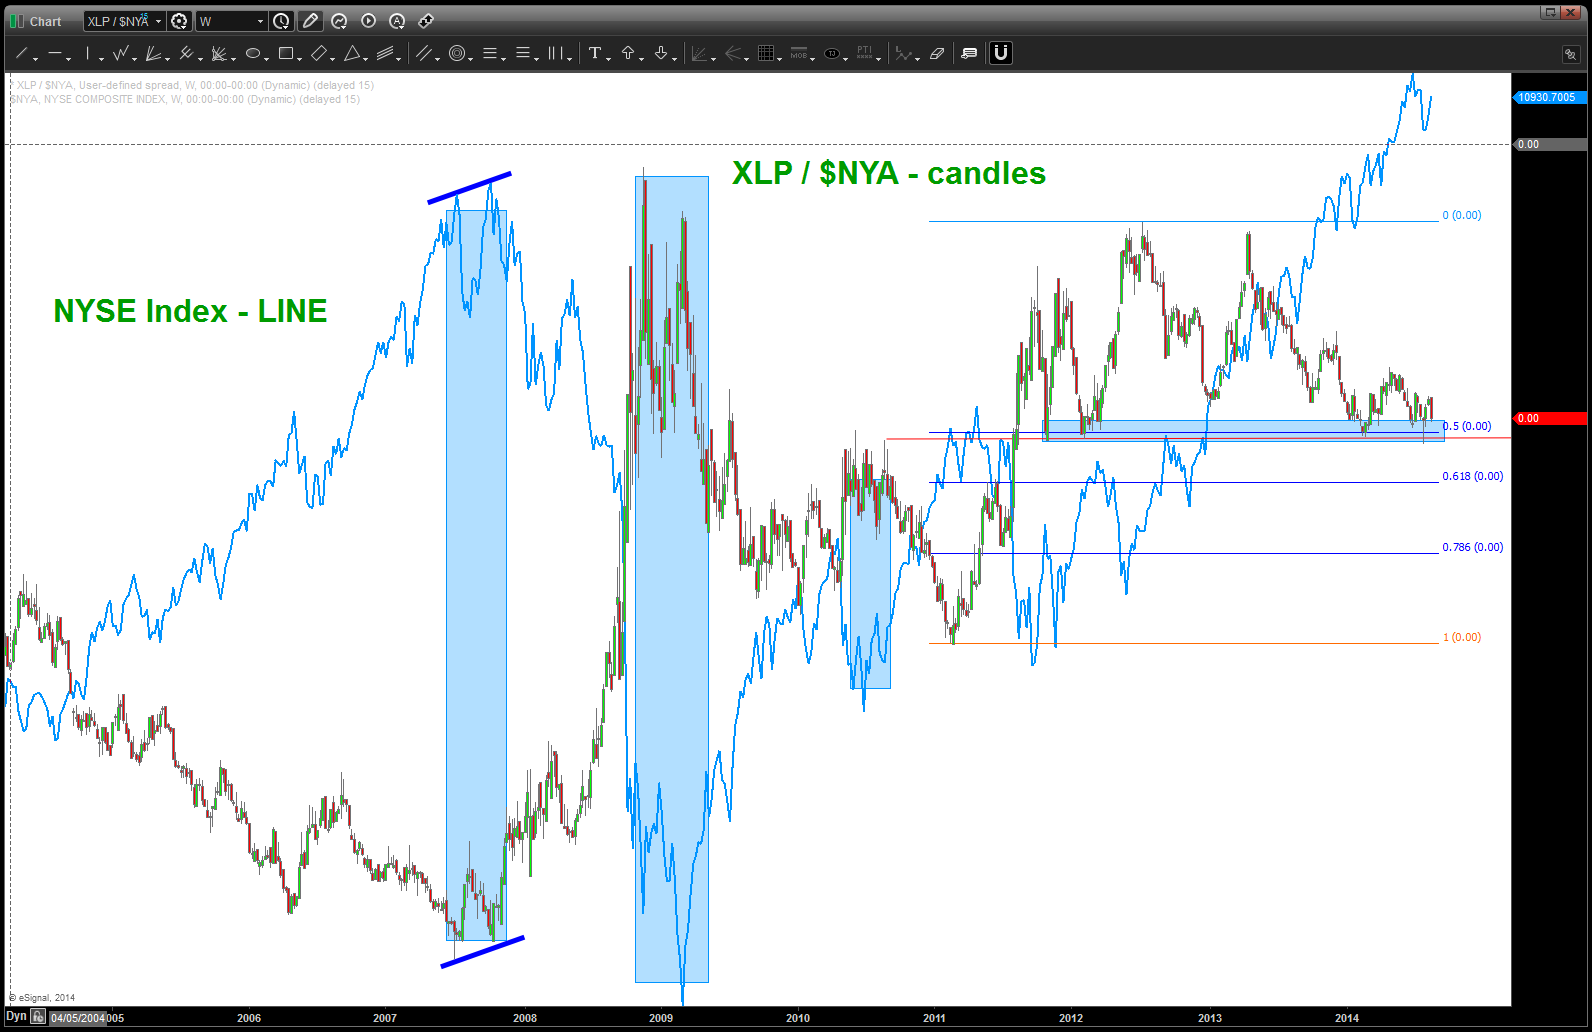
Ratio Analysis w/ $NYA overlaid on top of the ratio
Bunch of stuff going on here:
- the blue line is the $NYA
- the candles is the ratio of XLP/$NYA
- note the blue rectangles – at every MAJOR pivot the ratio is almost a mirror image of the $NYA.
- the big “clue here” is that the ratio has held the 50% retracement level since 10/2011. folks, that’s almost 3 years. stop and think for a moment about that one … notice in the past we had straight UP moves and DOWN moves which corresponded very nicely to the $NYA equally and opposite. HOWEVER, now for almost 3 years the XLP has, on a relative strength basis, held it’s own, so to speak.
- this divergence is something to watch and be very aware. YES, I know that we are continuing higher and higher. I also know that it’s been confirmed that the Central Banks around the world have injected 29 trillion (yes 29 trillion) into the US equity structure…it’s the greatest ponzi scheme of our time.
- what’s the bullish picture … ? Well if we lose that level to the downside that has held for 3 years THEN this market will EXPLODE higher and vacuum into the stratosphere. not that I don’t want that ….but I do want a NORMAL market. Folks a .382 correction is very bullish and natural …what’s so wrong w/ that?
If you do ratio analysis, you absolutely need to keep this level and pattern on your radar screen ….
BART
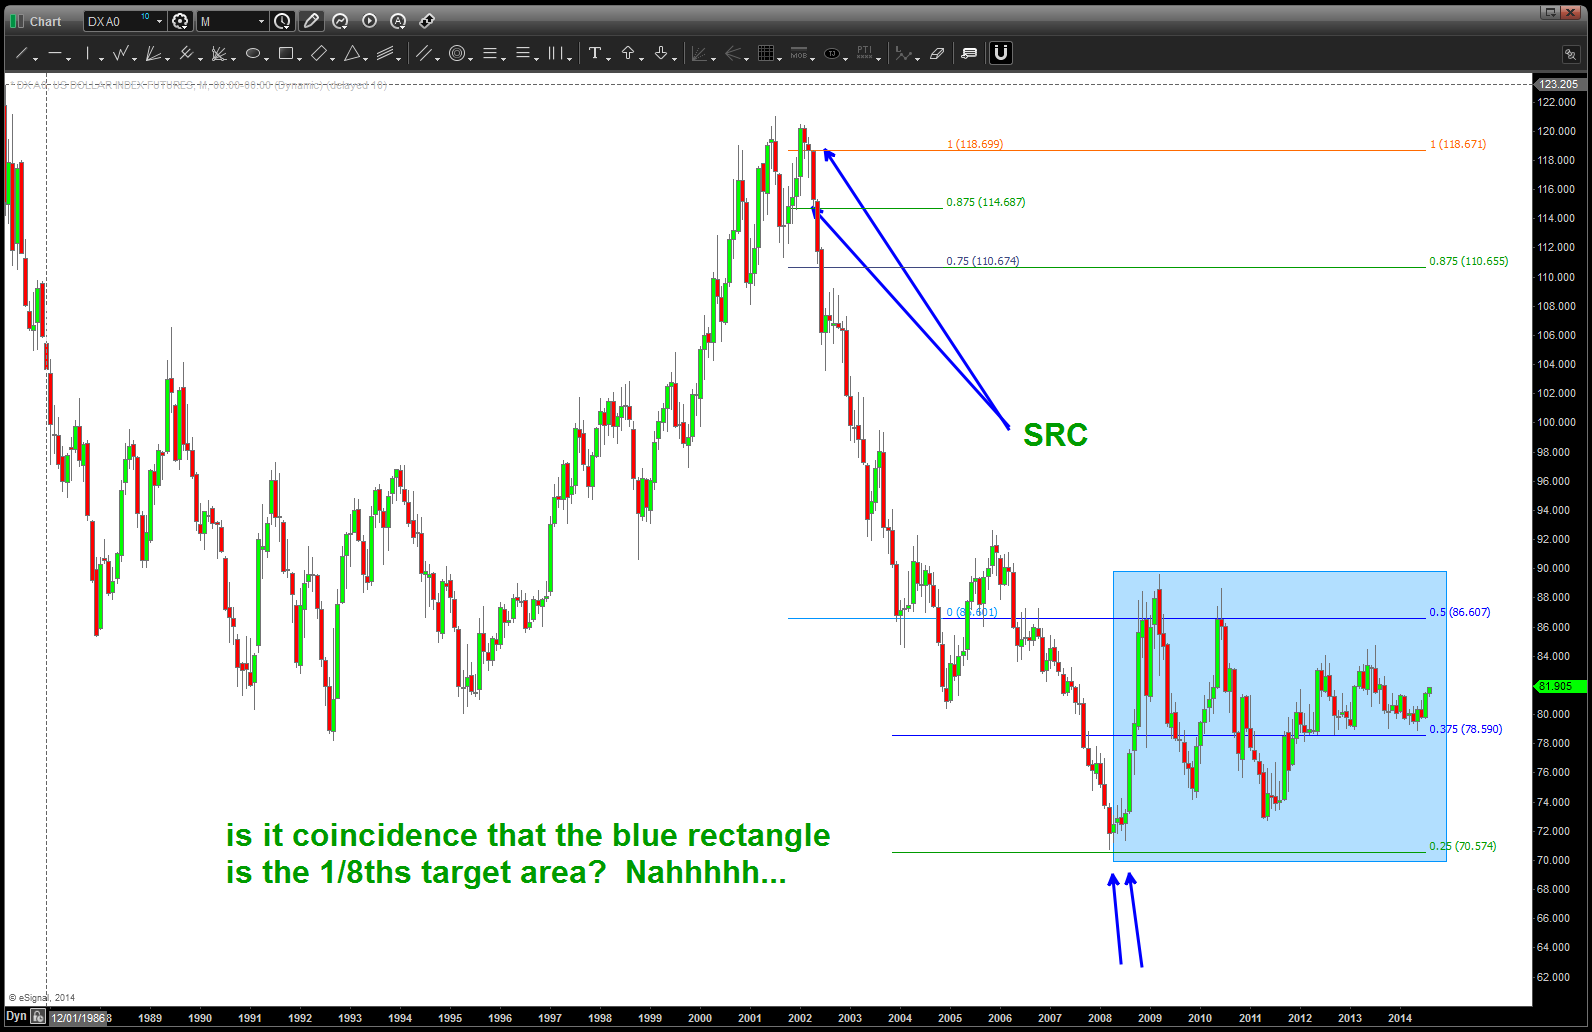
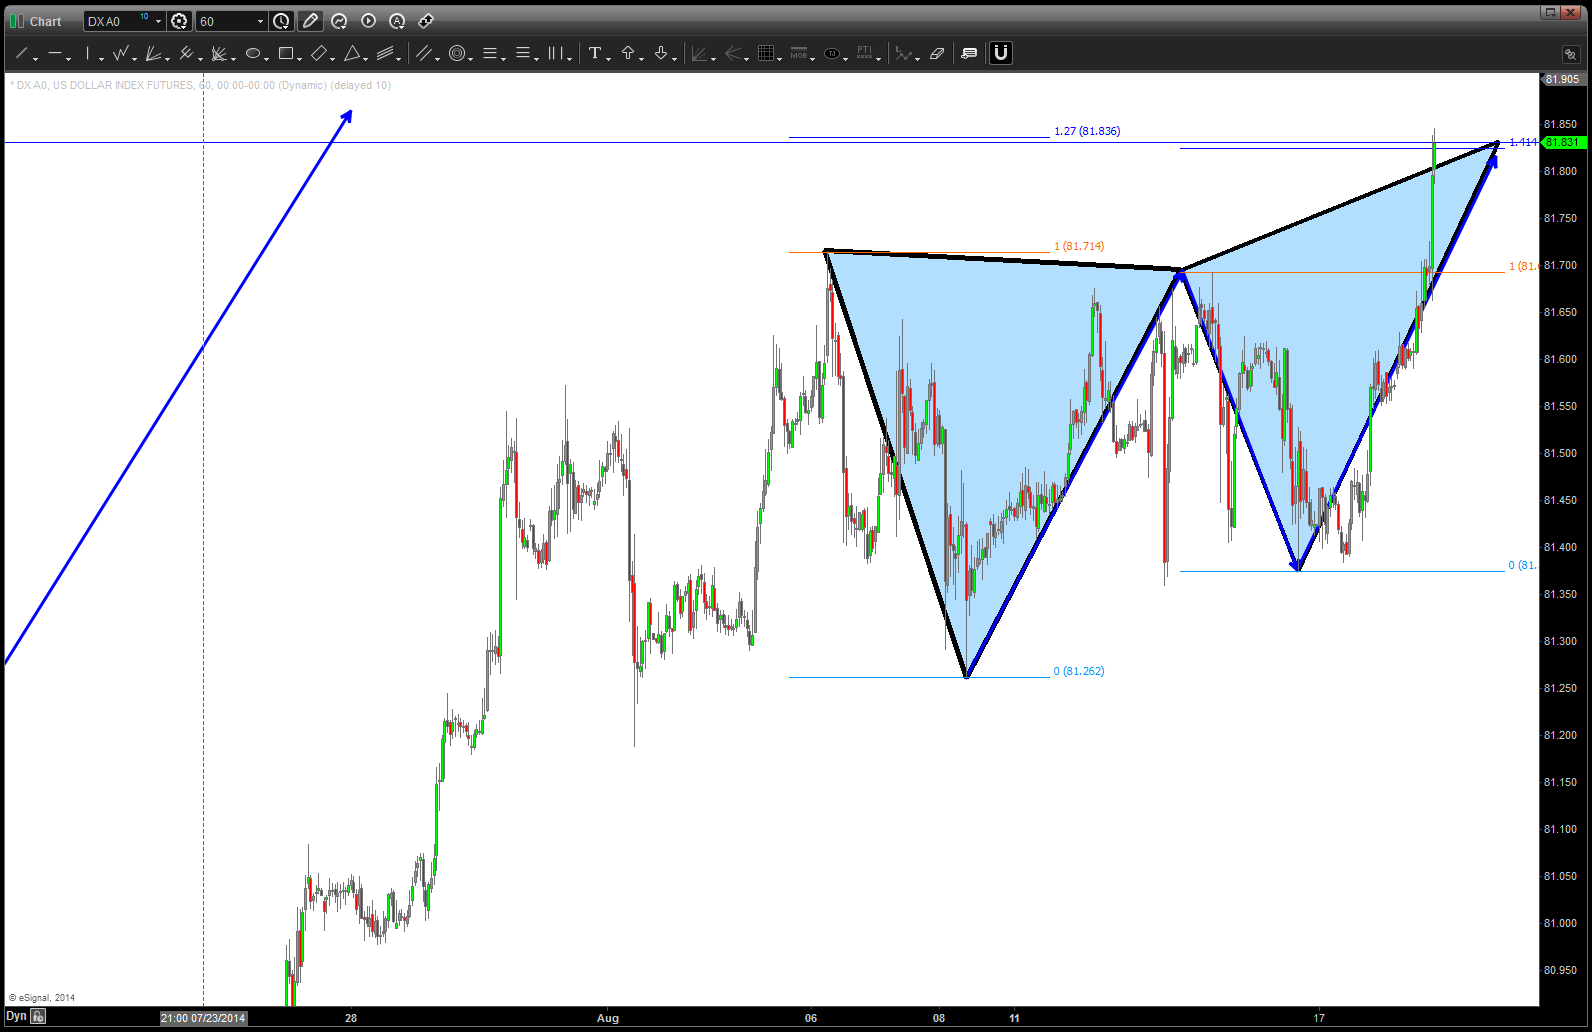
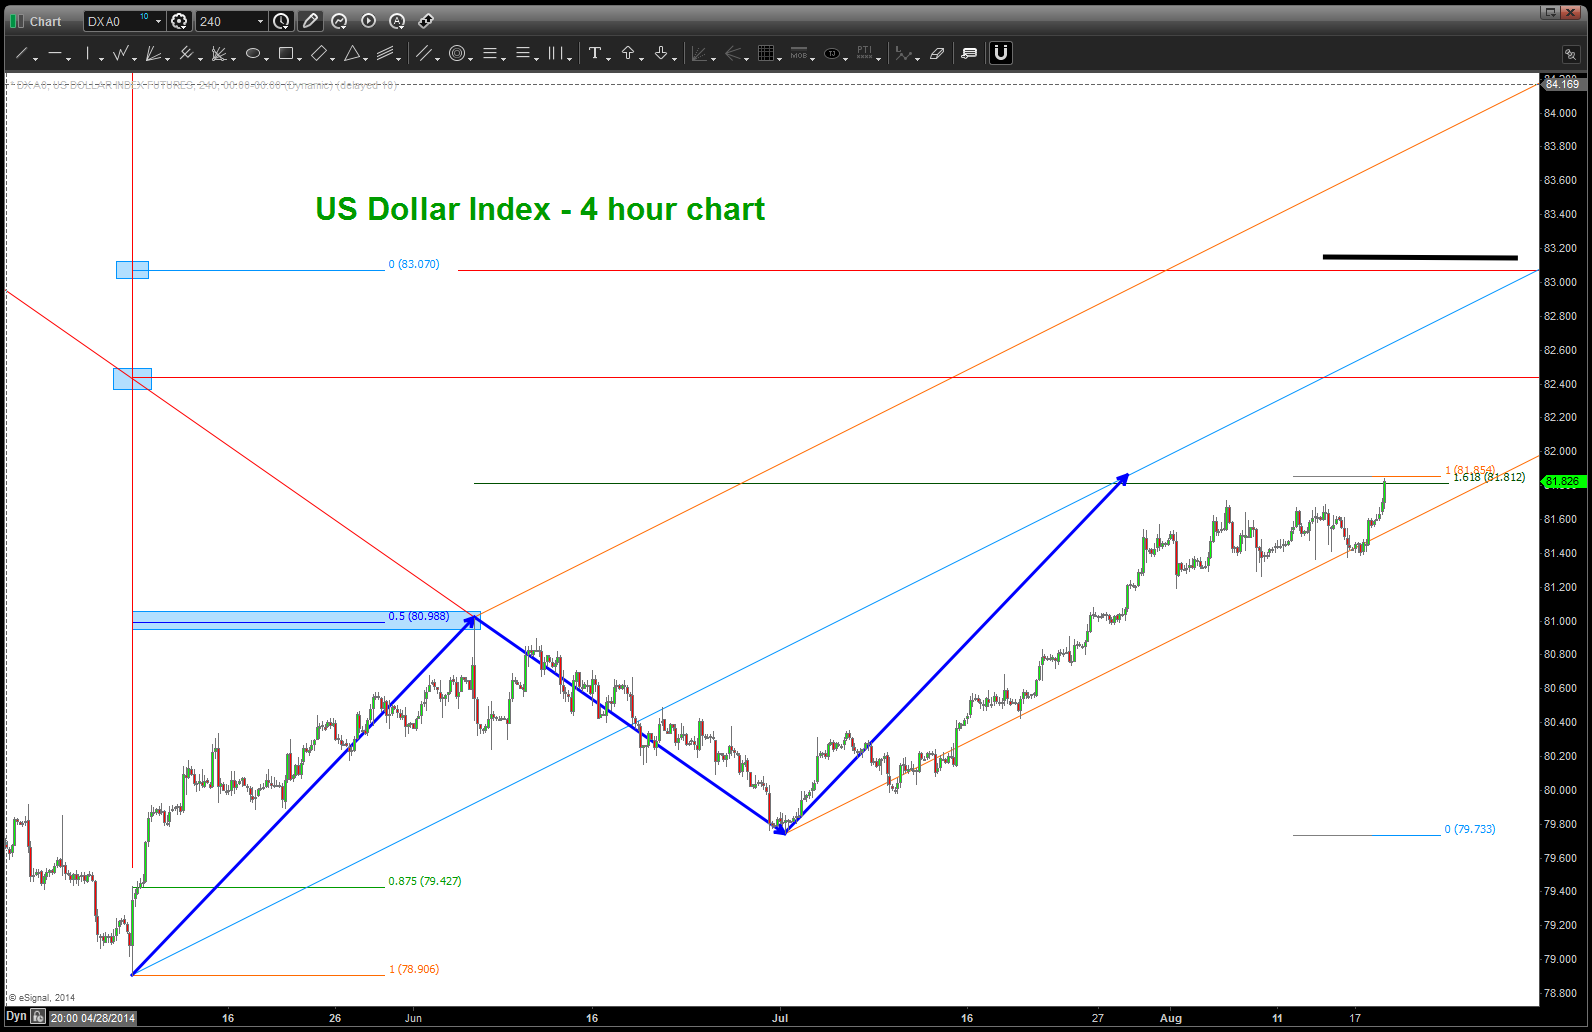
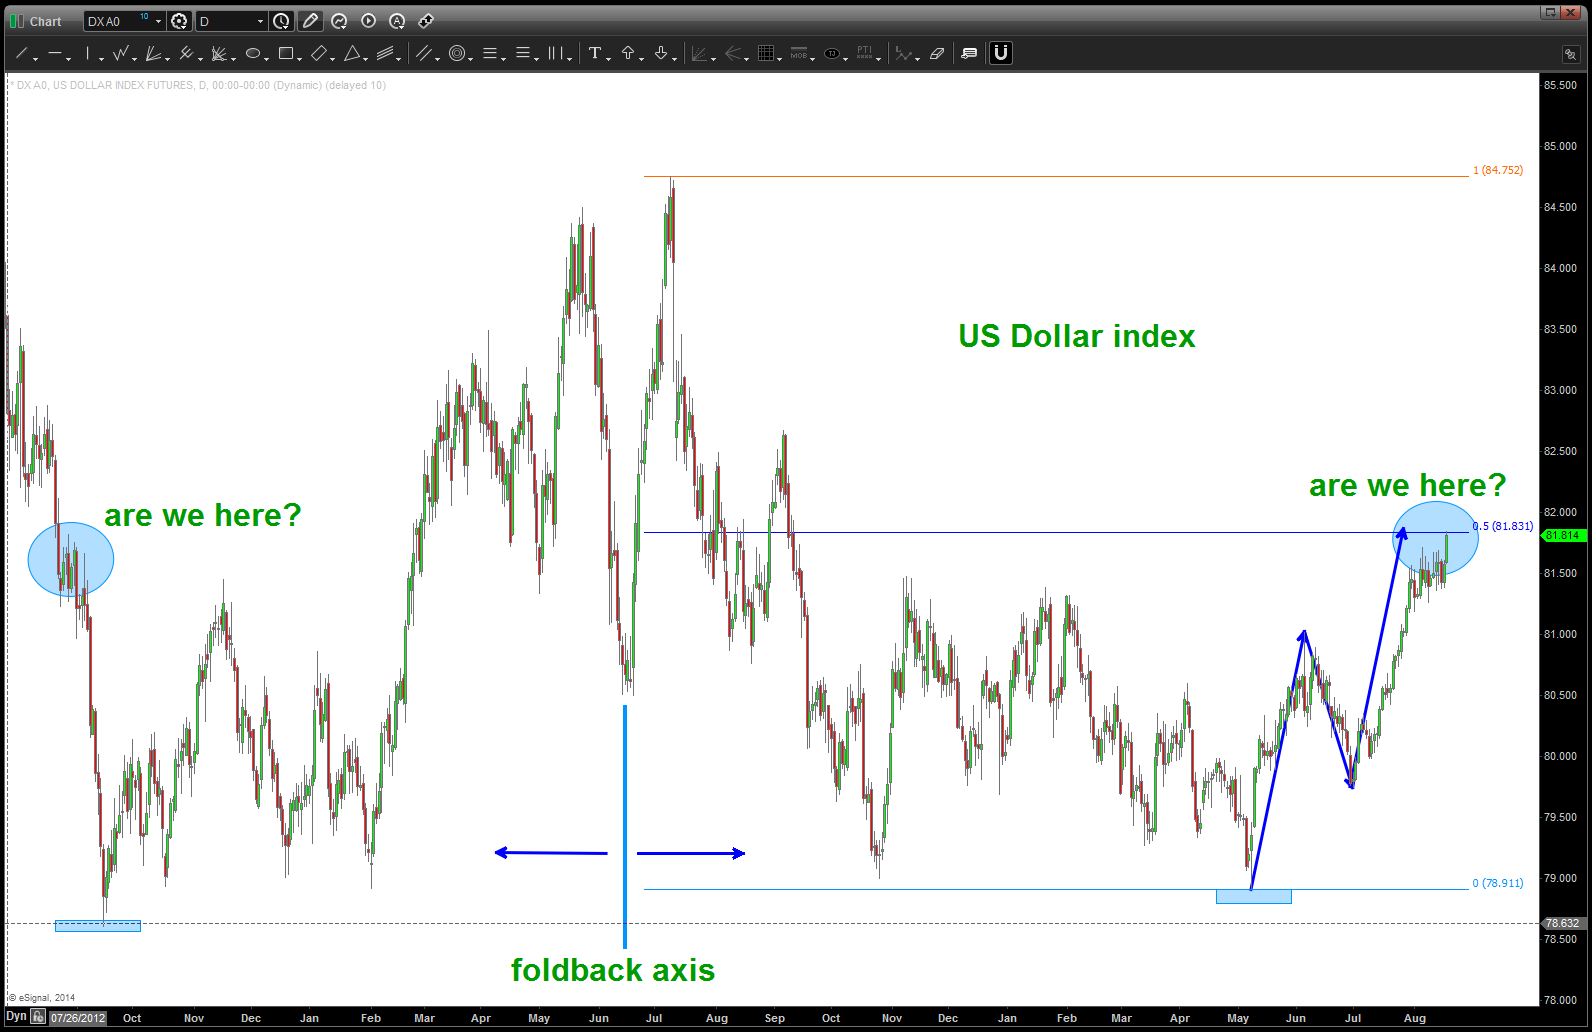
how about a HOLLAH for the DOLLAH ?
Posted on August 19, 2014 Leave a Comment
CLIFF NOTES: target, essentially, hit on the dollar index. perhaps a little higher?
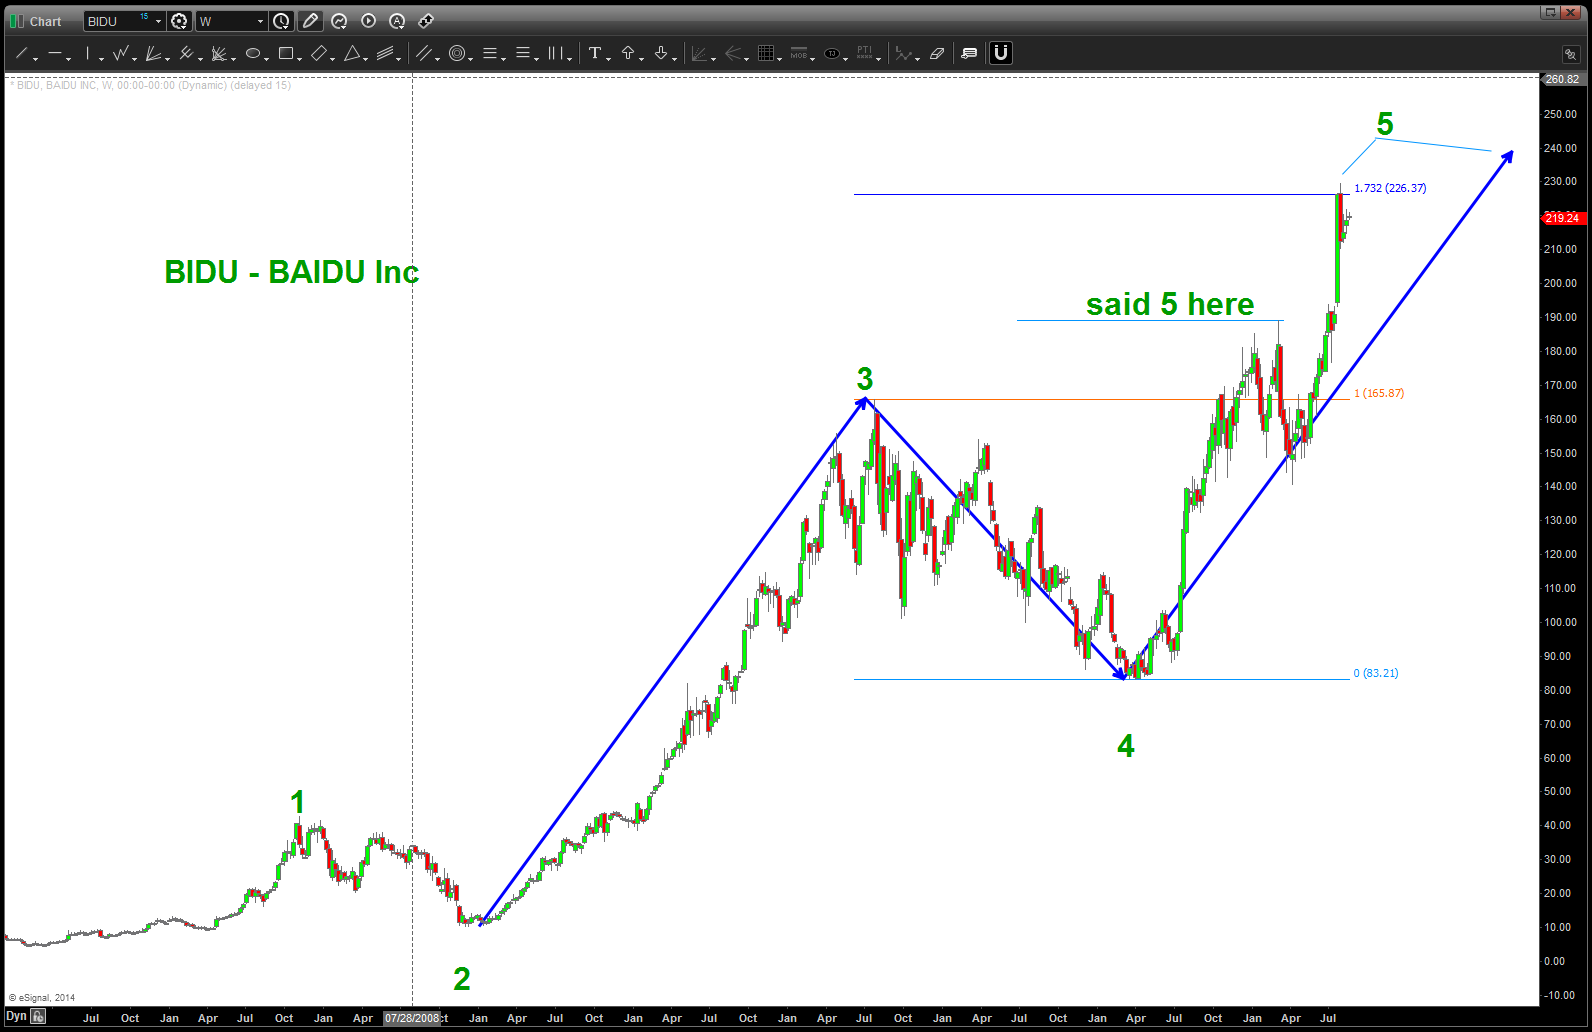
BAIDU Inc … 1,2,3,4,5
Posted on August 18, 2014 Leave a Comment
Cliff Notes: looked at 190 being 5 complete and, while it did work for a while and drop roughly 20% it wasn’t … so now we sit at 226 or perhaps 240 but either way I see 1,2,3,4,5. So, I was early but like Chipotle, believe in a year it will be much lower than current levels. Guess we’ll have to wait and see …
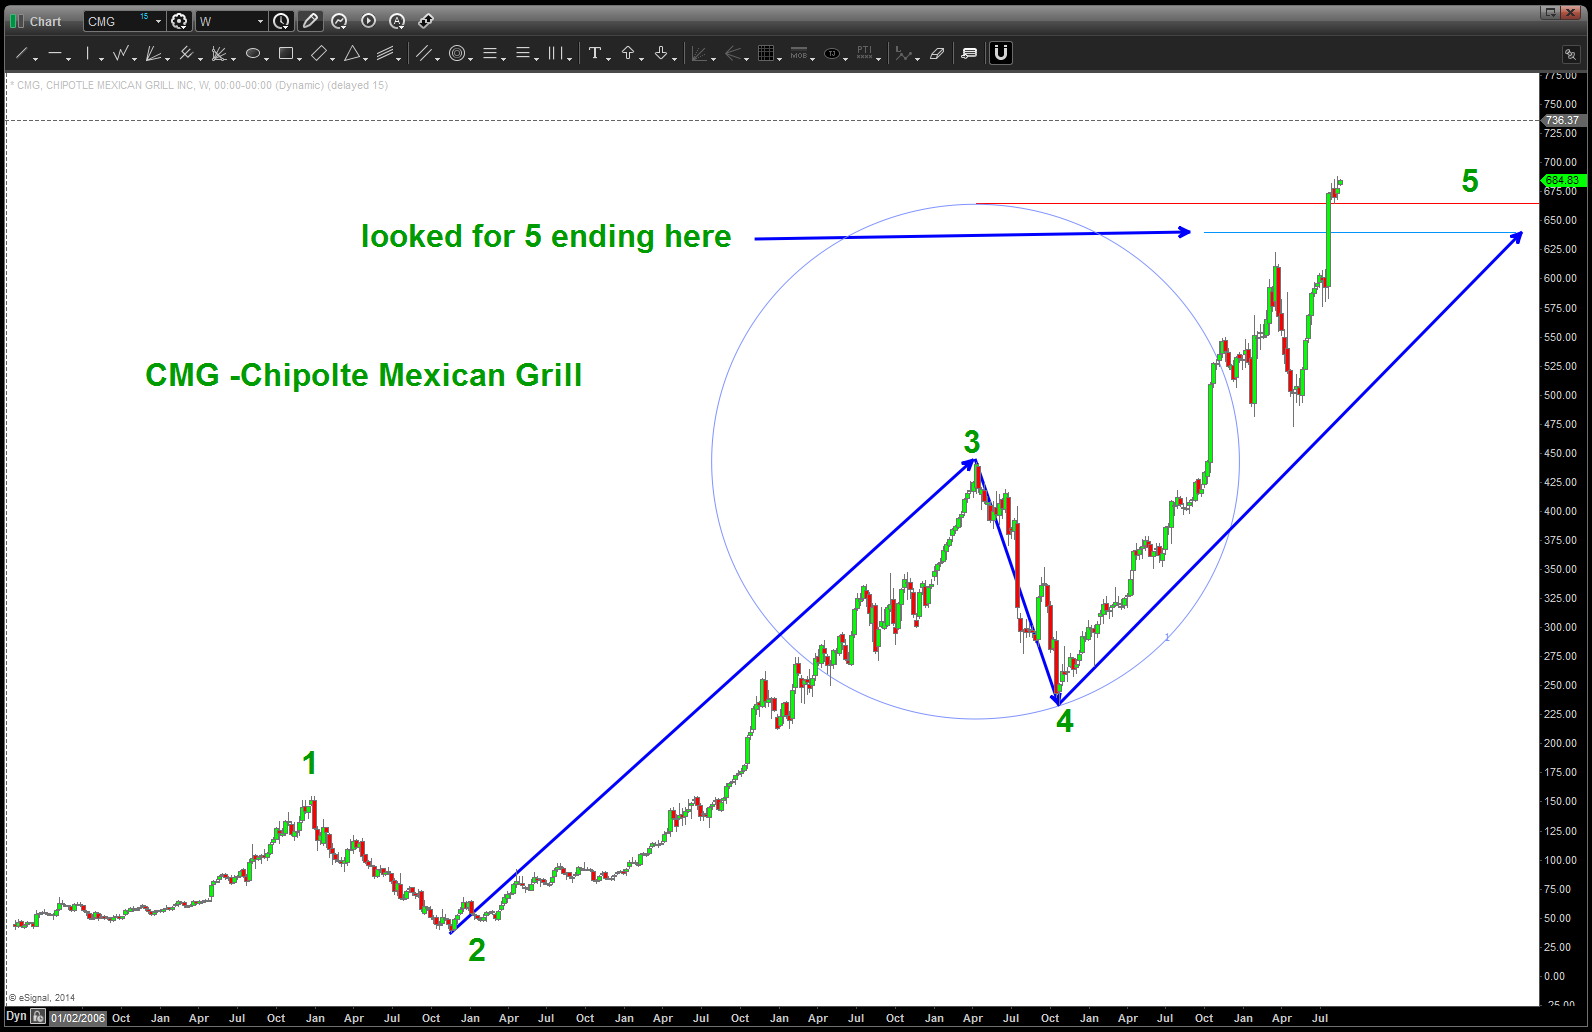
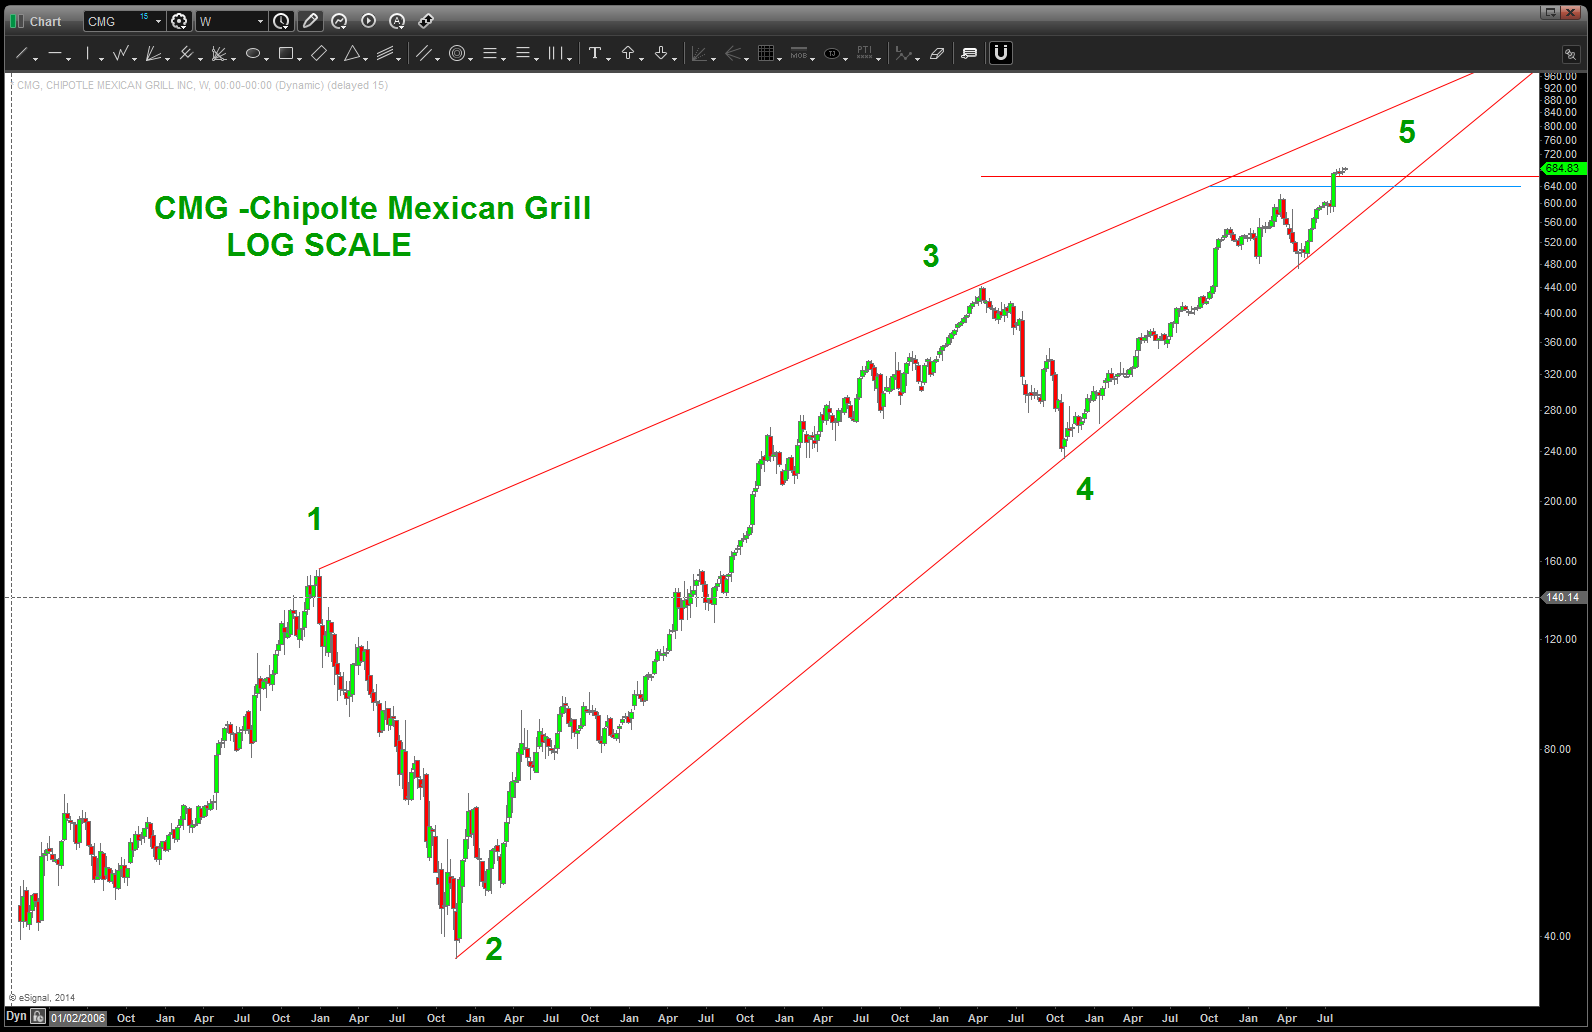
this Mexican Food is HOT ($CMG)
Posted on August 18, 2014 Leave a Comment
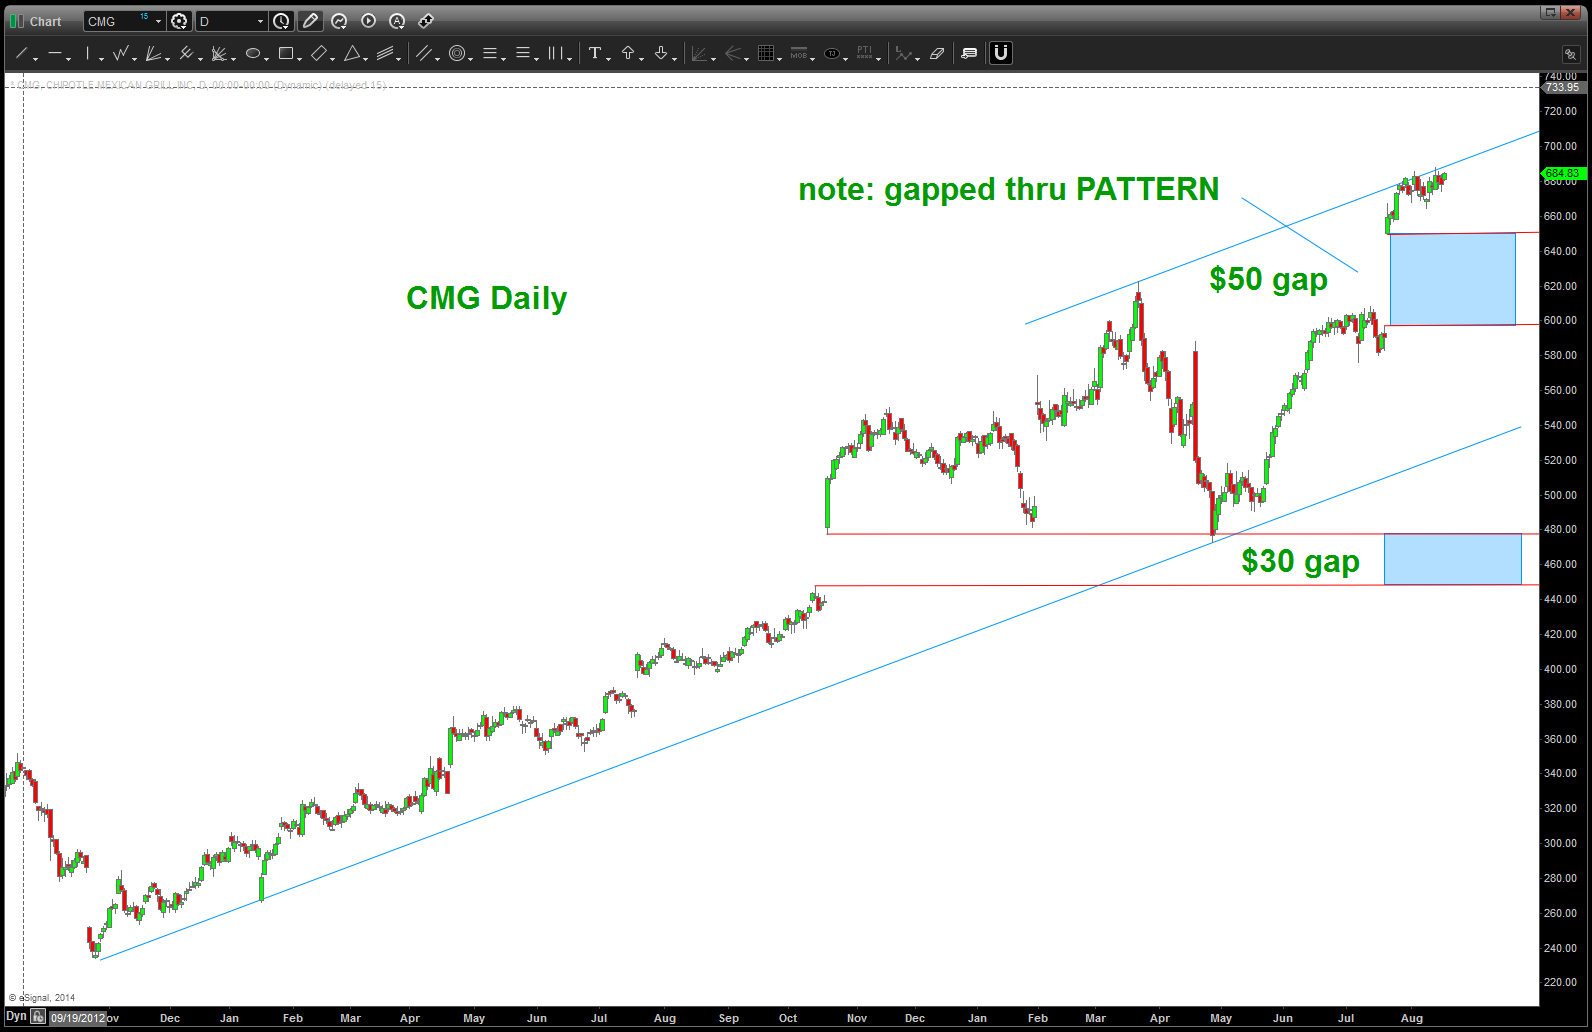
CLIFF NOTES: well we looked for a top in/around the 610-620 level and it hit and fell 140 bucks. BUT – it gapped threw the pattern to new highs. I still see a 5 wave count and would bet that this stock is at 250 bucks vice 800 in a year but that gap has 1 of 2 messages. Crazy, unbelievable strength or one final exhaustion gap up/near the highs. Strategy here is simple .. if long, enjoy the rid but cut bate if we ever close below 580.
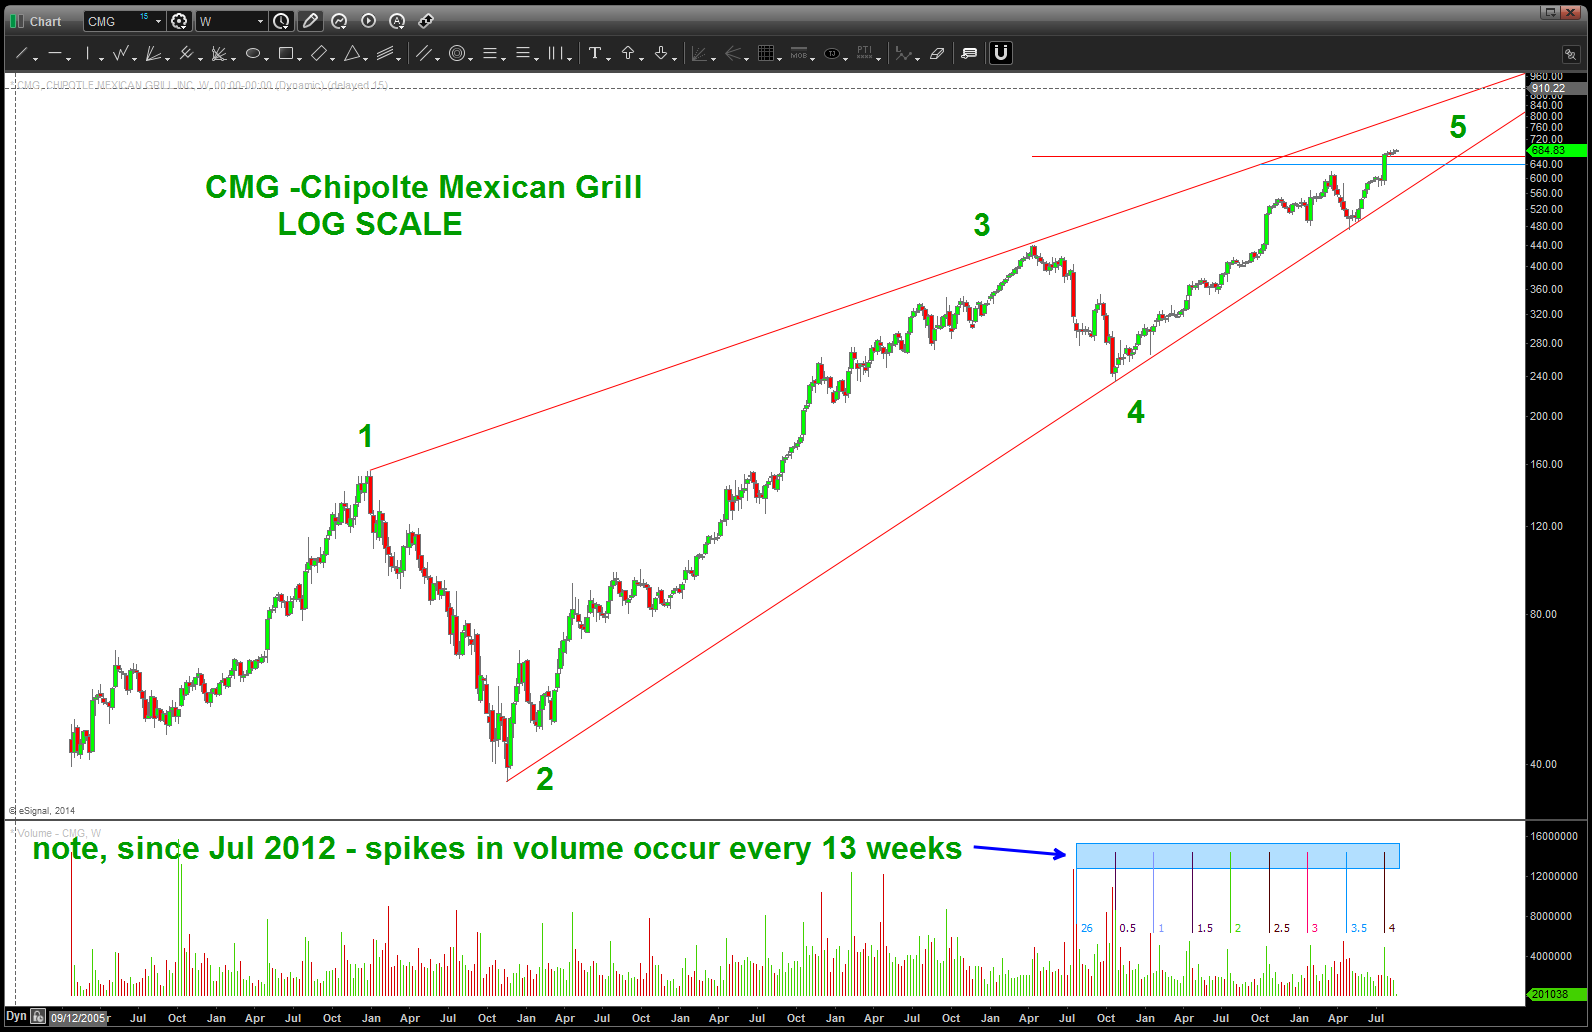
Last, take a look at the chart below w/ volume … pretty interesting that every 13 weeks for the past 2 years a spike in volume has occurred ….hmmm.
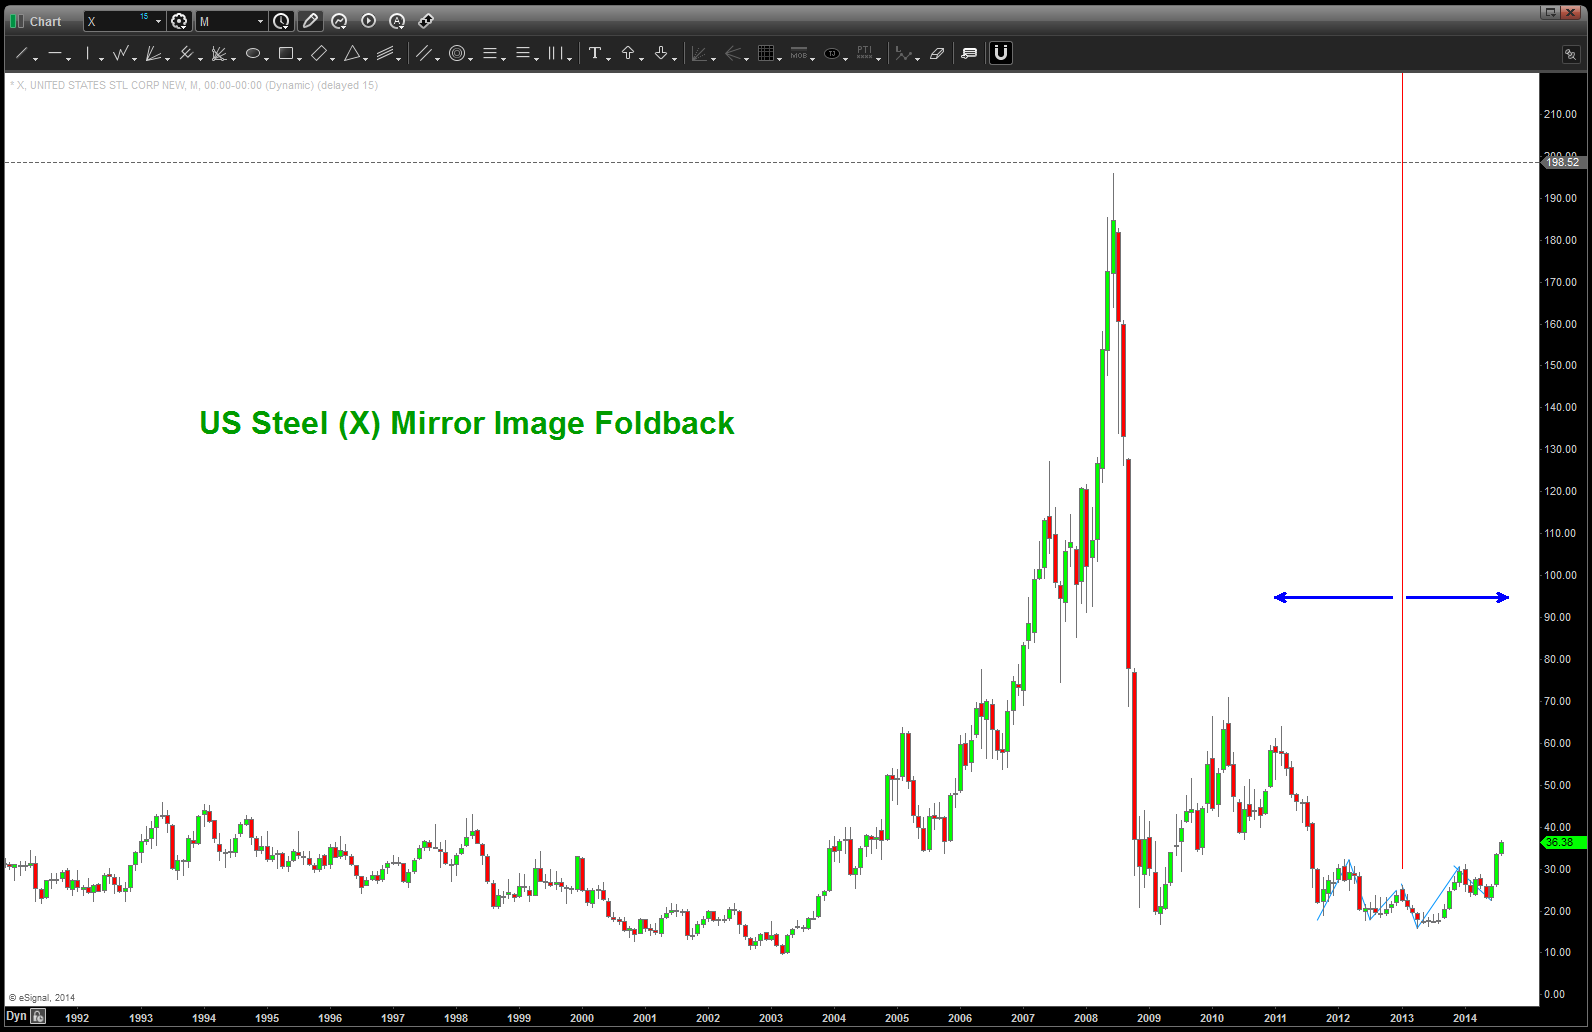
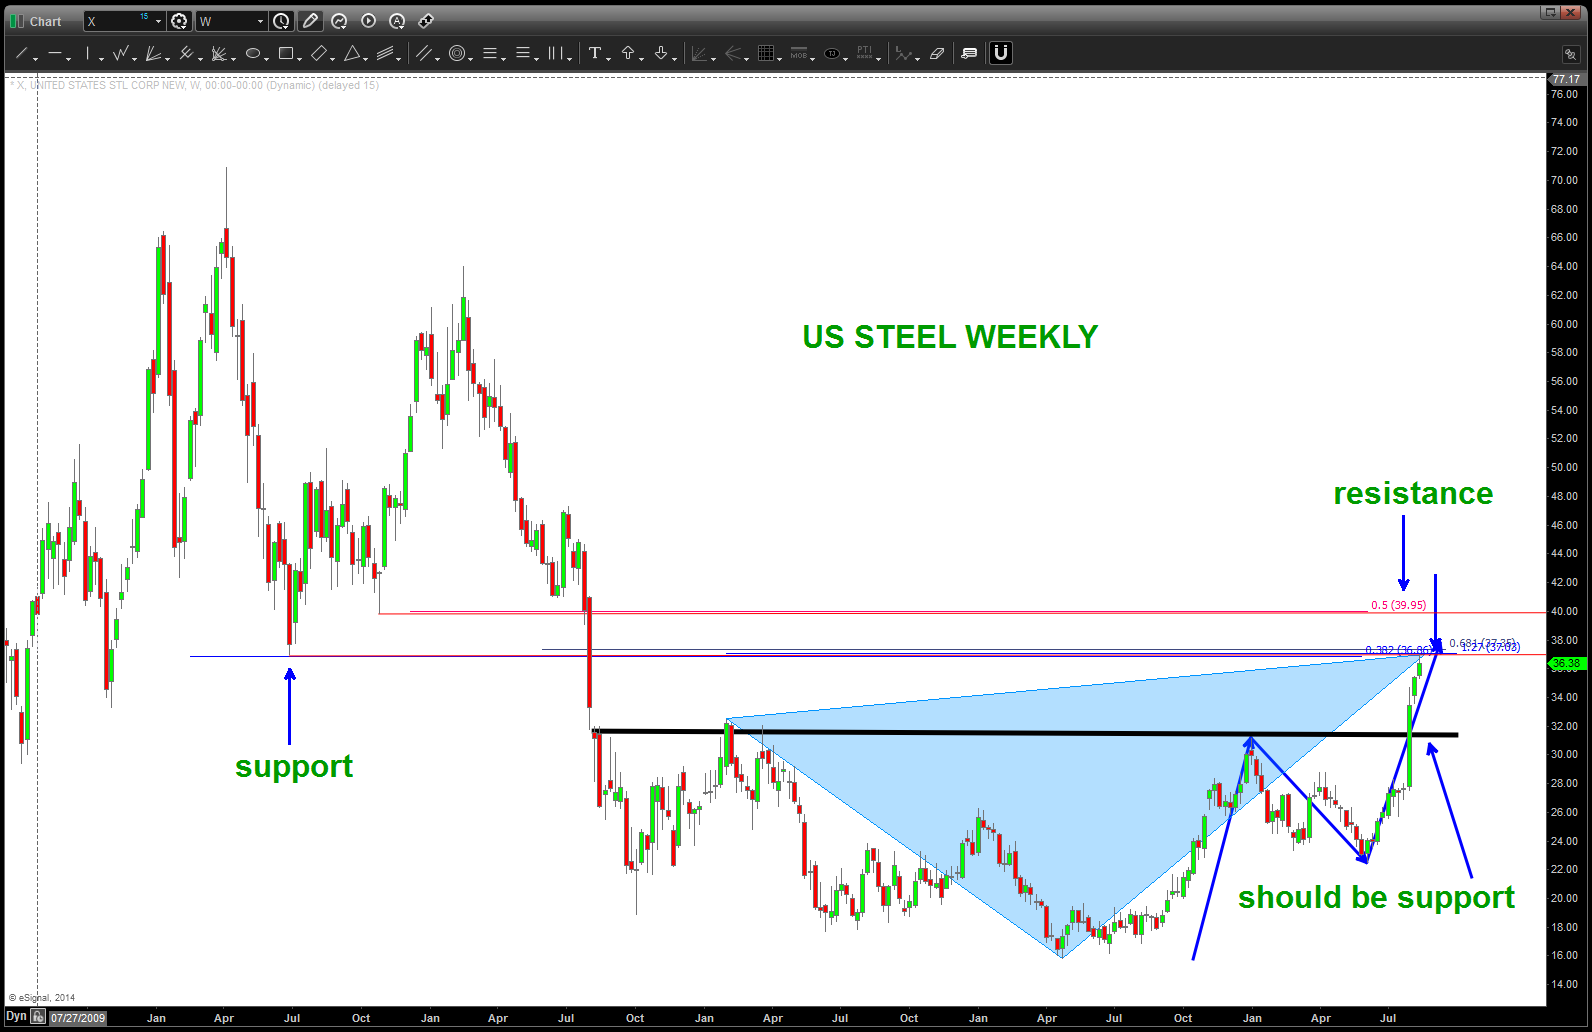
US Steel … defying kryptonite (?)
Posted on August 17, 2014 Leave a Comment
CLIFF NOTES: this break out looks real! So, we have completed a pattern and would look to BUY in/around the 32 level as that should offer support and look to hold this for an investment…. a mirror image foldback is a great pattern to see and fine … basically a PATTERN comes into a level and then goes “out” the same way … the red line in the chart below is the point in price/time that the mirror image foldback starts …what is happening on the right side of the line is happening in the same manner going back up left. IF this is a CORRECT mirror image foldback THEN we shall see quite the run in “X”….it’s just beginning. Strategy is to buy the “kiss of the neckline” and then off she goes ….
will update as 32 gets closer in looking at the form/proportion of the pullback that should happen in/around here or perhaps a little higher.
is the Sun going to set or rise in Japan (aka the Land of the Rising Sun)
Posted on August 17, 2014 Leave a Comment
CLIFF NOTES: for the reasons shown below, 102.70 is the KEY level for the USD vs JPY. If we exceed this level, then believe the USD will begin to soar again vs the YEN.
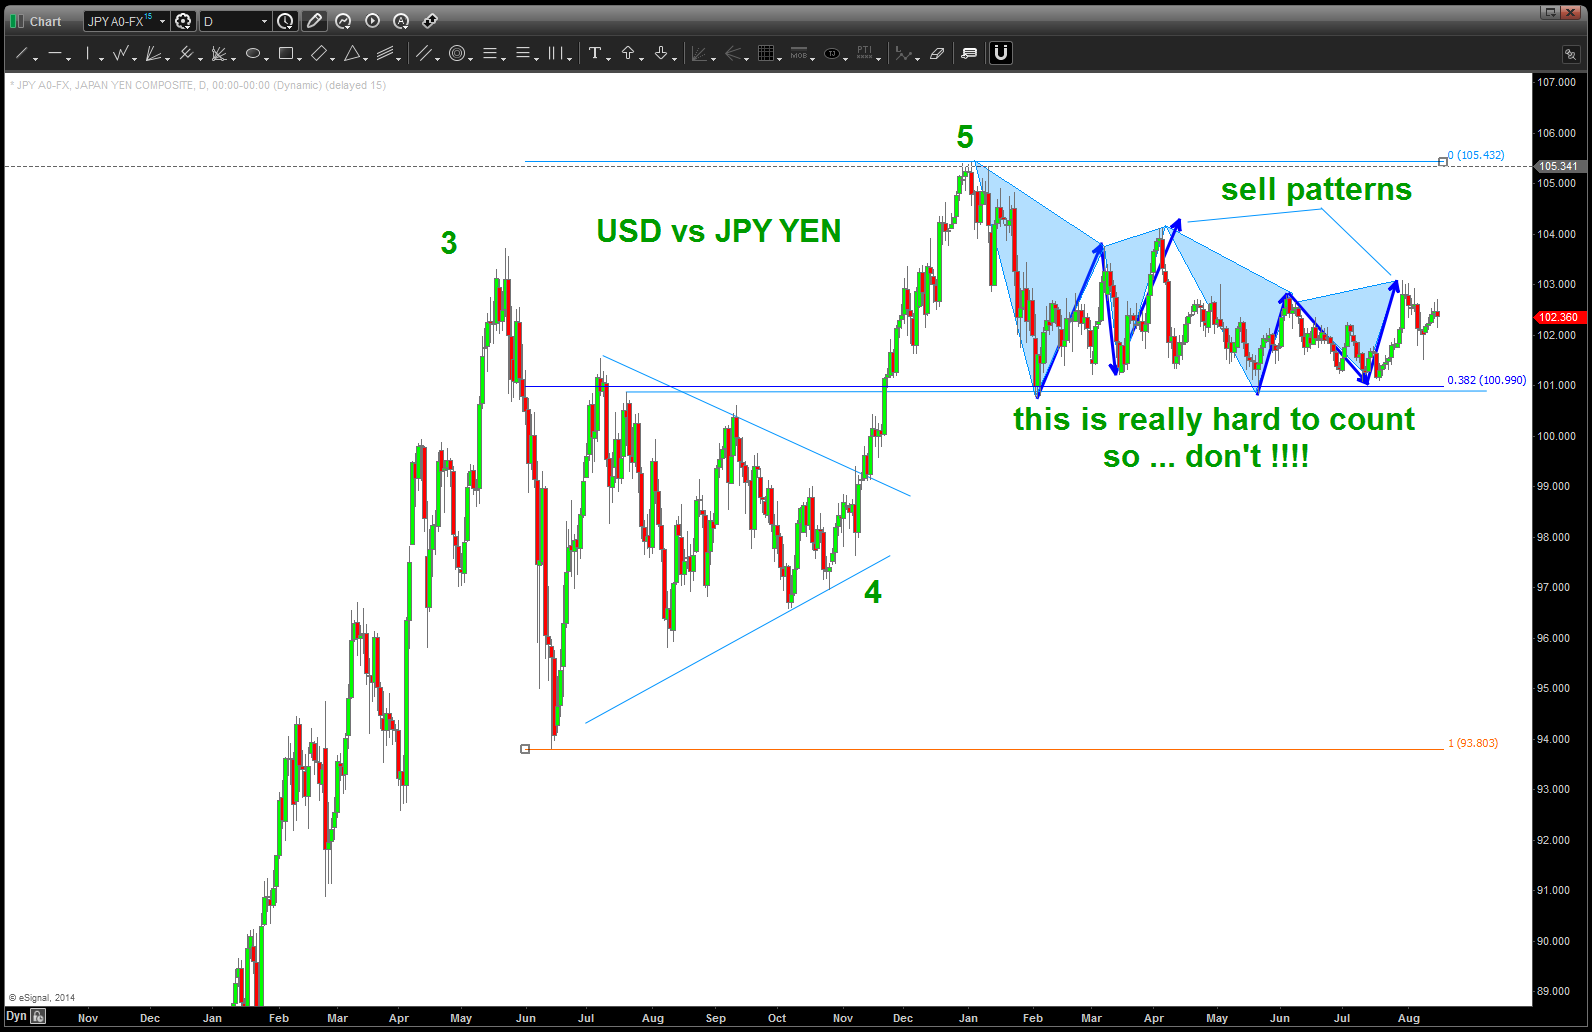
Going to try and work thru the entire “Elliott is good // Elliott is bad argument” by simply saying when it’s an easy count use it and when it’s not .. it’s probably correcting and if you can’t “see” it immediately then bail to another technical tool box. In the case of the USD vs JPY the weekly and daily count CLEARLY shows 5 waves up from the all time high of the JPY vs $$$.
We made the high around the first of the year and the pair has been consolidating/correcting ever since … the BULLISH aspect of this correction is it has held the .382 from the wave 4 triangle low … that’s bullish for the USD vs JPY.
What’s interesting to note is we have had two sell patterns that have “worked” but have not been able to drop below the 101 handle ….take a peak:
now … here’s where Elliott can help you. In the chart below we have dropped down to a 2 hour chart and we have two potentialities occurring … either we have a 3 that subdivided and 4 just completed which calls for this pair to fall (JPY strength) OR we have a a-b-c correction complete and the USD might begin to skyrocket against the JPY (which OBTW will cause the Nikkei 225 to skyrocket also …the GOOD THING – we know exactly where we are w/ regards to 102.70. Check it out:
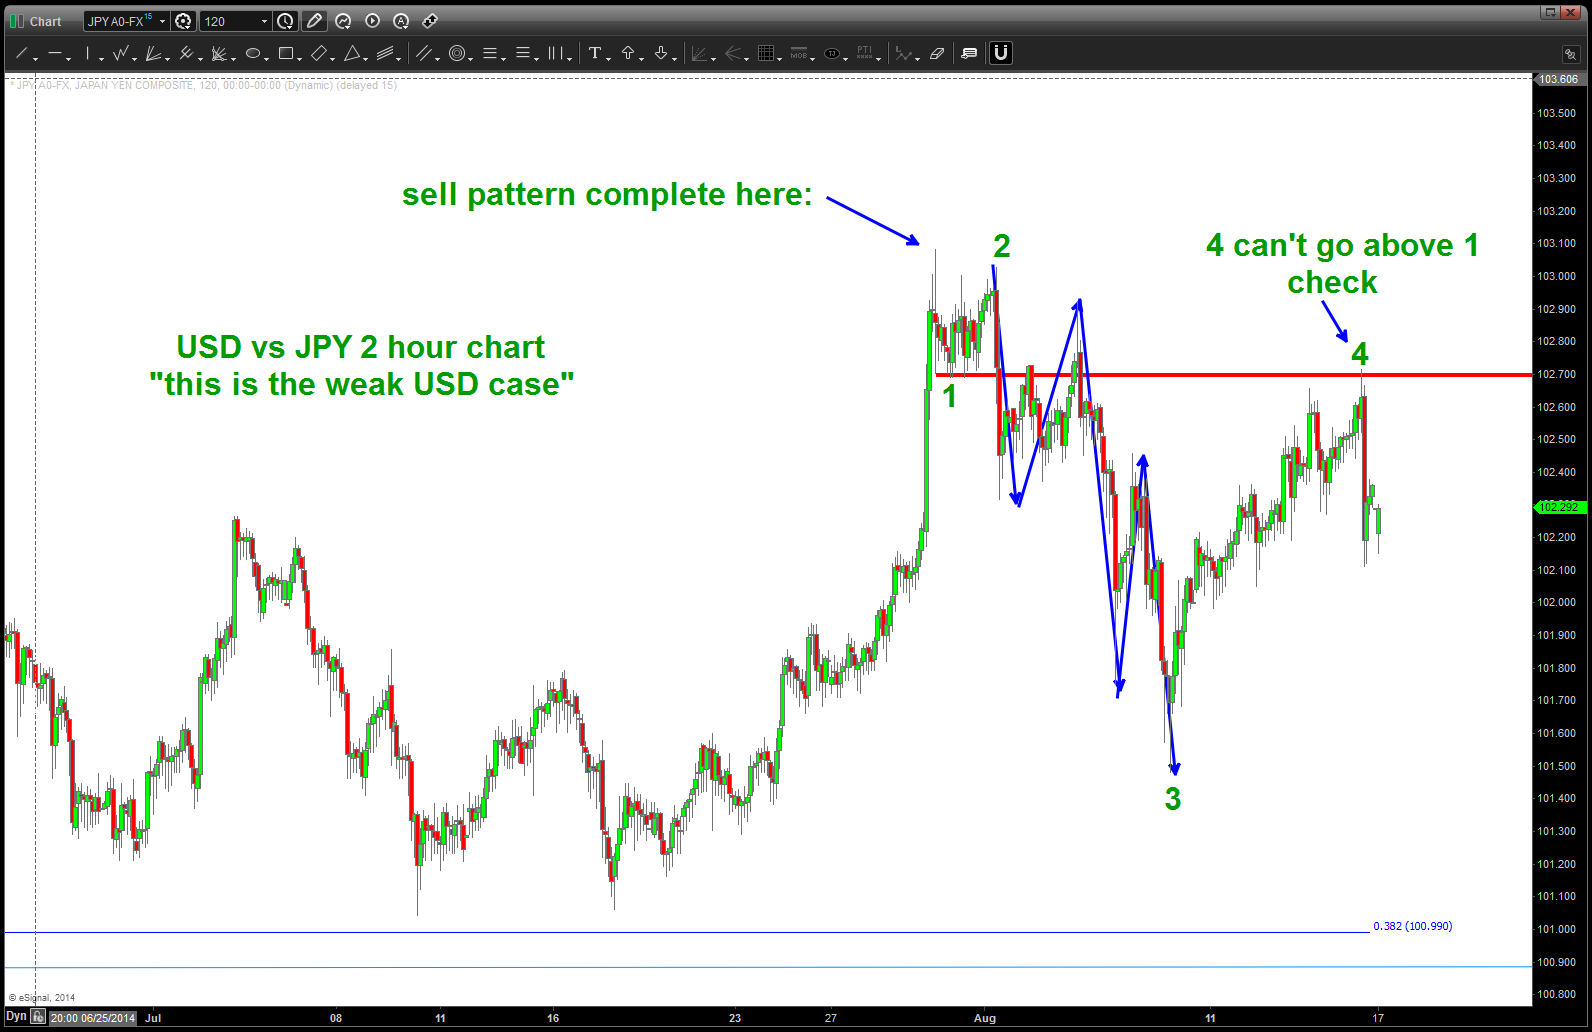
this is showing 4 complete and we should be going DOWN
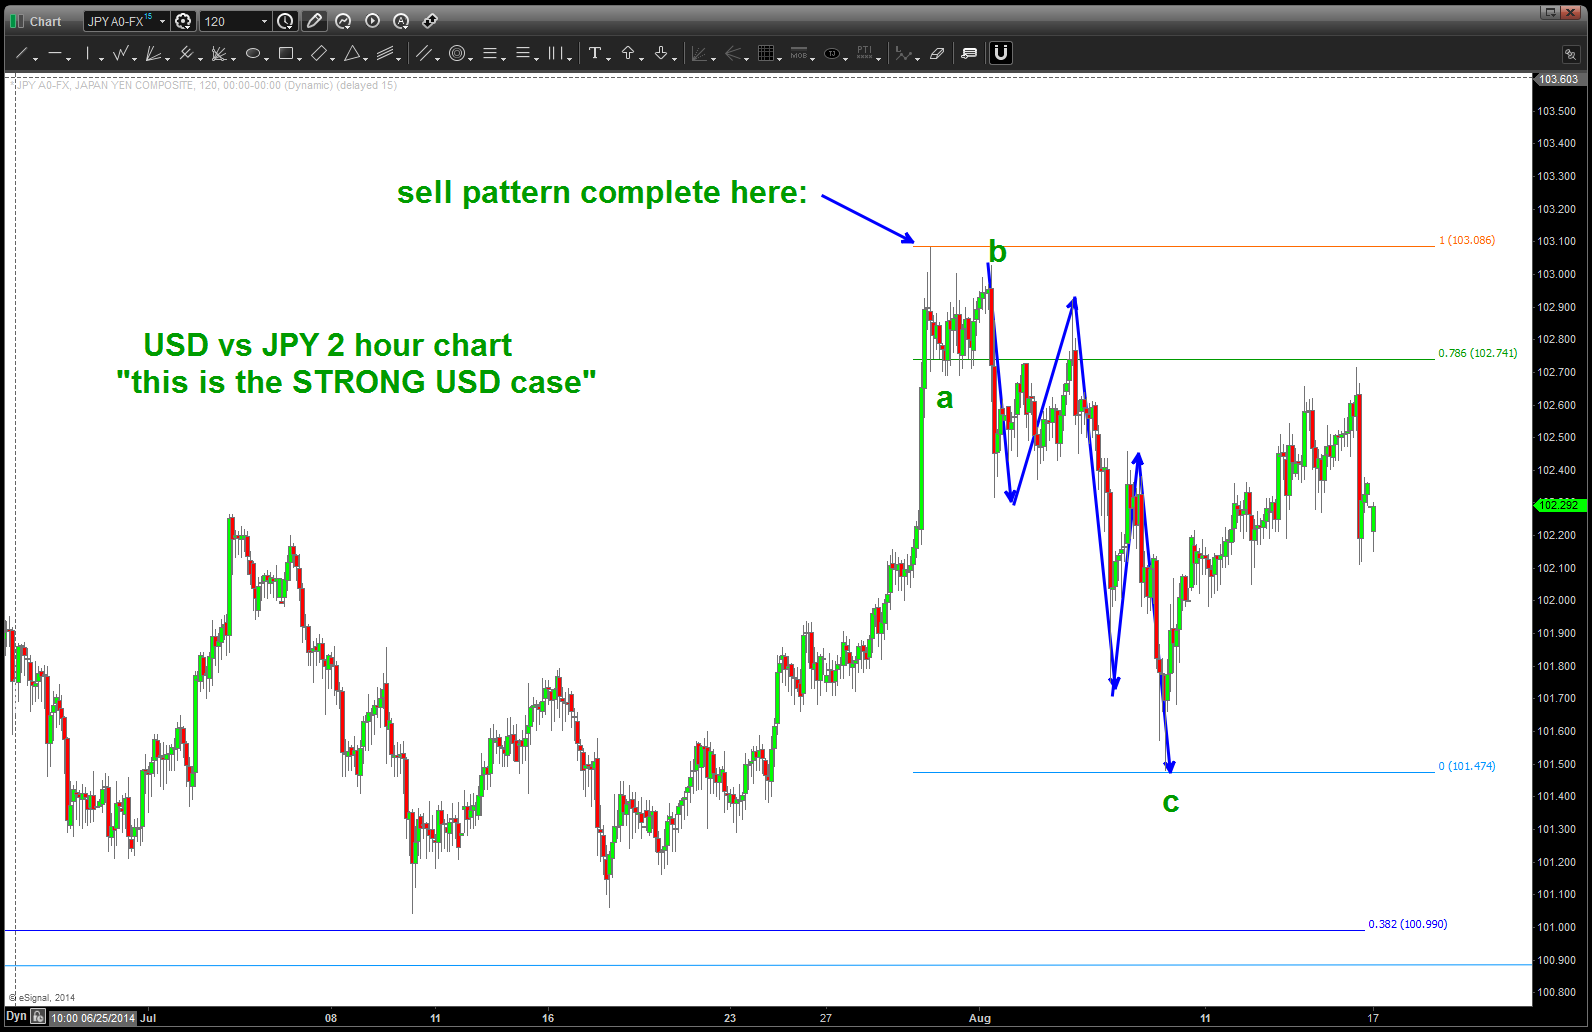
this is the STRONG dollar case and we completed an a-b-c correction and it’s going to take off
now, below is the NK 225 futures (continuous) overlaid on top of the USD vs JPY. NOTE THEY ARE ALMOST MIRROR IMAGES OF EACH OTHER …
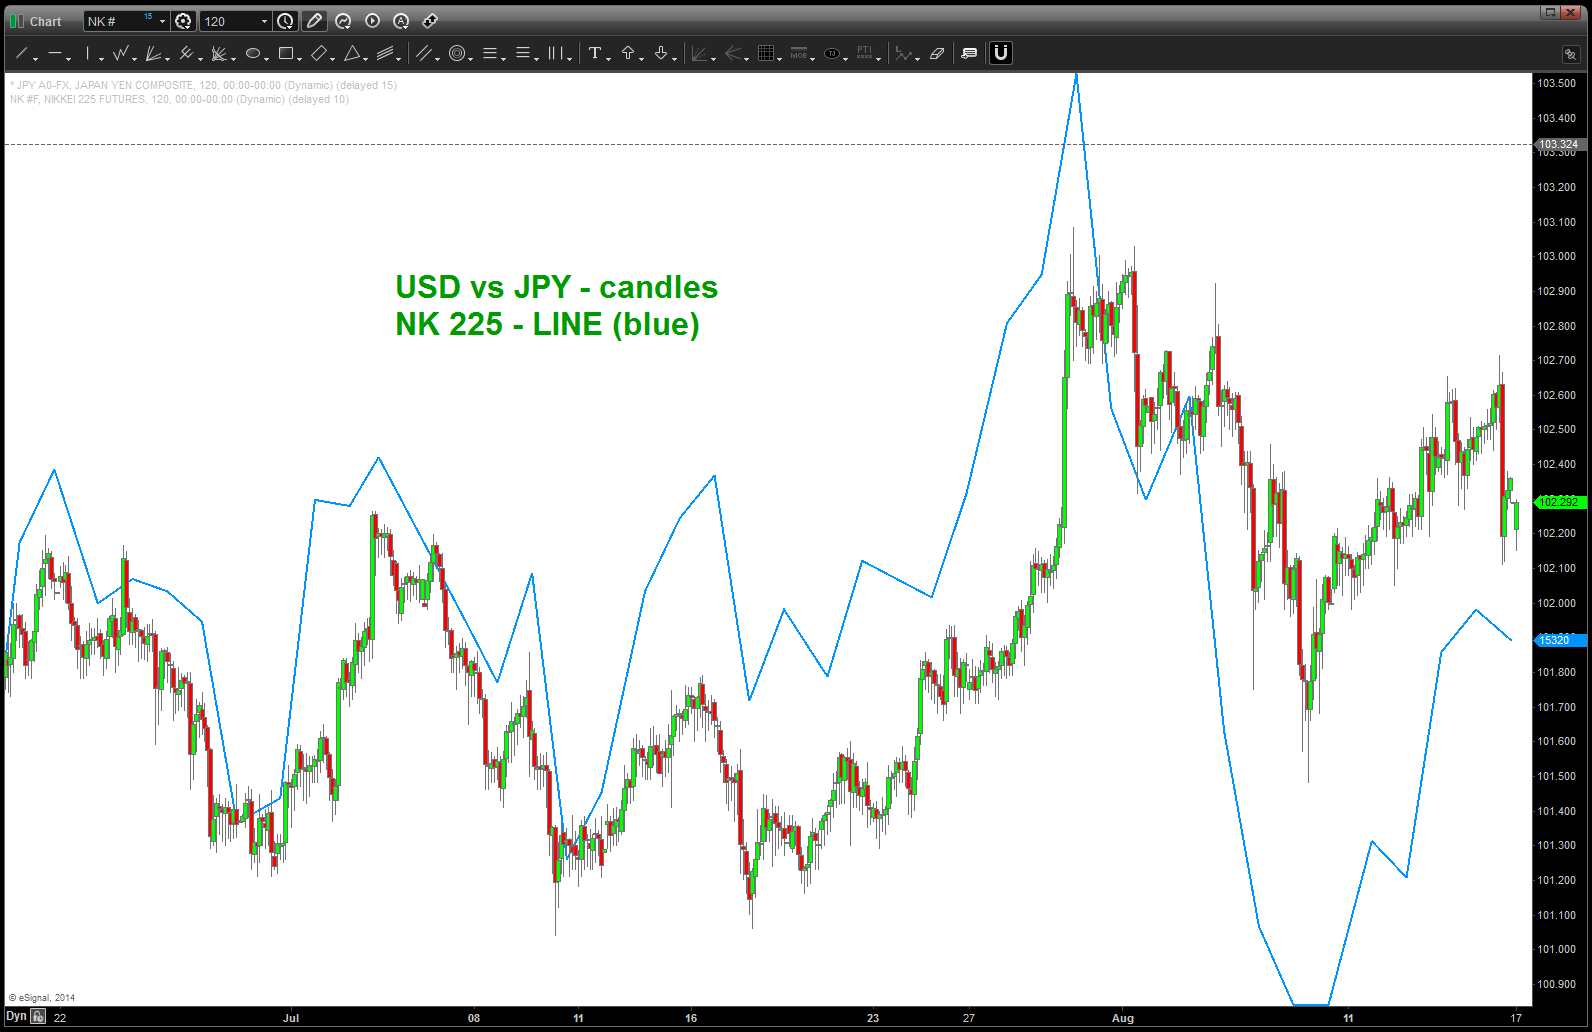
NK 225 overlaid on USD vs JPY (notice how synchronized they are)
last thing .. notice the TIME component of this correction. Since the all time low of the USD vs JPY (10/2011) the corrective timing has been about right for this most recent correction. TIME is a big deal so, perhaps, we won’t see any lower in the USD vs JPY and it’s time to rumble? My eye tells me the pattern in PRICE isn’t quite done going lower but we have to trade what we see and not believe. Standing by w/ levels above noted …
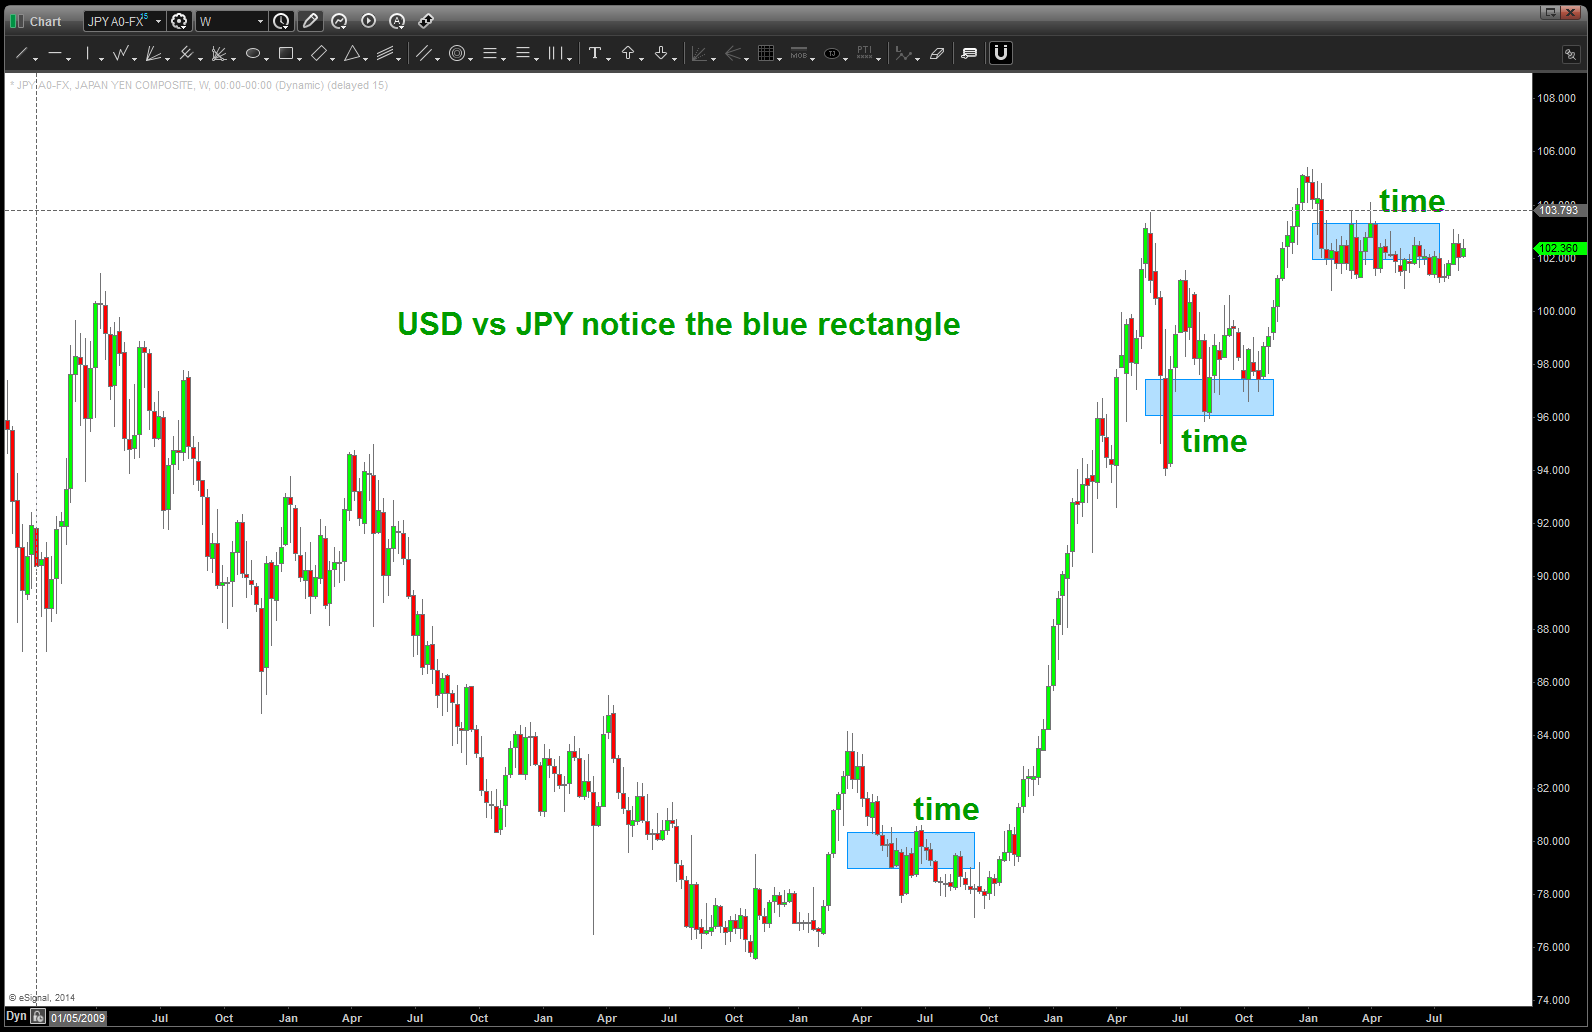
the TIME component of this correction is complete
Jackson Hole … let the games begin
Posted on August 17, 2014 2 Comments
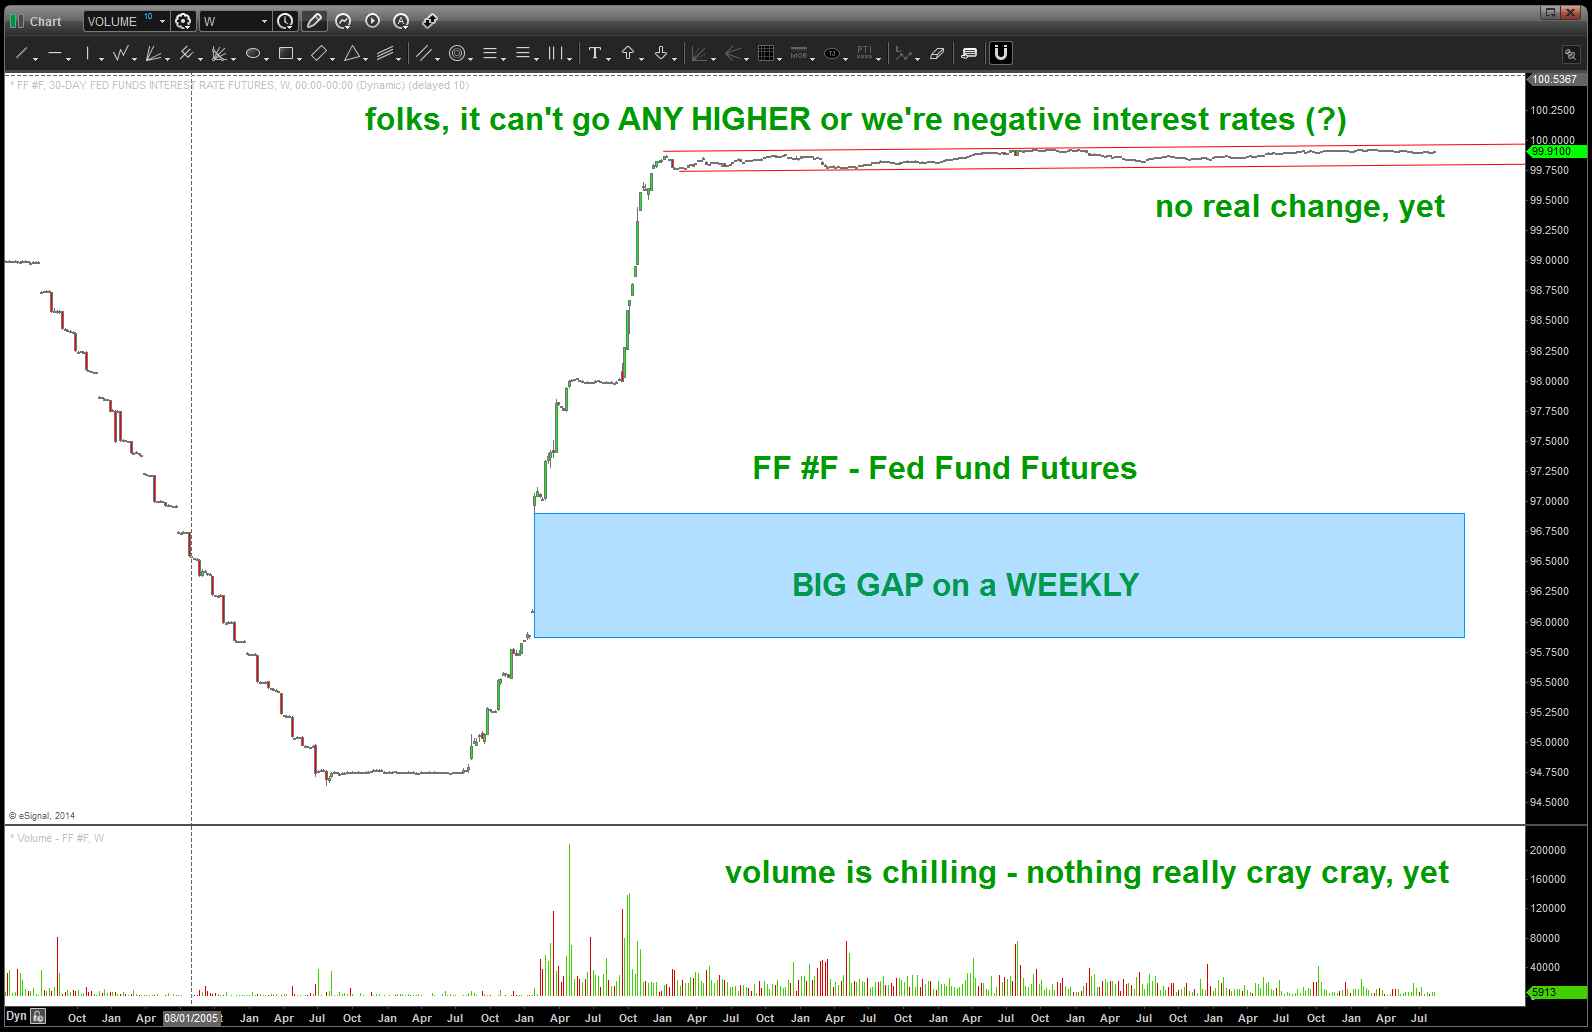
CLIFF NOTES: folks, follow this link to catch up on the Fixed Income story: https://bartscharts.com//?s=fixed+income
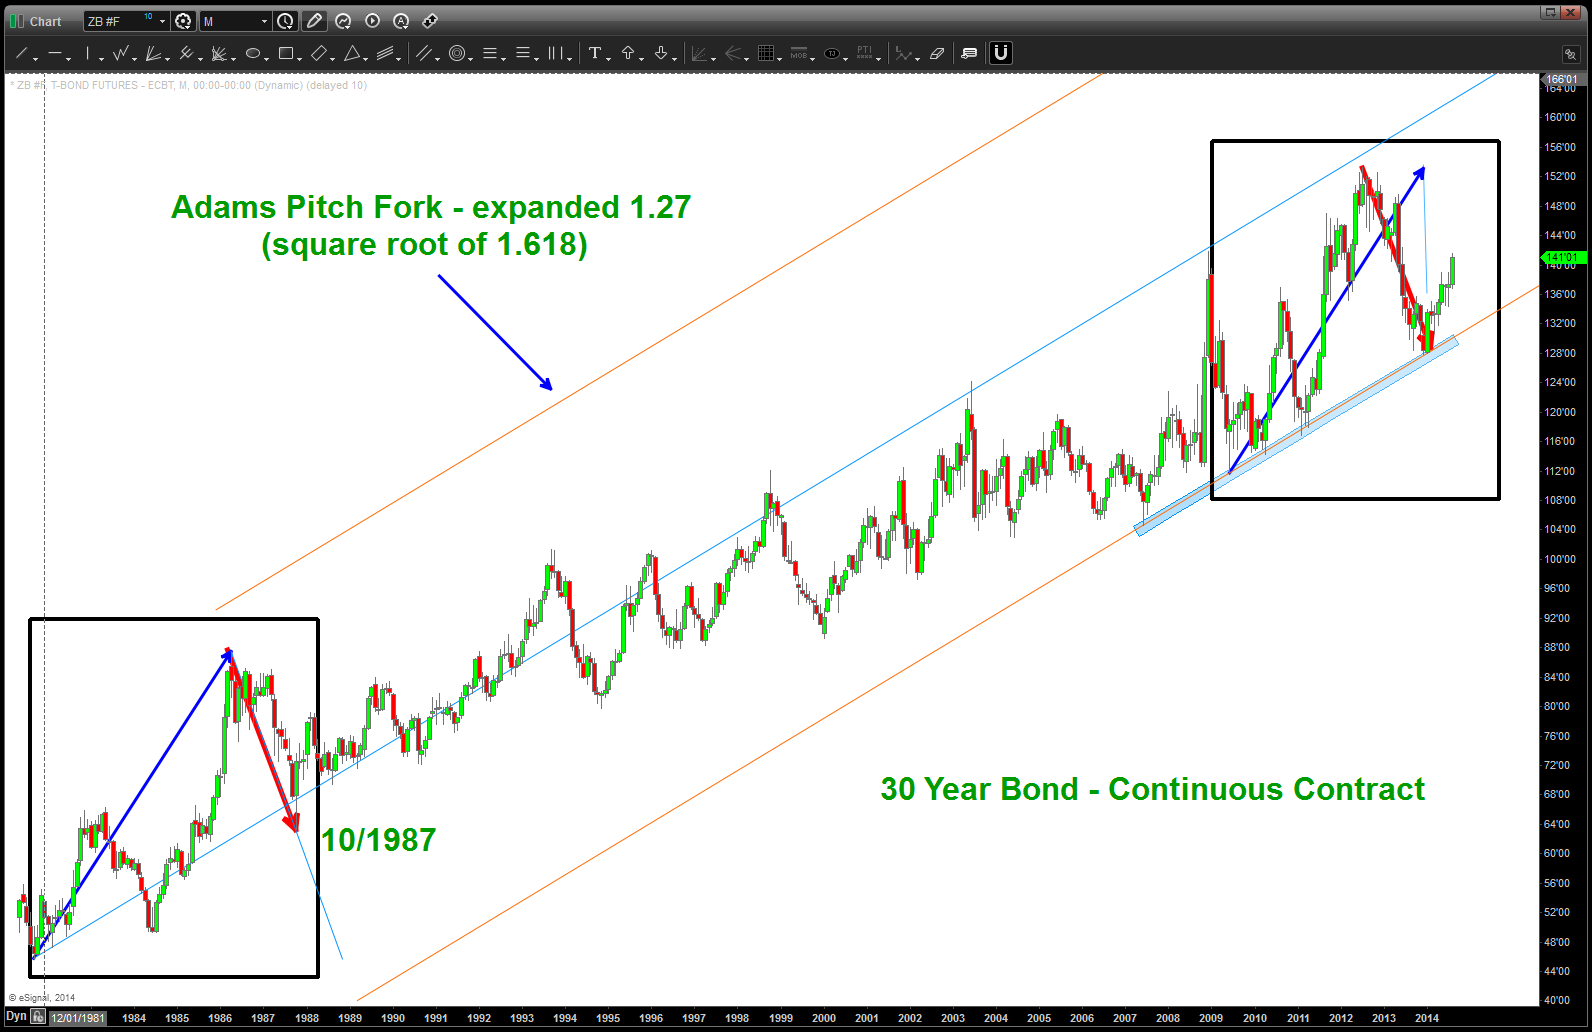
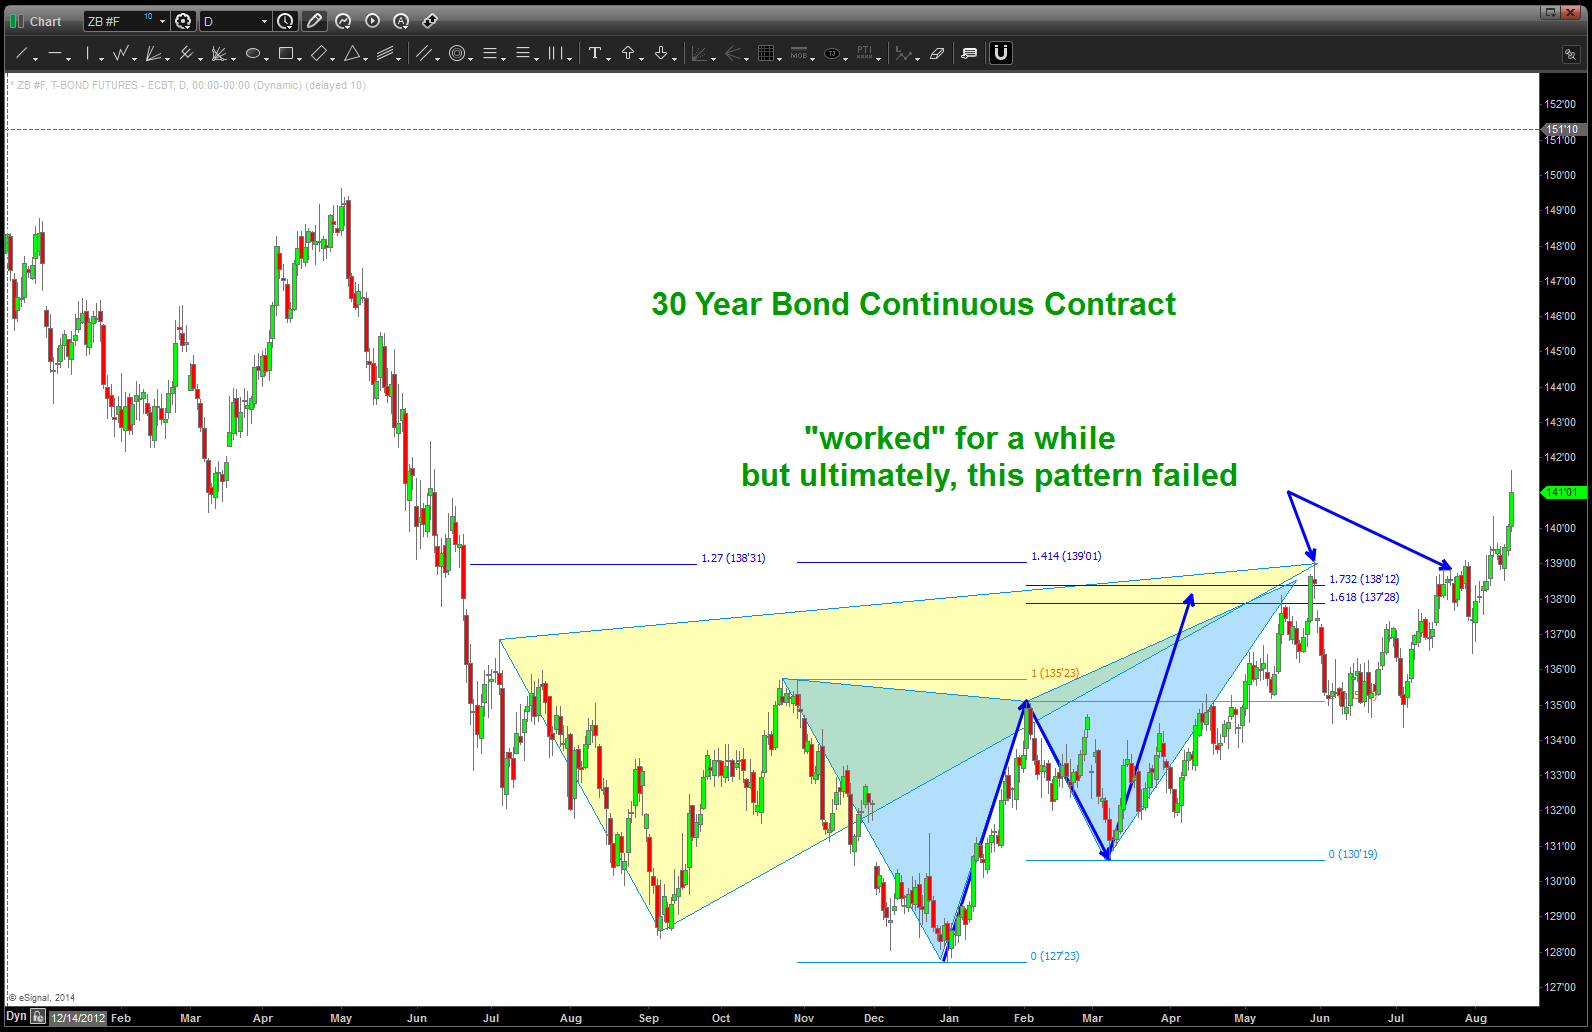
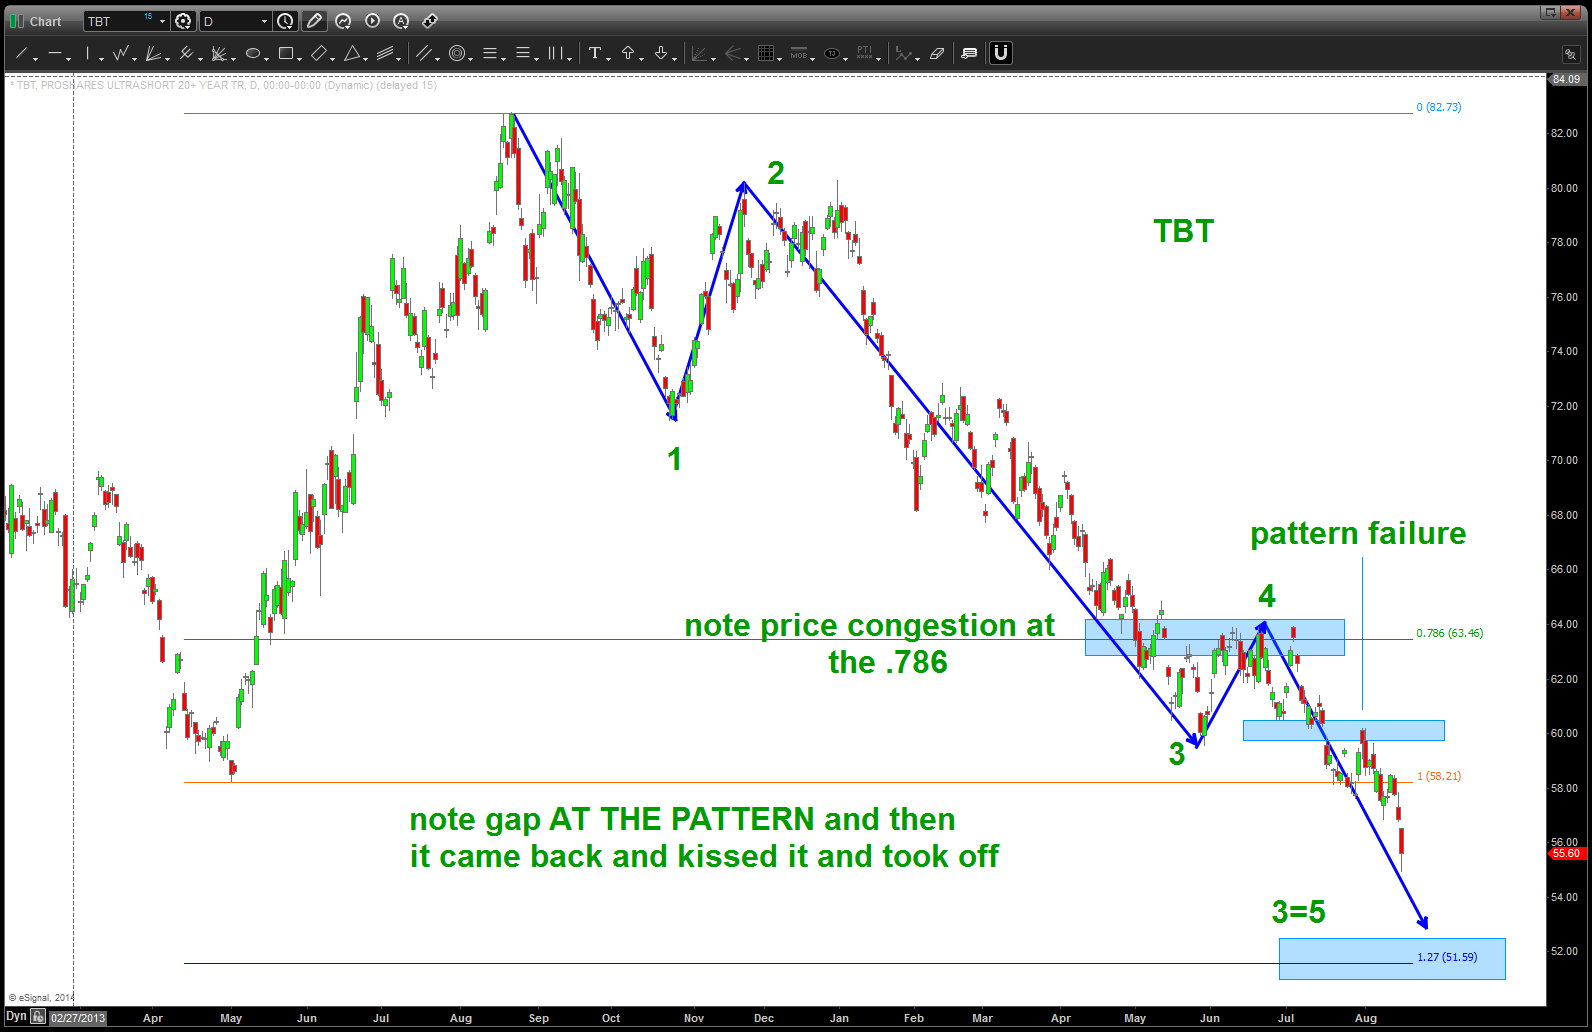
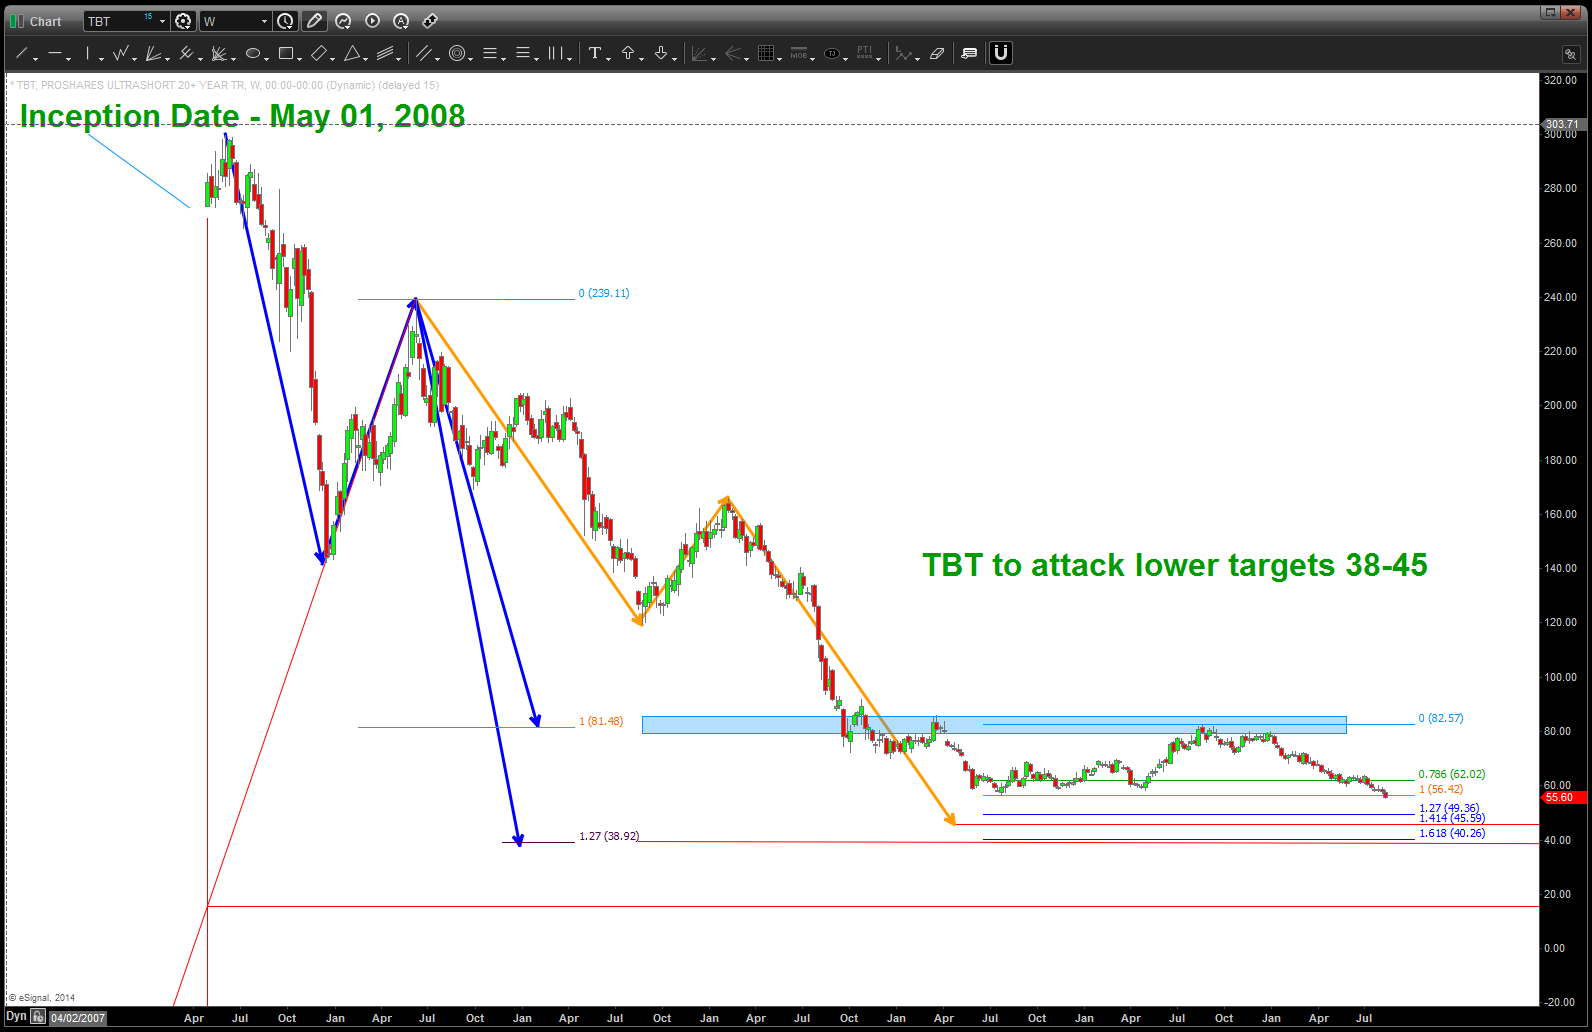
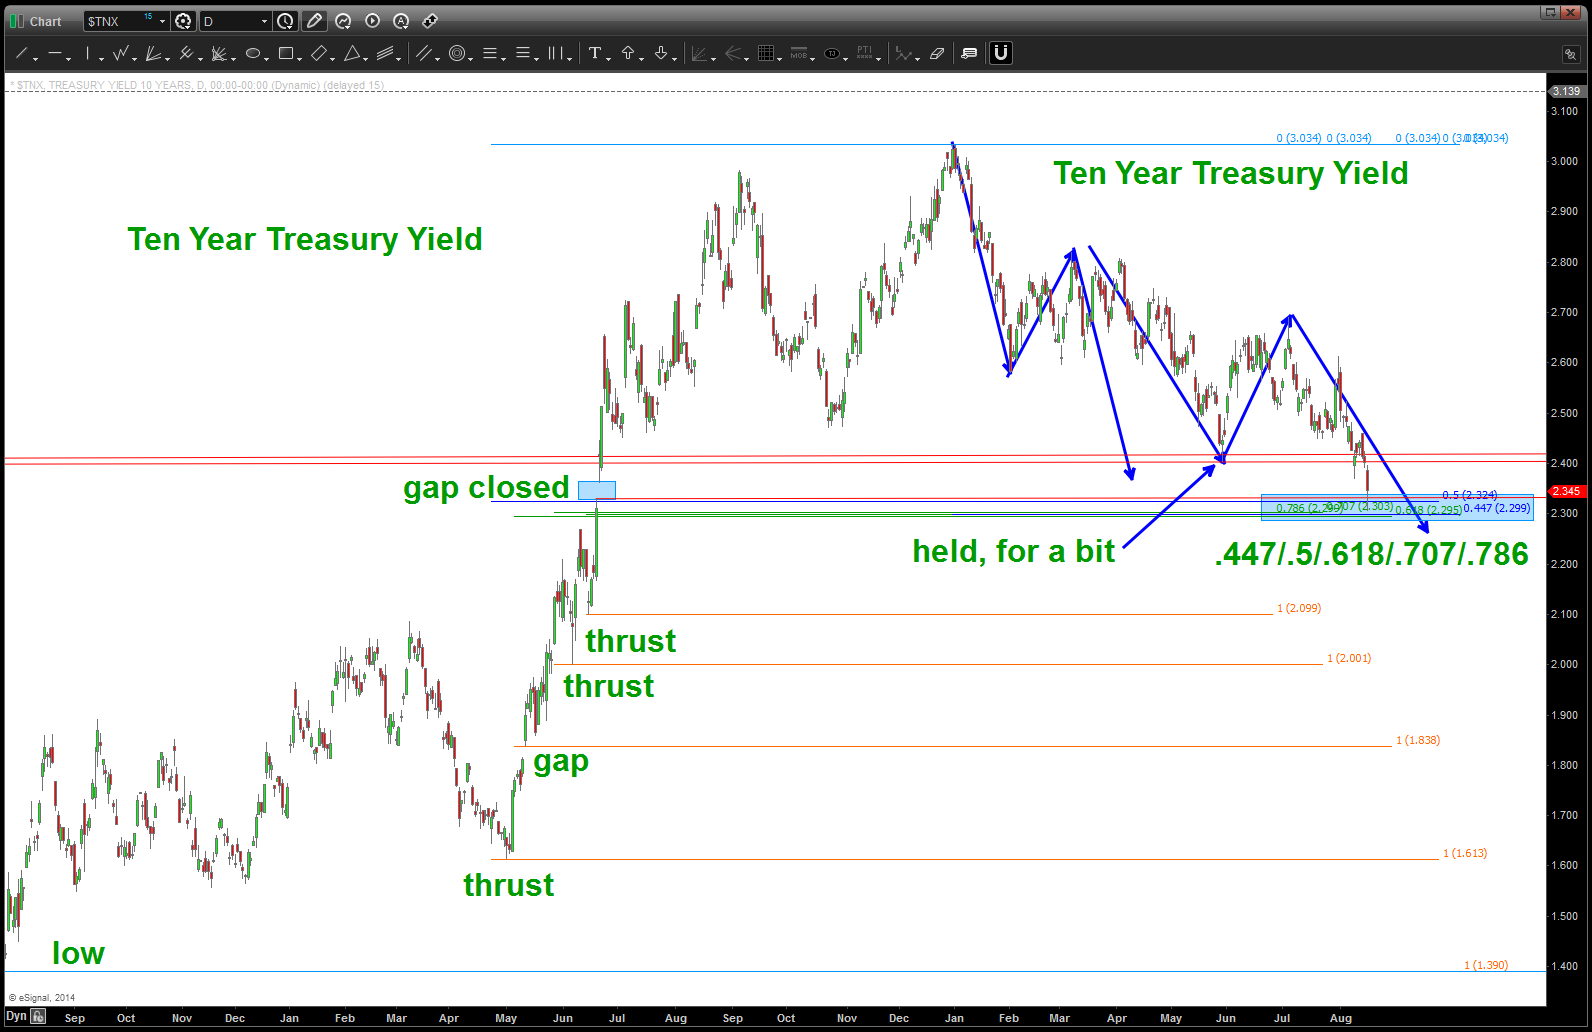
CLIFF NOTES 2: this is a tough one … the pattern in the fixed income market (30 year) failed and has gone much higher//the pattern on TBT failed. HOWEVER, the long standing target on the TEN YEAR Treasury Yield was hit on Friday. Quite frankly, I didn’t think it would get hit as the 2.4 level provide some nice support and then, ultimately failed. So we are at THE critical level for the rate structure on the 10 year. I’ll stand by my guns this is corrective in nature, but the Ten Year needs to stop here or we’ll vacuum lower and rates will continue to plummet. I also updated the 30 year count to show a potential NEW HIGH if this count is correct. I will be the first to admit that our pattern failed on the 30 year/TBT. In fact, we found the support for the long bond ( https://bartscharts.com/2014/01/04/thelma-and-louis-and-fixed-income/ ) and it was at a very crucial level at the time of that post. It held and since then has rocketed higher (lower rates).
CLIFF NOTES 3: we are at a CRUCIAL CRUCIAL LEVEL …. not trying to be wishy washy as we have to take a stand but I can see the case of either direction. But in order to take a stand and some risk – my bet is on the TEN YEAR holding this low and starting back up ….
CHEERS!

HI, I am fully aware the FED is leveraged beyond thunder dome !!!!
DBA – be patient, now let’s follow up.
Posted on August 15, 2014 Leave a Comment
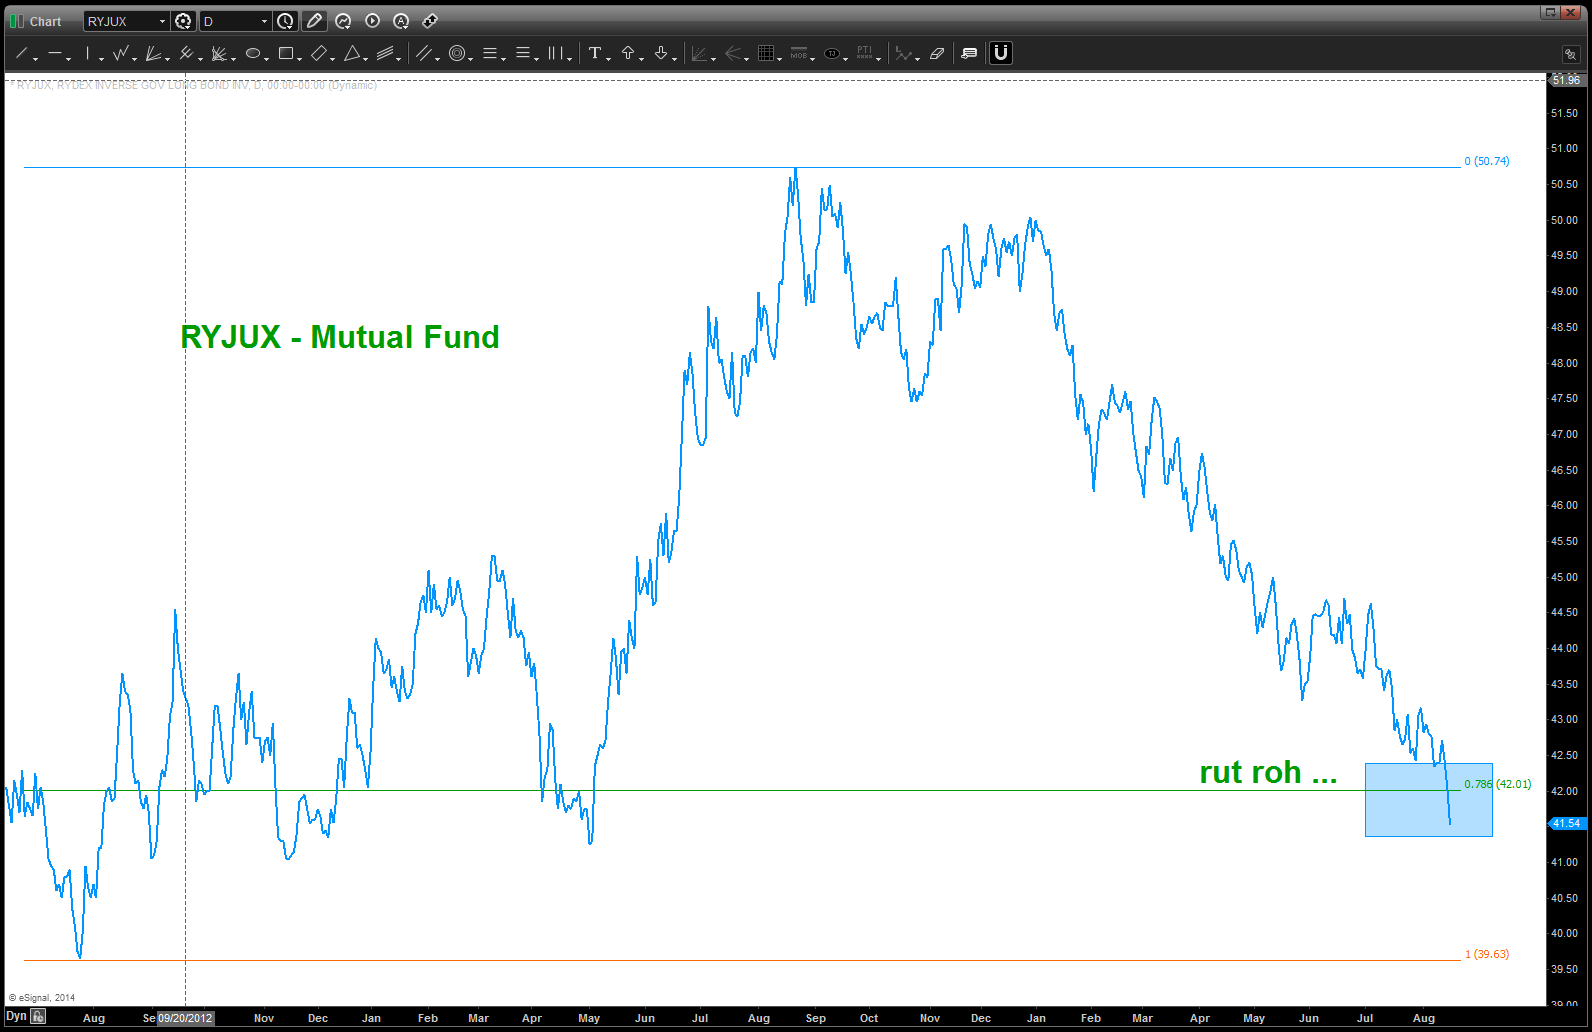
CLIFF NOTES: Corn and Wheat have hit their targets. Would still see risk below the .841 retrace on Wheat but believe these patterns are complete. Need to wait a little while longer on Soybeans …
Charts ..

Soybeans Continuous
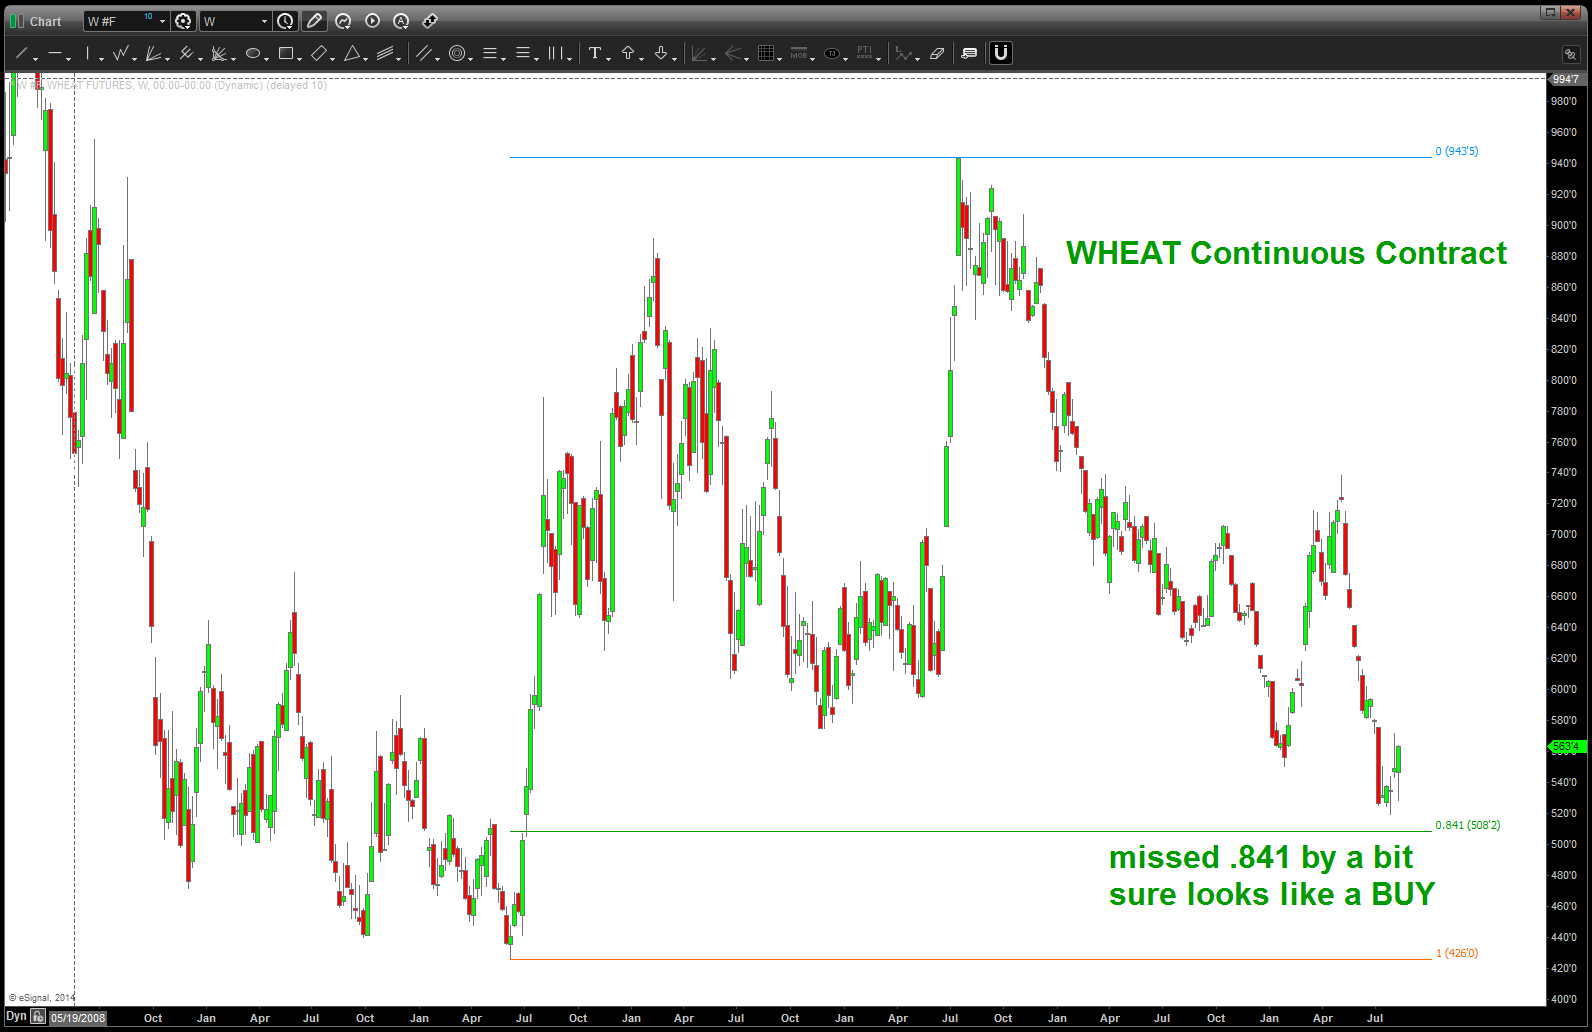
Wheat Continuous
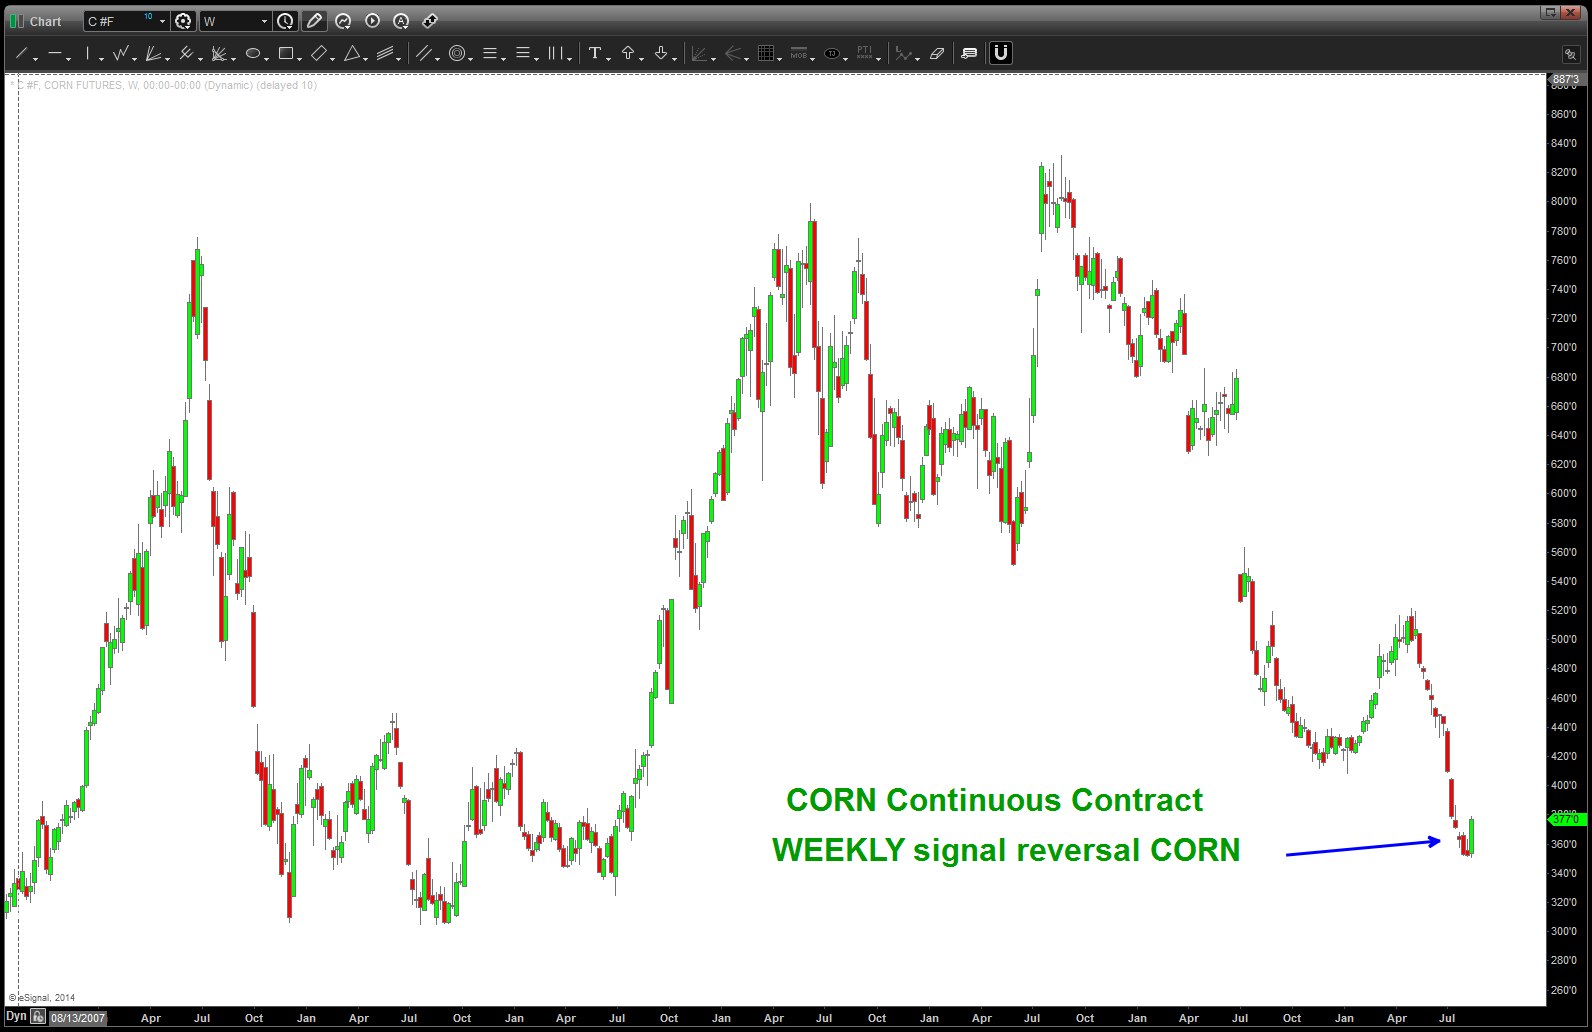
Corn Continuous
the commodity markets are ROCKING AND ROLLING w/ regards to Corn, Soybeans and Wheat ….
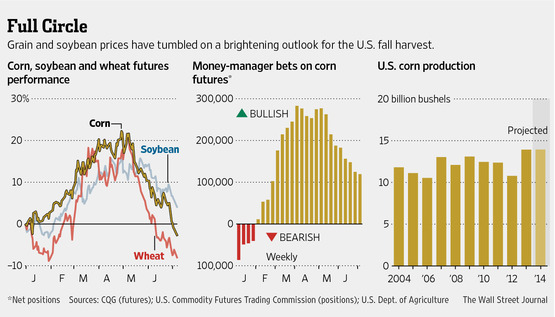
so, I don’t know ANYTHING about the inner workings of the grain market but I do know MEASURED MOVES and look at some of the beauties on Corn, Wheat, Soybeans. If we look a the “money manager” bets in the middle of the chart above it appears that NO ONE is bearish? Also, is the bushels projection that great? anyway, w/ extreme bearishness and this quote:
“There’s just no real stress, hot [weather] coming along, so we’re going to blast prices down,” said Jack Scoville,
Vice president at brokerage Price Futures Group in Chicago. “Most areas are in really good shape.”
sure looks like a BUY opportunity. But, let’s don’t get cray cray here … we have a target area of support but look at what happened the last time we had a measured move like this … the darn thing bounced around for 3 months. so, let’s let the market prove to us if this is support. then, just wait for that magical weekly or daily pullback (it WILL happen) and then pounce. Folks, this could take months for the correct entry …we’ll revisit these in a couple weeks.
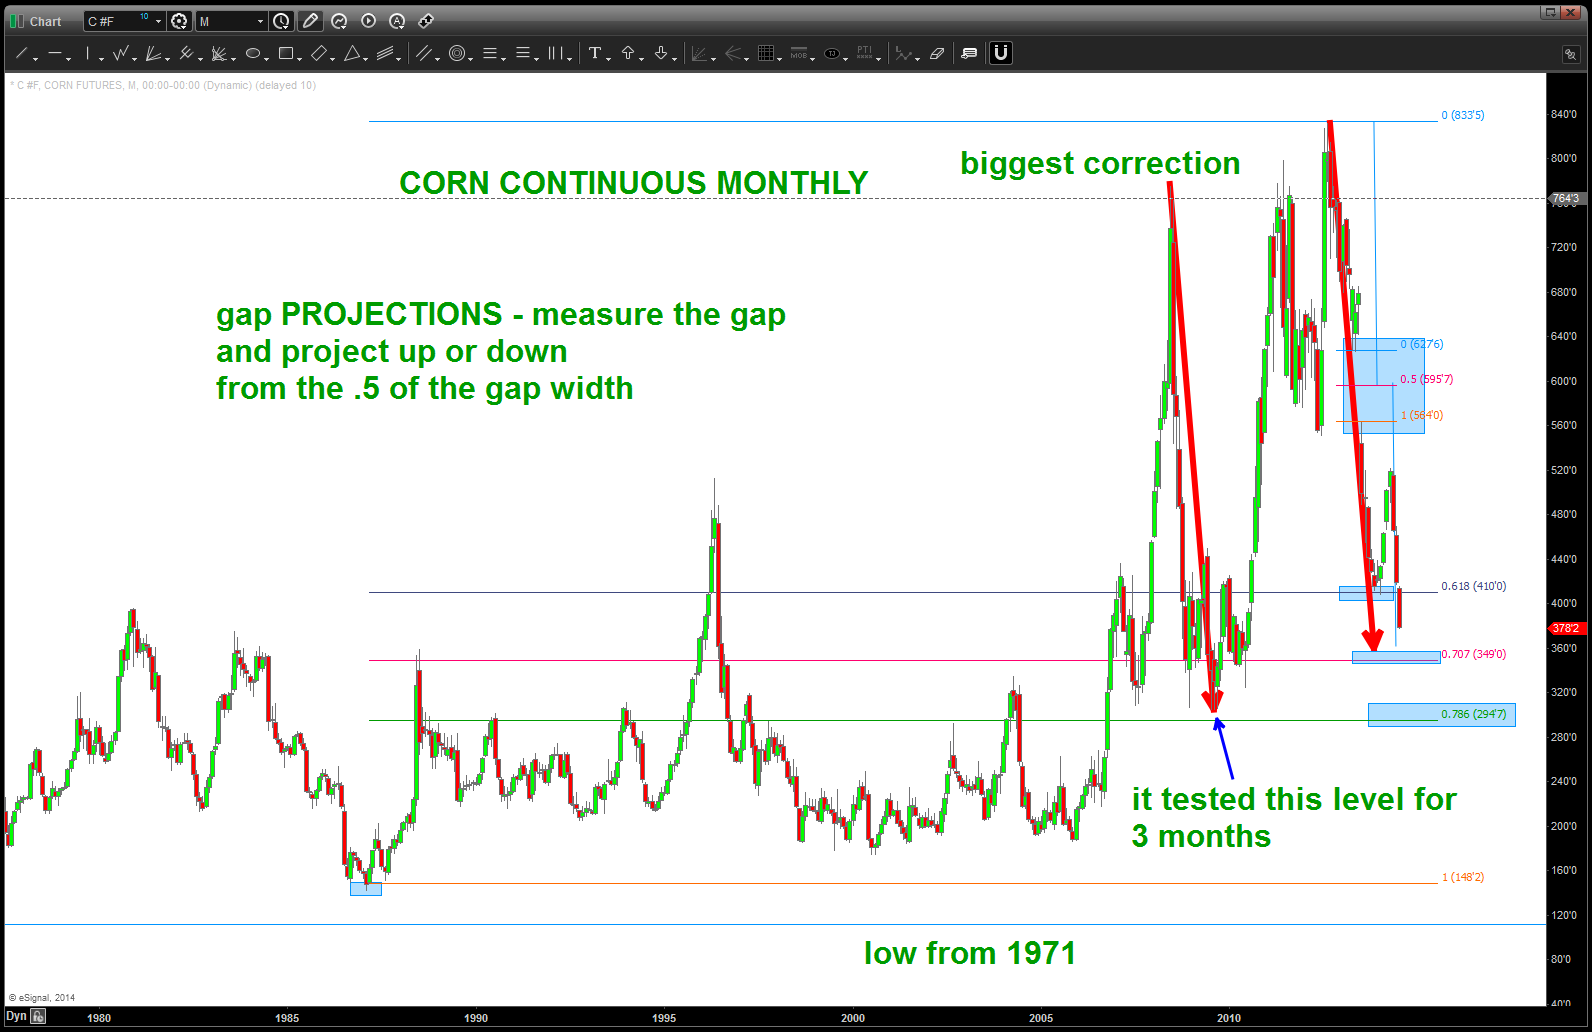
CORN continuous contract MONTHLY
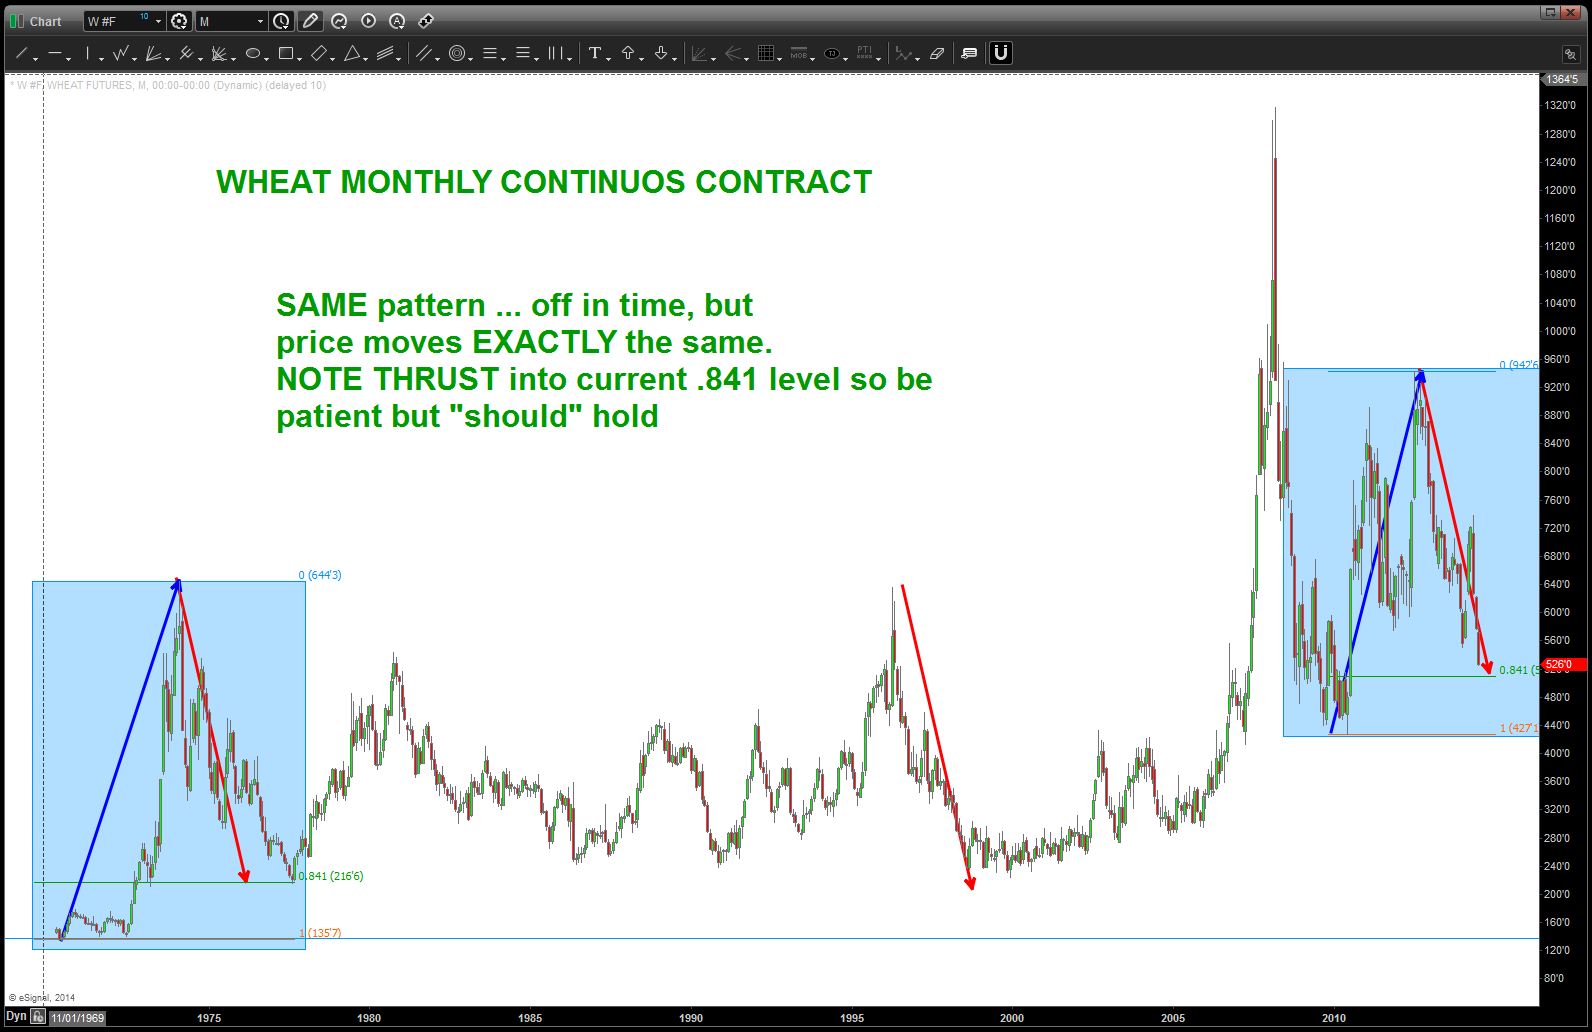
WHEAT continuous contract MONTHLY
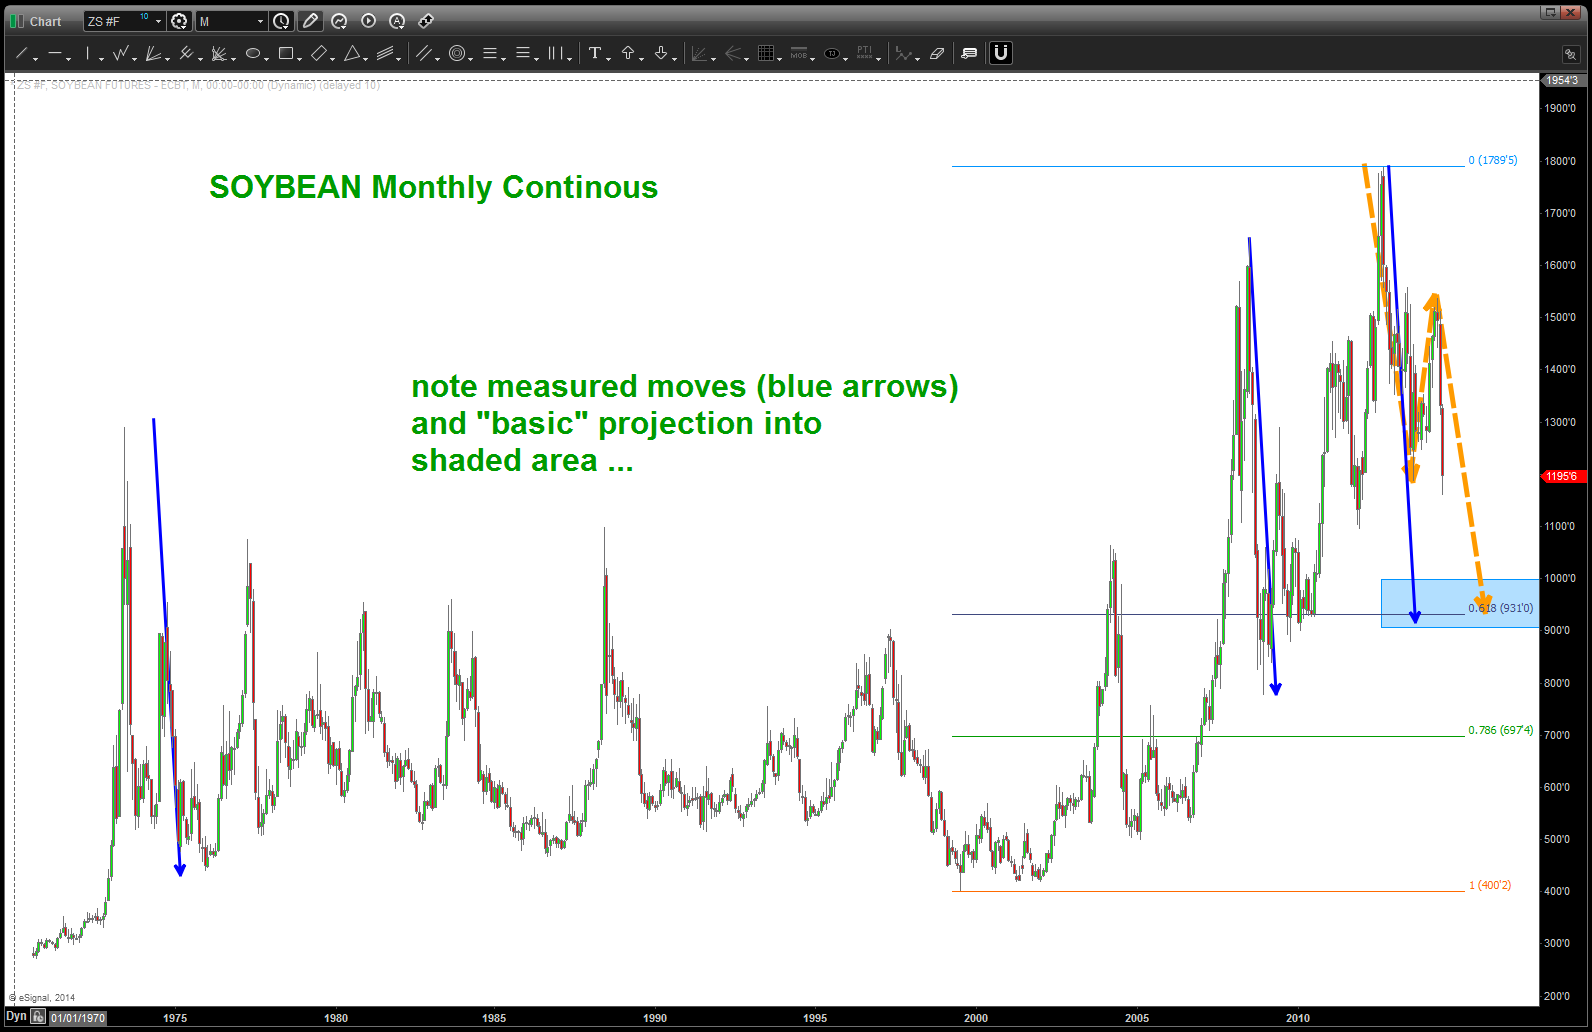
SOYBEAN continuous contract MONTHLY
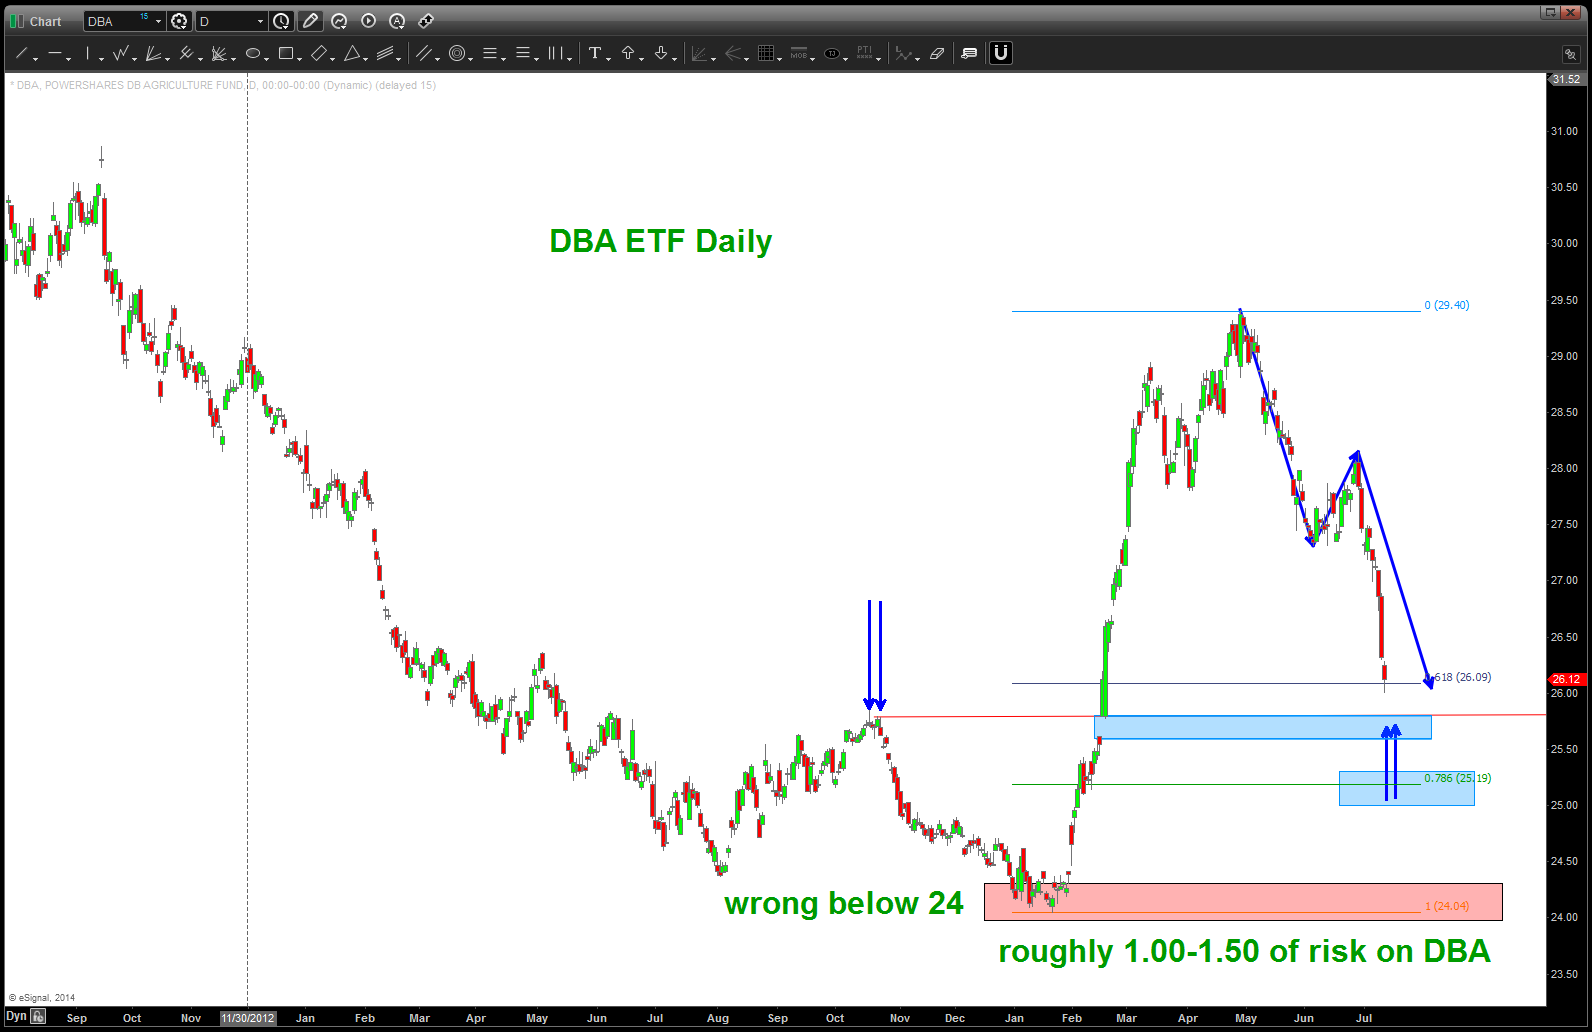
DBA
here is a quick look at the relative strength ratio between DBA/SPY. obviously, quite the thumping here BUT if you look you can see 5 waves down. if we break the swing low (sure looks like it’s going to happen) then we’ll go to that lower target I believe.
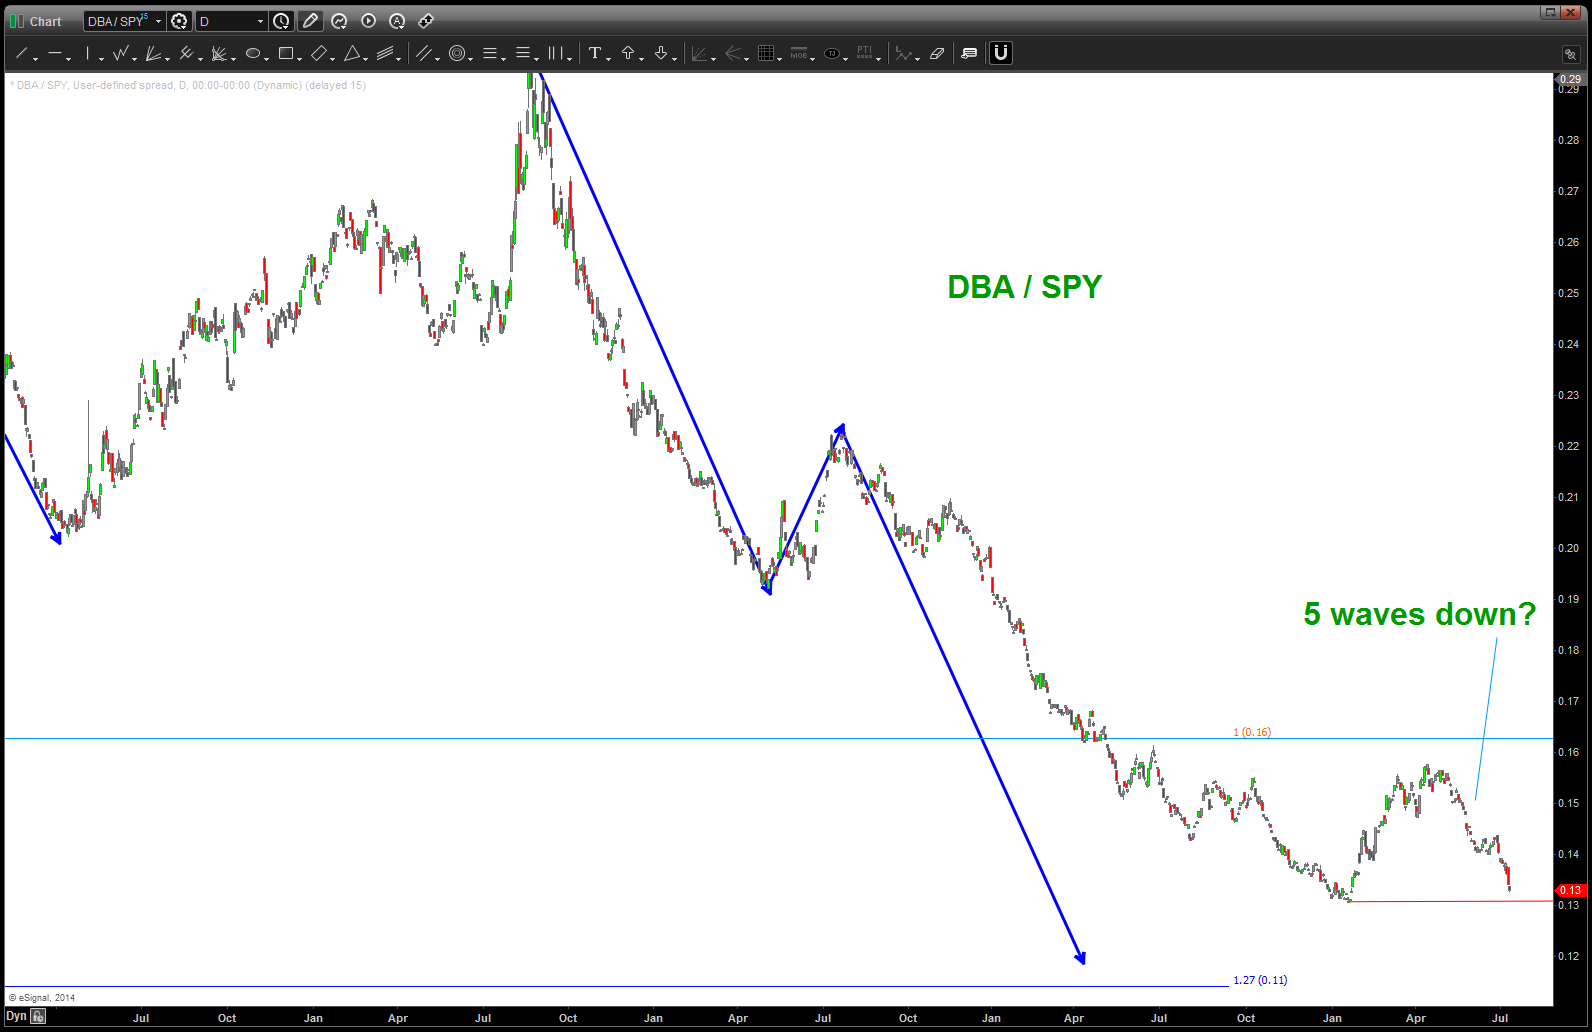
DBA/ SPY relative strength ratio
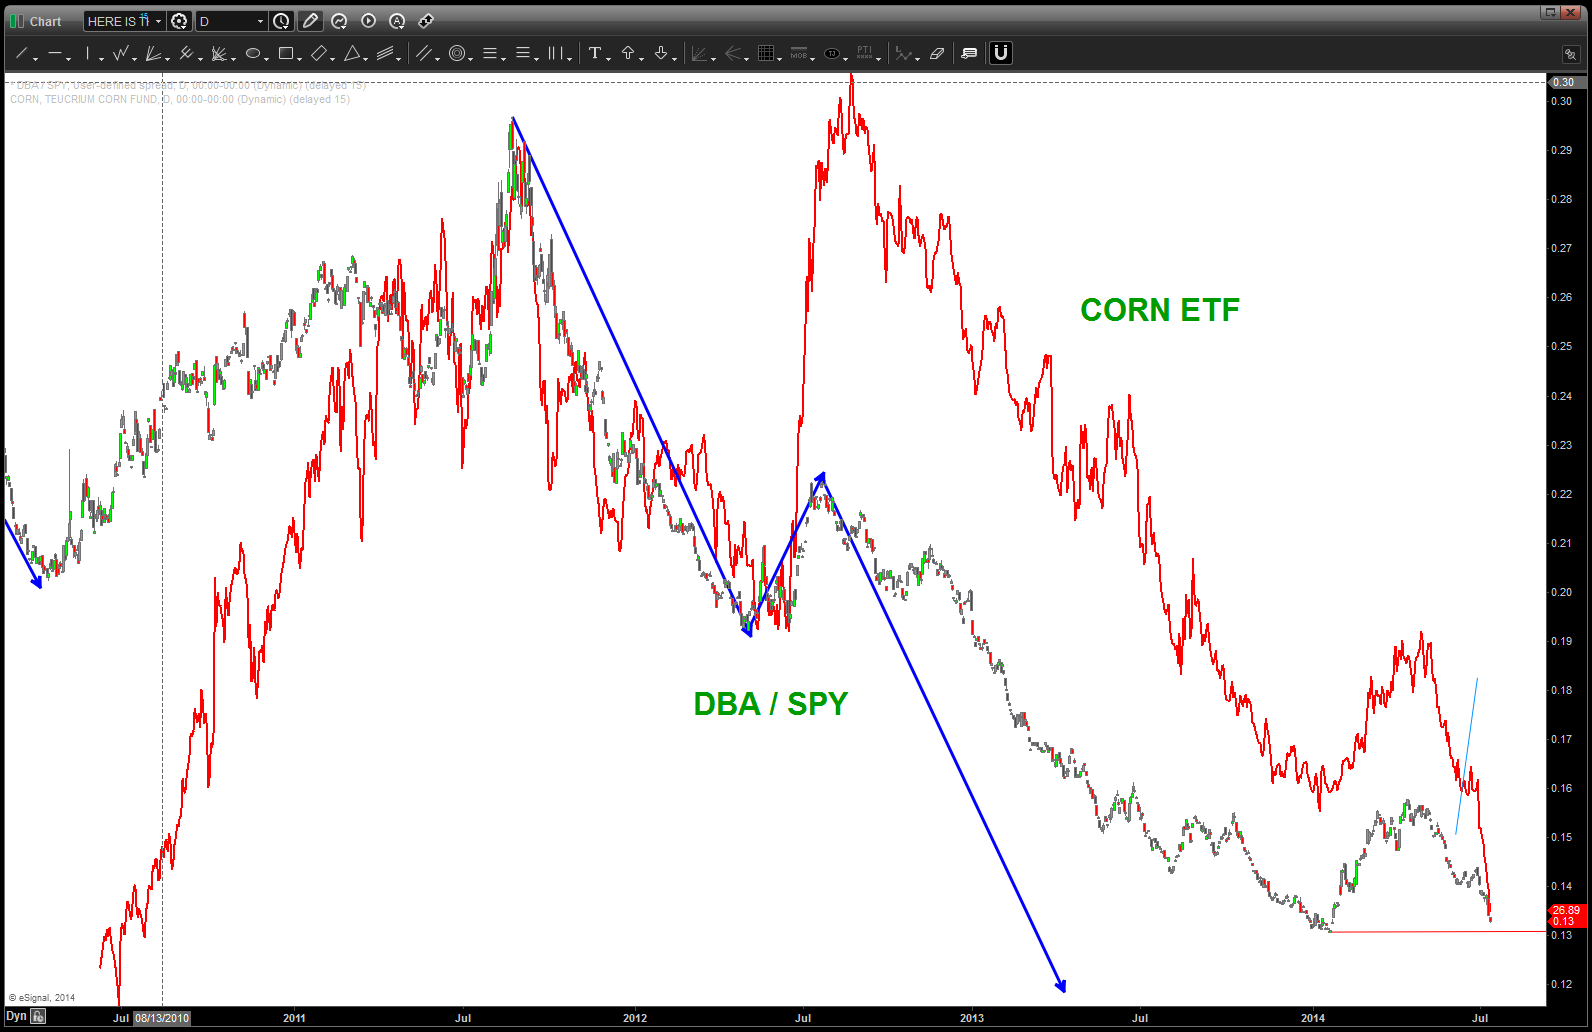
so, why is this important …? well, let’s take the CORN ETF and overlay it on the ratio. As you can see … when this ratio bounces so does corn (make sense) so we will look for some rotation into the agriculture market if/when the equities lose there luster.
Gold and Silver Update ….and some more of the metals
Posted on August 13, 2014 Leave a Comment
CLIFF NOTES: a case is made, below, that inflection points in the ratio of GOLD/SILVER cause big movements in the spot gold and silver prices. Also, it appears that Gold lags. We are at a resistance level which “might” be one of those inflection points so expect the metals to get moving NOW or SOON. Probability points “lower” across the board for the metals.
Ratio Analysis – we love using the patterns w/ ratio analysis and, of note, is the noticeable strength in Gold vs Silver the past couple weeks. So, our first chart is going to be the relative strength of spot gold / spot silver. Basically, when the candles are going DOWN then SILVER is “stronger” and when the candles are going up GOLD is “stronger.” After looking at this chart one thing stood out … it really didn’t matter which direction the relative strength ratio was moving, but when the ratio shifted and one of the assets noticeable started to our perform or under perform THEN we had an inflection point in silver. Below you will see a set of three charts showing you the PATTERNS that were present in these ratio’s which, if we knew about them, might have helped us position ourselves – based on other patterns and technical factors — on the long or short side of the spot silver or spot gold market or both.

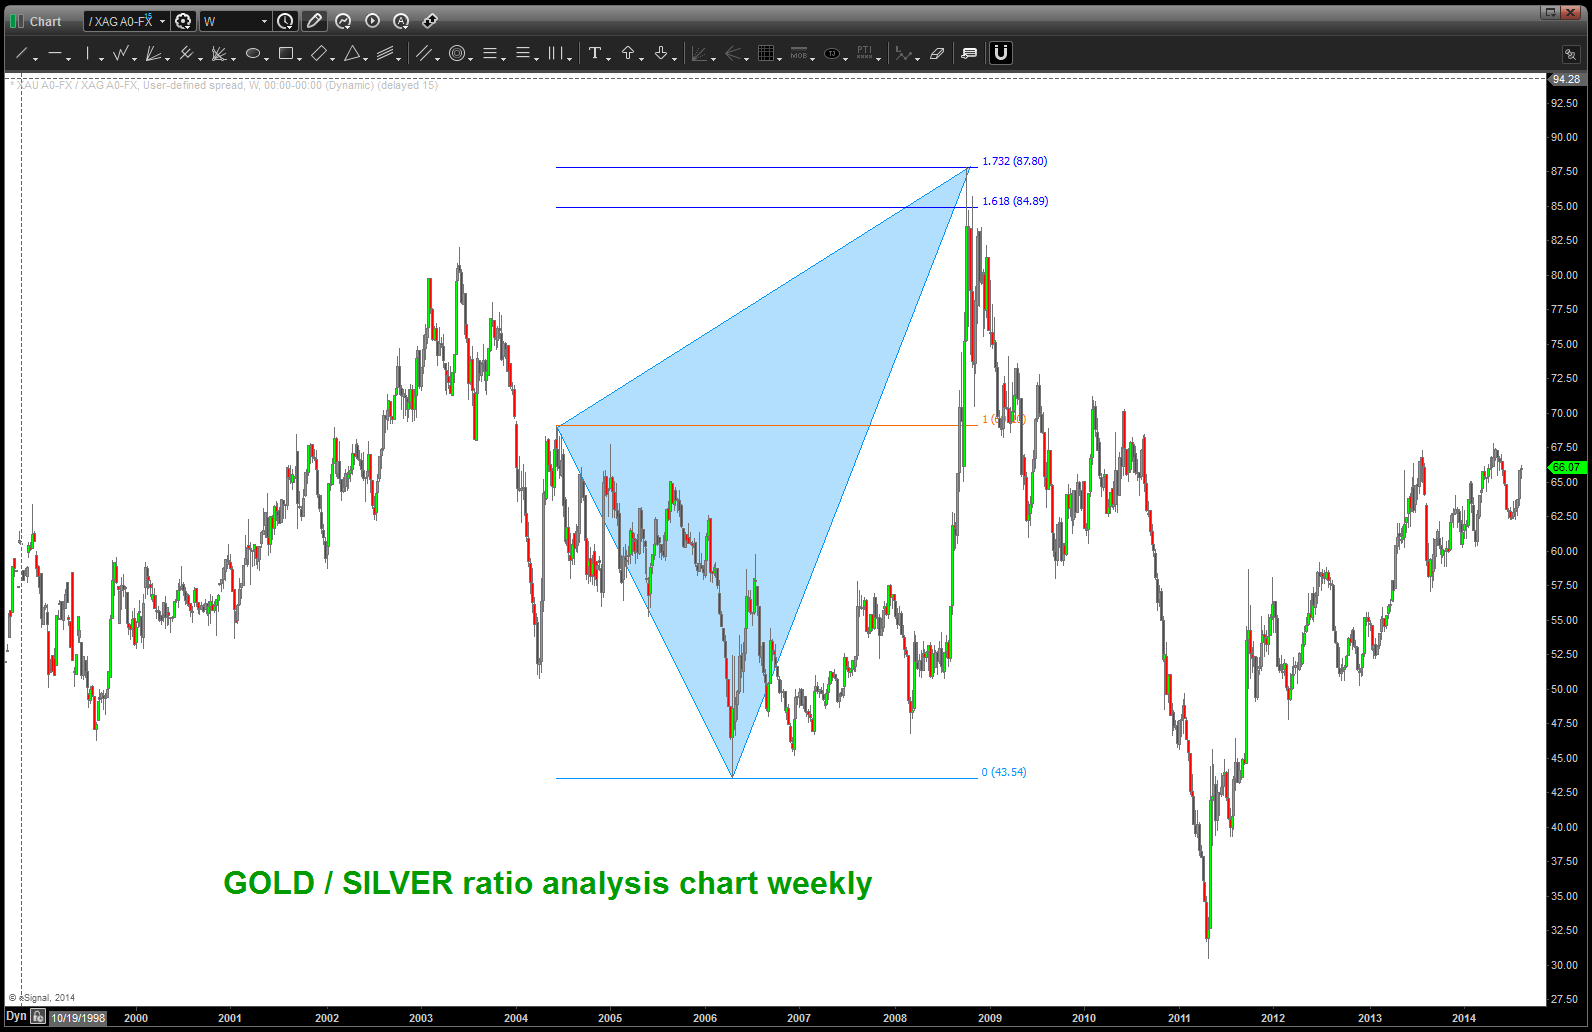
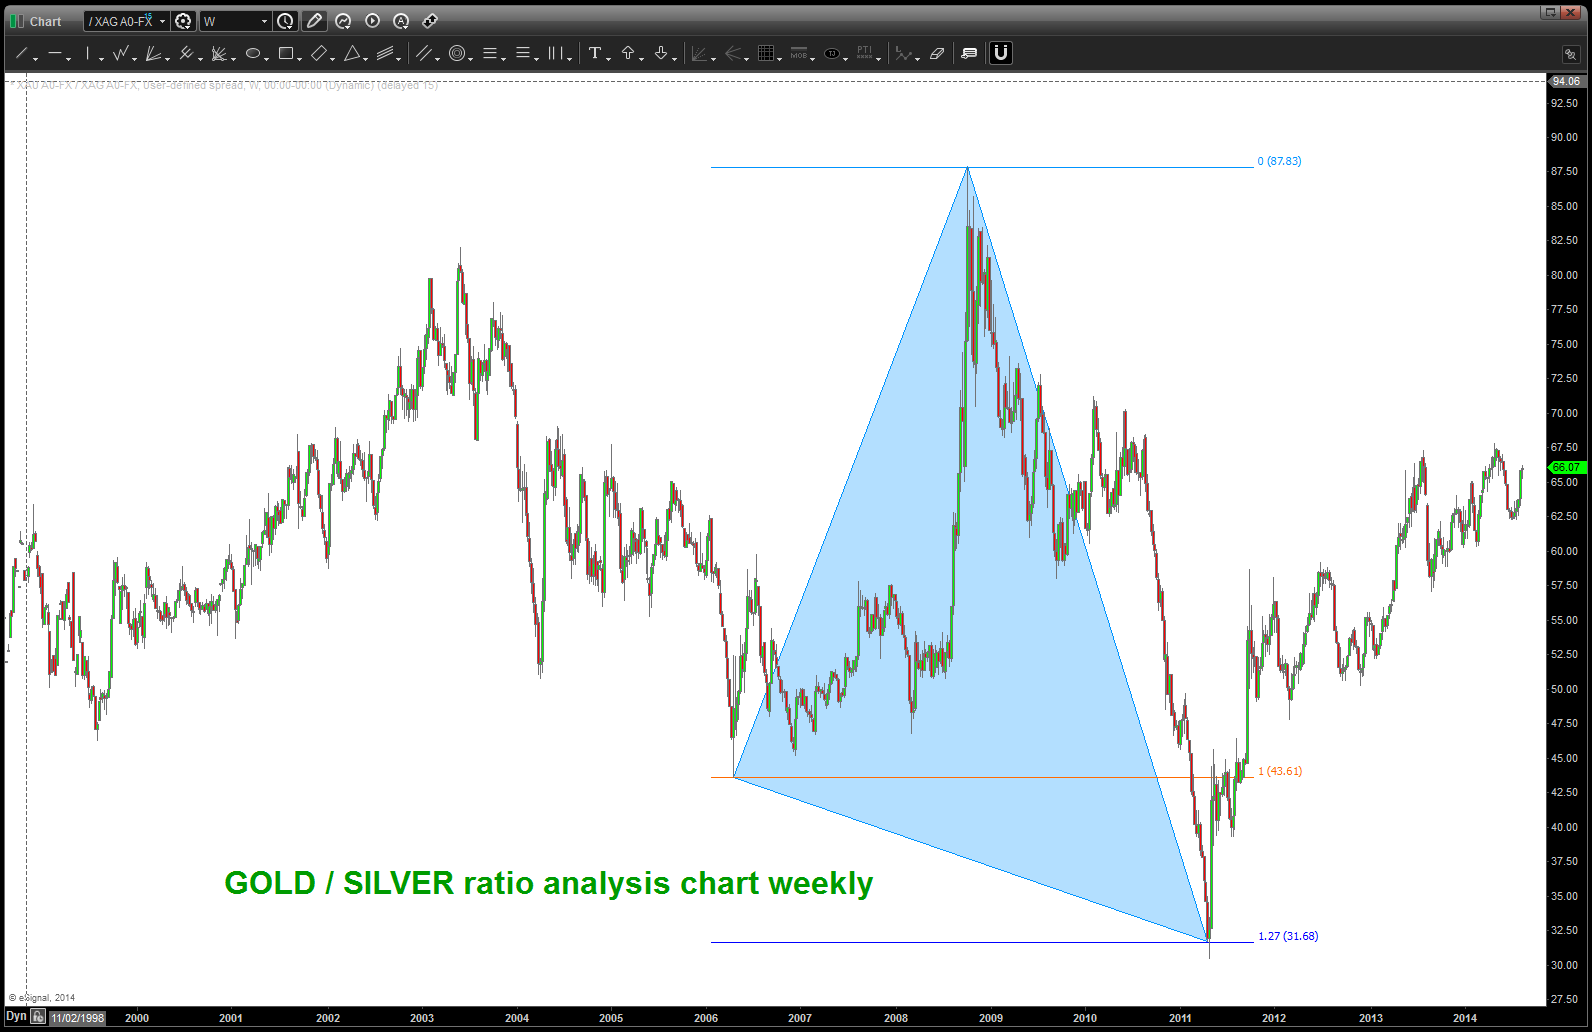
so where are we now …? Just using basic measured moves we can see that EVERY move in this ratio has been “used” before so our trick is to find out which one might work or not. Note the downward blue and orange arrows … then note the crash and how the vectors were almost perfect. so … we “should” do either the black or the purple measured move UP –right? note we are at the .618 of the gold/silver ratio and the black arrow would take us up to the .786. One of those two levels “should” hold and cause an inflection in the ratio. See below:
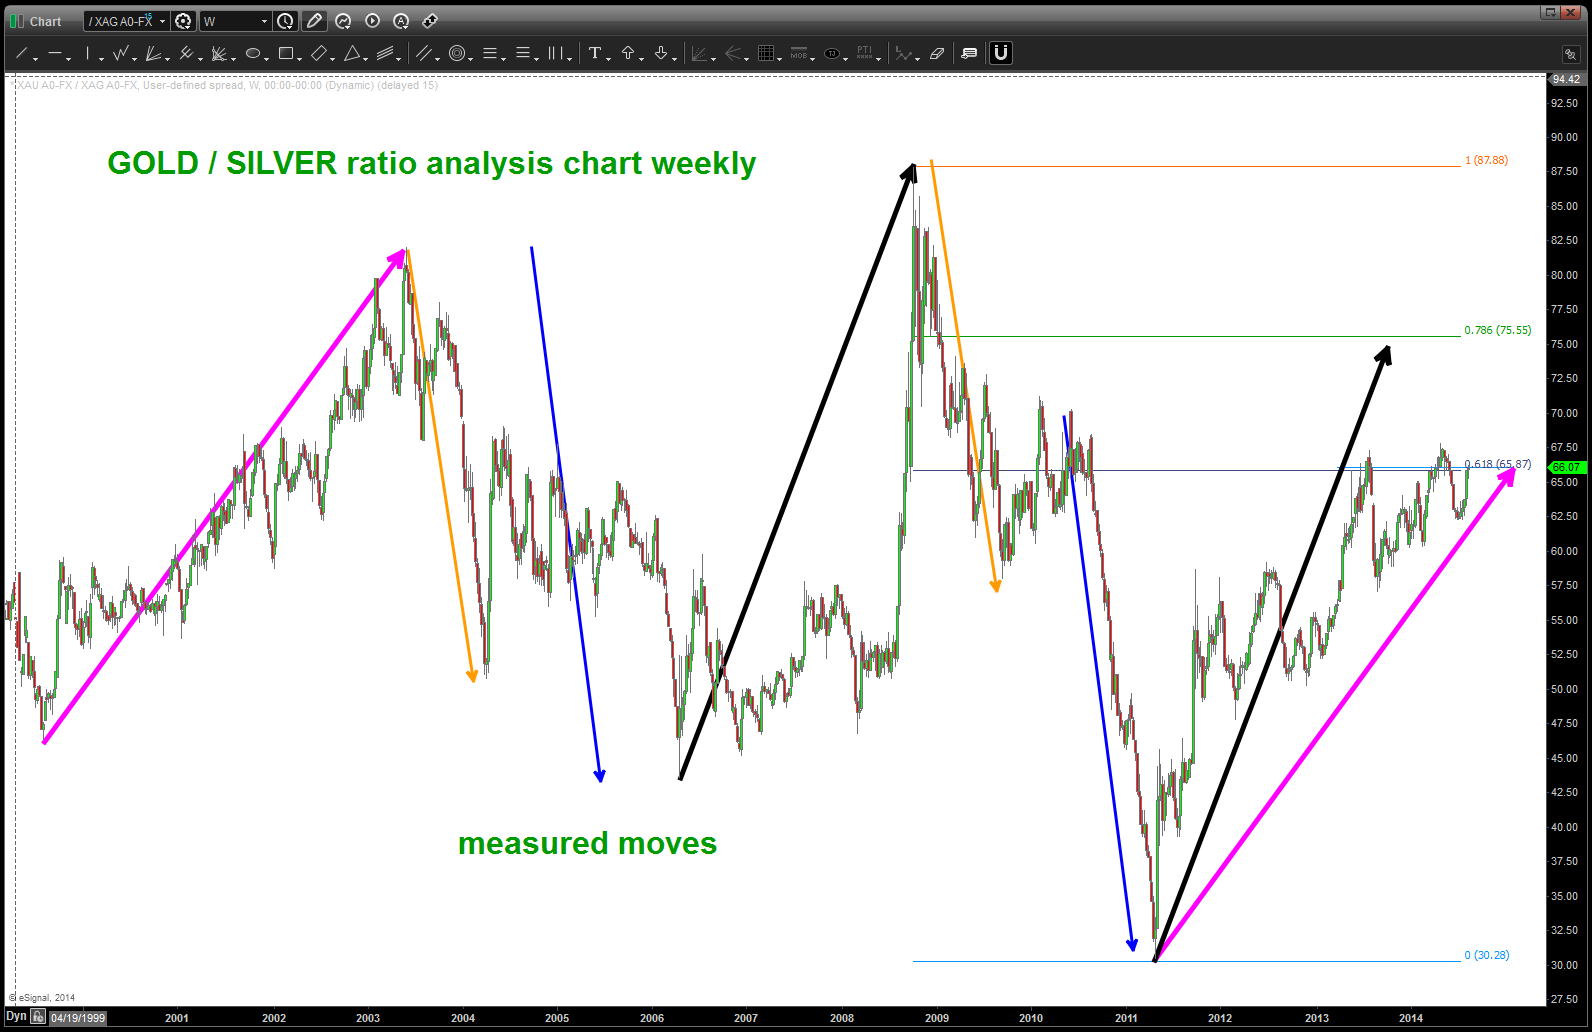
note the measured moves – that’s all we are using
so – now that we can see resistance ahead, has the ratio really helped pinpoint inflection points?
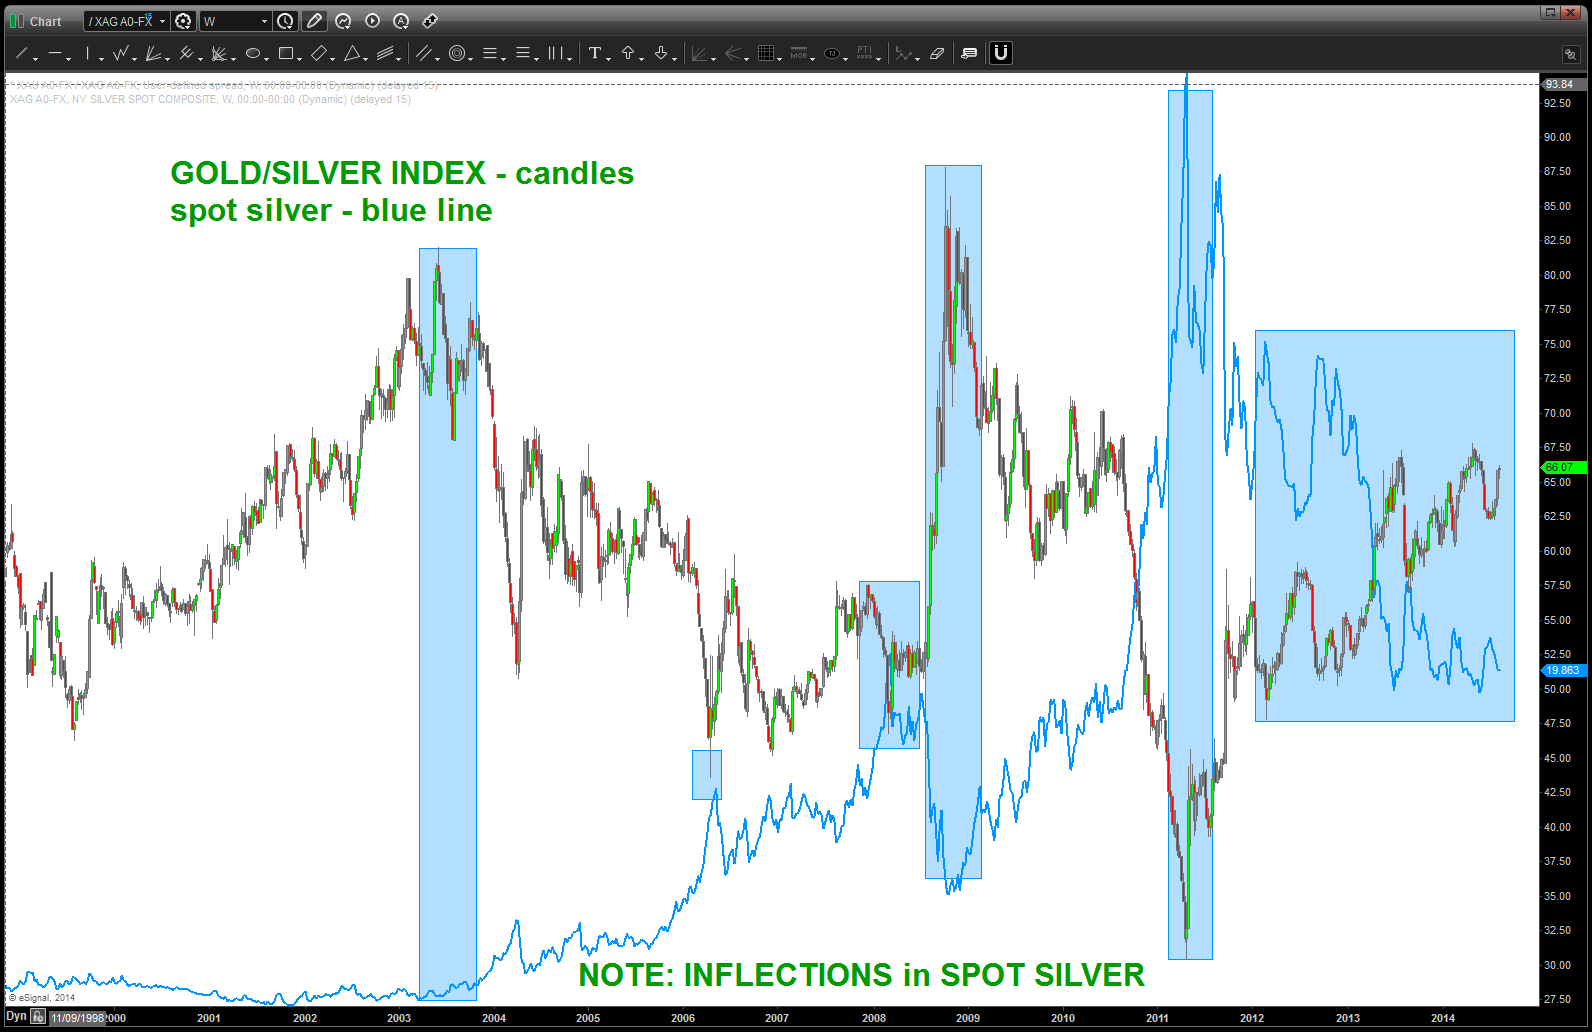
spot sliver – blue line – overlaid on ratio of gold/silver
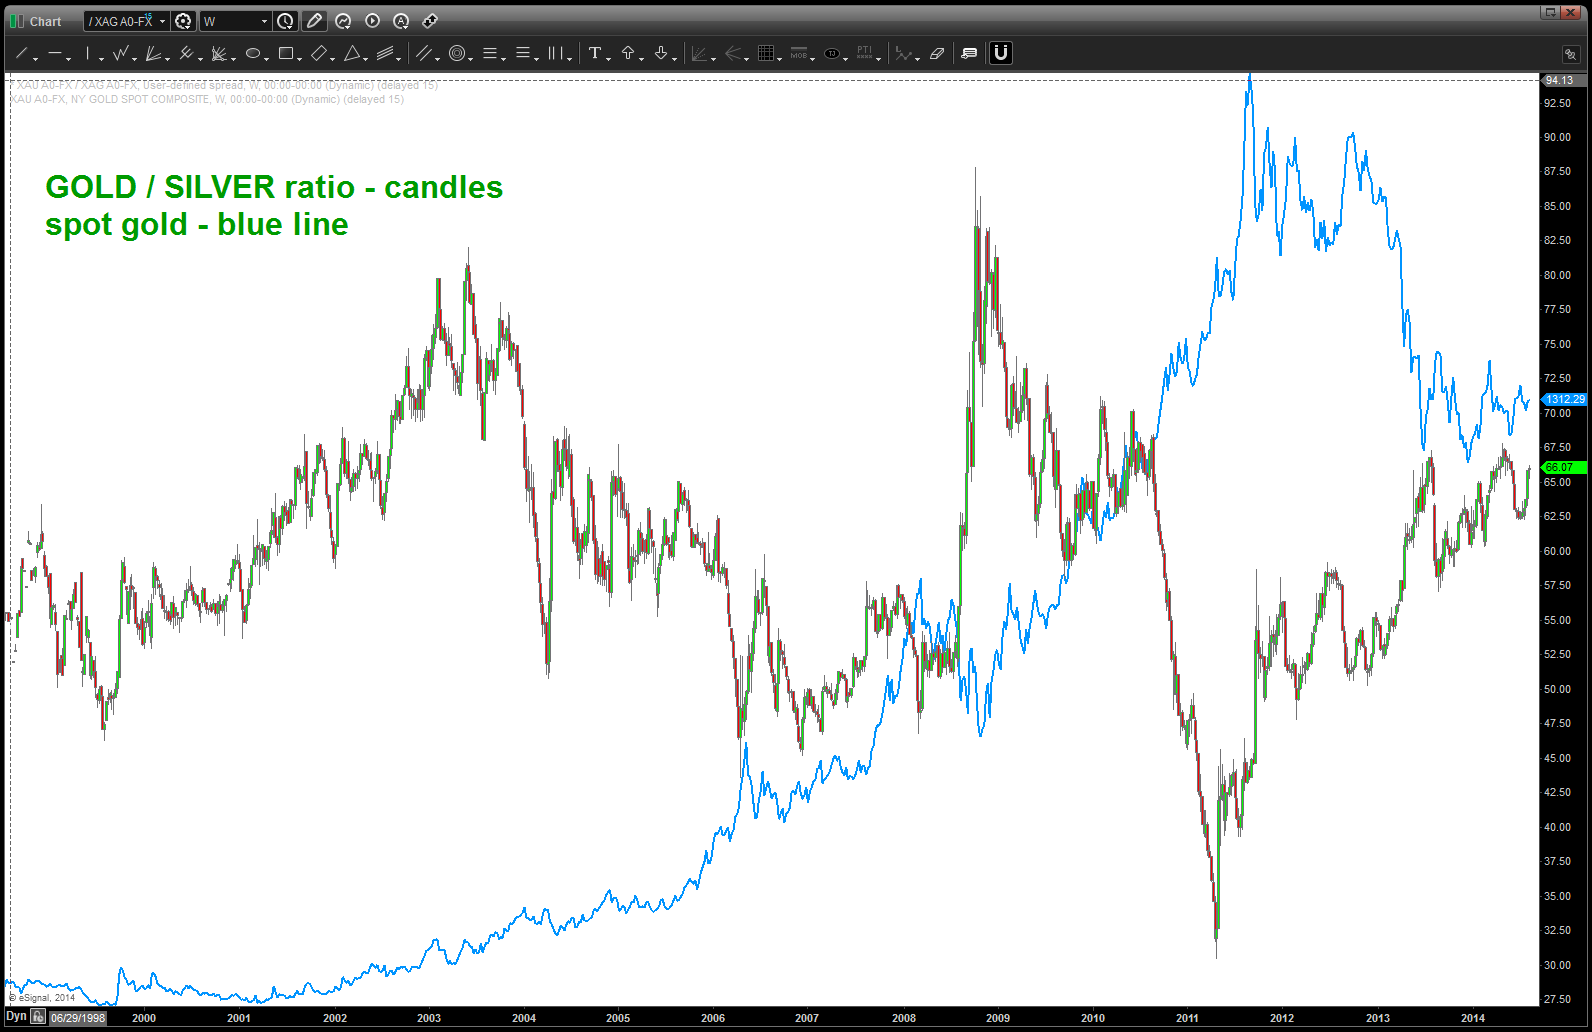
what about Gold? Well, take a peak … the key thing I see is that while it’s not as “precise” from a timing perspective it appears that GOLD LAGS THE INFLECTION IN THE RATIO …
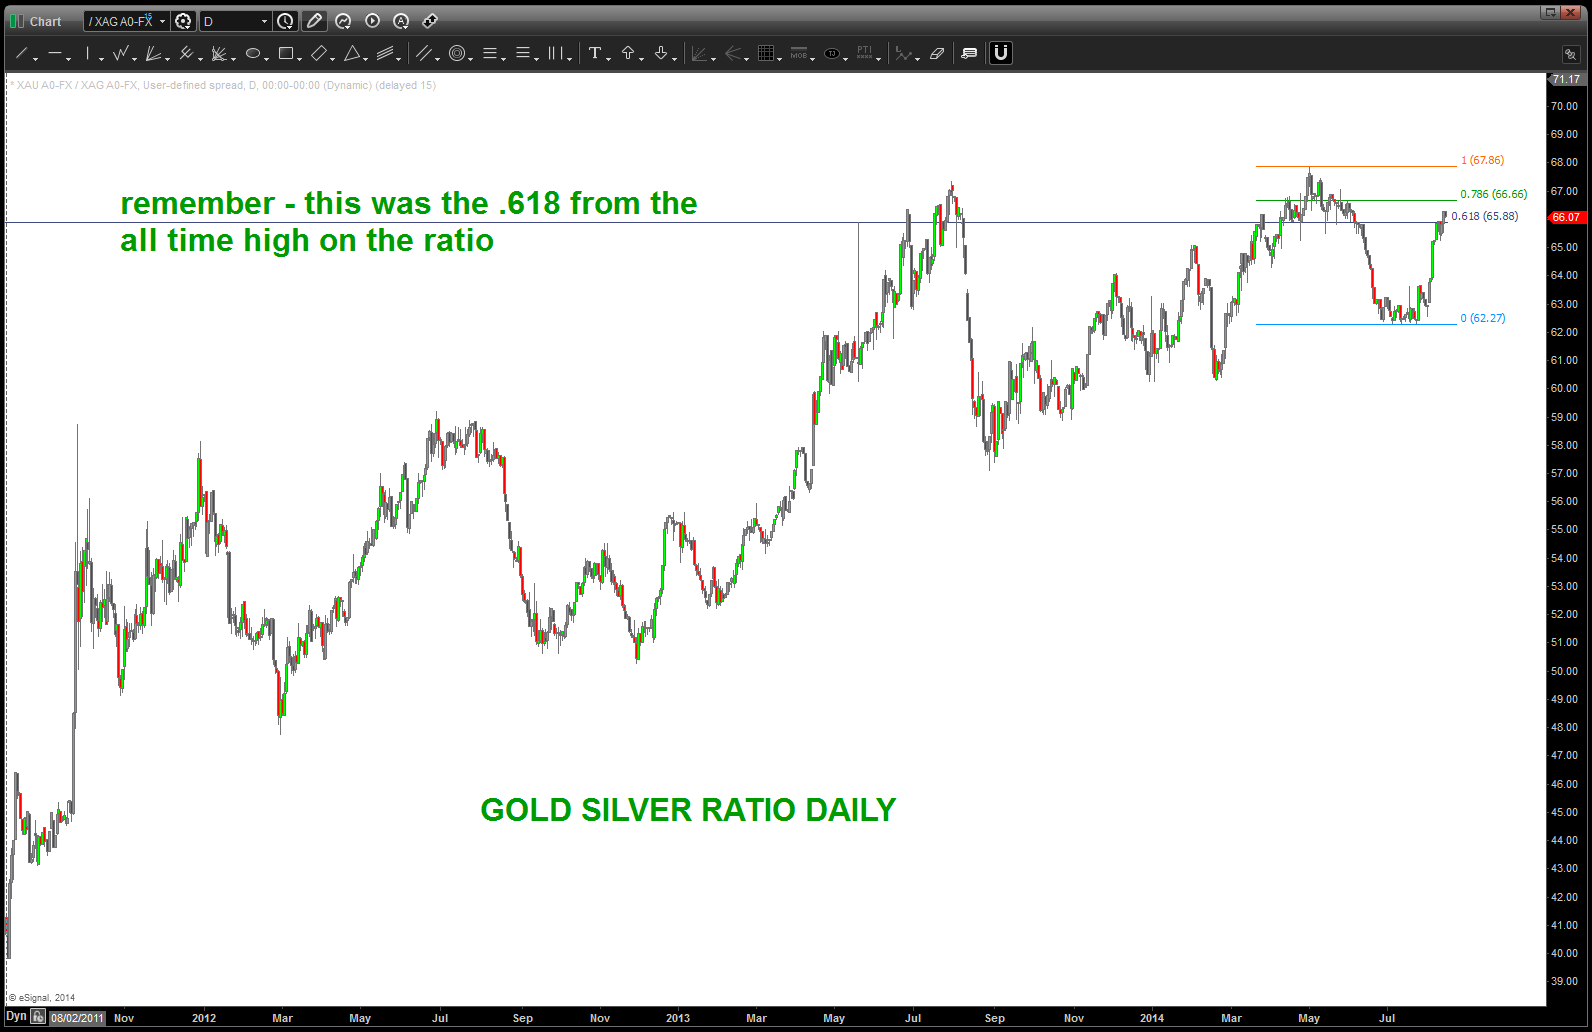
here’s the daily:
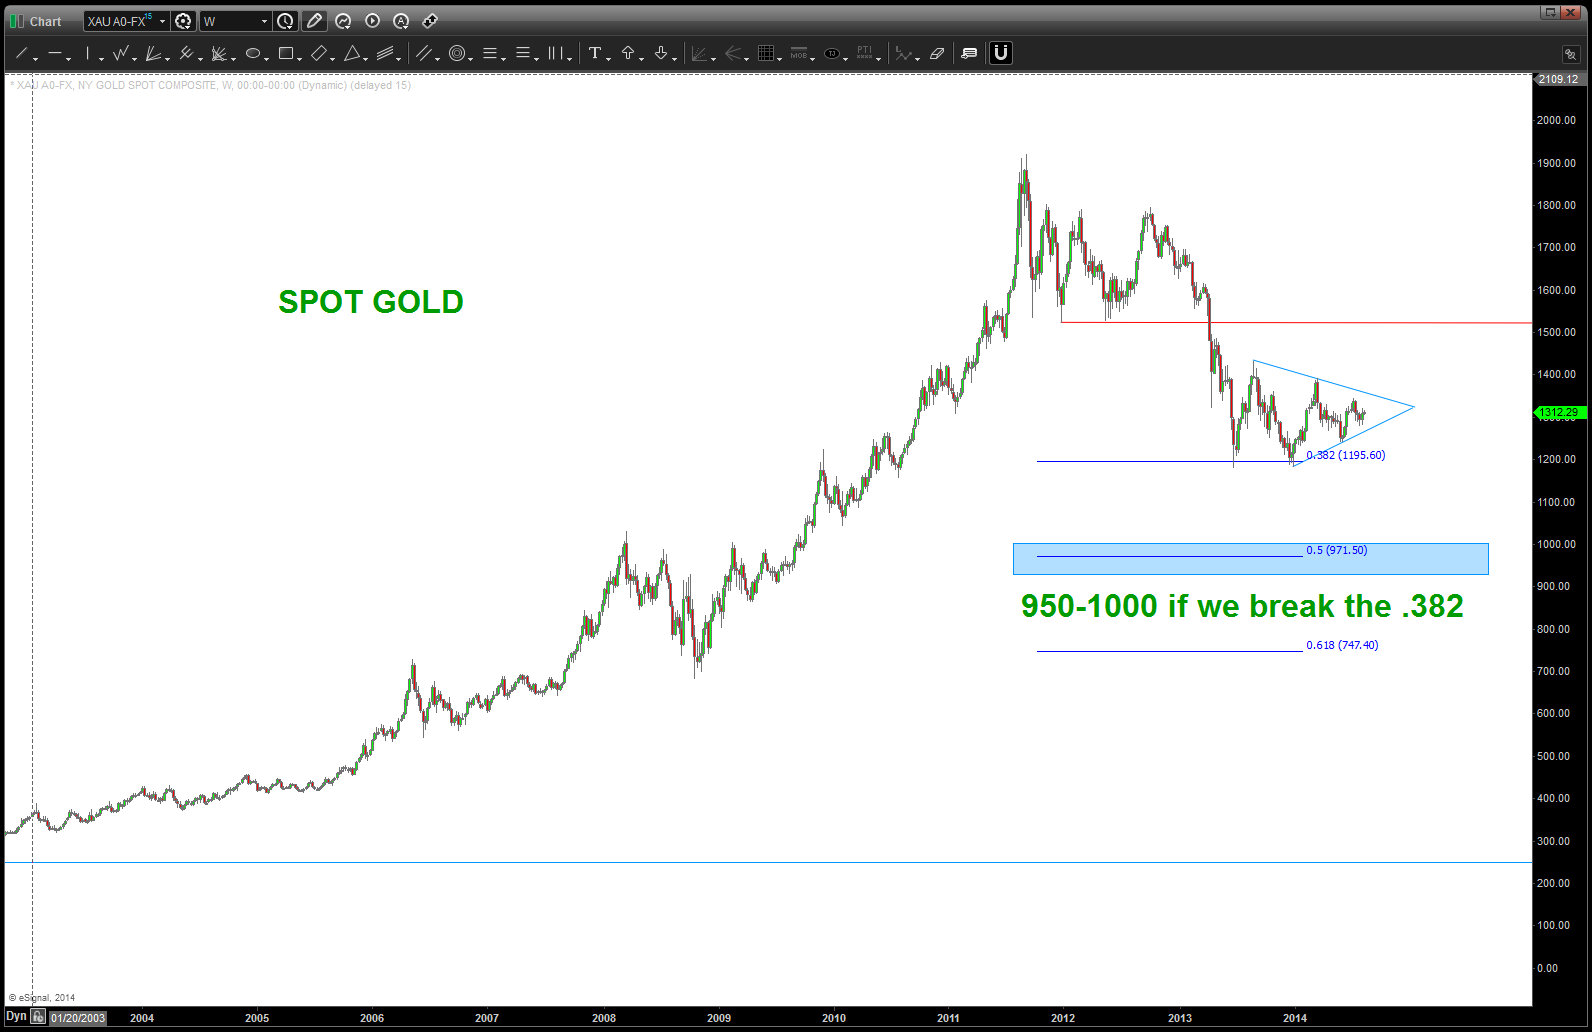
Now, let’s take a look at the metals individually. Folks, below is a great chart .. it shows the pegged price of gold from 1913 and, guess what, roughly 1200 is the .382 retracement. So, in the context of this long run in gold prices (100 years in the making) Gold is holding the .382 retracement which is EXTREMELY BULLISH. So, if you don’t believe me here’s the chart:

SPOT GOLD since 1913
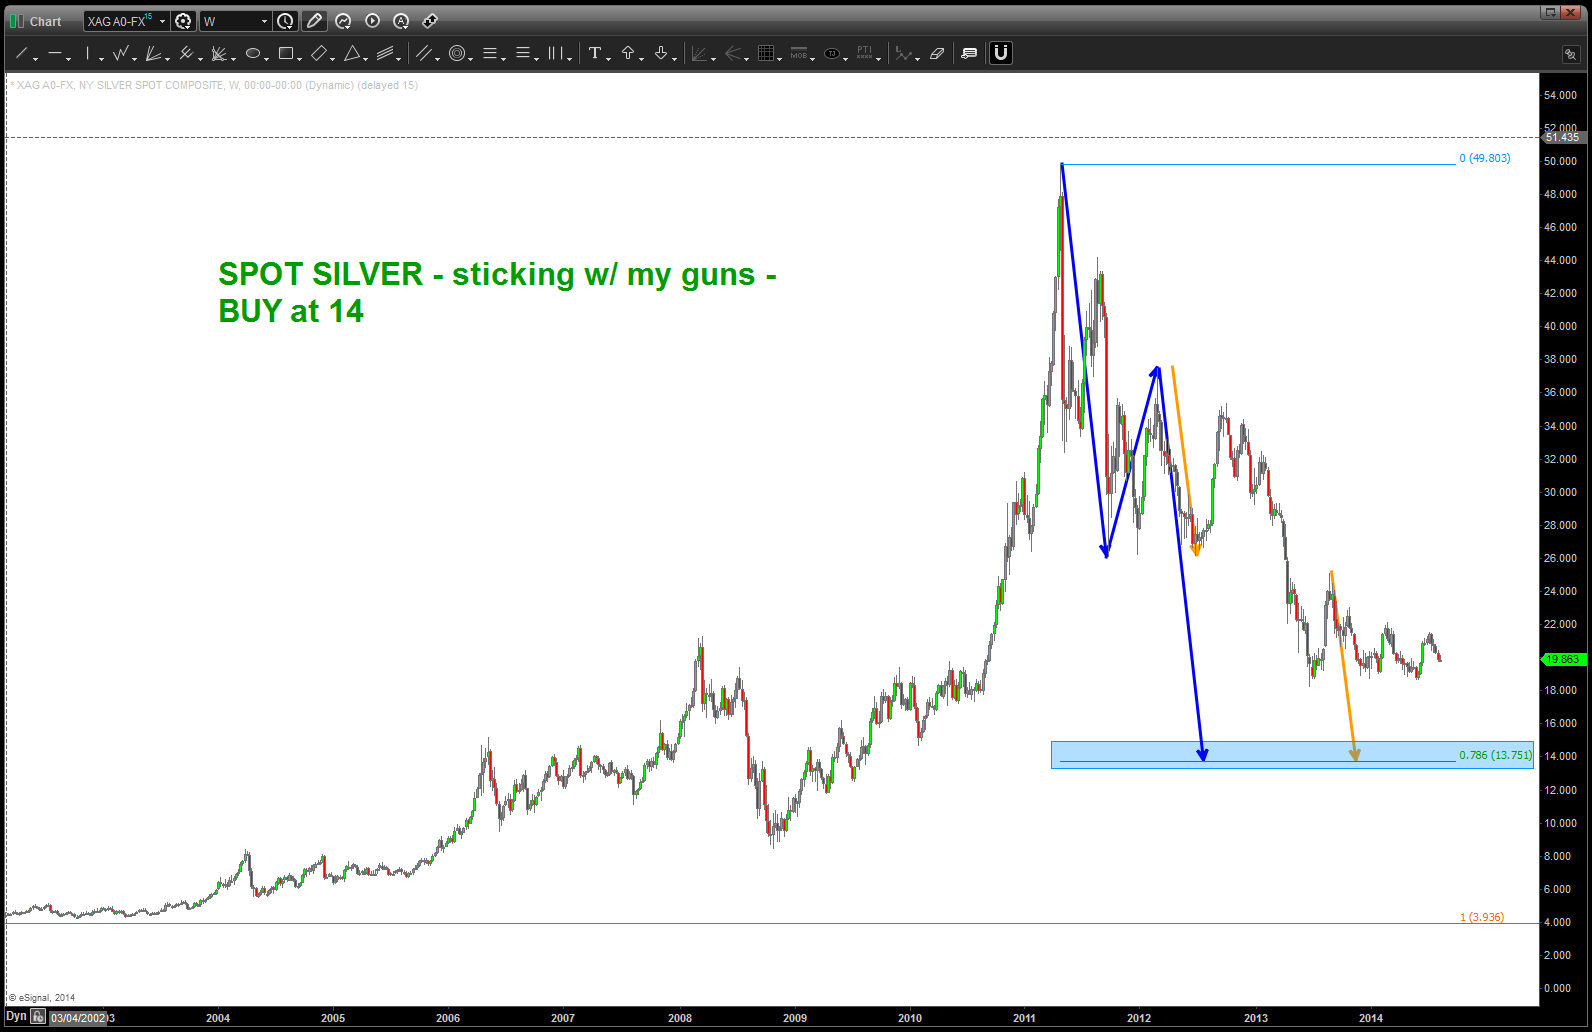
if we do break that level – look for 950-1000. Spot silver – sticking w/ my guns here and a buy at 14.
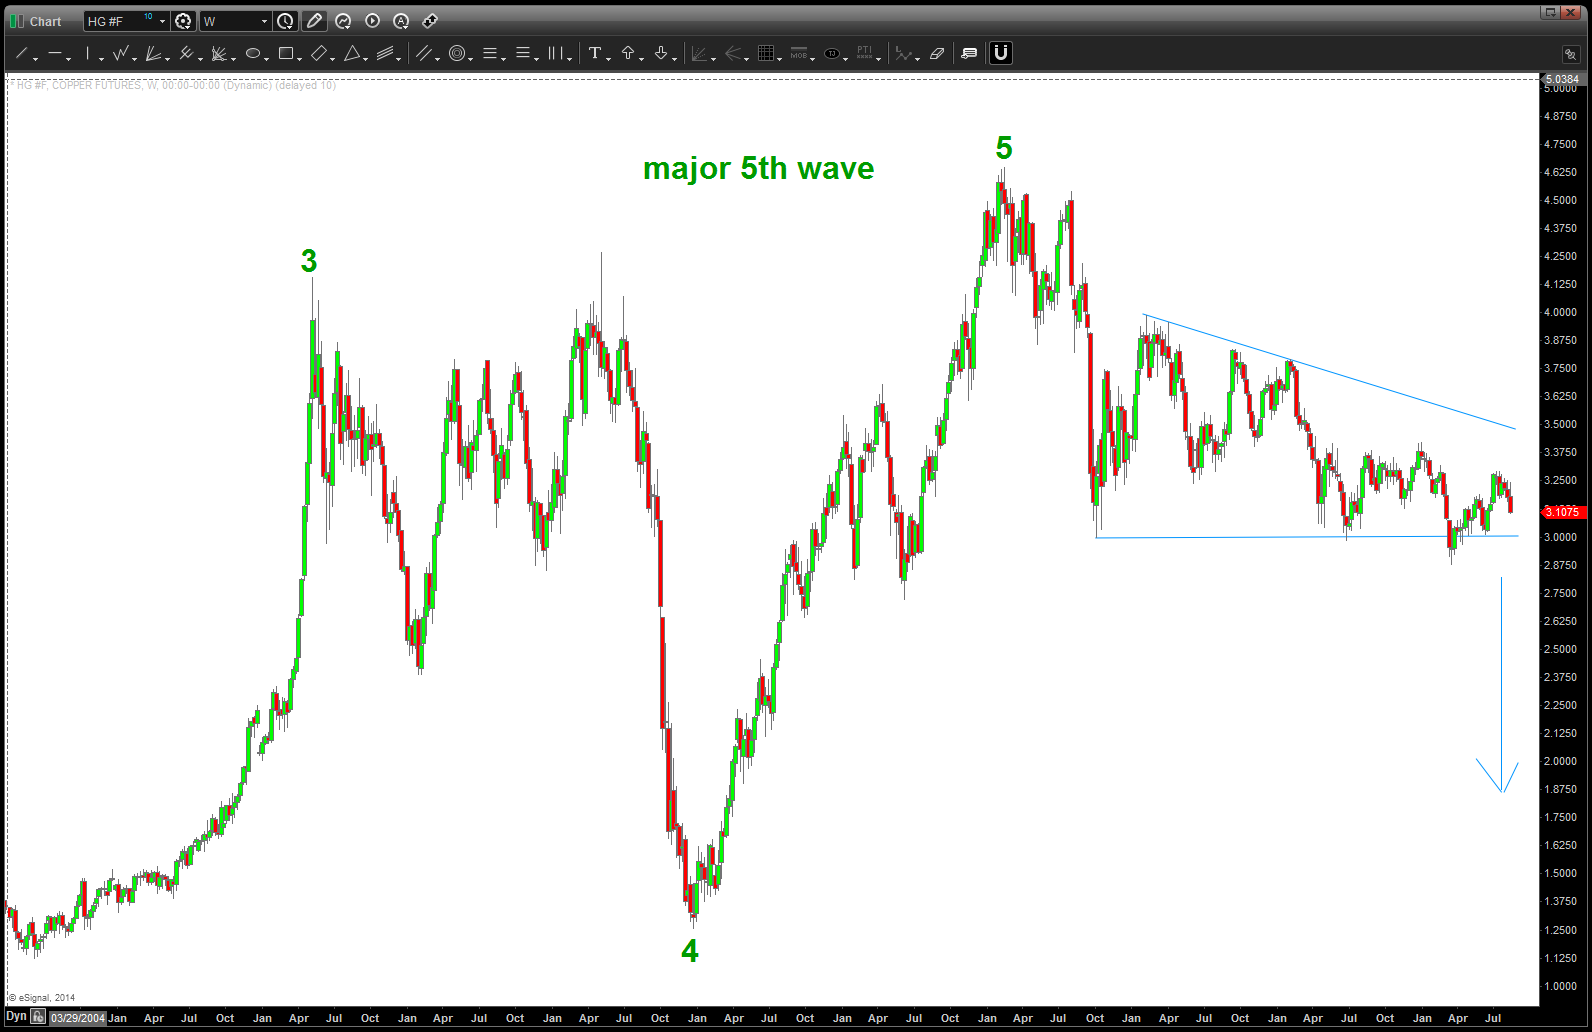
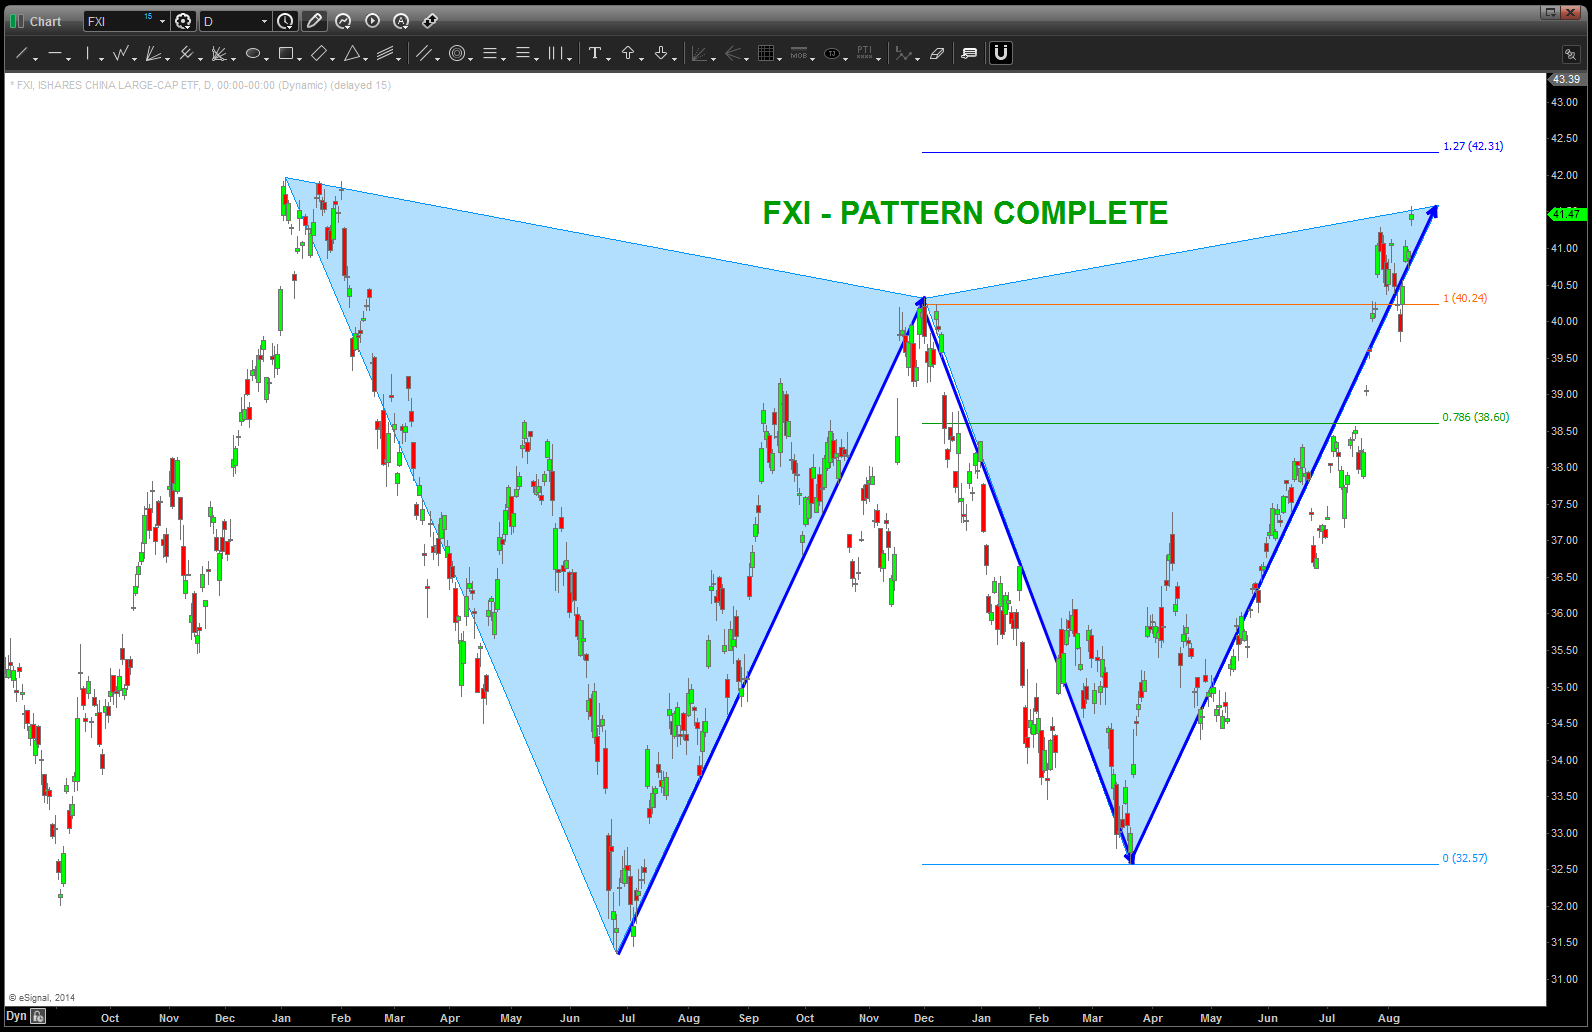
Copper – folks, still sticking w/ a MAJOR 5 wave move in copper complete. More to the downside and, remember, how FXI (China) likes/mirrors copper ….