the method behind finding the EXACT top in IBB
Posted on August 2, 2014 Leave a Comment
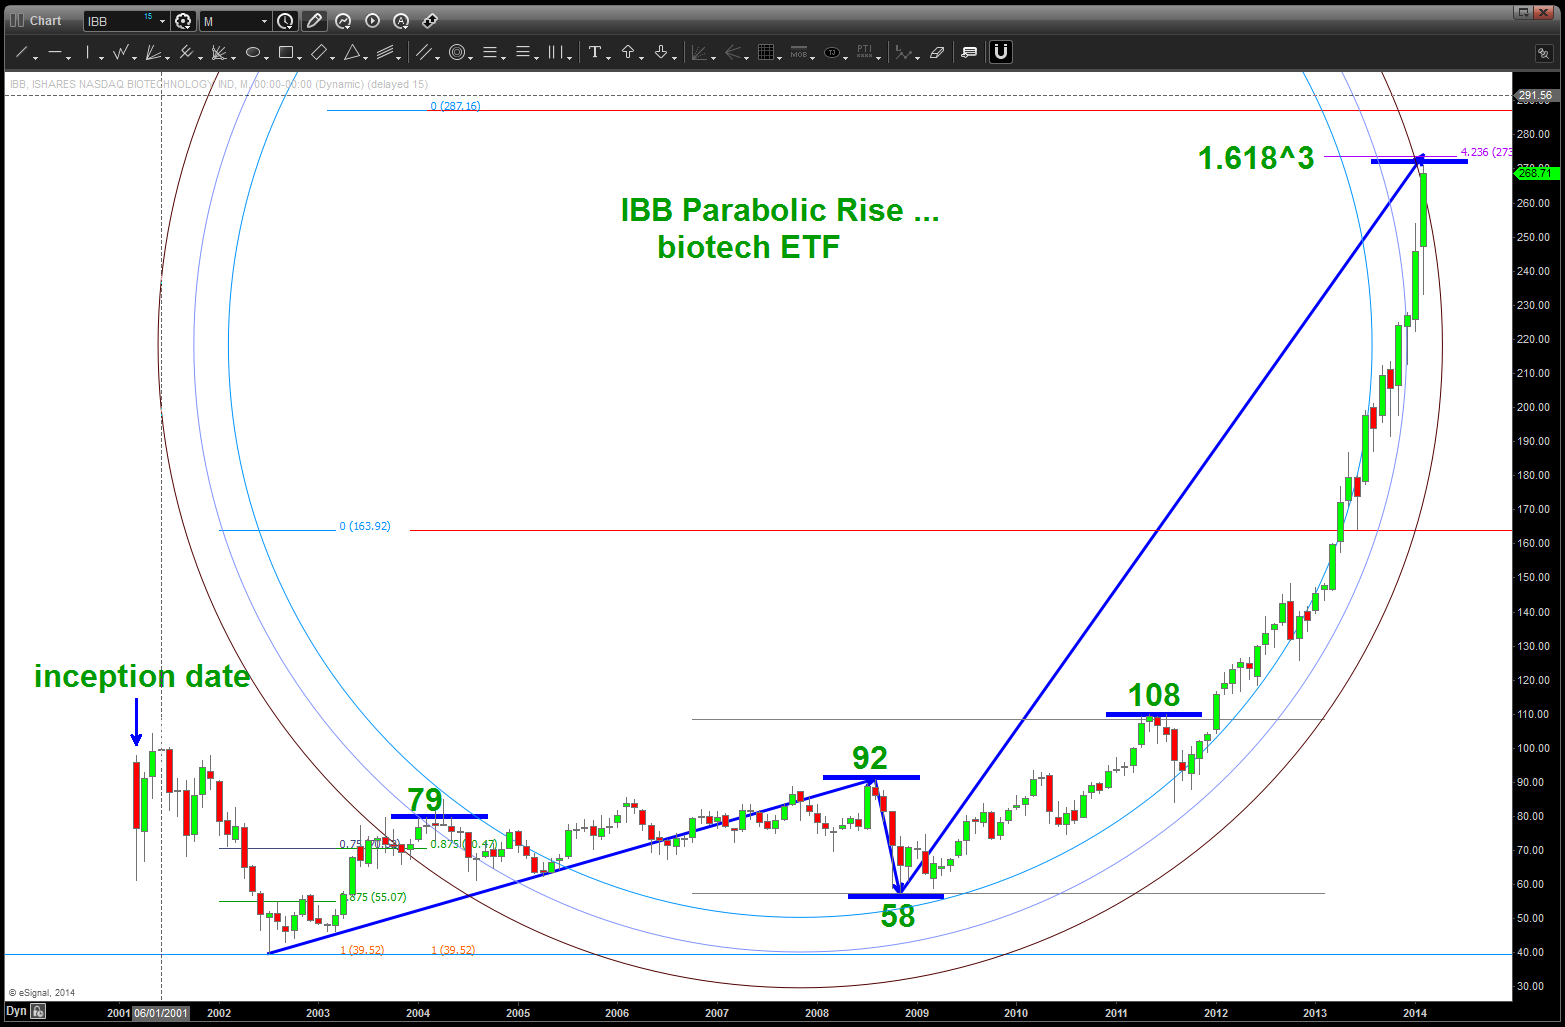
08/02/2014 – IBB has completed a PERFECT buy (price and time equality) PATTERN and believe the result will, more than likely, give us a good flavor for the rest of the equity market in general. Why? Well, this was a PARABOLIC move and if it keeps going then the “overall” mindset of the equity market might fall in line. Might or might not … anyway, IF you are long THEN the level 246 should be on your mind. If we close below on a daily basis would recommend looking at this position long and hard. IF the pattern works THEN risk is anything below 246. Watch this …
I was asked to take a look at IBB again and decided to re-post the below. Look folks, as much as the below is a work of art I’ve also been wrong on the patterns. it’s all probability and the patterns are always CORRECT? Why, because they LET YOU KNOW WHERE YOU ARE WRONG! And, when you become an advanced pattern recognition trader, IF (the big if) you execute correctly THEN you know that you’ve done everything you can do to manage risk and your not SURPRISED or HAPPY when one works or SURPRISE and SAD when one doesn’t. The PATTERN will work or it wont …off my soap box.
Anyway, take a peak at the below and try to follow me … let me know if you have any questions. Sir Issac Newton is still correct about this thing called gravity.
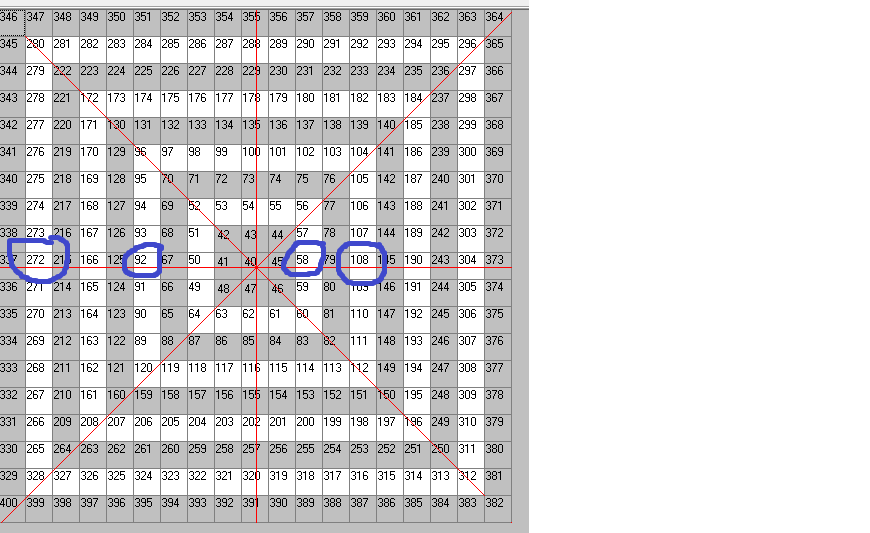
Everything you learned in elementary school geometry is all you need …
Rock on, ok?
Bart
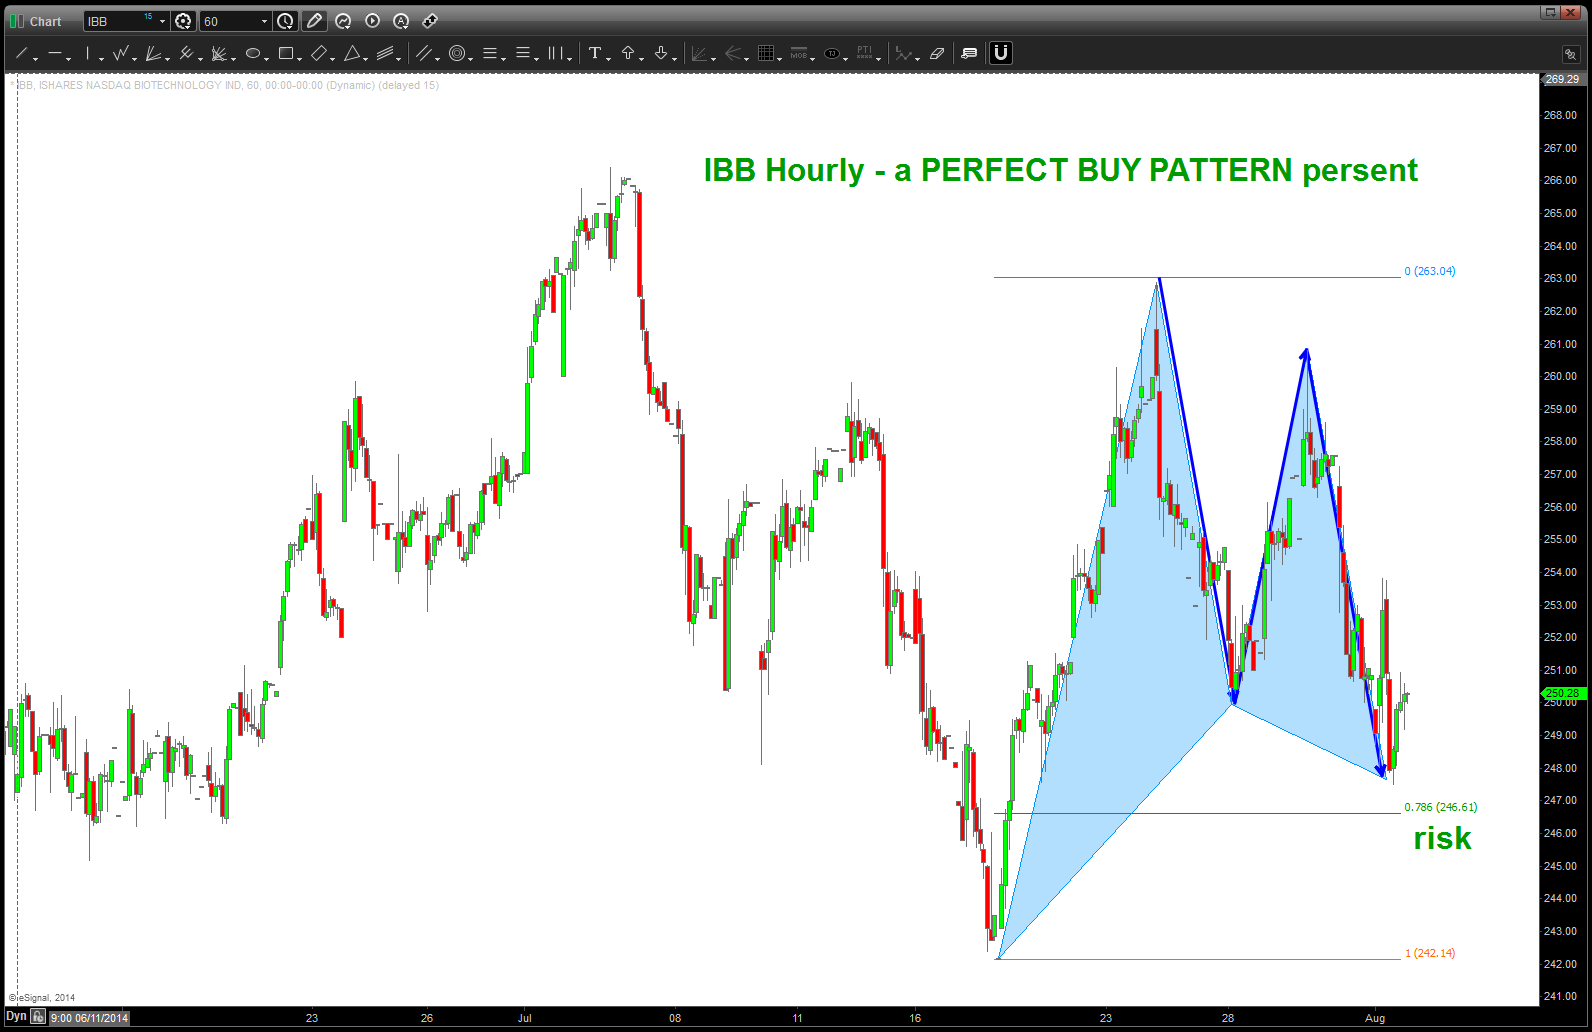
they don’t come any nicer than this BUY pattern on IBB
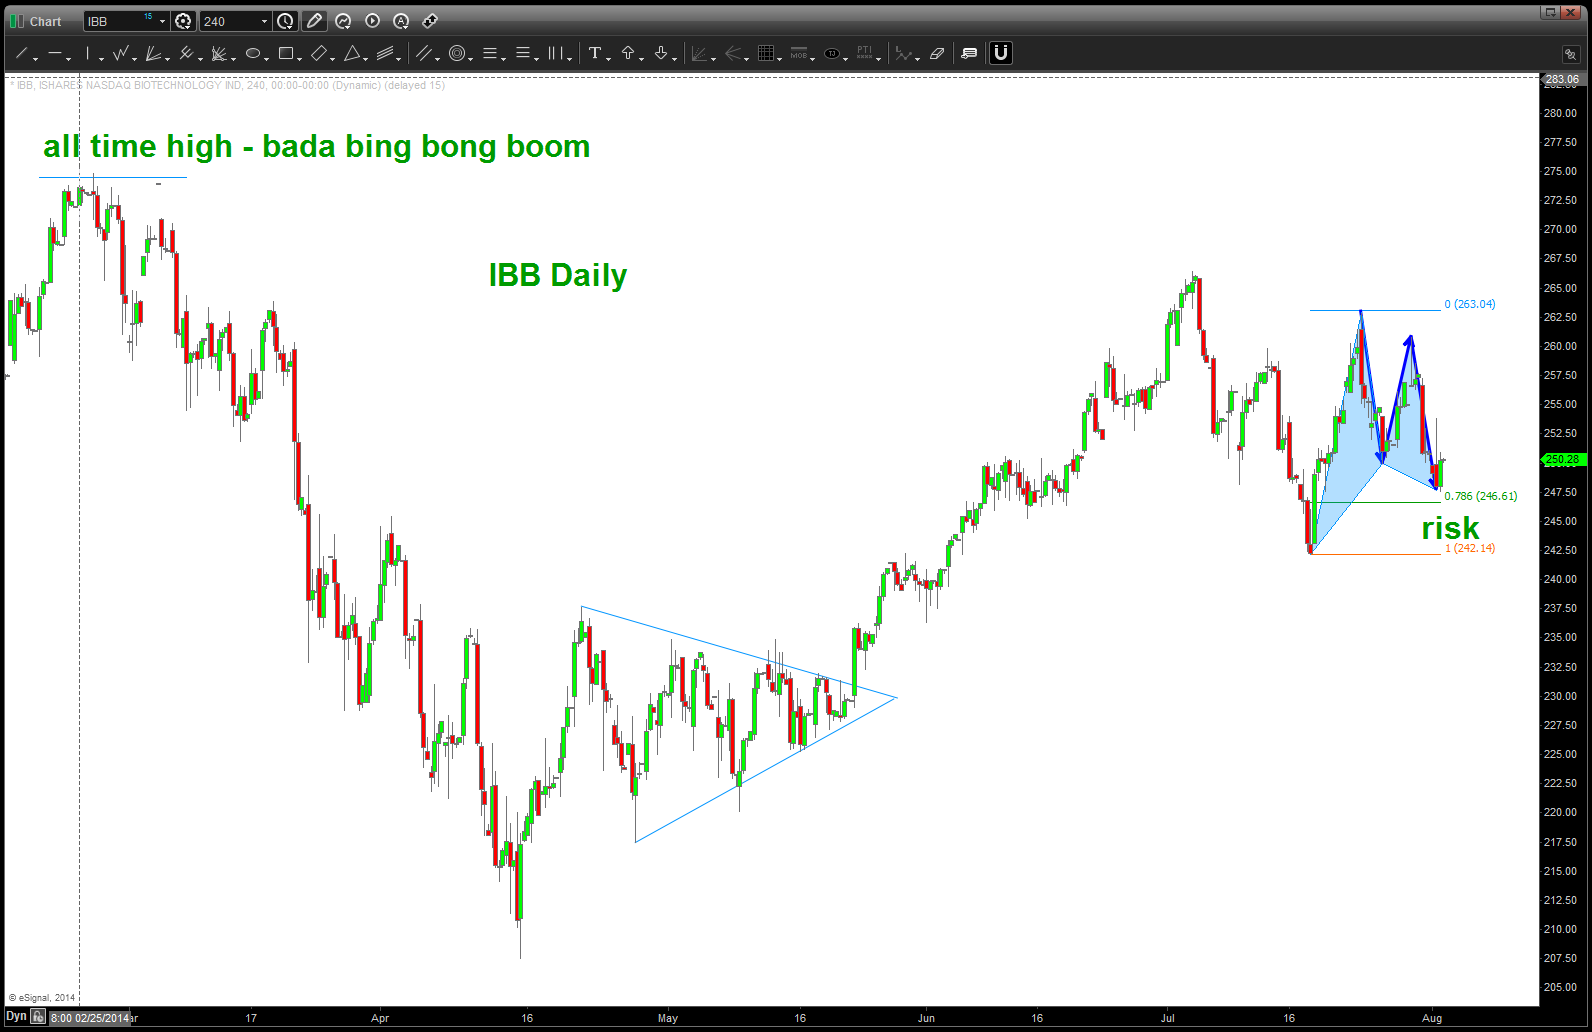
IBB Daily showing 1) all time high and 2) the BUY pattern present
CLIFF NOTES (my wife says I’m to verbose and geeky (she’s correct) so she always says “just give me the cliff notes”)
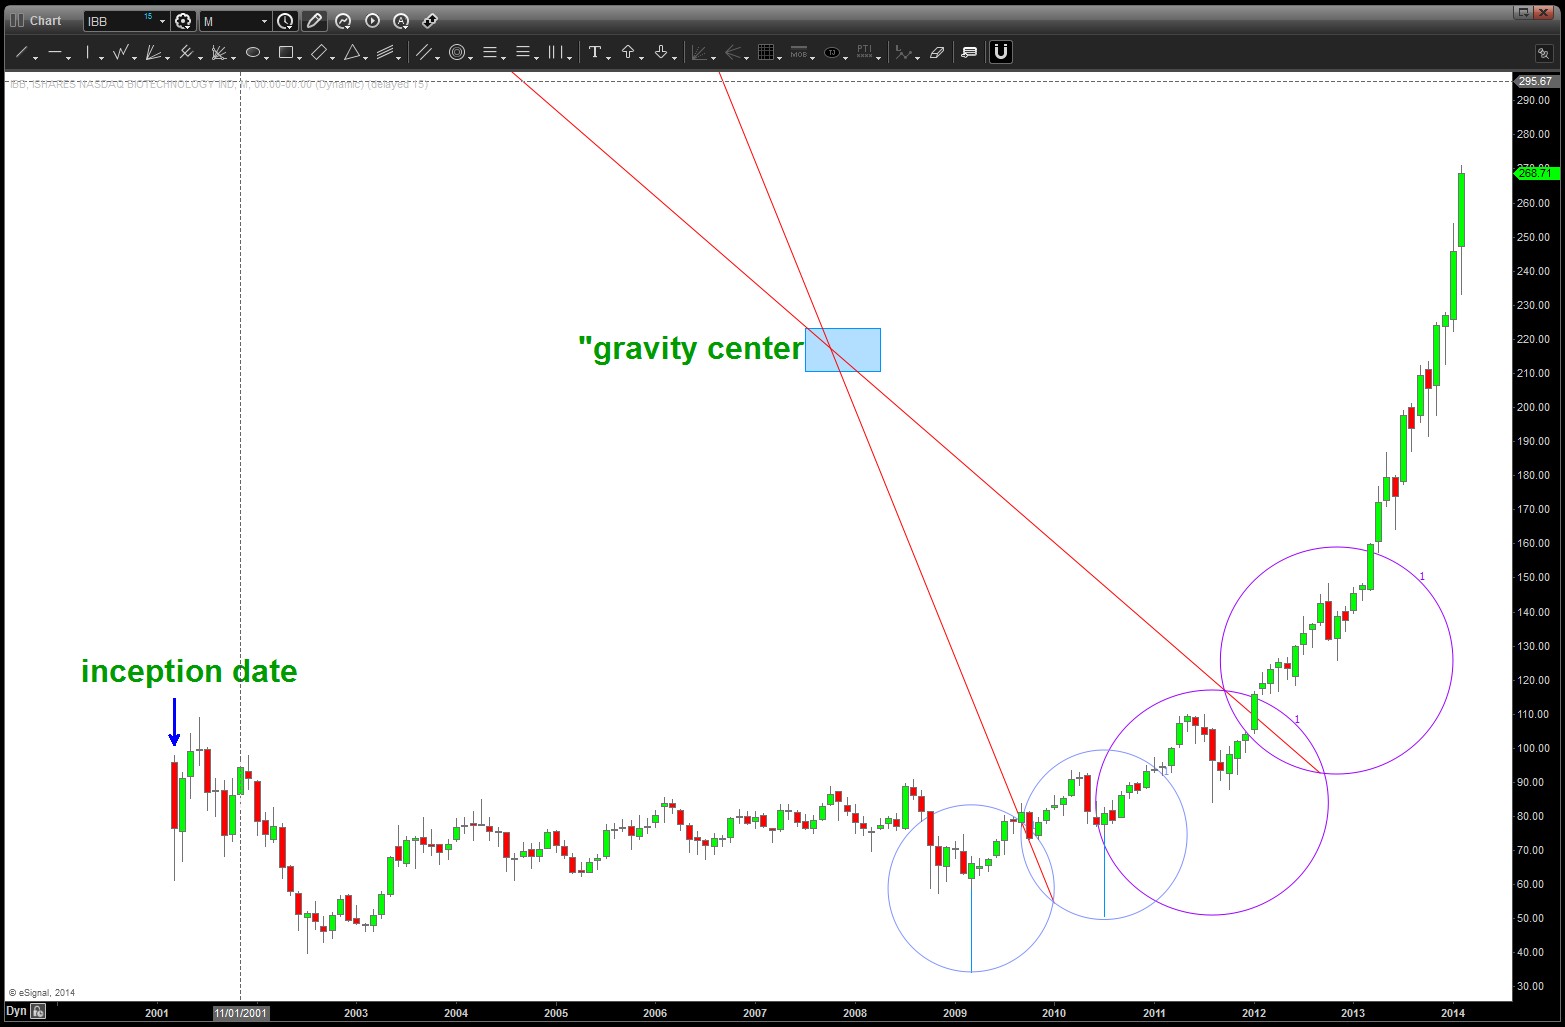
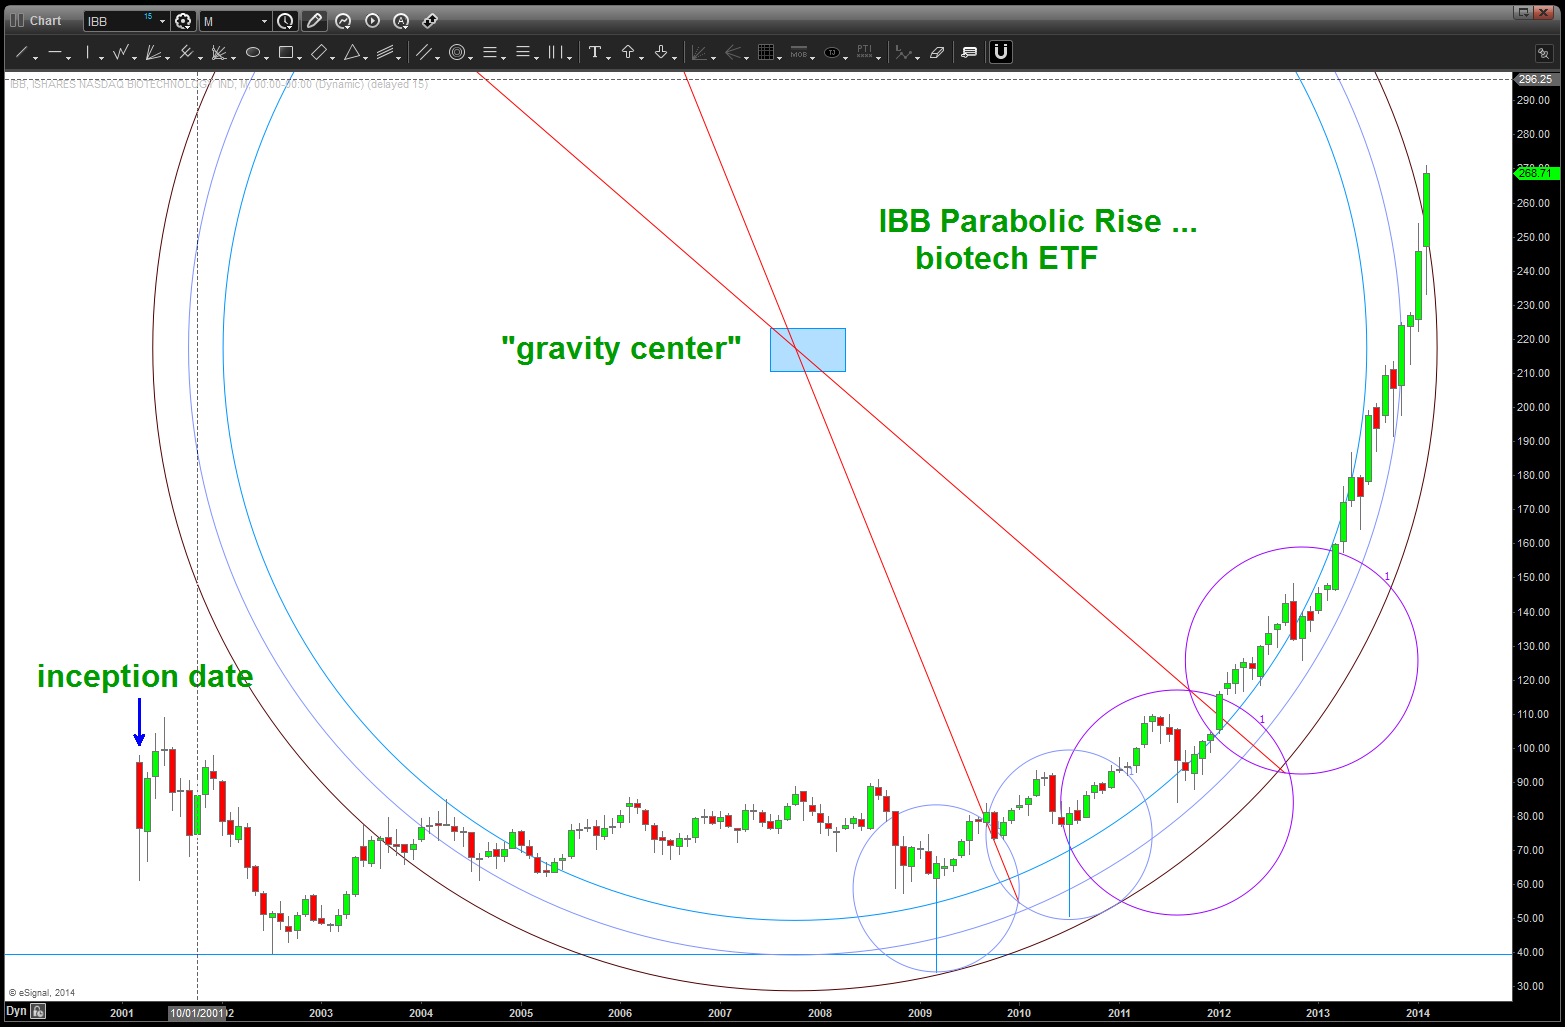
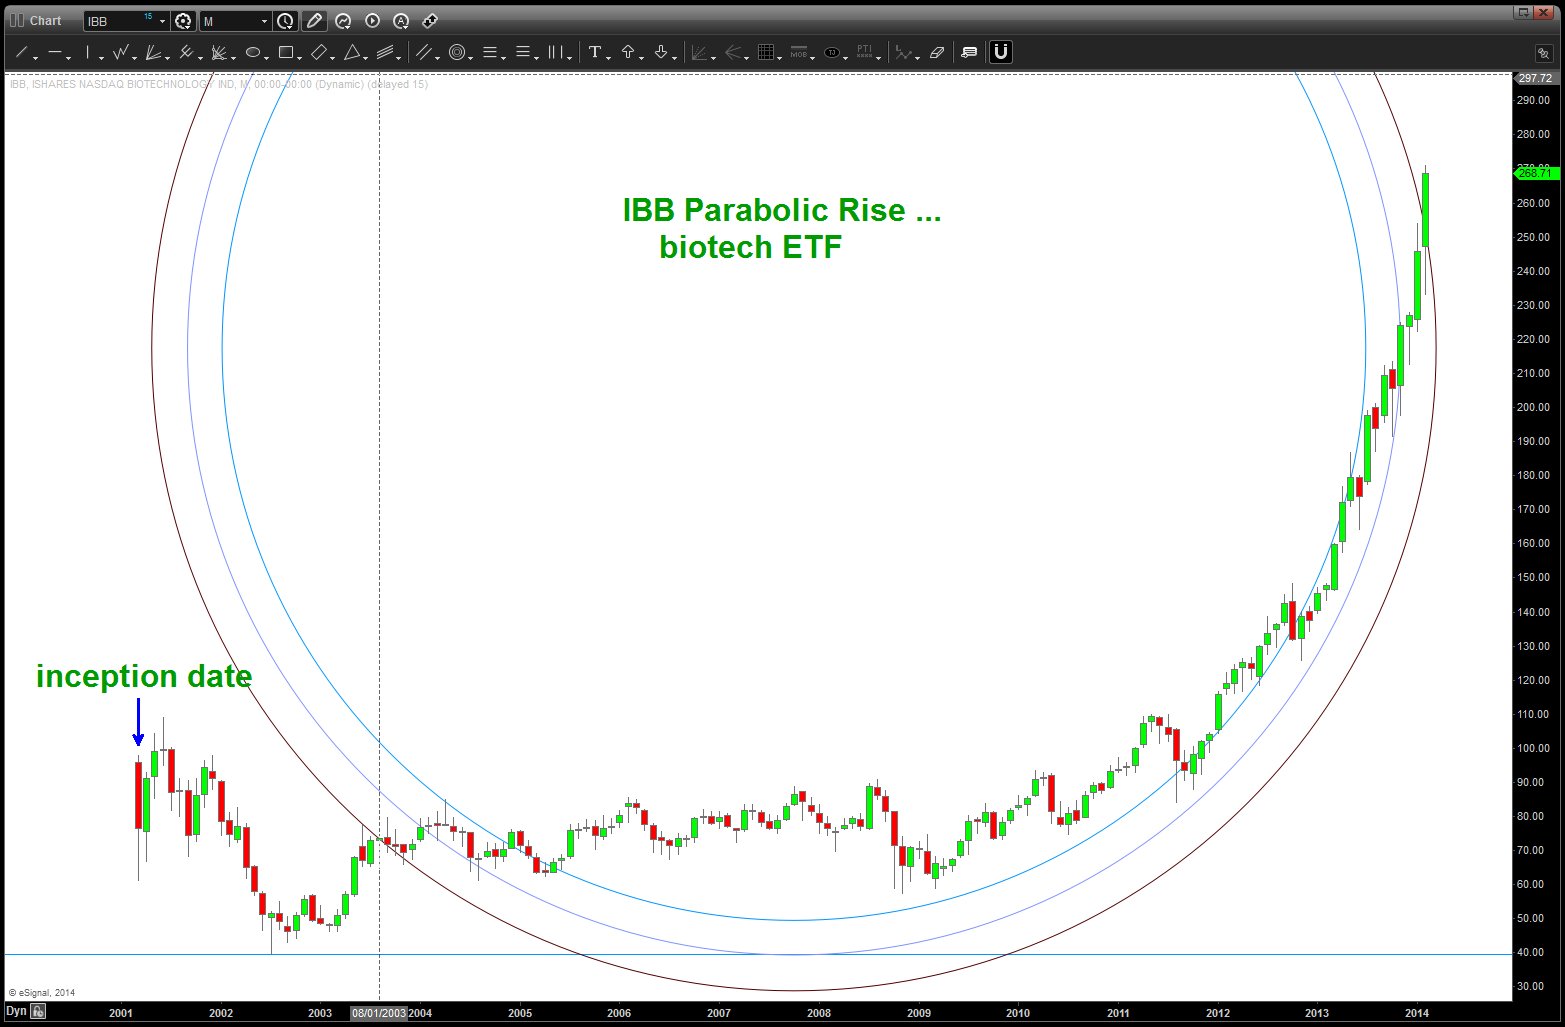
- IBB Biotech ETF is in the parabolic stage. Very tough to develop targets in this type of environment (straight up) but an attempt is made.
- At the first sign of a daily signal reversal candle would look at closing a lot or all of any long position // take a crack at a short – it’s going to be a marvelous ride down
DETAILS:
if you click on the link below, you’ll see “real time” the EXACT high on APPLE using simple geometry we learned in elementary school:
per the title of this post, the basic effect of gravity has yet to be proven wrong. what goes up WILL come down unless we blow thru the earths atmosphere and cruise along in space w/ Sandra Bullock. And, why not? the stock market is NEVER going to come down and it’s different this time ….
but alas, someone has to try … the charts below are an attempt to 1)call for caution w/ regards to this parabolic rise and 2) demonstrate some techniques to obtain price targets. Full disclosure – don’t be impressed w/ AAPL. (see my GOOG posts) It’s simply PATTERNS and some work and some don’t. Most of the time they do …it’s an edge, I believe in that edge and the rest is history. ENJOY …
sure looks like the NASDAQ in 2000 … parabolic UP and then down hard …
EURO Continued
Posted on August 2, 2014 Leave a Comment
CLIFF NOTES: per our last post, the EURO found support in the area we were watching. (note – it went a little below so what I did is use the equal octave scale of music note A – 1.68179 extension and .68179 projection for the “exact” level where the pivot took place.) Now, believe this move does have lower to go so we’ll go to a lower time frame and look to see where the pullback should/likely end. Recommend a short again ….probably around Tuesday/Wed
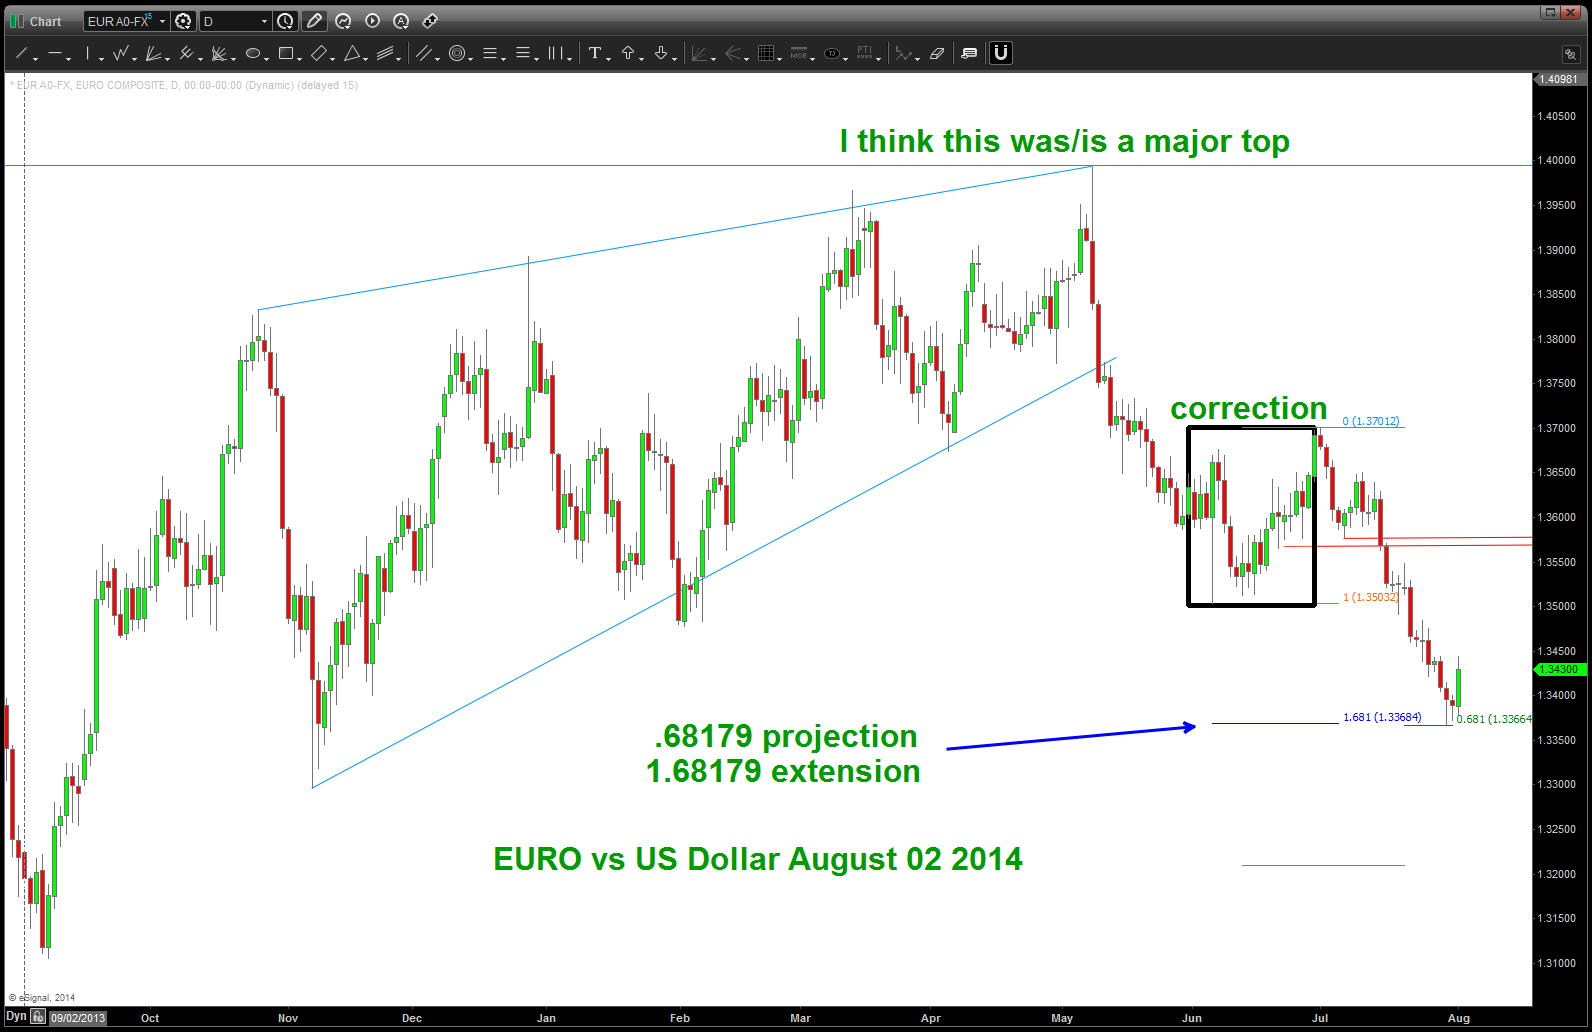
EUR vs USD Daily
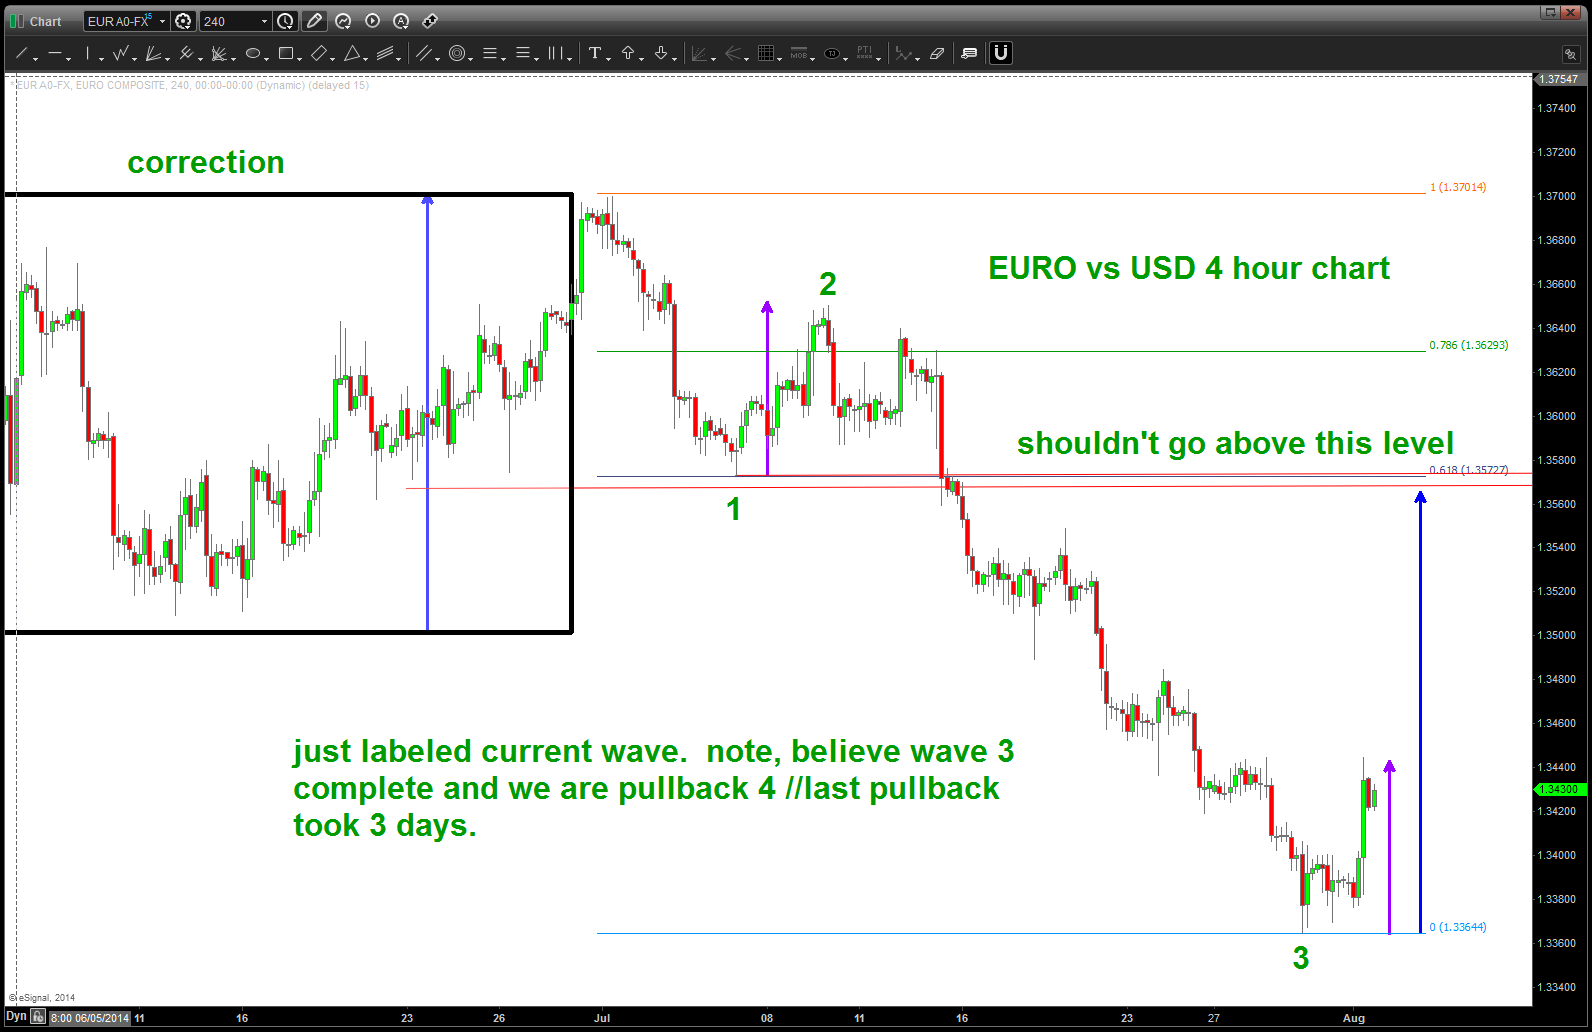
will wait to project potential corrective height after Sun/Monday … believe we do have time for the pullback pattern to develop.
USD vs JPY redux
Posted on July 30, 2014 Leave a Comment
folks, I’ll say it once, I’ll say it again … PATTERNS PATTERNS PATTERNS. Check out this post on the JPY and then compare everything that has happened … they help you manage risk and therefore they work:
so, where are we now? let’s take a peak. first chart is actually showing another pattern complete and the BUY USD vs JPY that we posted on June 27, 2014. Highlighted areas are the ones to watch.
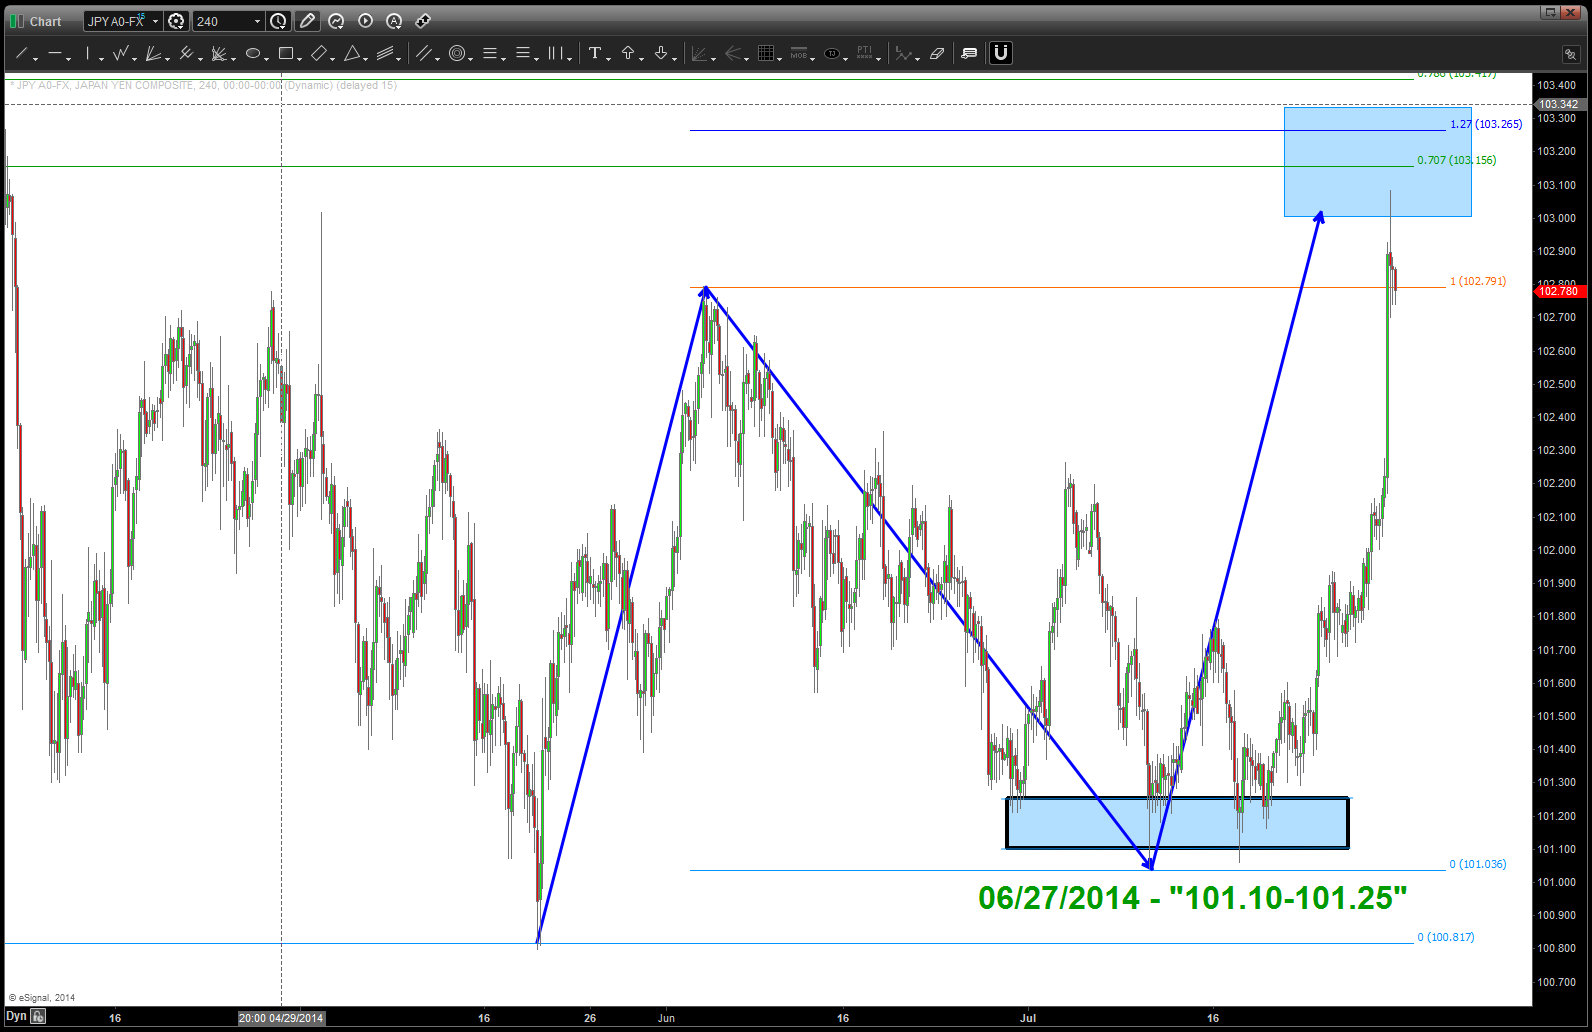
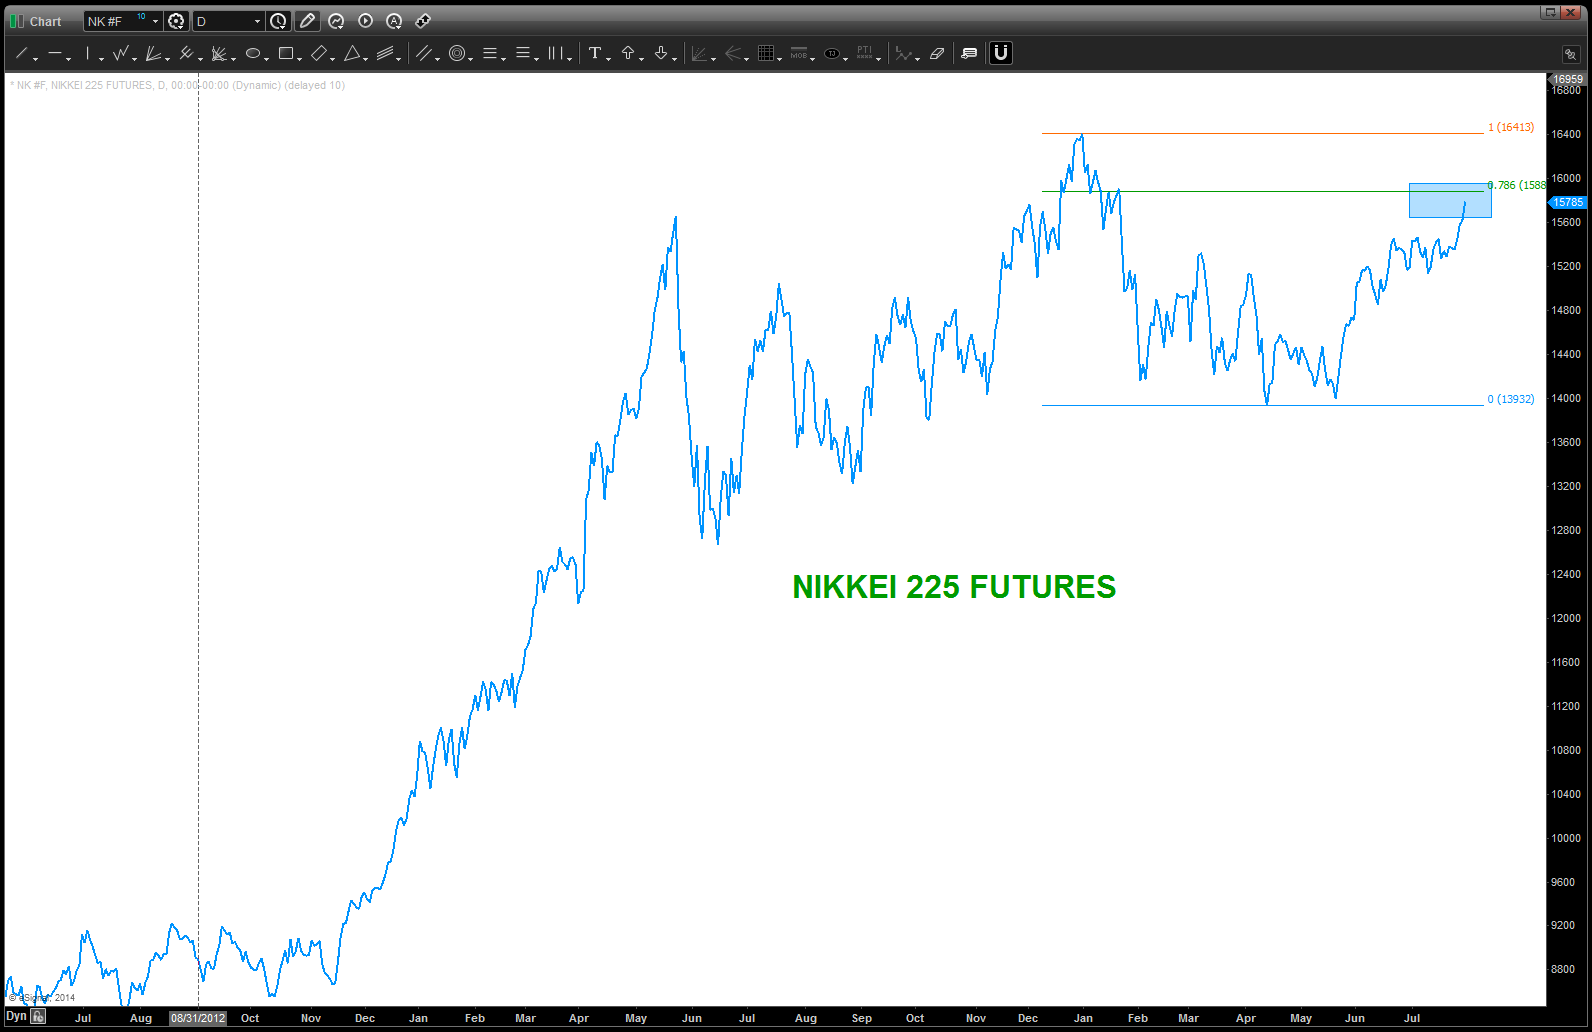
now, take a peak and we have completed (or a little higher) another pattern on the IMPORTANT USD vs JPY YEN cross. also, note the the N225 futures are up at the .786.
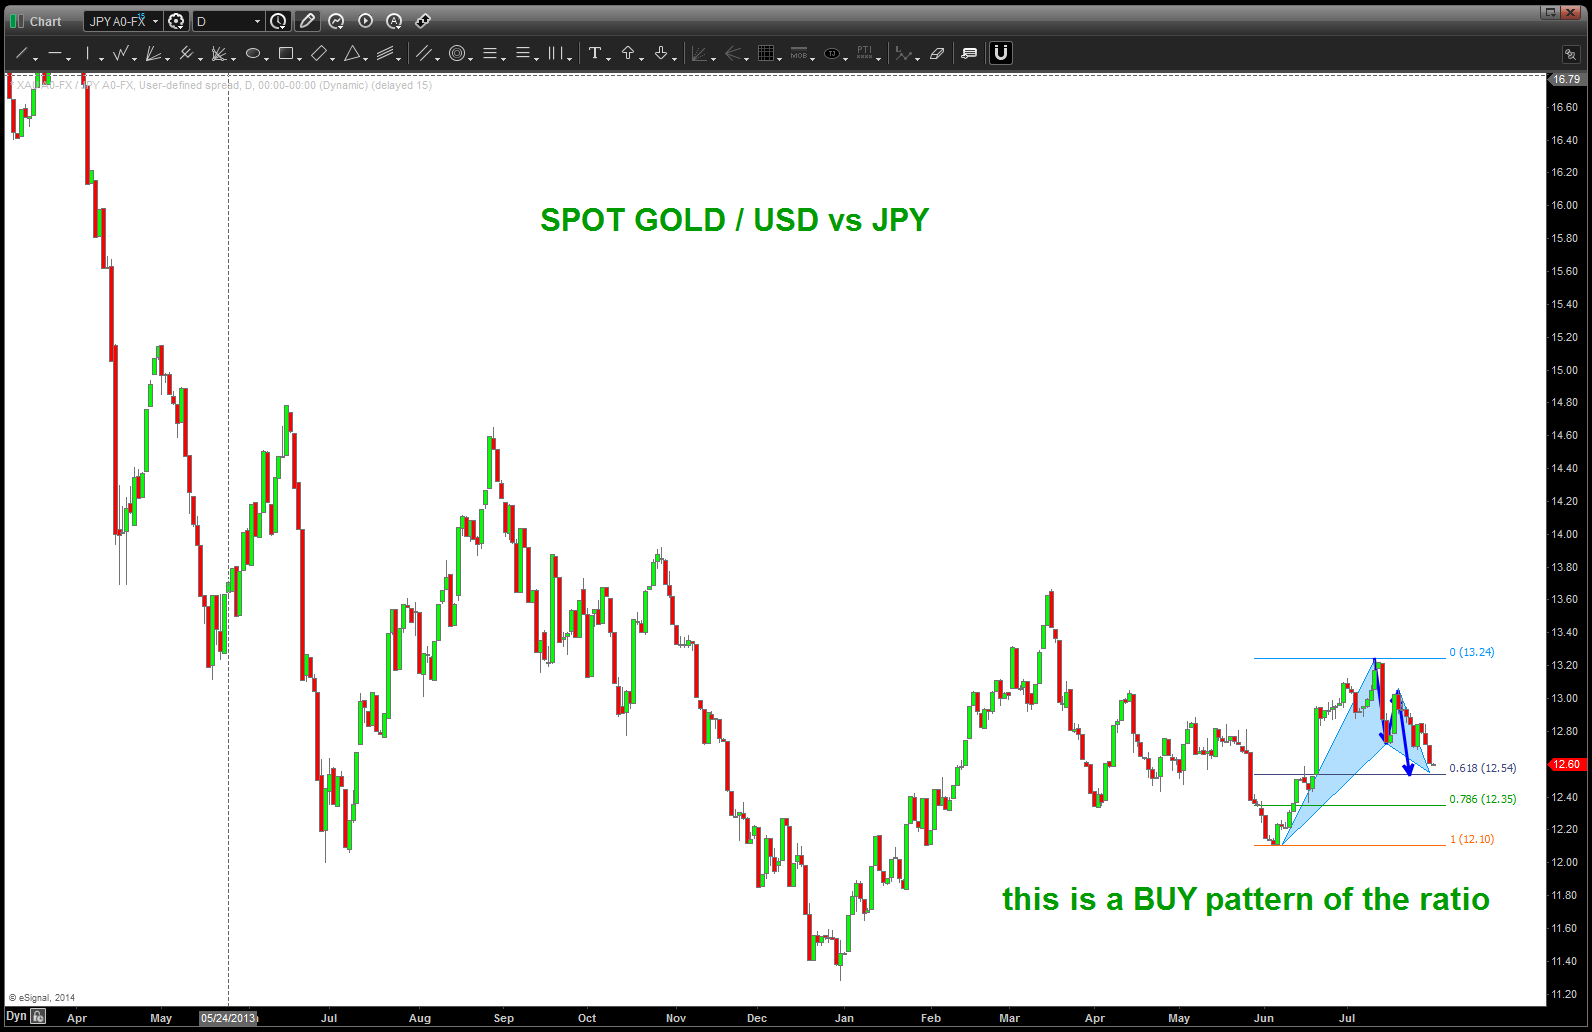
now time to go to the relative strength chart (GOLD / USD vs JPY).
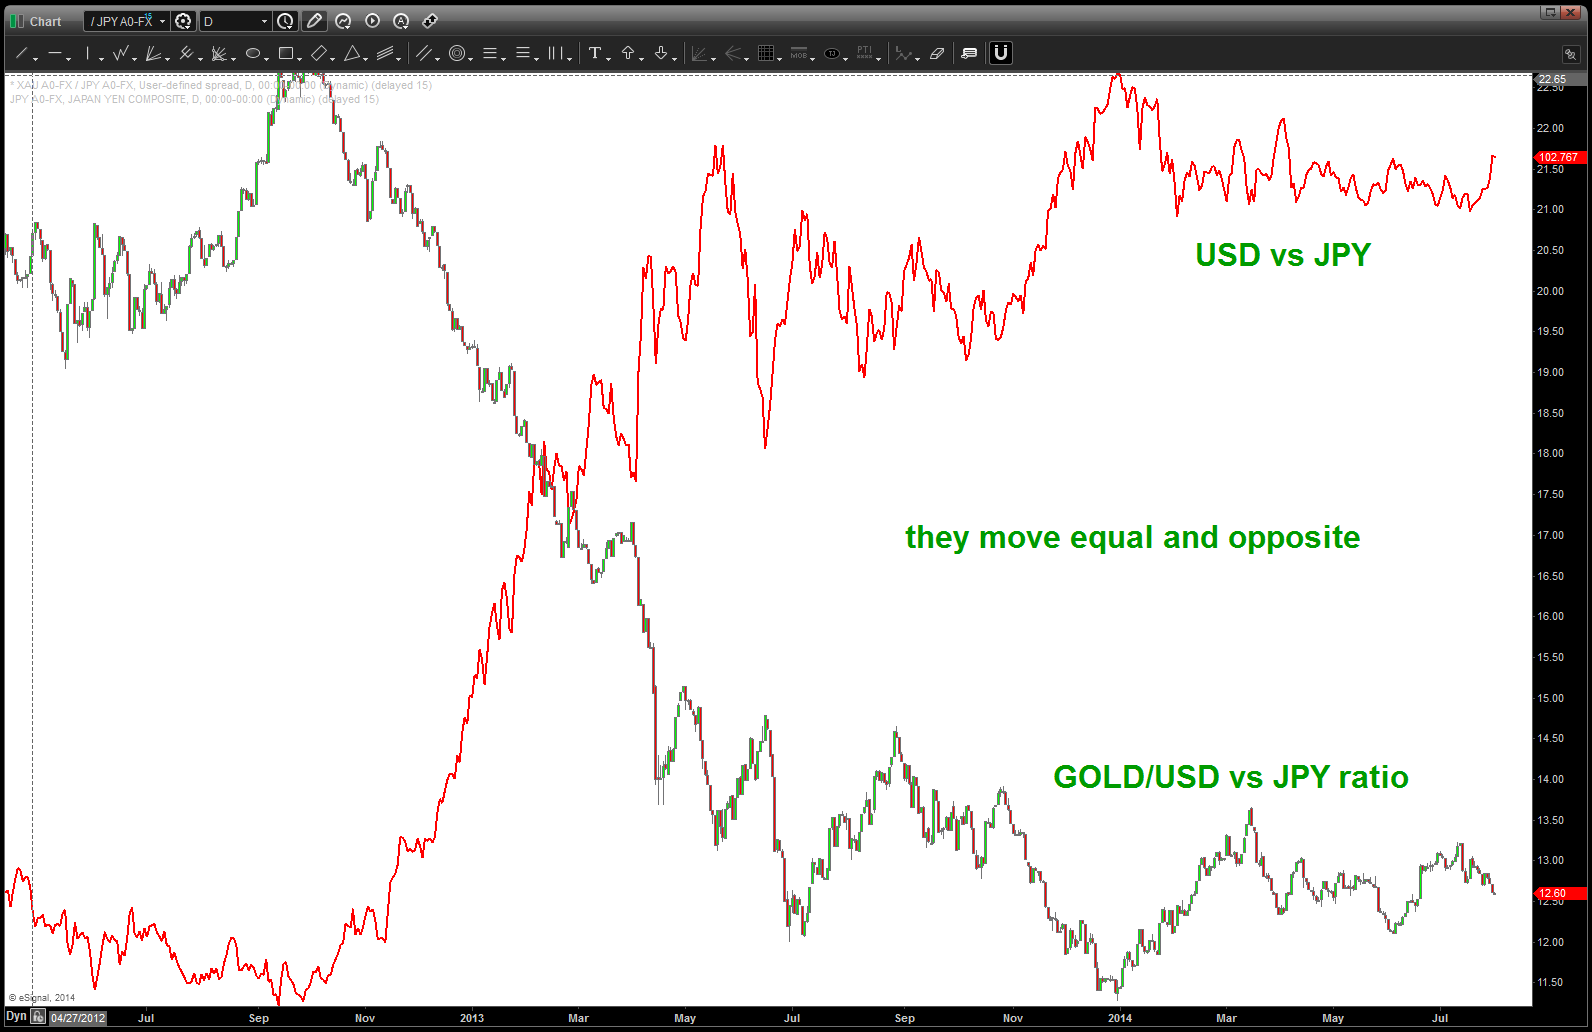
GOLD/USD vs JPY with USD vs JPY overlaid (red line) NOTE HOW THEY ARE EQUAL AND OPPOSITE!
what does a BUY pattern mean w/ this ratio? take note – the equal and opposite inflection occurs w/ regards to the USD vs JPY cross. So, our thesis is IF the BUY of the ratio holds THEN the SELL $$$ vs JPY patterns that are completing/have completed will cause the YEN to strengthen for another corrective leg. Additionally, this will foreshadow weakness in the N225.
see how that works …? Patiently wait for PATTERNS to form, work them into intermarket and ratio analysis and then pull the trigger when you feel like jumping into a 5 TRILLION dollar a day market w/ gorilla’s juggling dynamite from your simple and humble home office listening to Pink Floyd ….
Let’s complete the YEN circle of life ….
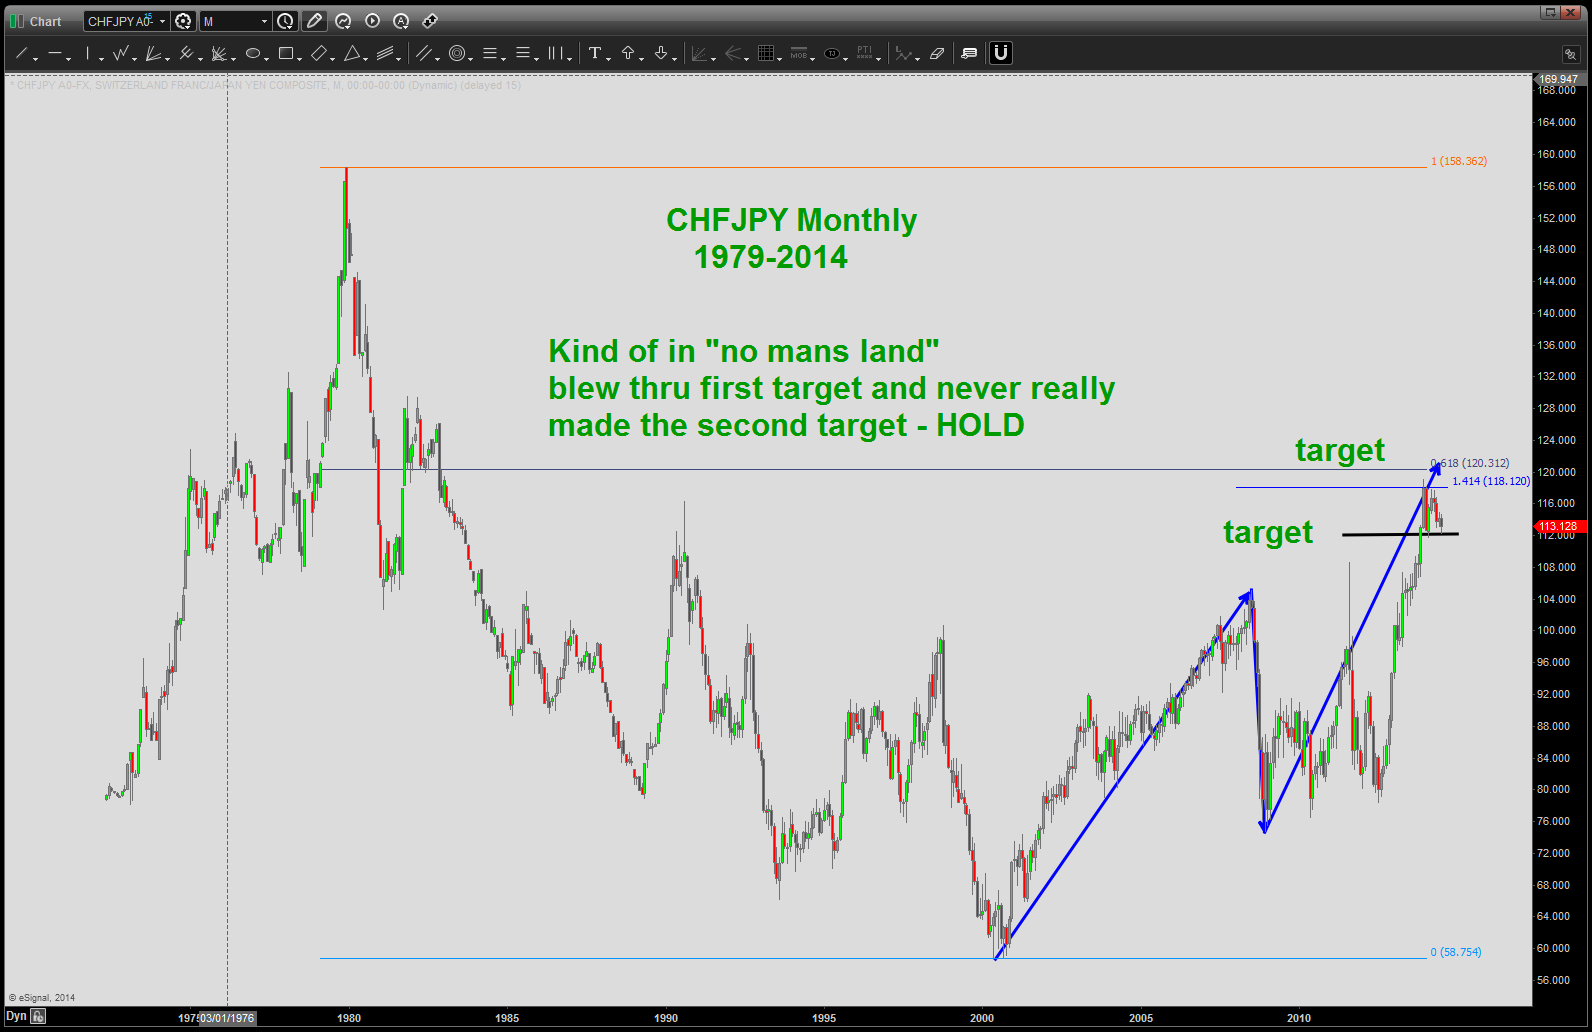
CHF vs JPY Monthly
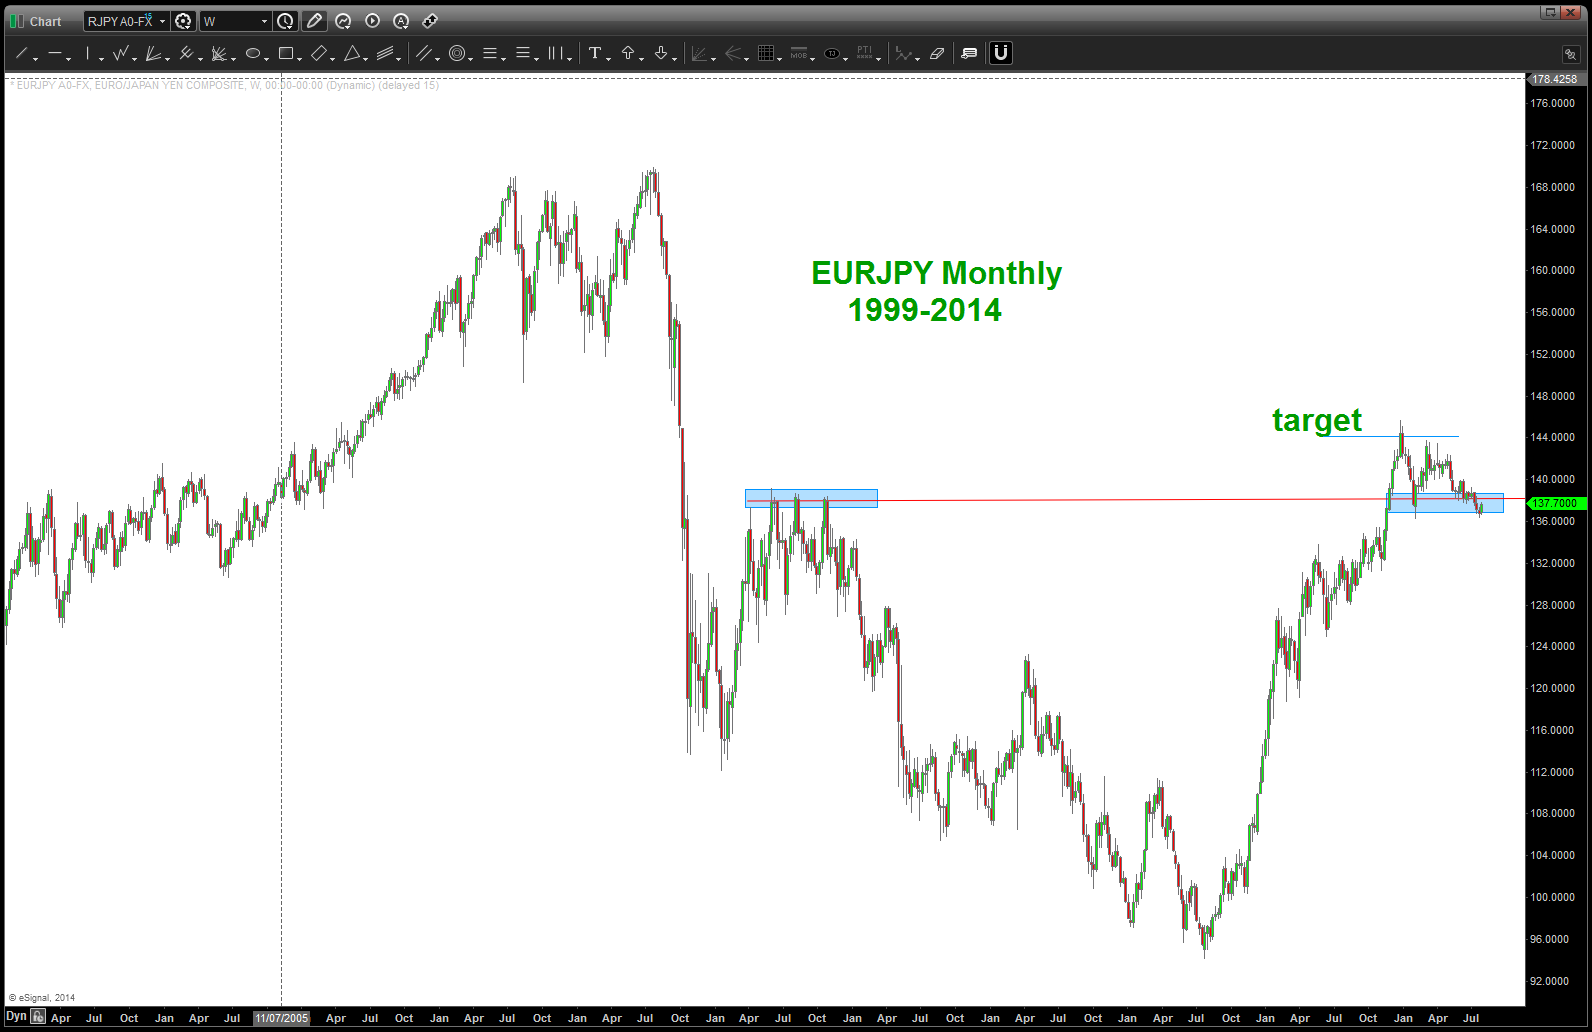
EURJPY Monthly
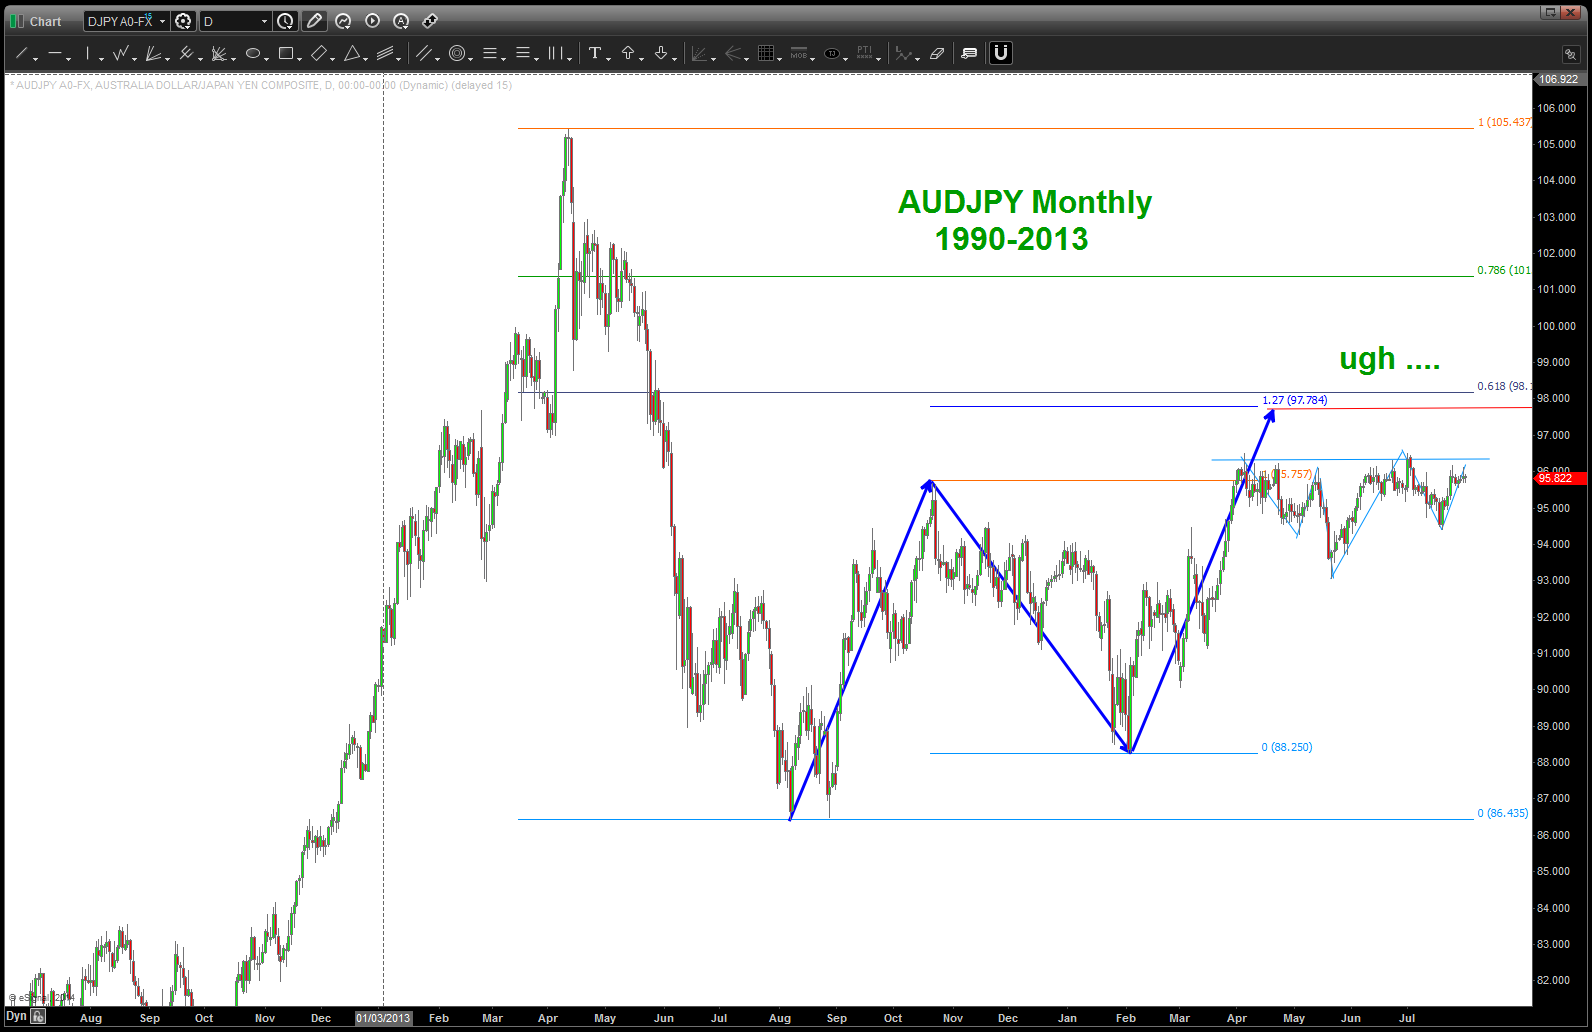
AUDJPY Monthly .. UGH
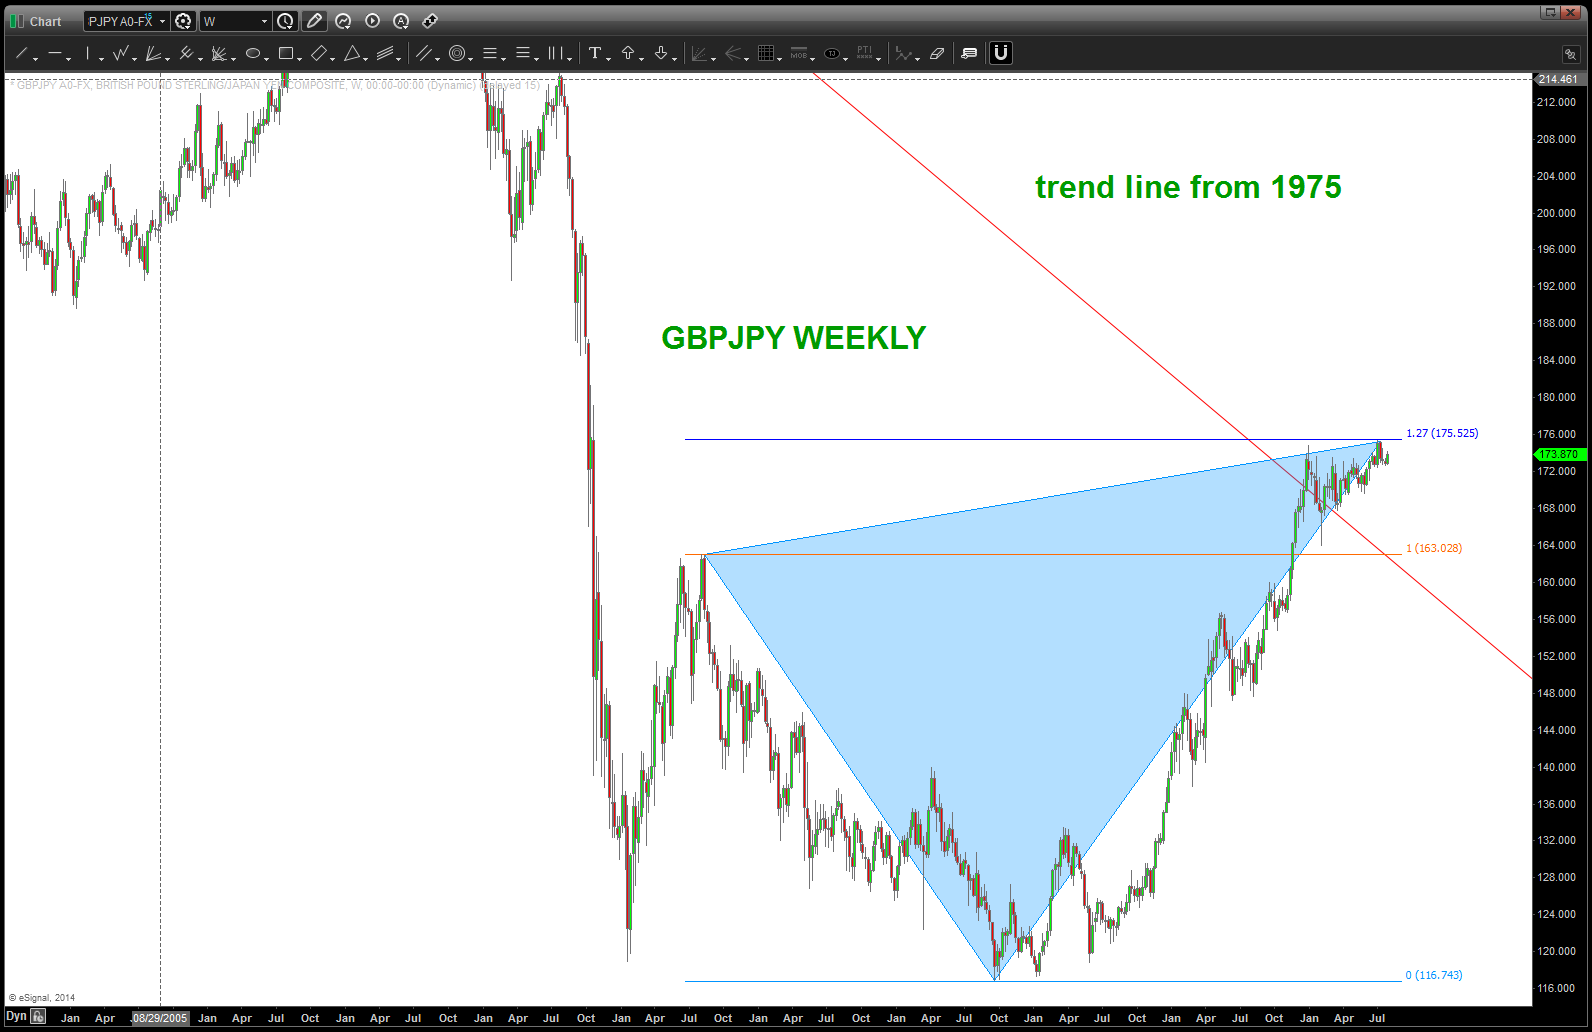
GBPJPY weekly
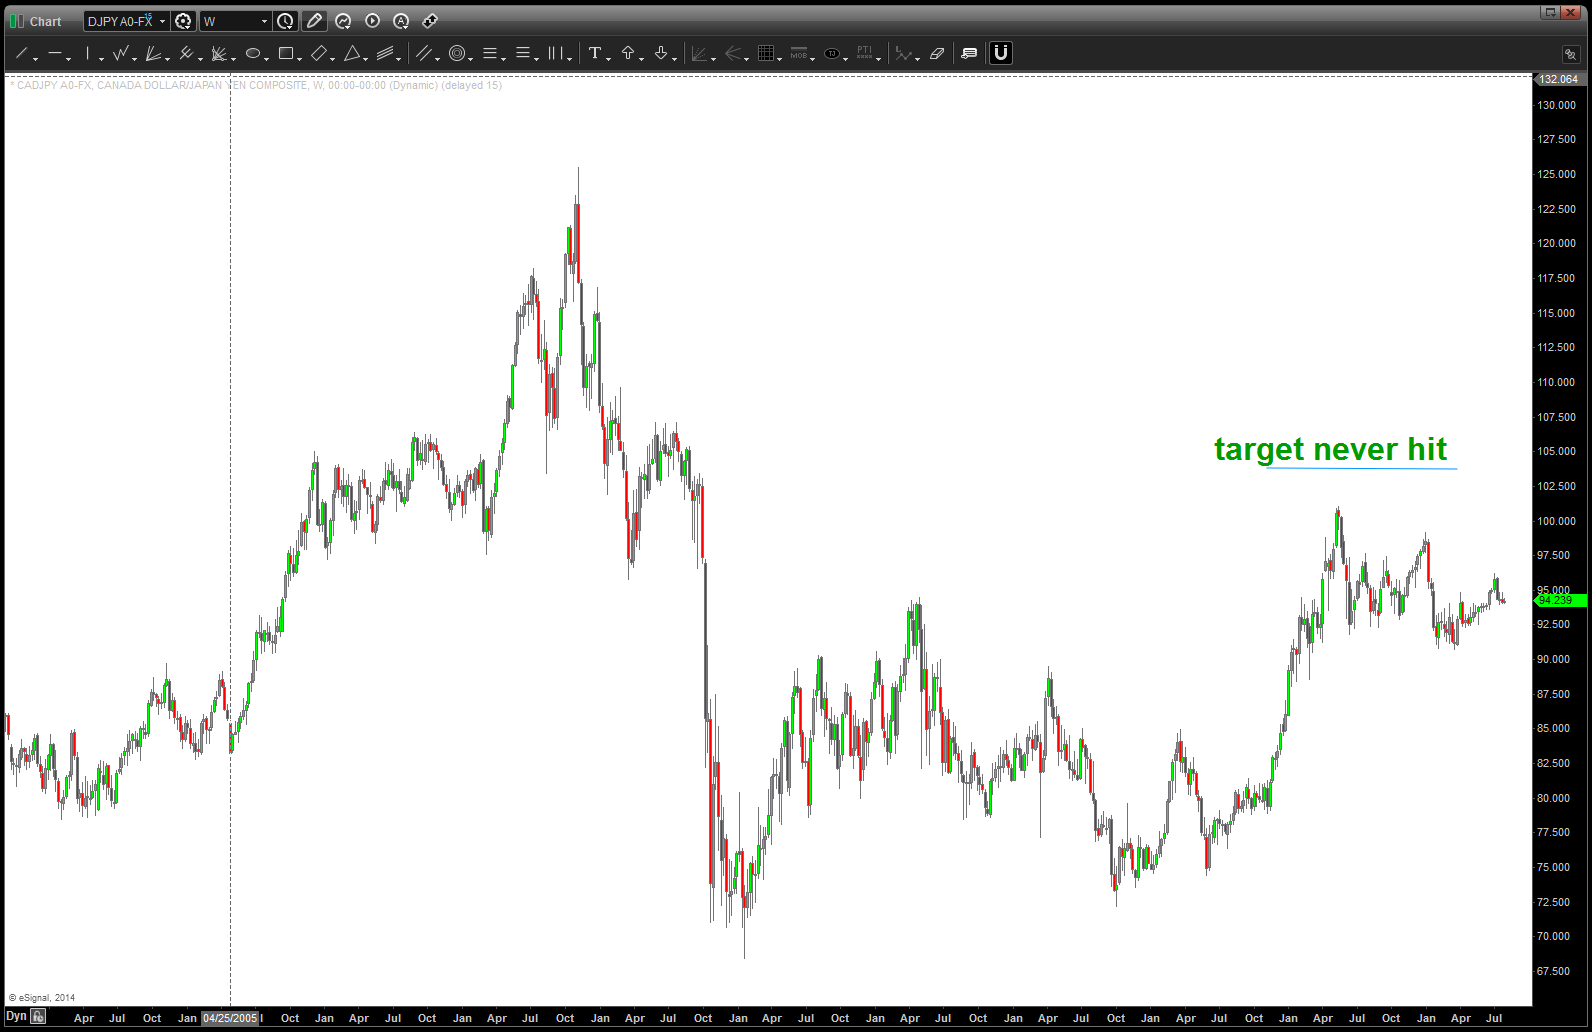
CADJPY Weekly
here’s the ETF for Japan … EWJ
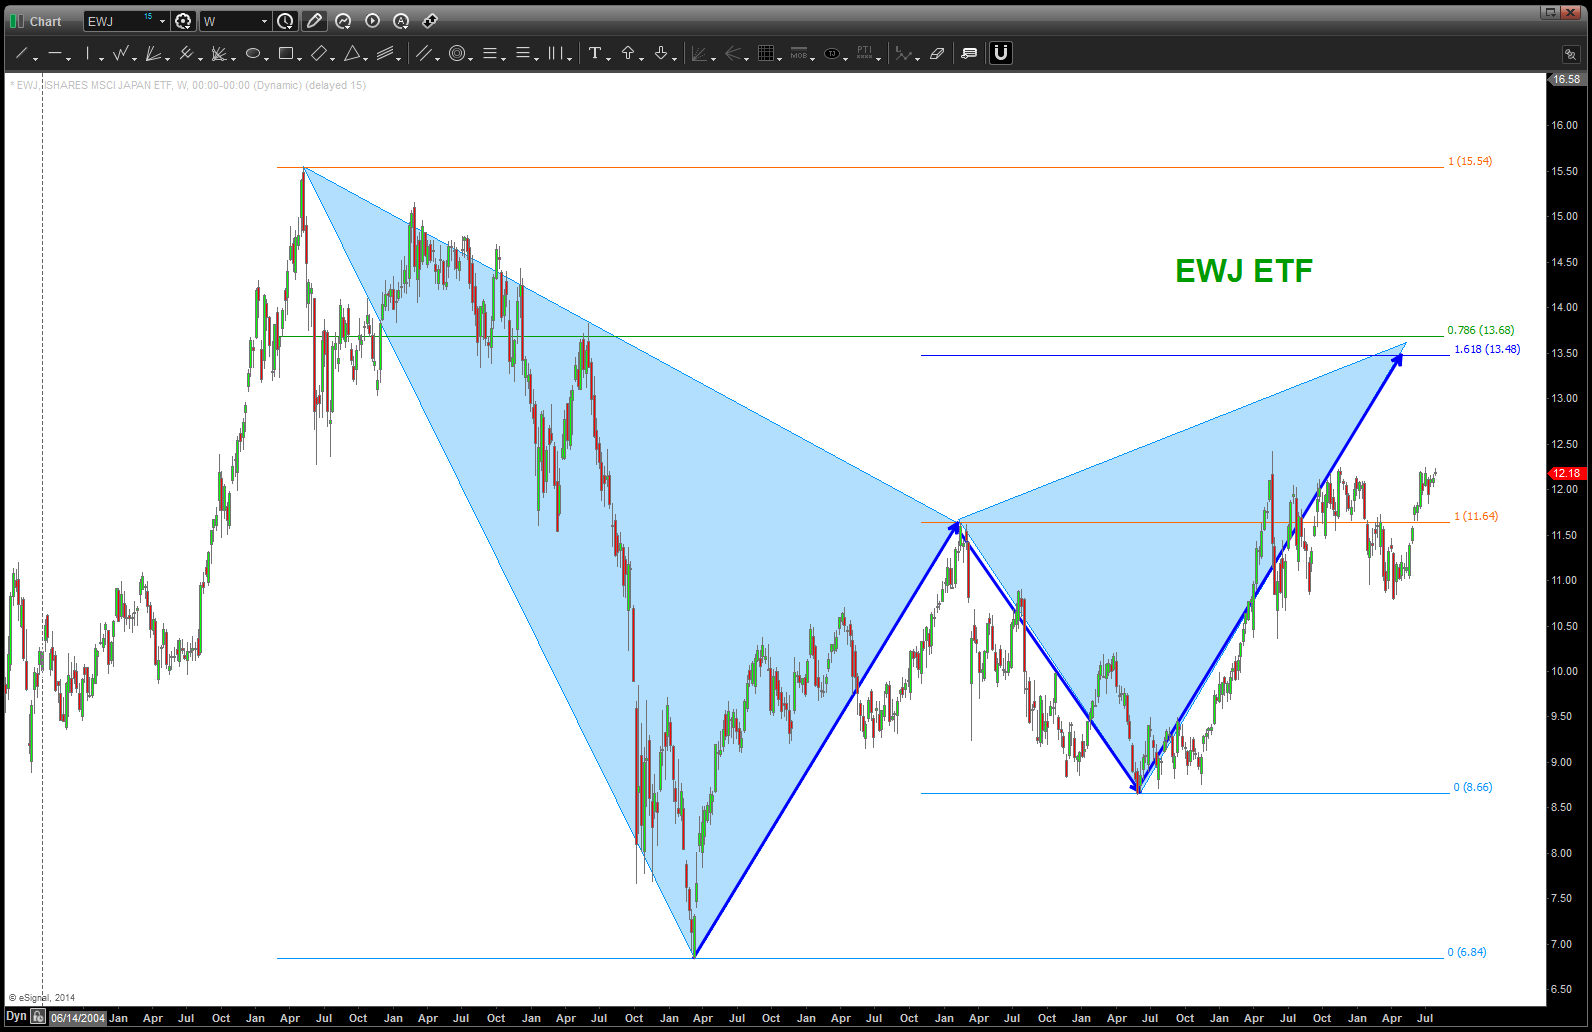
EWJ ETF
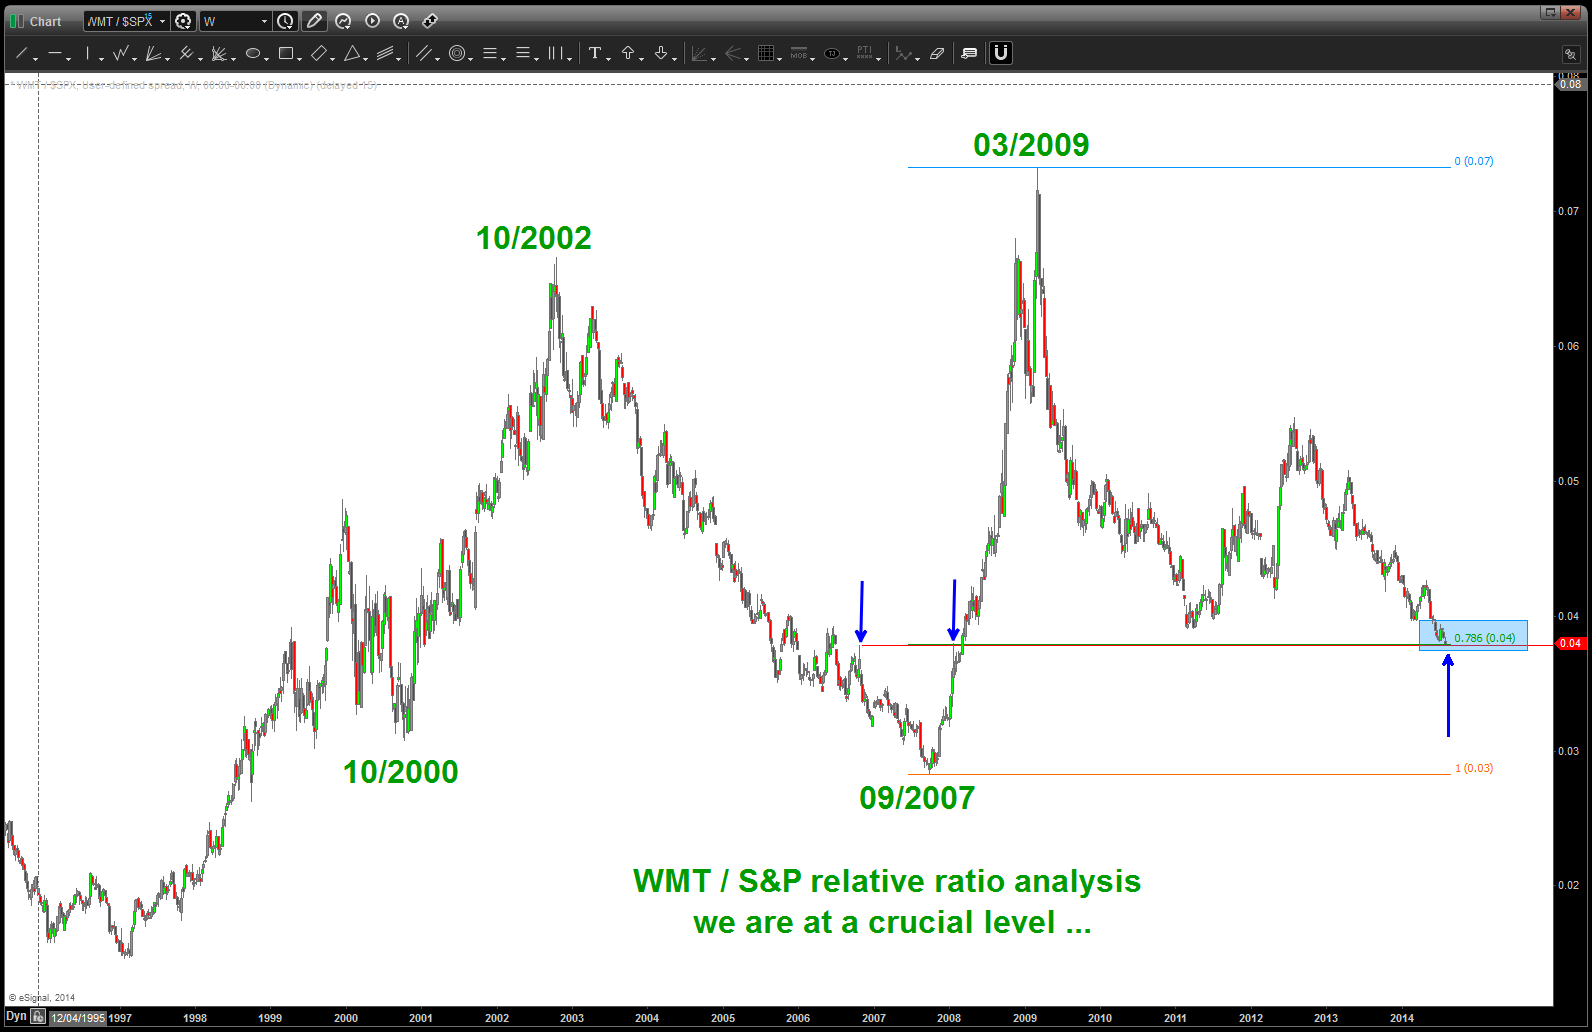
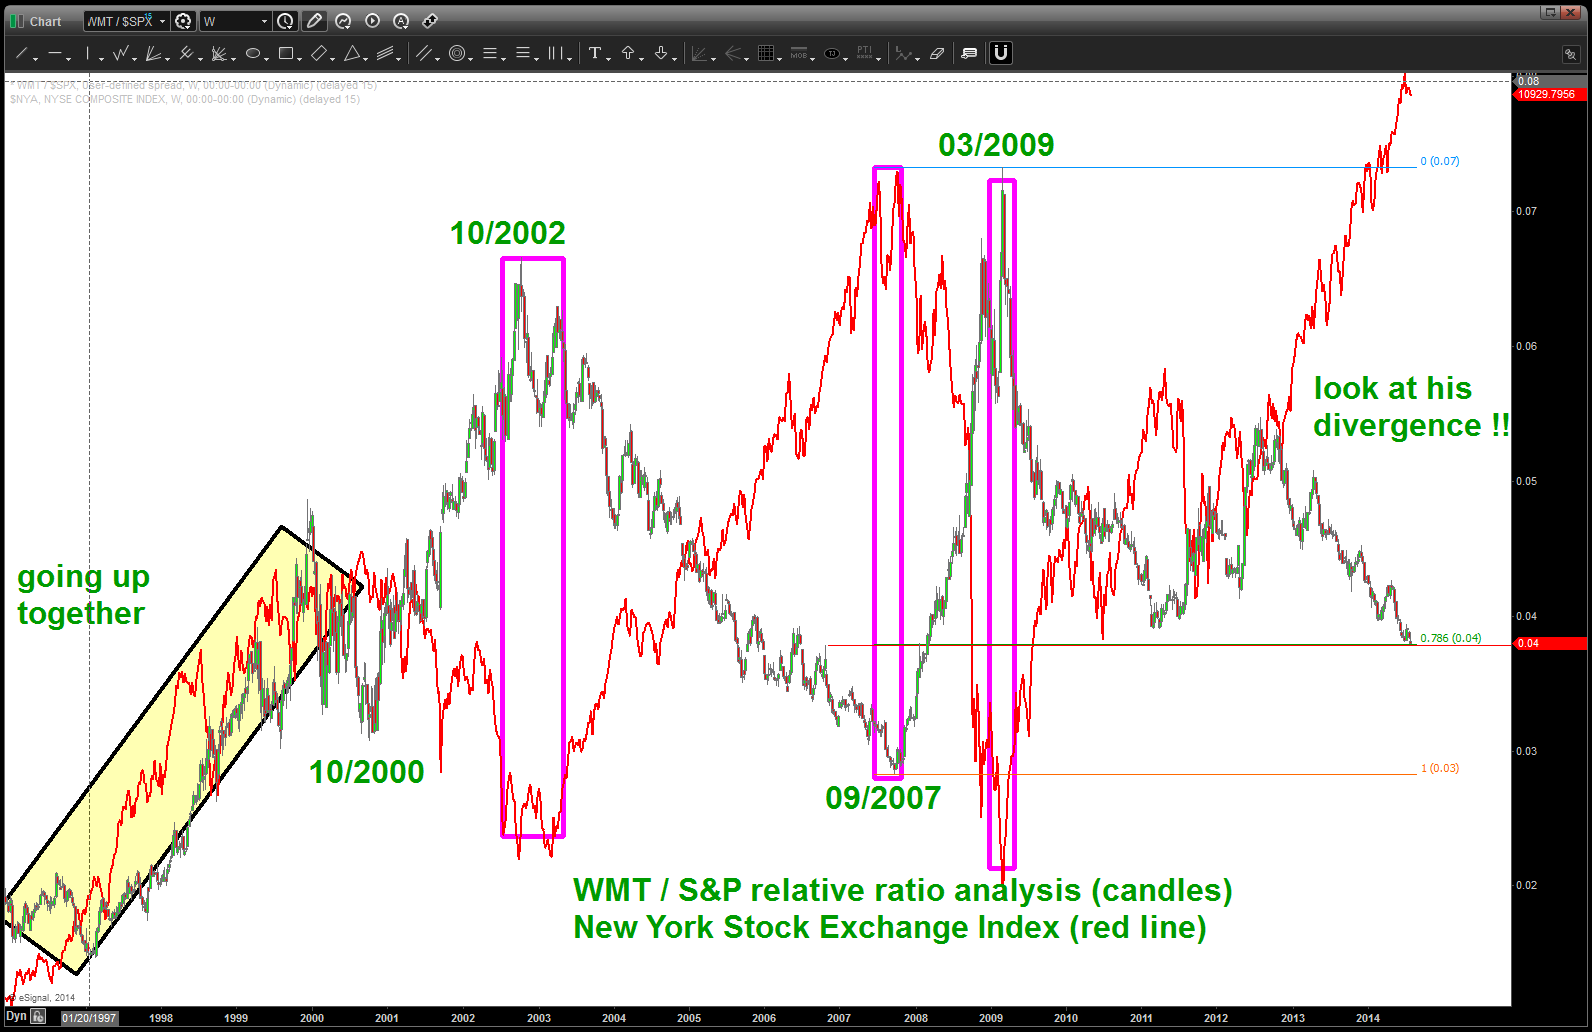
WMT / NYSE Index Ratio and the KEY support
Posted on July 30, 2014 Leave a Comment
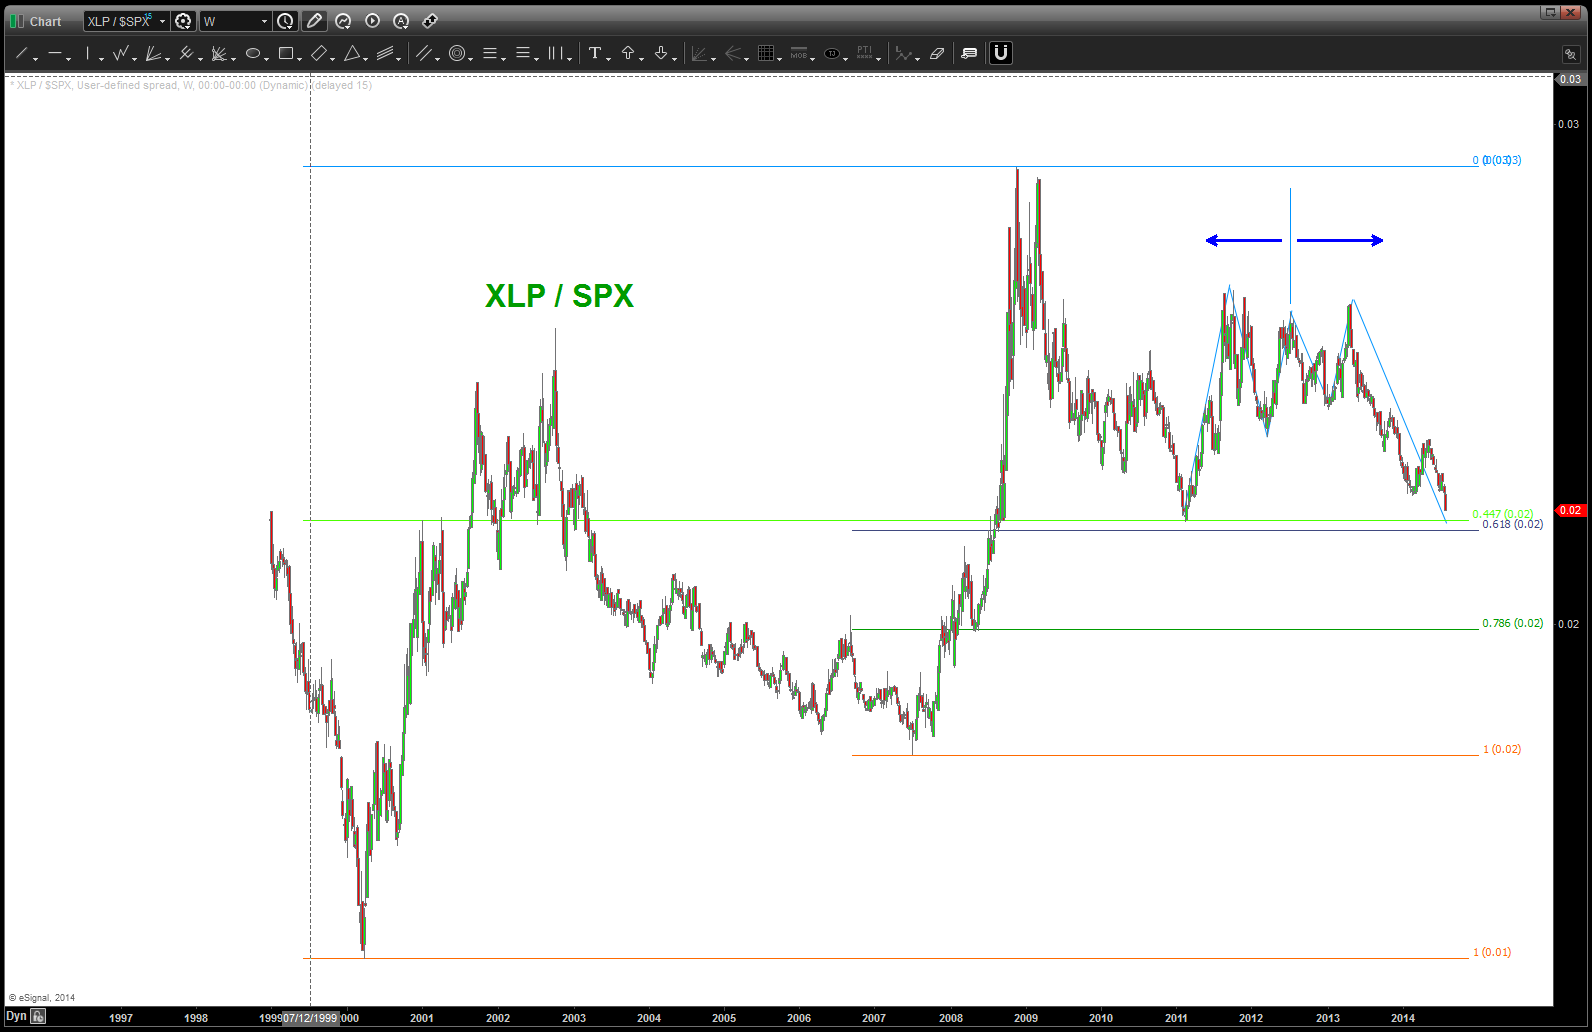
CLIFF NOTES: patterns exist on the ratios/we use ratio analysis to look for sector rotation and when the RATIO’s inflect there are usually inflection points. We are at a key level in the WMT / SPX ratio. Also, I added the NYSE Index overlaid. Note EVERY HIGH AND LOW was at this ratio’s SUPPORT and RESISTANCE. We are at key support – TODAY – on this ratio. Also, the XLP/SPX ratio has a foldback occurring and I would “think” it will find support but sure doesn’t look like it …
BOTTOM LINE – this entire thing is in unchartered territory. Understand the scarce resource and monetize on that … stay away from these markets.
BART
levels on the dollar index
Posted on July 29, 2014 Leave a Comment
CLIFF NOTES: UP to 81.40 down to 80.80-81.00 up to 81.80.
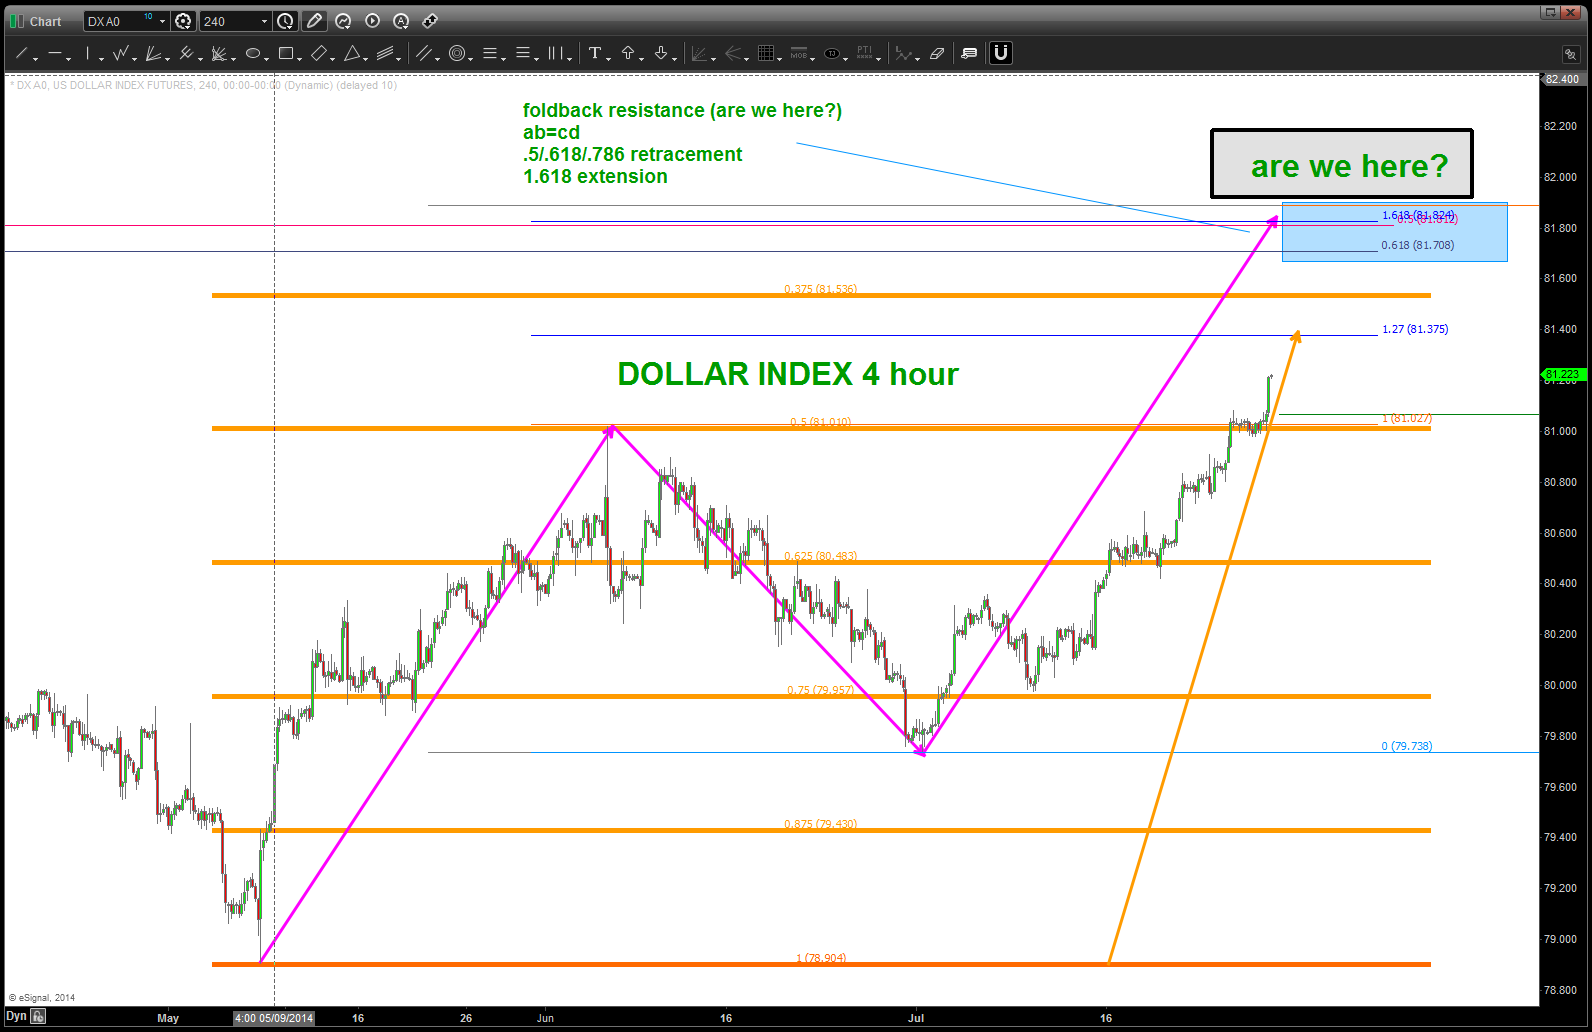
DOLLAR INDEX 4 hour
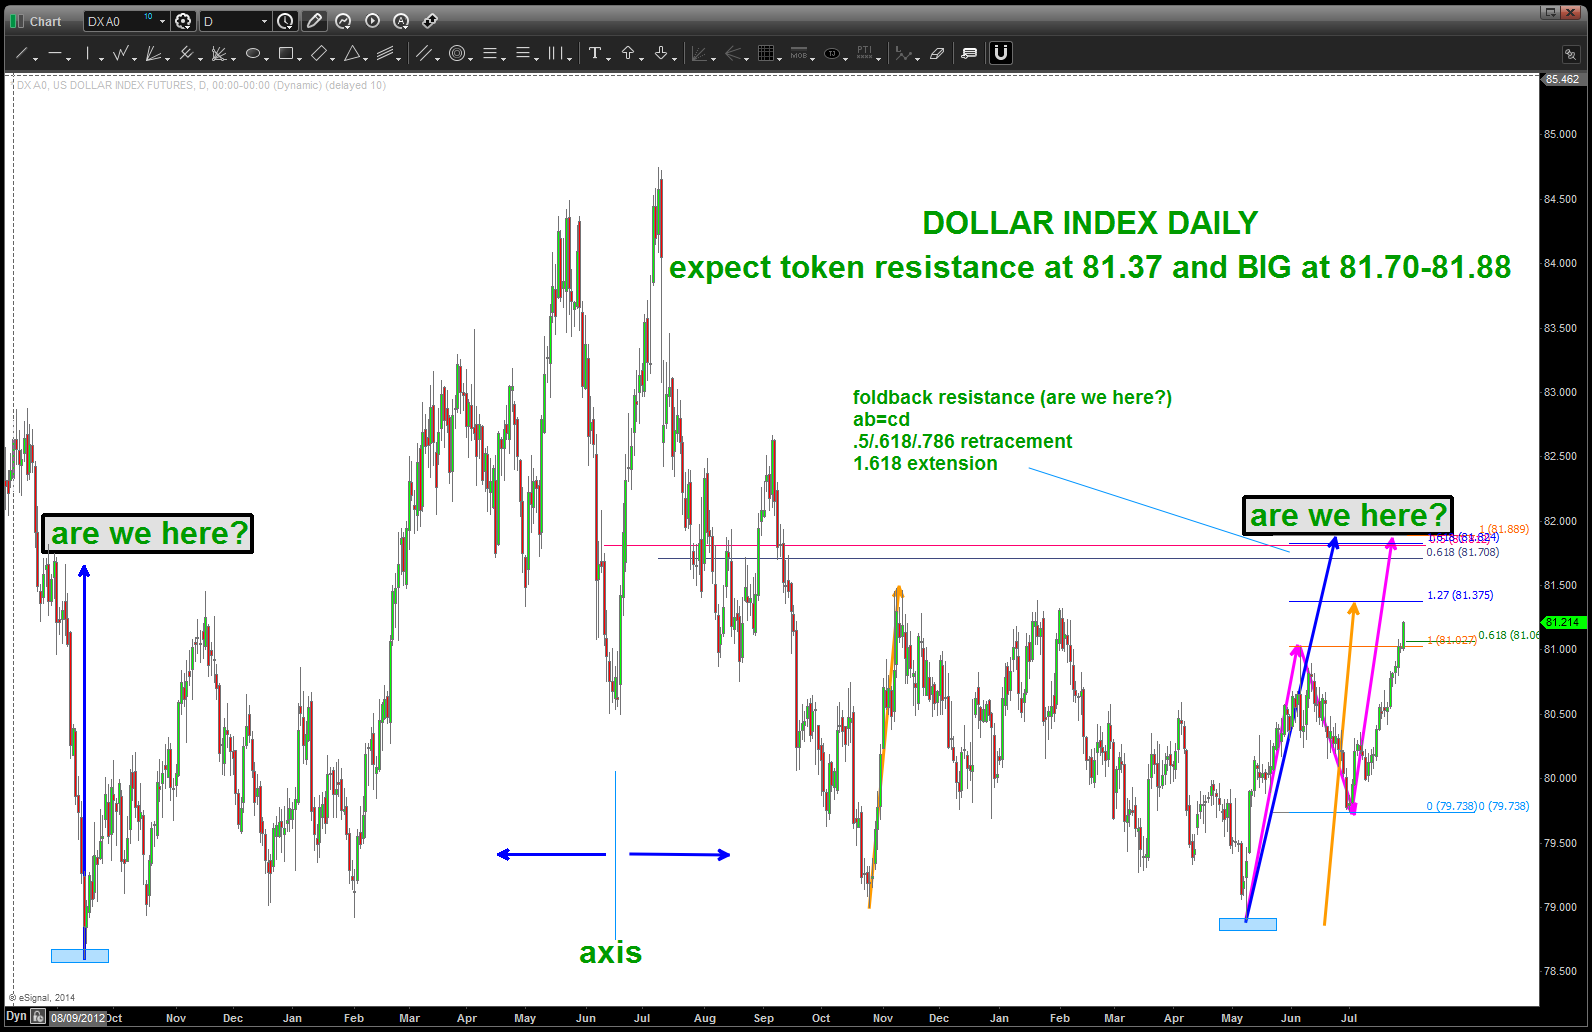
Dollar Index Daily
EURO should find support now or soon …
Posted on July 29, 2014 Leave a Comment
CLIFF NOTES: support to come and then get short this bounce. follow along …
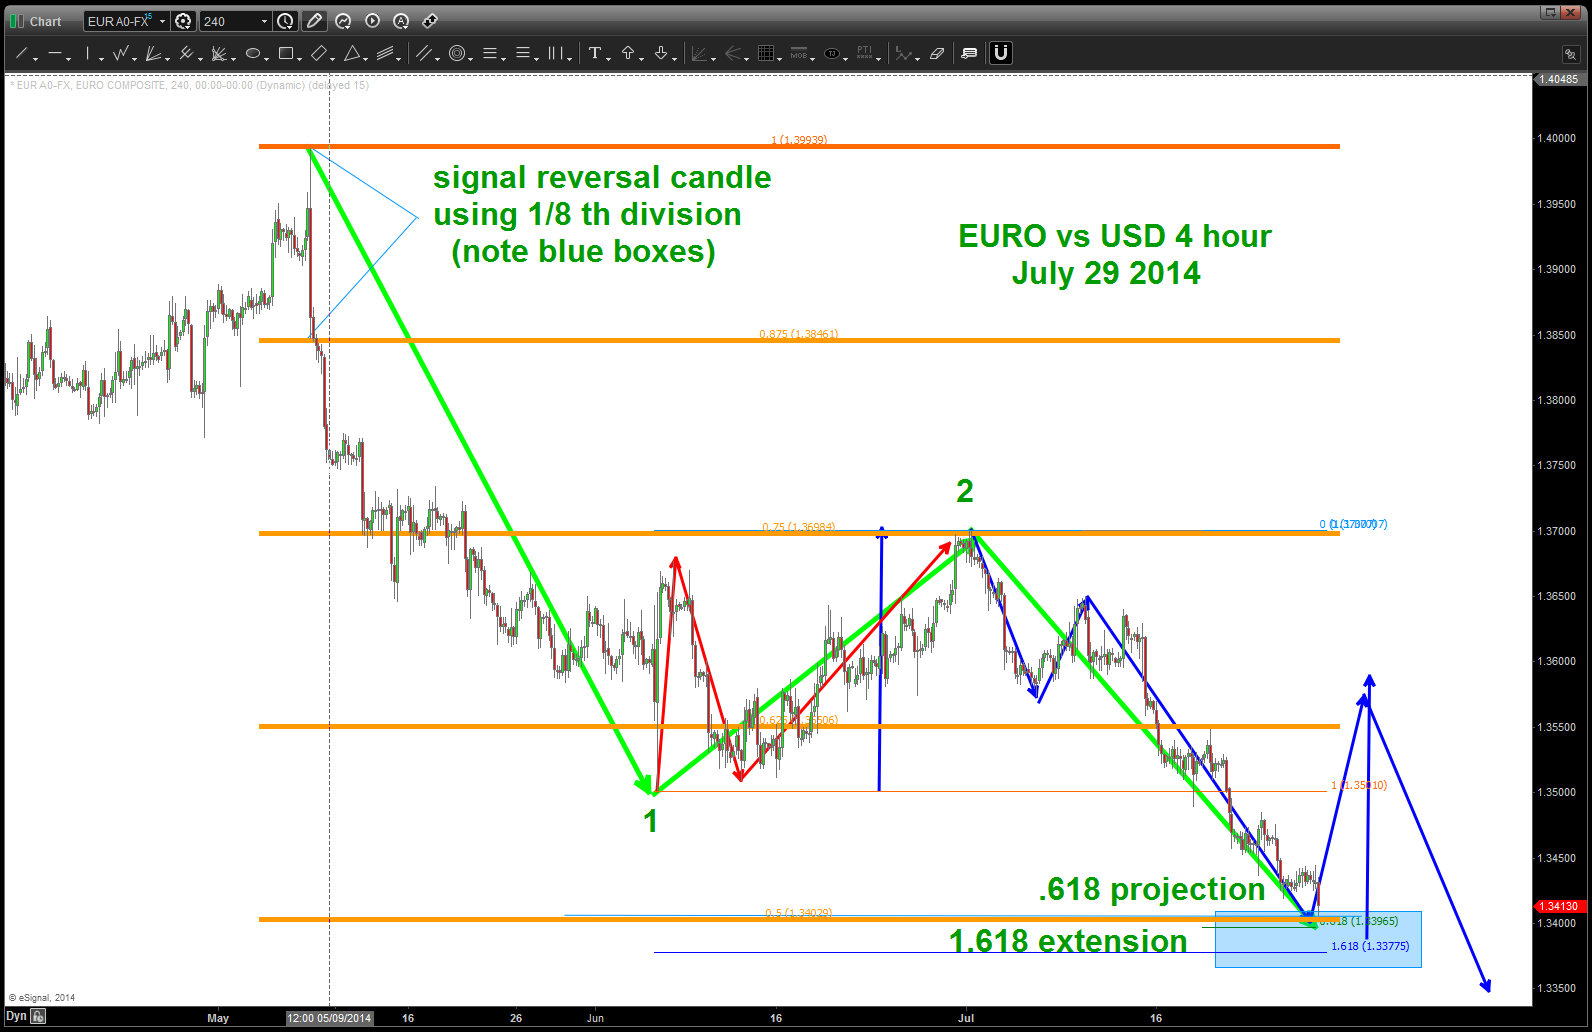
EURO support HERE or a LITTLE LOWER
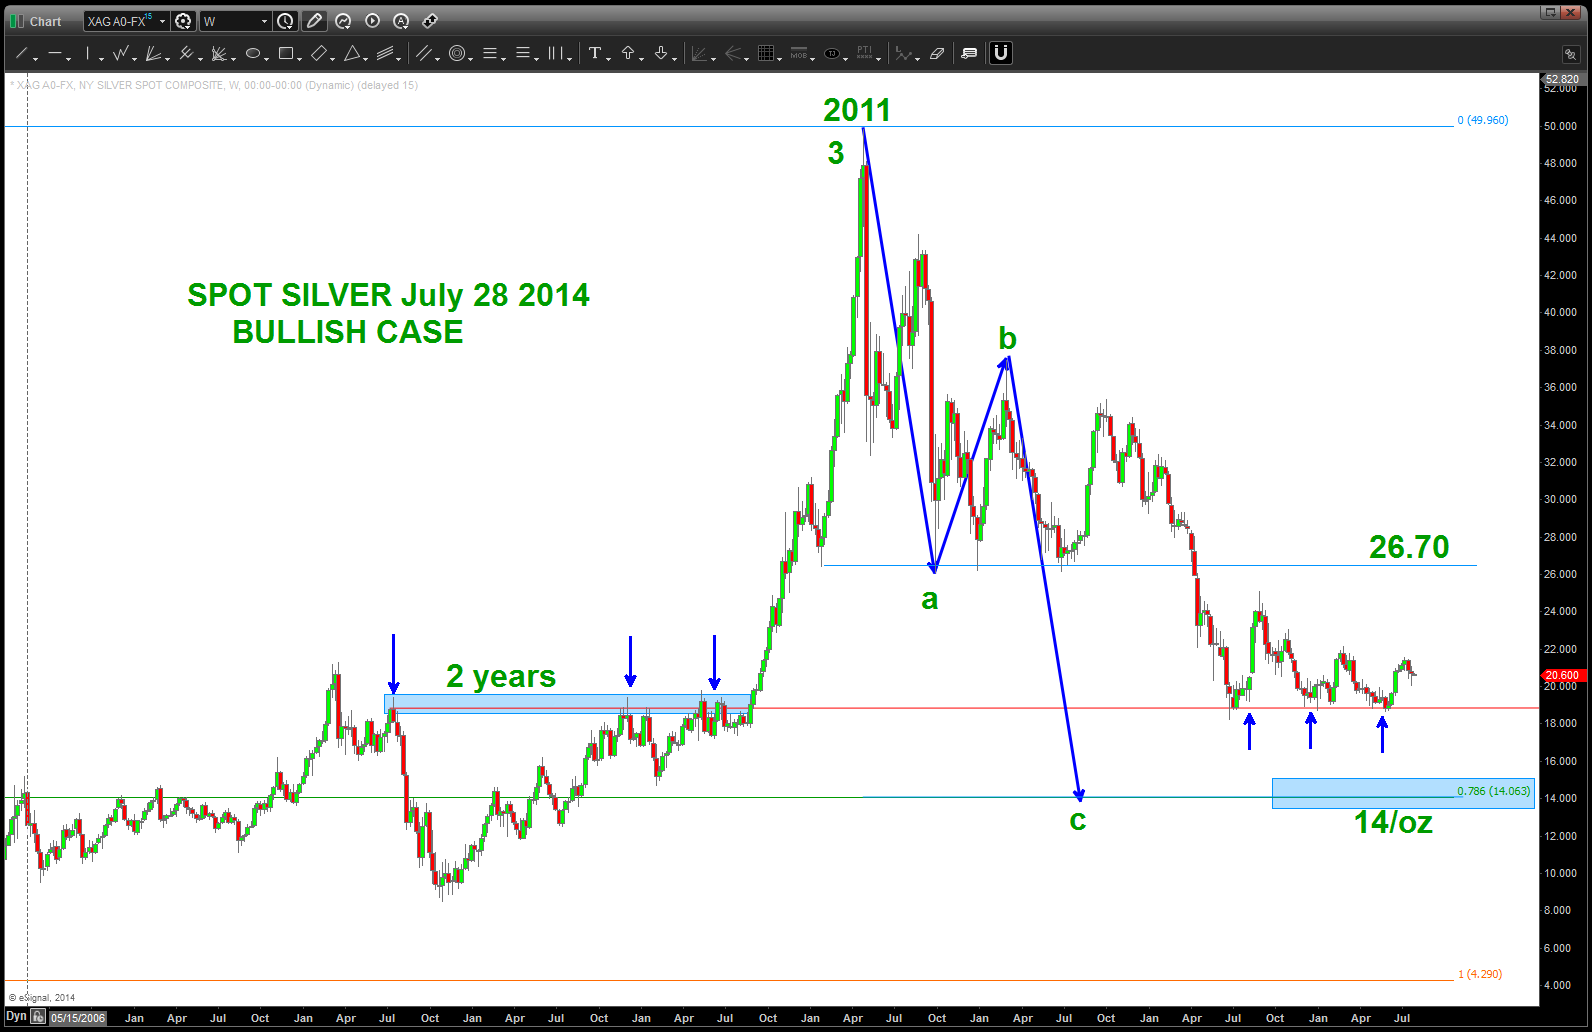
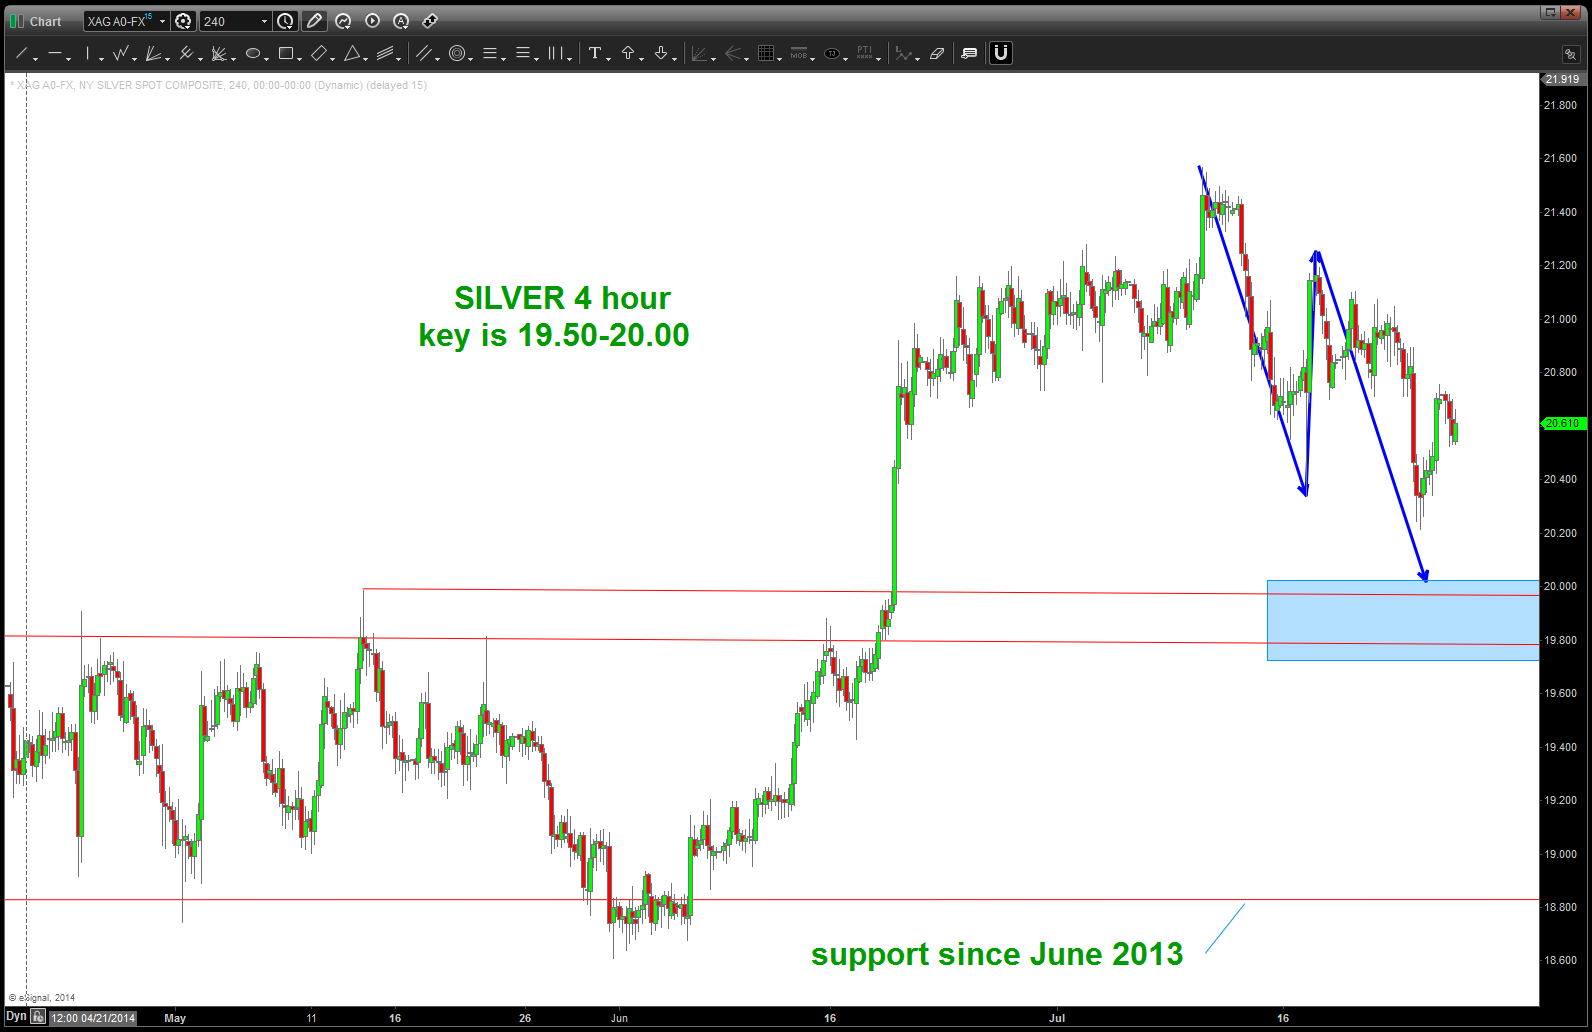
Silver Update July 2014
Posted on July 28, 2014 Leave a Comment
CLIFF NOTES: the move up since early June went higher than expected and, for the first time since the low at 8 I have to reevaluate if a low is in place or we will go down to my long standing 14/0z. so, in order to do that and to watch in real time as we figure this out I’ve included two charts. right now I would like this pullback to test the 19-20 area. If it holds and starts UP strong then the 14 might not be tested….however, if we break that level w/ ease or w/out much of a test then 14 is open.
either way, if we do not get down to the 14 level the KEY is going to be the shelf at 26.70.
apologize for the “wishy washy” nature of this one …the PATTERN completes at 14 but it doesn’t “have” to go there …
stay tuned
IWM revisited
Posted on July 27, 2014 Leave a Comment
Folks, sorry for the delay but was on the Outer Banks w/ family and ZERO access to email, VM, texts and NO cell phone … recommend it if you get the chance! 🙂
That being said, I did get my daily fix on the markets thru Fox Business or CNBC and laughed to myself w/ regard to the “under performance” of the Small Caps and the focus on IWM and it’s relative strength. Why? Well here’s the blog post on the IWM:
- https://bartscharts.com//?s=iwm (if you search for IWM on Bartscharts.com this is the result.)
- all the way back in late November we were talking about the PATTERN that was appearing in/around 113-120 on IWM.
Appears that pattern has hit, looks/feels like it’s working. However, all of the analysis around IWM doesn’t mean anything until a swing low is broken. Let’s watch the swing low noted below for keys.

IWM price and time coming together here/now or soon!
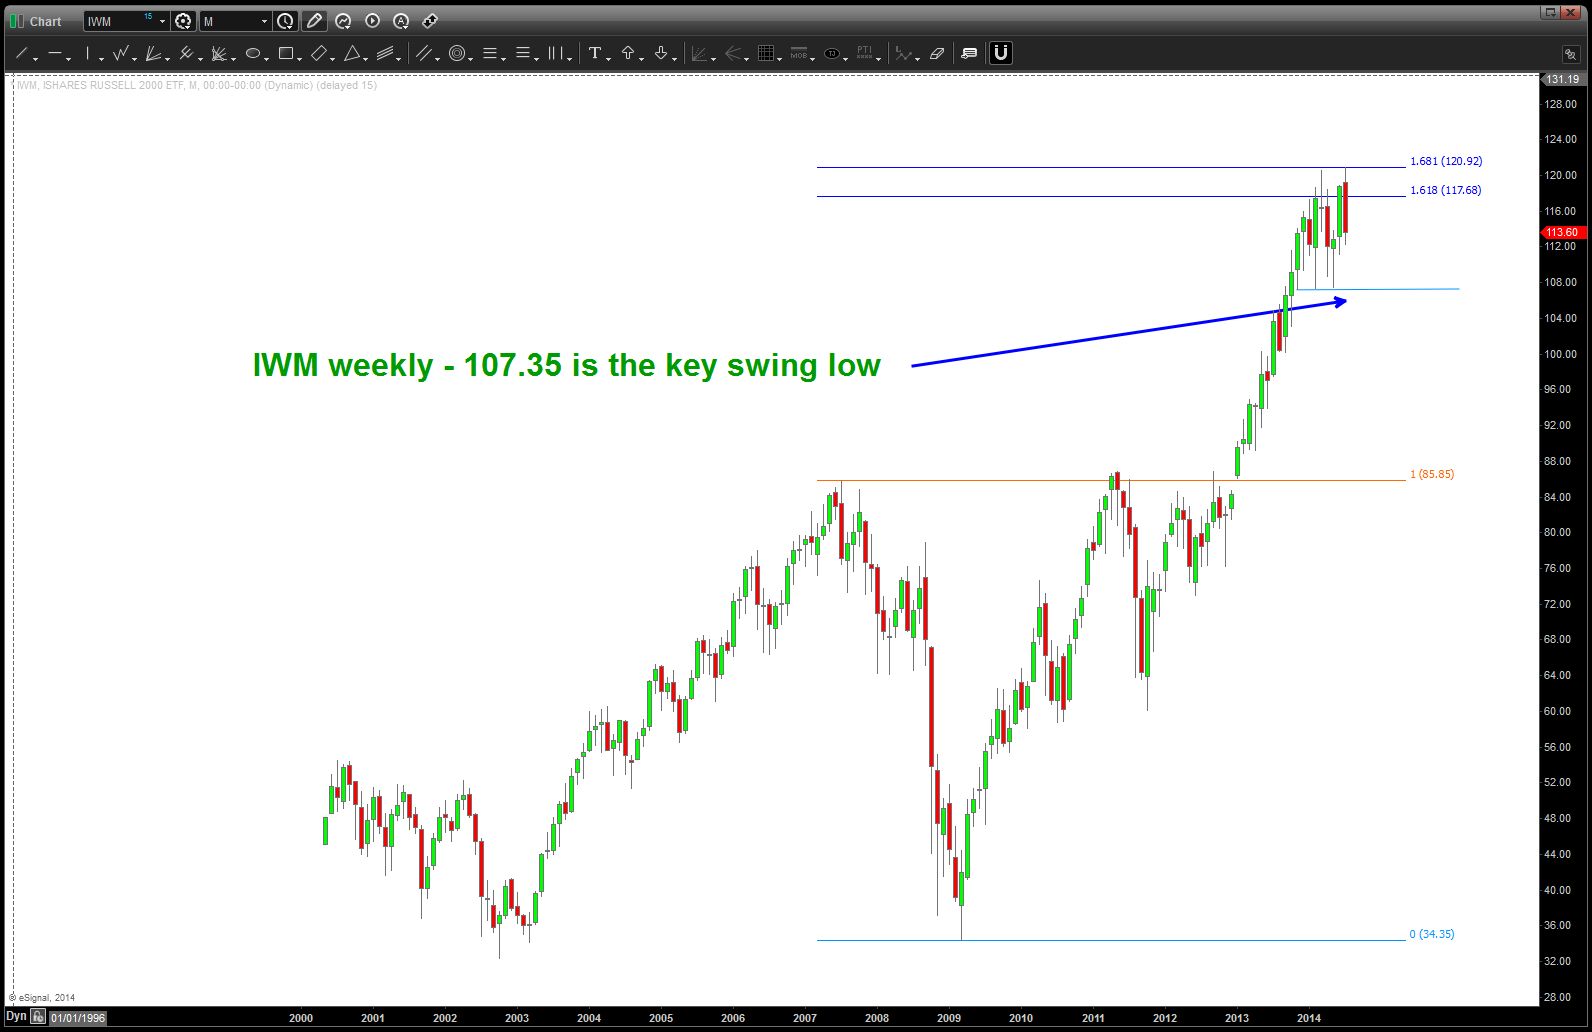
IWM key swing low

IWM showing “PATTERNS” forming zone of 113-120 target zone
S&P 500 cash square out
Posted on July 17, 2014 Leave a Comment
TIME = PRICE and PRICE = TIME.
1959 days ago was the LOW in March 2009 … we closed today below by 1 point (OK, work w/ me)
that is a square out … simply put at any given point in time/space the market “should” be at a certain number … when “crashes” occur or parabolic moves “UP” occur the market is going to where it should be. so, we’ve balanced a tipping point so to speak in the market …
even w/ the chaos of the Israeli invasion and the horrific airline incident the market went to the number it should be at to seek equilibrium ..
STAY tuned …
B
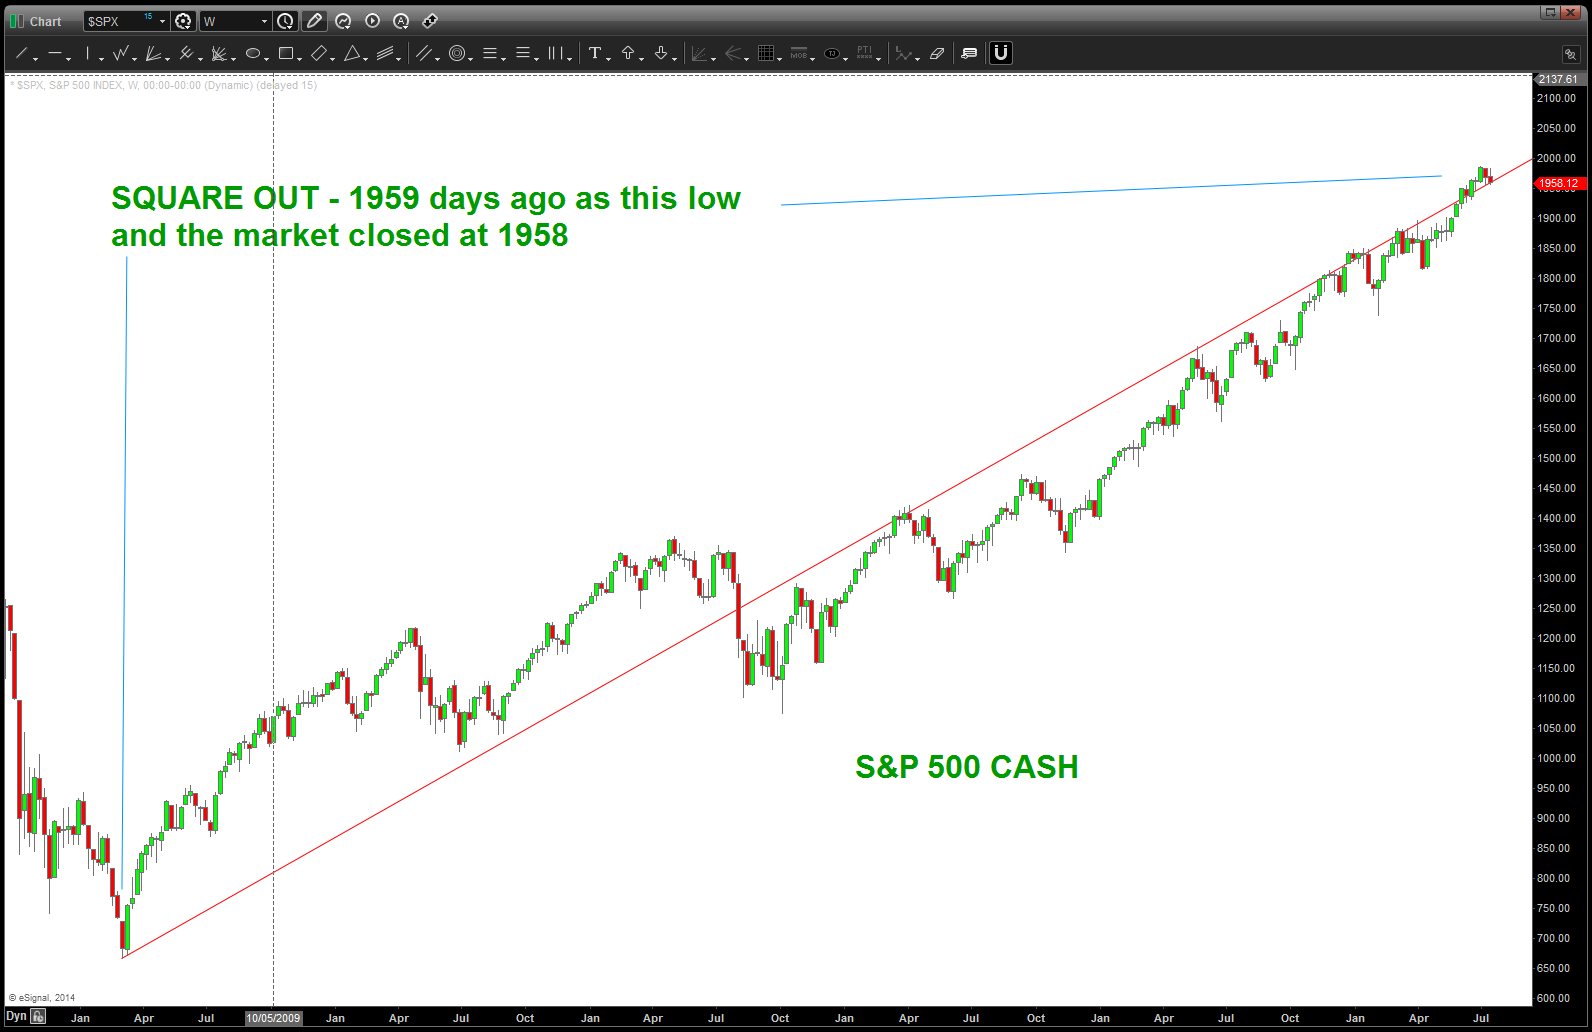
square out
DBA – be patient
Posted on July 12, 2014 2 Comments
the commodity markets are ROCKING AND ROLLING w/ regards to Corn, Soybeans and Wheat ….
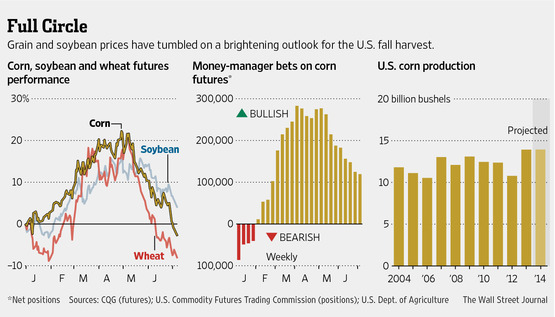
so, I don’t know ANYTHING about the inner workings of the grain market but I do know MEASURED MOVES and look at some of the beauties on Corn, Wheat, Soybeans. If we look a the “money manager” bets in the middle of the chart above it appears that NO ONE is bearish? Also, is the bushels projection that great? anyway, w/ extreme bearishness and this quote:
“There’s just no real stress, hot [weather] coming along, so we’re going to blast prices down,” said Jack Scoville,
Vice president at brokerage Price Futures Group in Chicago. “Most areas are in really good shape.”
sure looks like a BUY opportunity. But, let’s don’t get cray cray here … we have a target area of support but look at what happened the last time we had a measured move like this … the darn thing bounced around for 3 months. so, let’s let the market prove to us if this is support. then, just wait for that magical weekly or daily pullback (it WILL happen) and then pounce. Folks, this could take months for the correct entry …we’ll revisit these in a couple weeks.
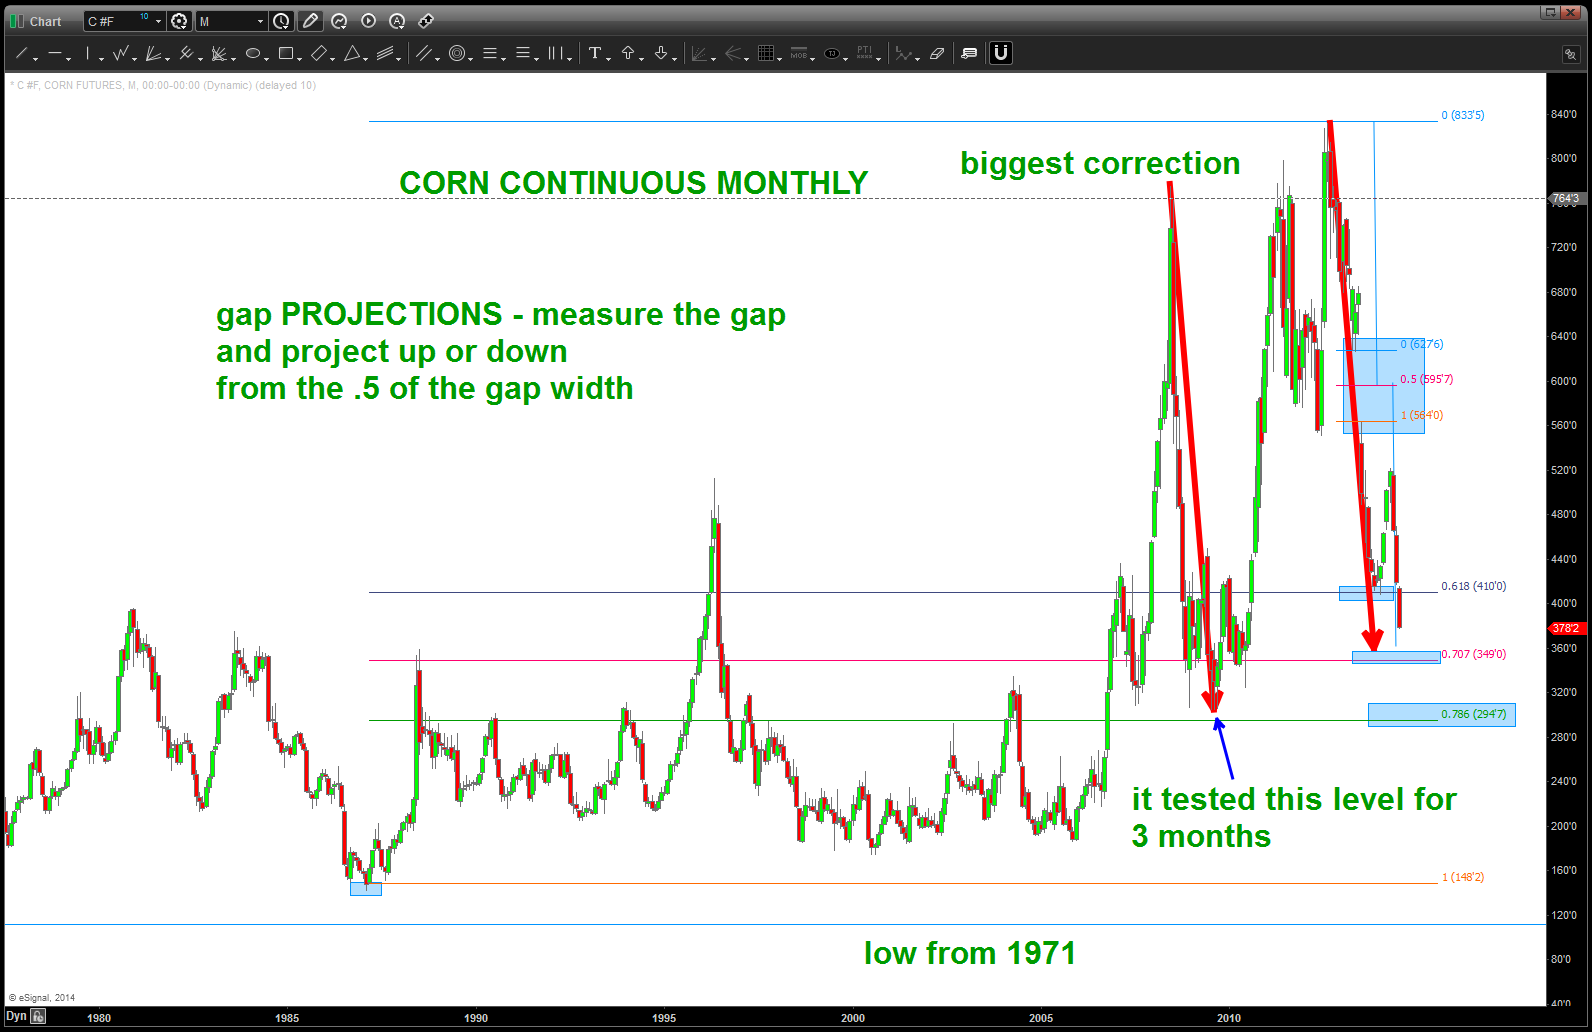
CORN continuous contract MONTHLY
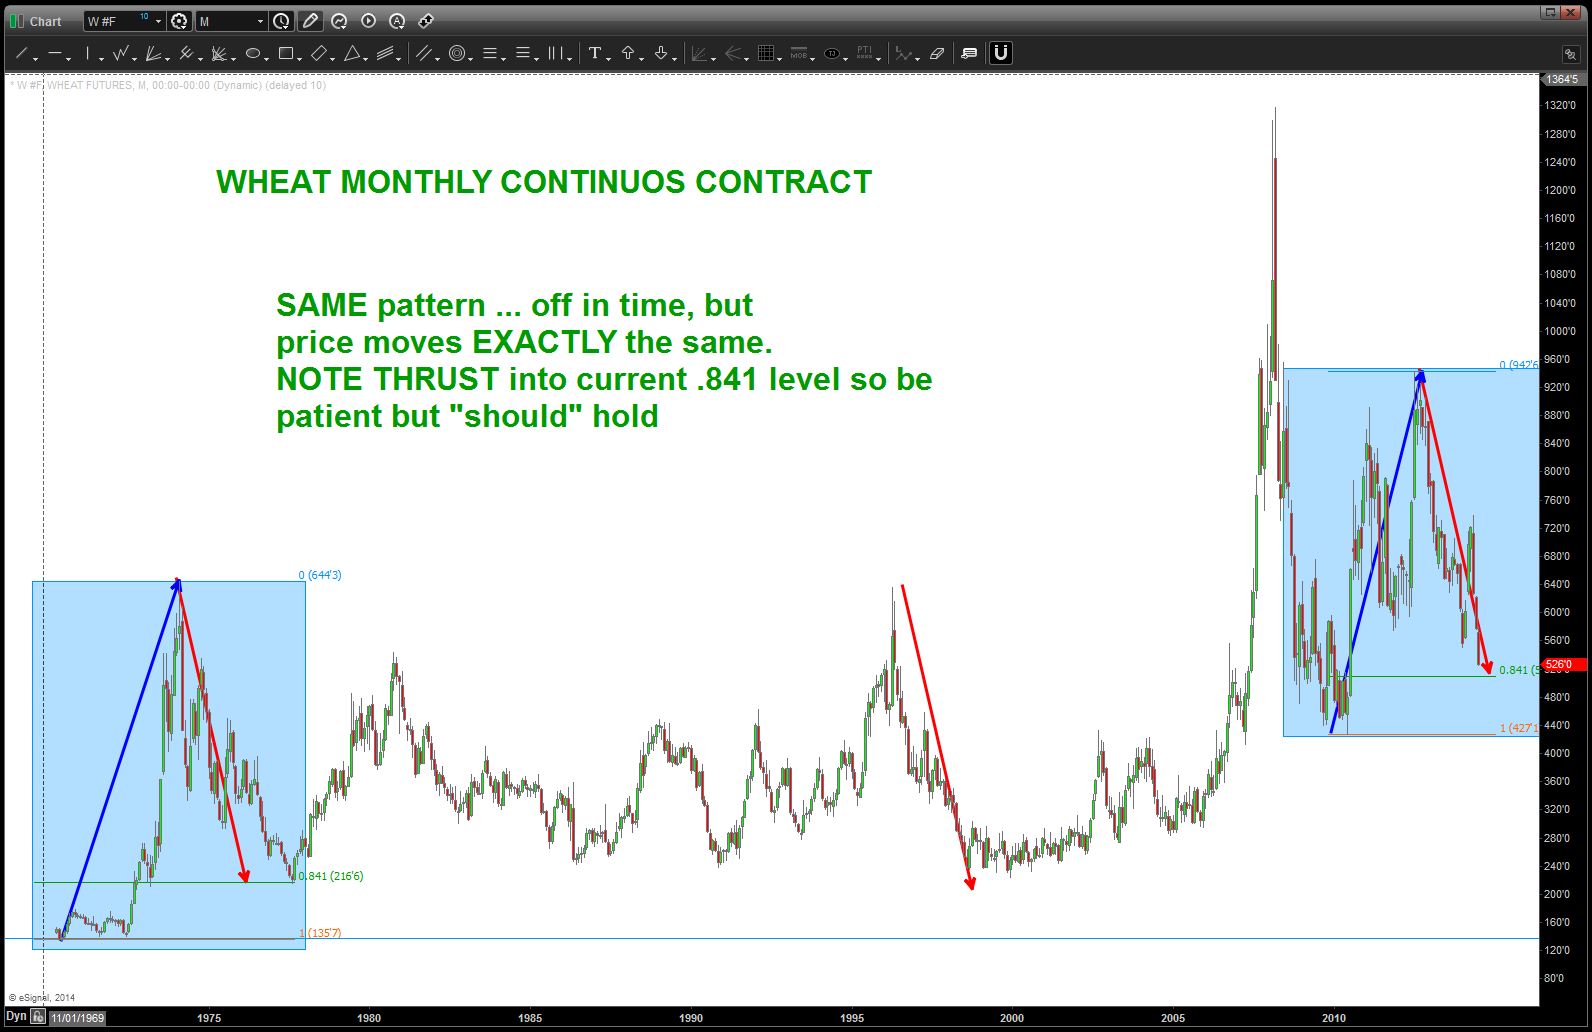
WHEAT continuous contract MONTHLY
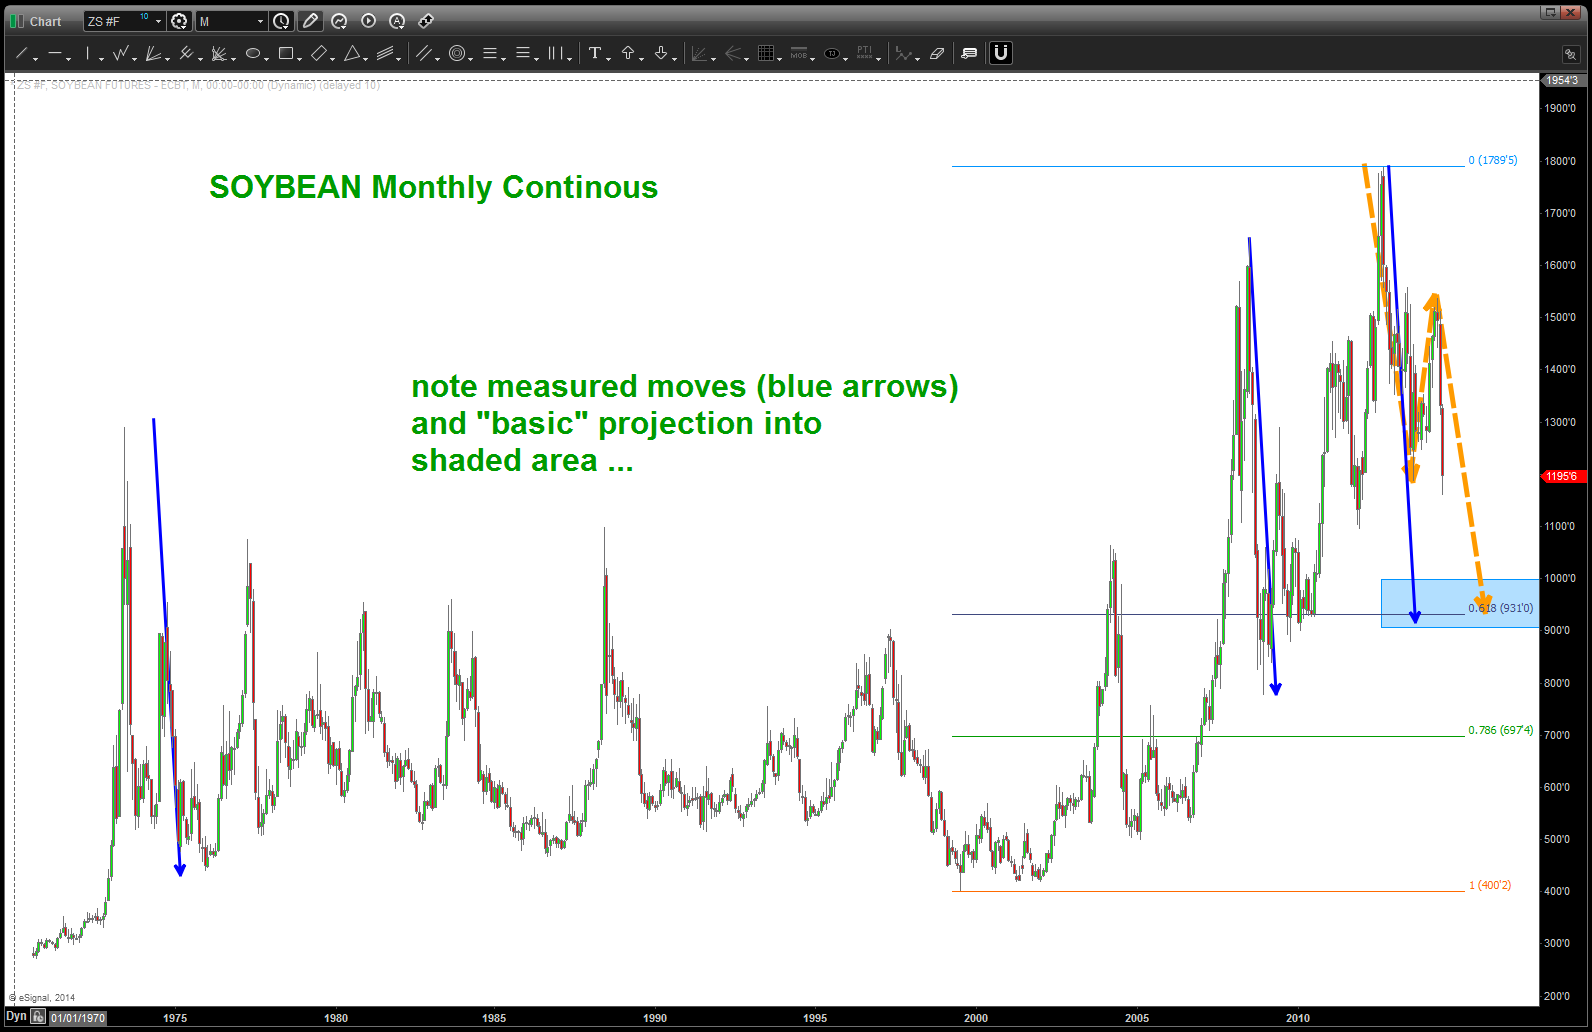
SOYBEAN continuous contract MONTHLY
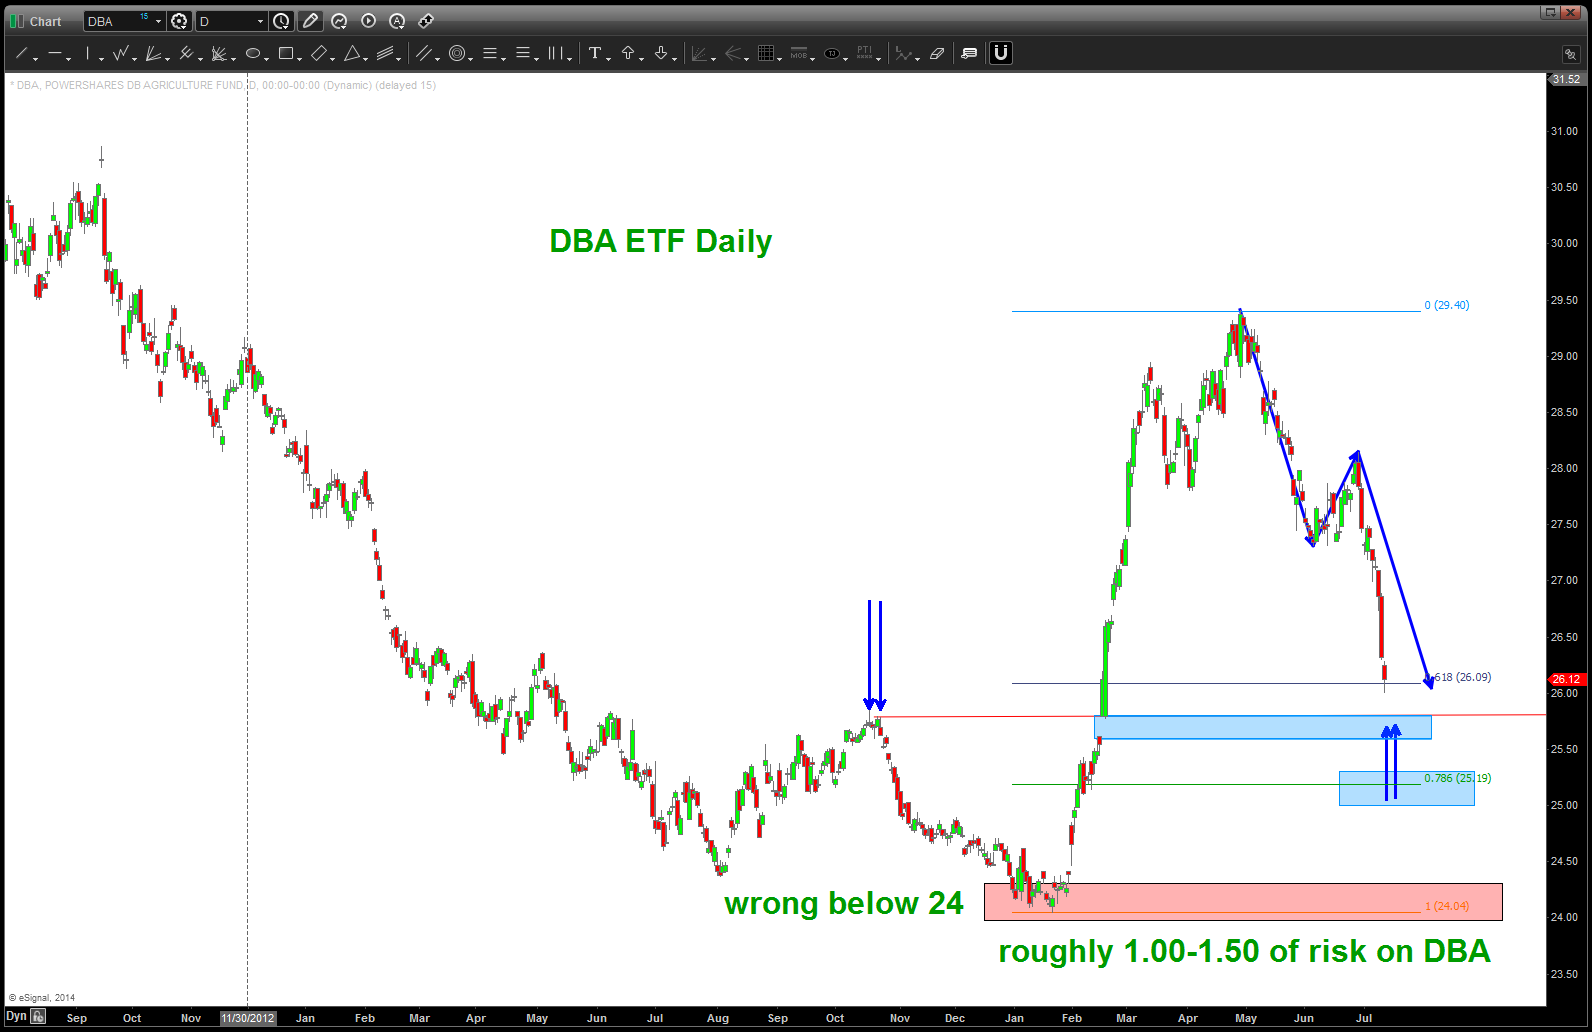
DBA
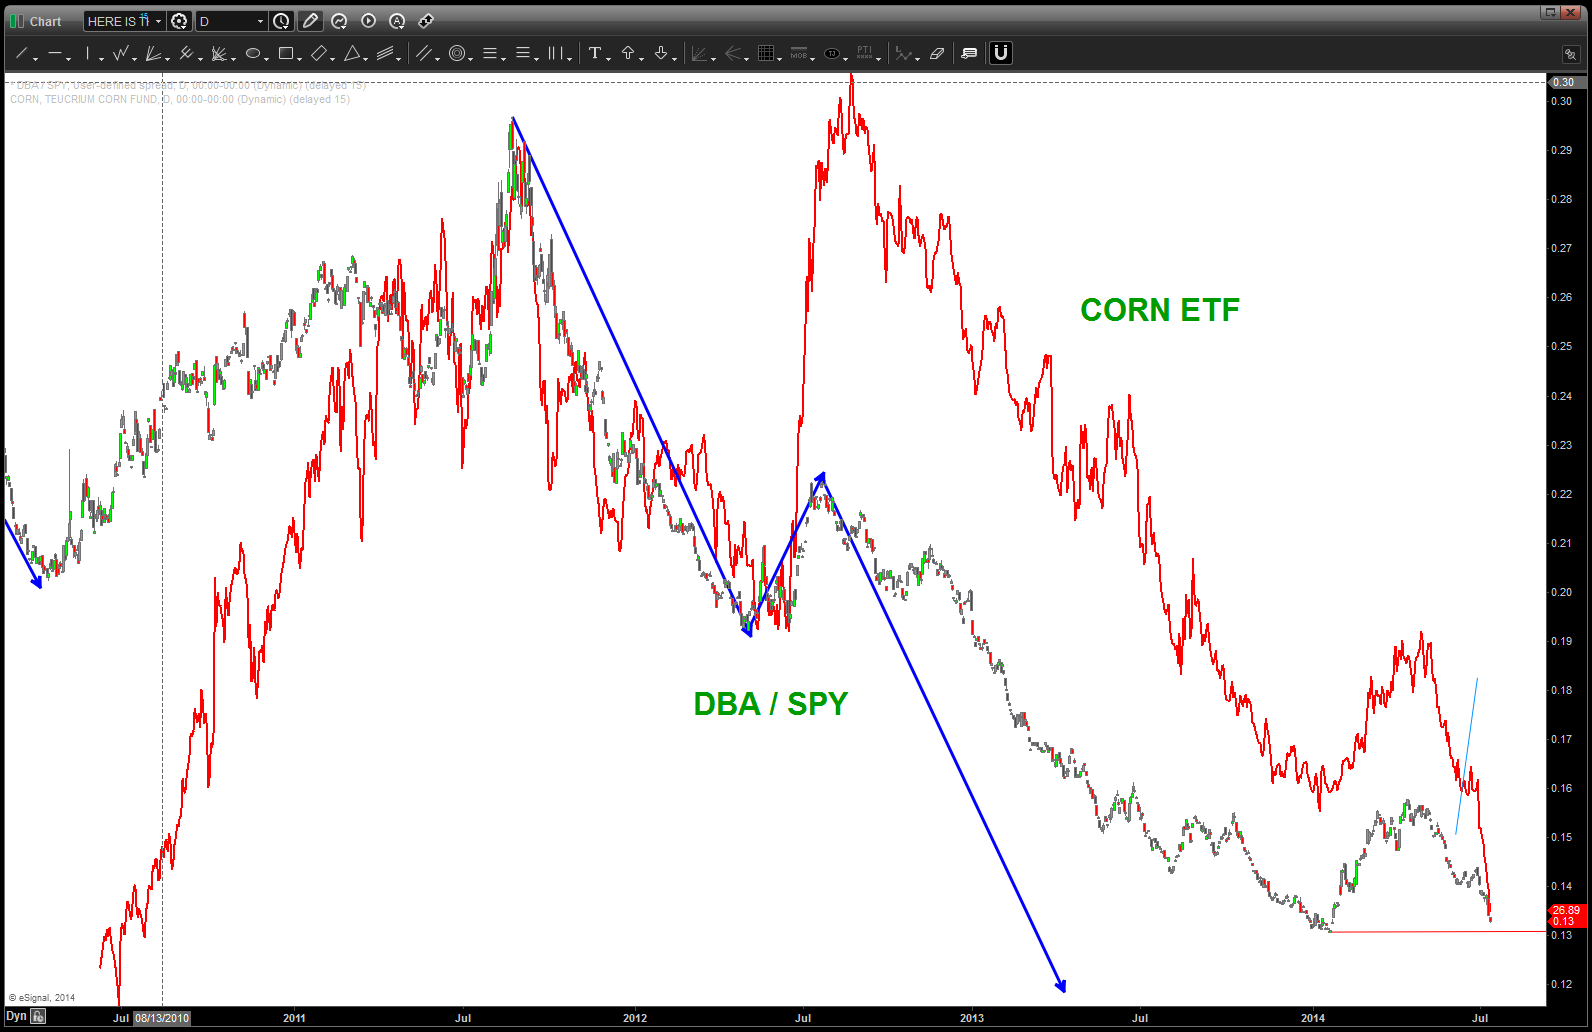
here is a quick look at the relative strength ratio between DBA/SPY. obviously, quite the thumping here BUT if you look you can see 5 waves down. if we break the swing low (sure looks like it’s going to happen) then we’ll go to that lower target I believe.
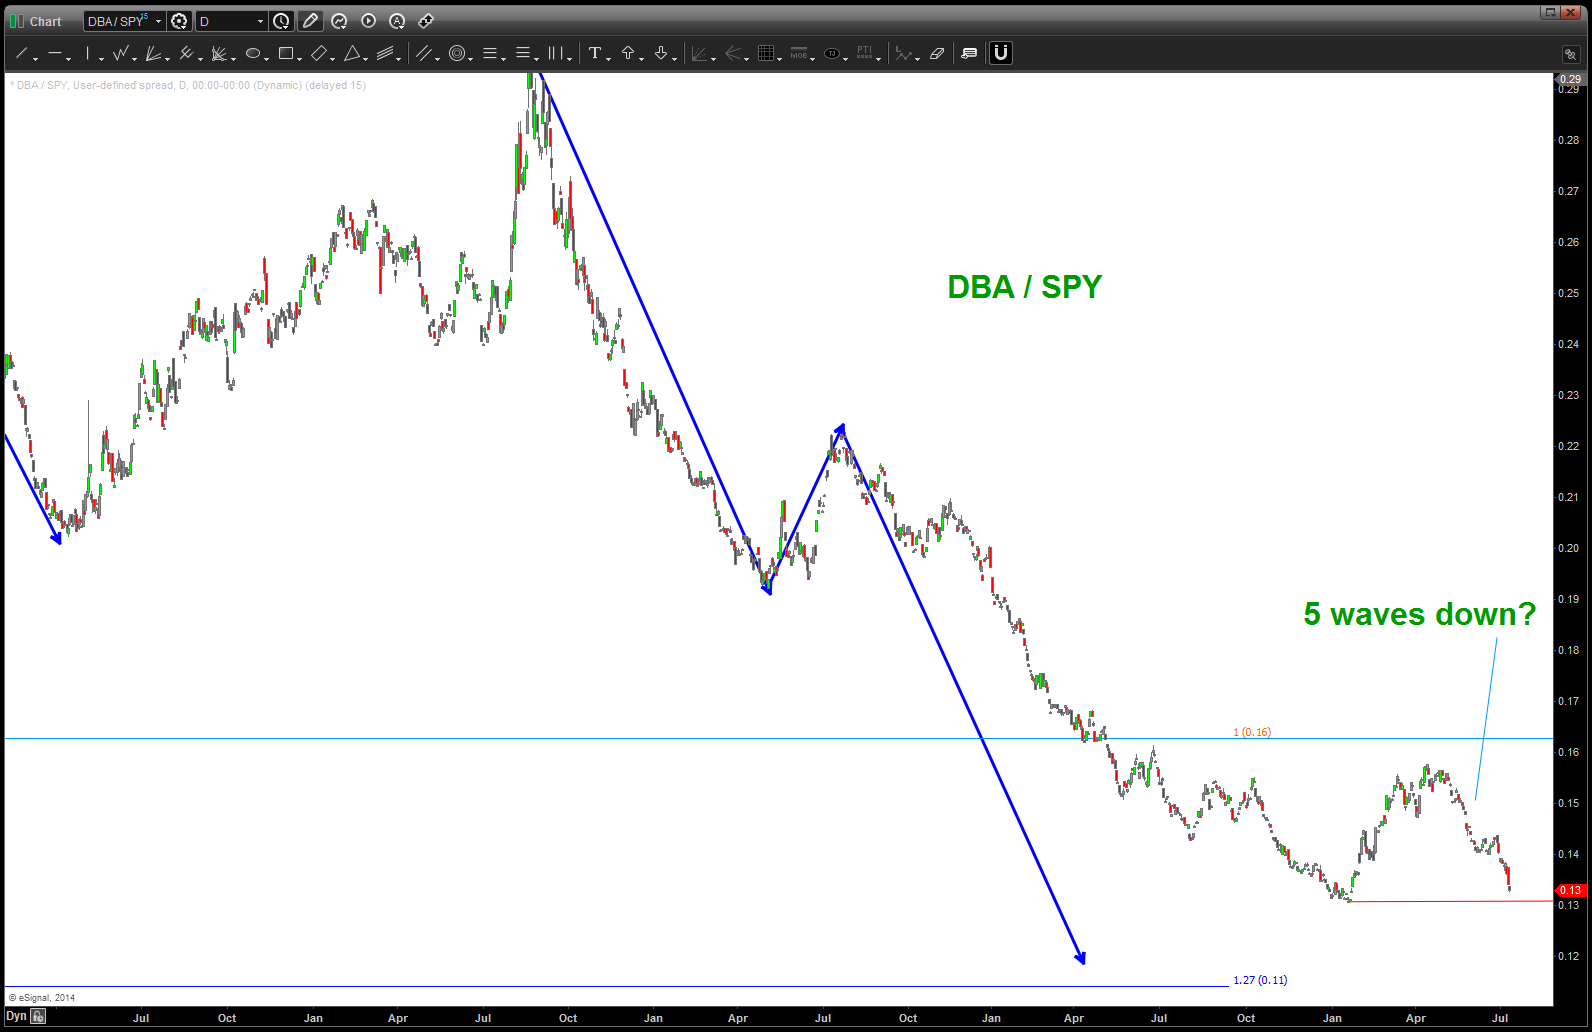
DBA/ SPY relative strength ratio
so, why is this important …? well, let’s take the CORN ETF and overlay it on the ratio. As you can see … when this ratio bounces so does corn (make sense) so we will look for some rotation into the agriculture market if/when the equities lose there luster.