KIWI Patterns (note plural)
Posted on June 23, 2014 Leave a Comment
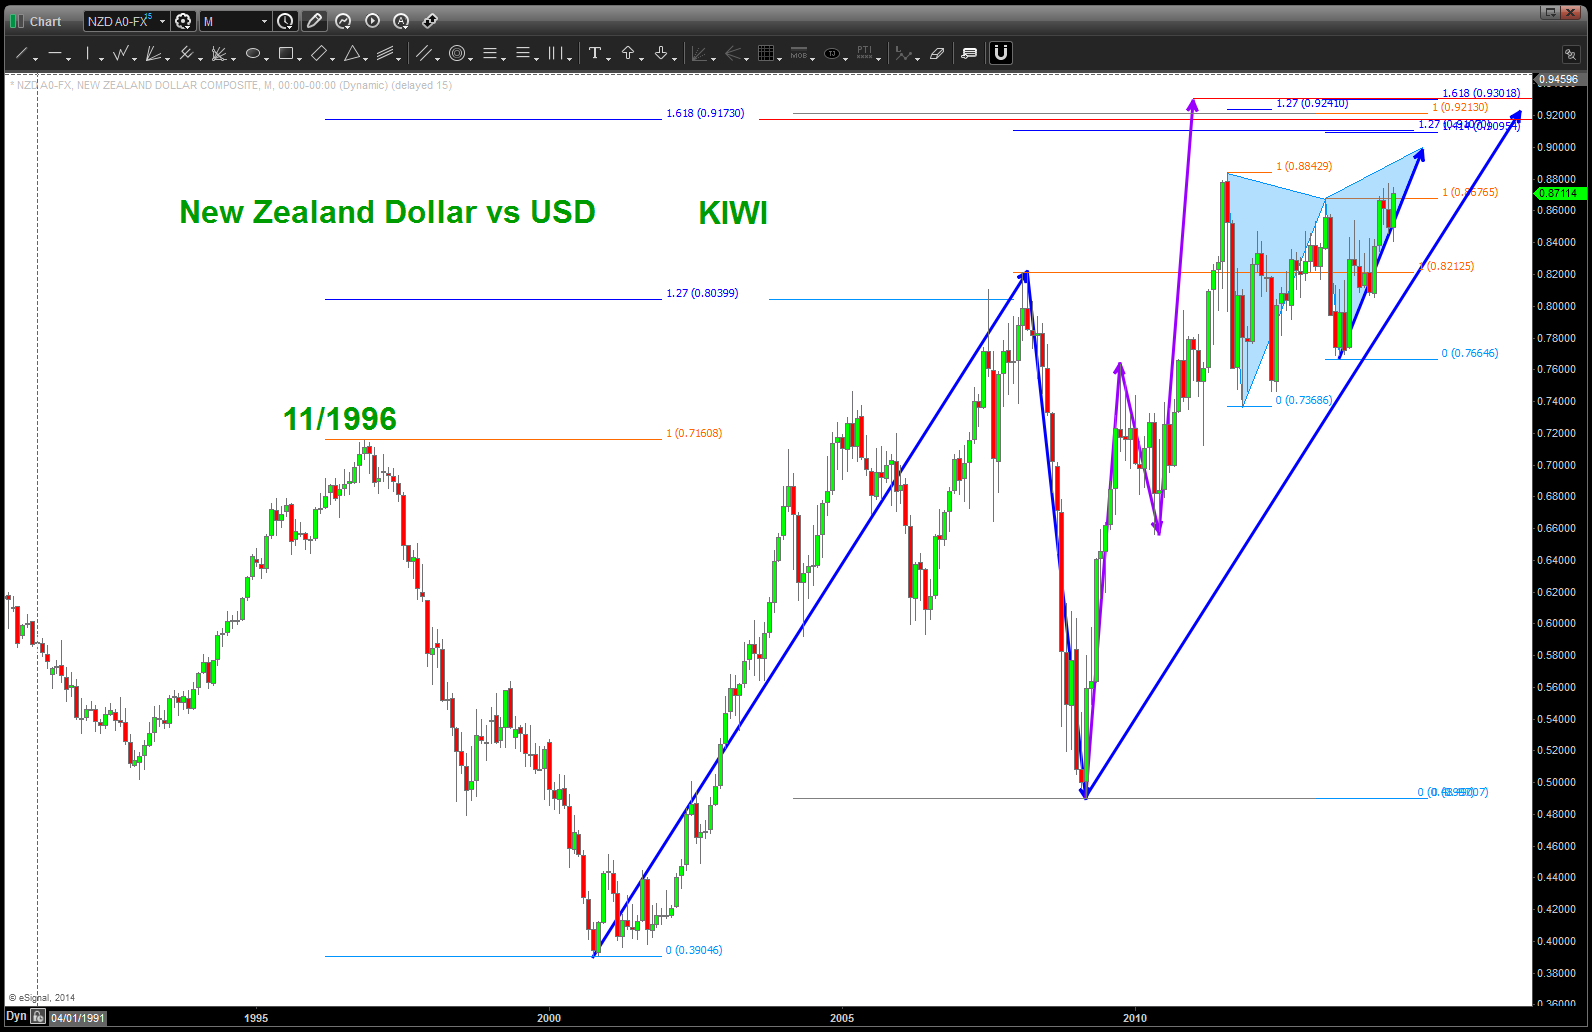
CLIFF NOTES: Patterns galore in the 9000-9300 level on the KIWI.
AB=CD from all time low (blue)
1.618 extension from 11/1996
AB=CD from 2009 low (purple)
Butterfly Top – light blue triangles.
I expect the highs to be taken out from 2011 but then a BRICK WALL should stop the advance in it’s place.
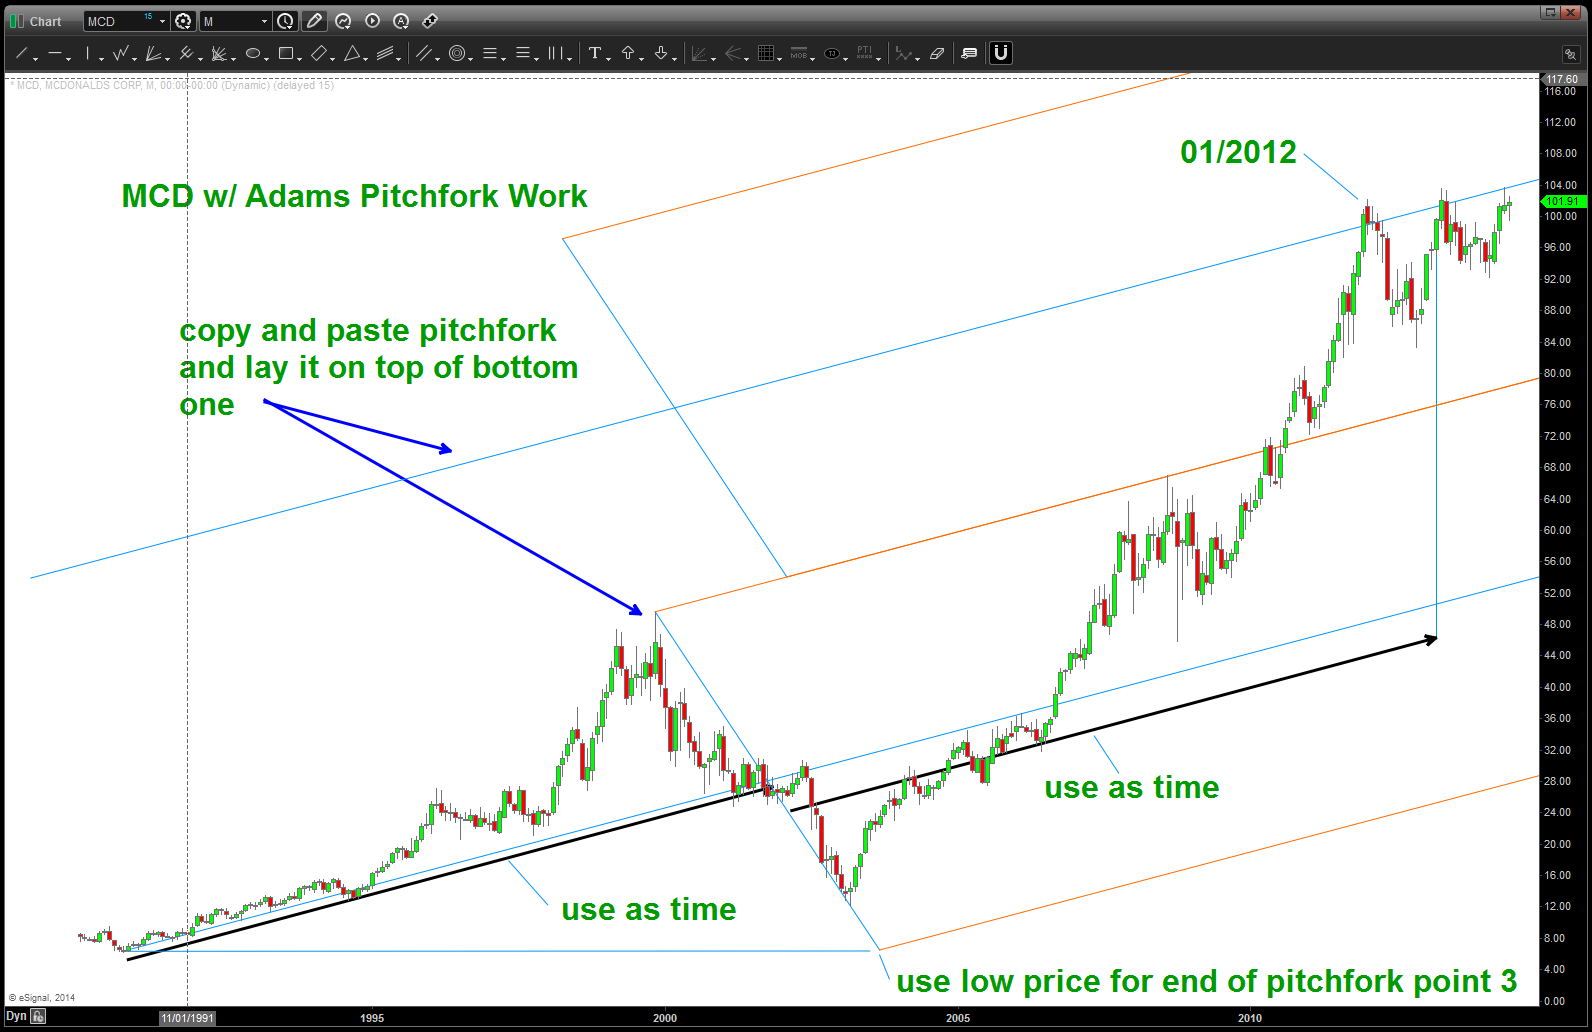
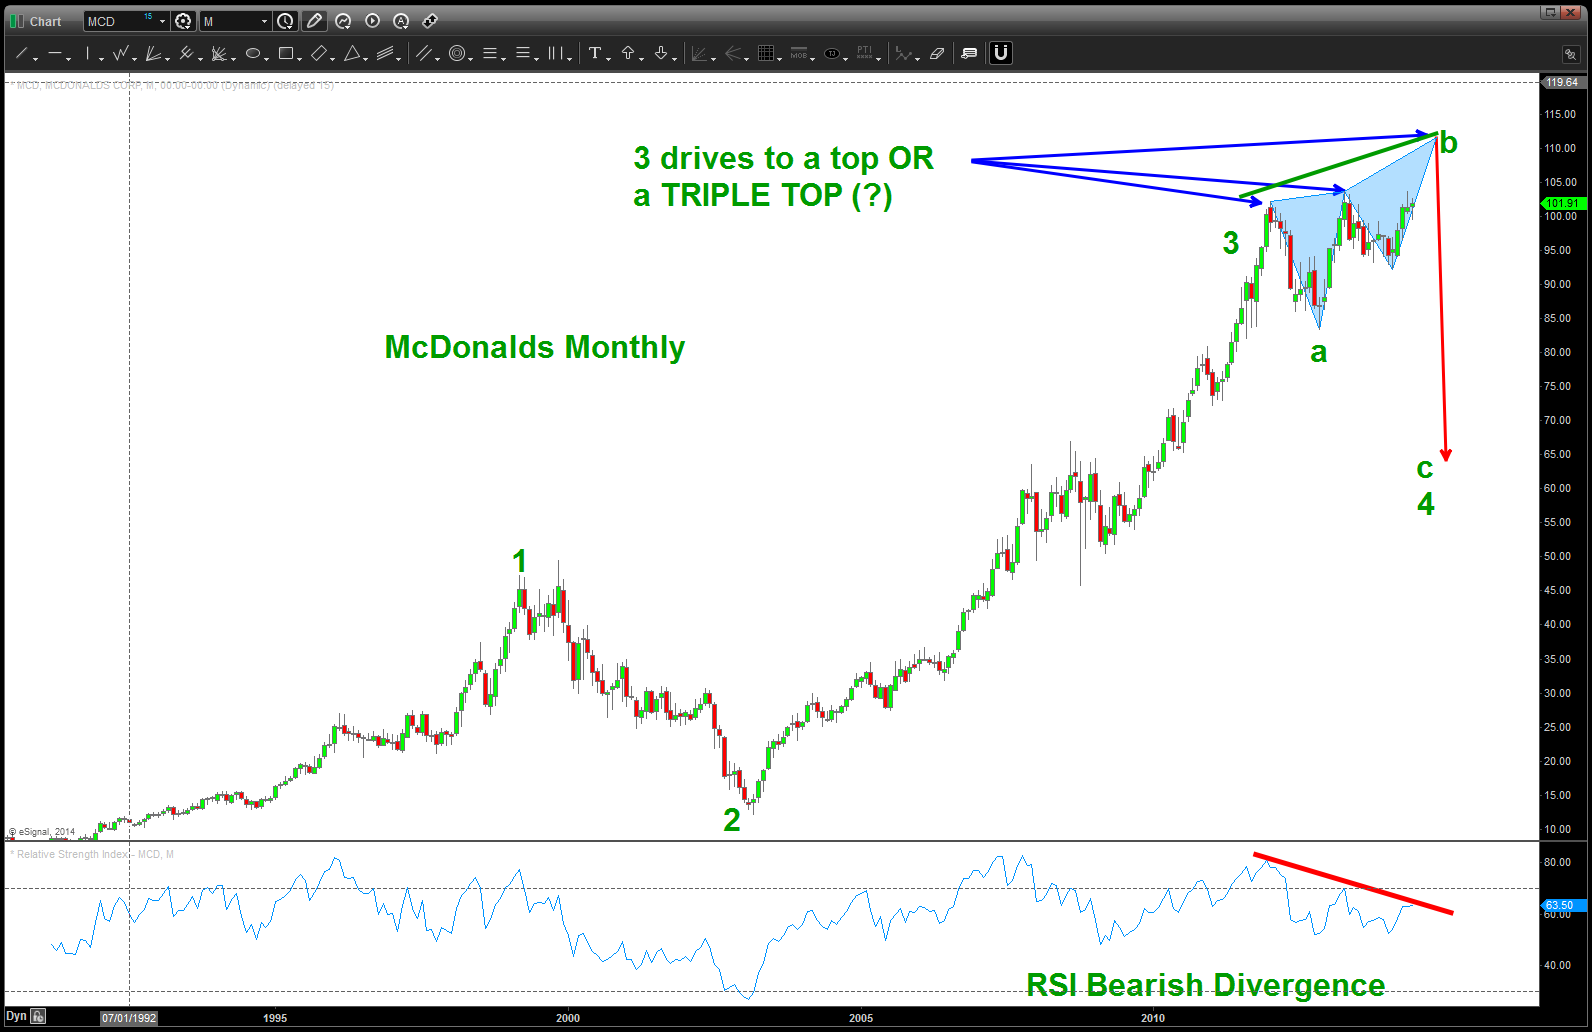
McDonald’s (MCD) Strategy
Posted on June 23, 2014 Leave a Comment
CLIFF NOTES: MCD has been stalled at 100 since early 2012. that’s a long time .. we either have some high level consolidation getting ready to explode or some distribution. Here’s what I see … I see a PRICE and TIME pattern completing so my bias is a corrective move. If you look at the below, you’ll see a potential game plan. Note – the TIME of the 2 was rather long and thus far we have not had a correction to balance that from a time perspective so this prolonged move up I am going to put at 3 … sure looks like a beautiful expanding flat coming together so the next move after either 1) a triple top or 2) a 3 drives to a top pattern “should” be down but, one that should be BOUGHT for news highs to be seen. Will be watching an updating.

EURO vs USD update
Posted on June 23, 2014 Leave a Comment
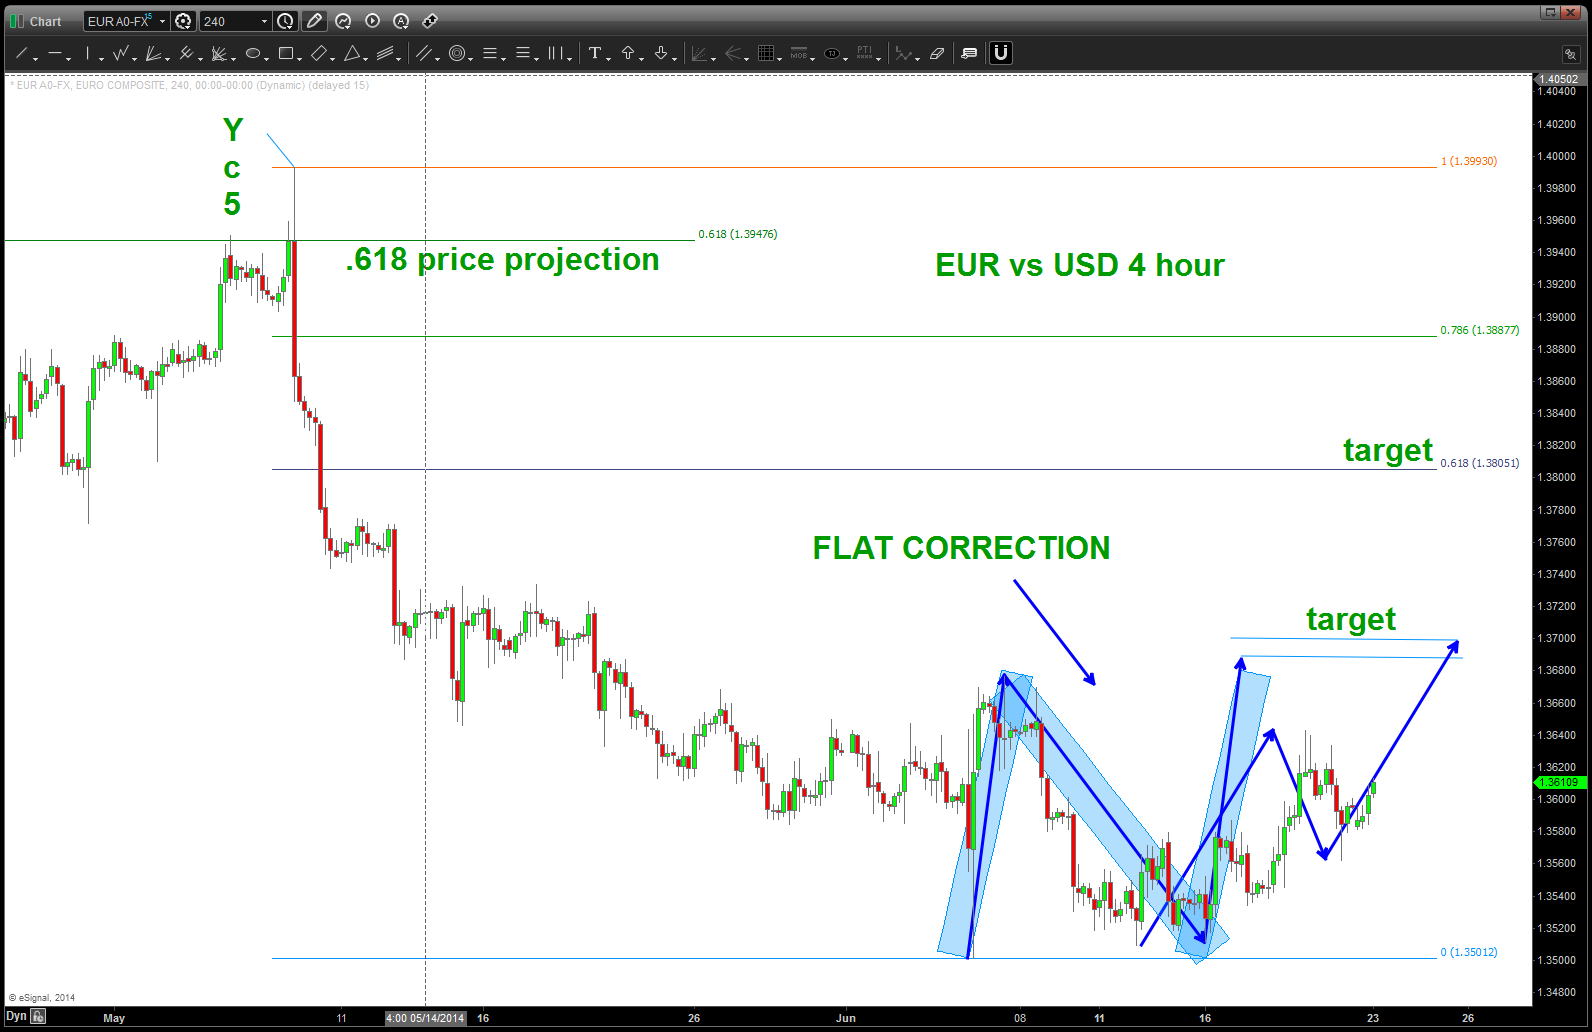
CLIFF NOTES: the EURO bottomed on June 05,2014. It’s been correcting for 18 (long days). The most recent correction that occurred (intra day) on Friday was, just that, a corrective move in what I believe is the last leg of a “long” flat correction. Targets in/around 1.3700 are a good place to get into a short. Additionally, we could still POP up to 1.3800 so need to continue to monitor and be patient.
In any event the 1.39930 is KEY to the thesis that our 3 wave 1.5 year correction (labeled below as W-X-Y) is complete and we are on the verge of a major move lower in the EURO vs USD.

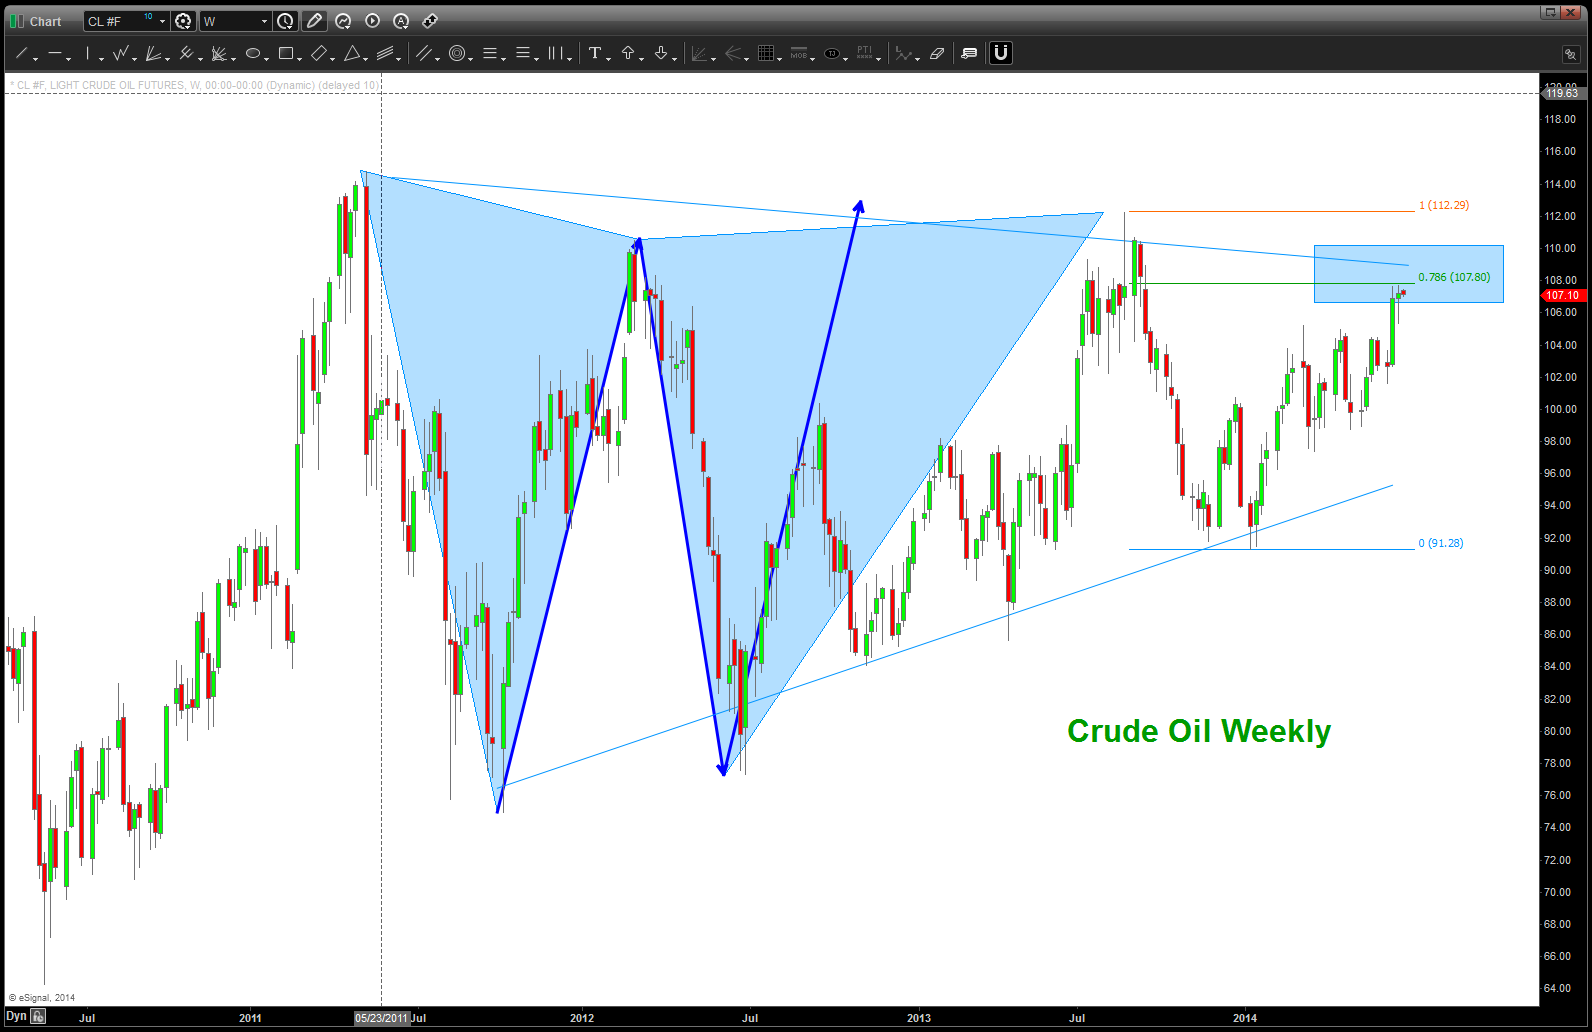
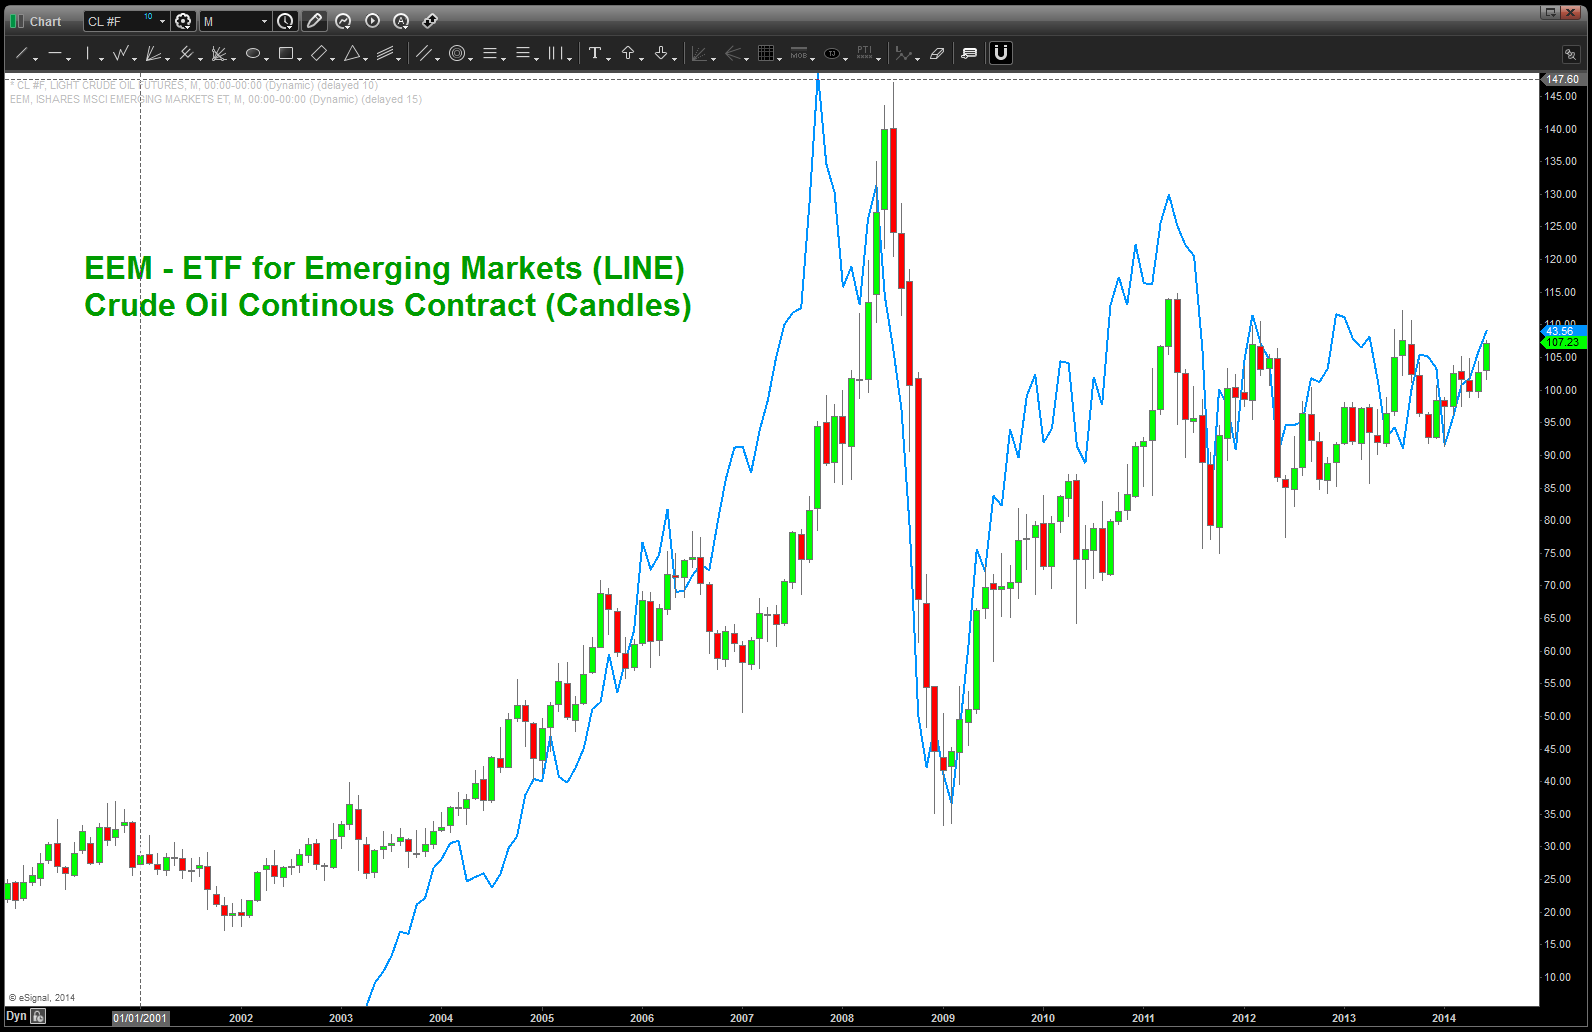
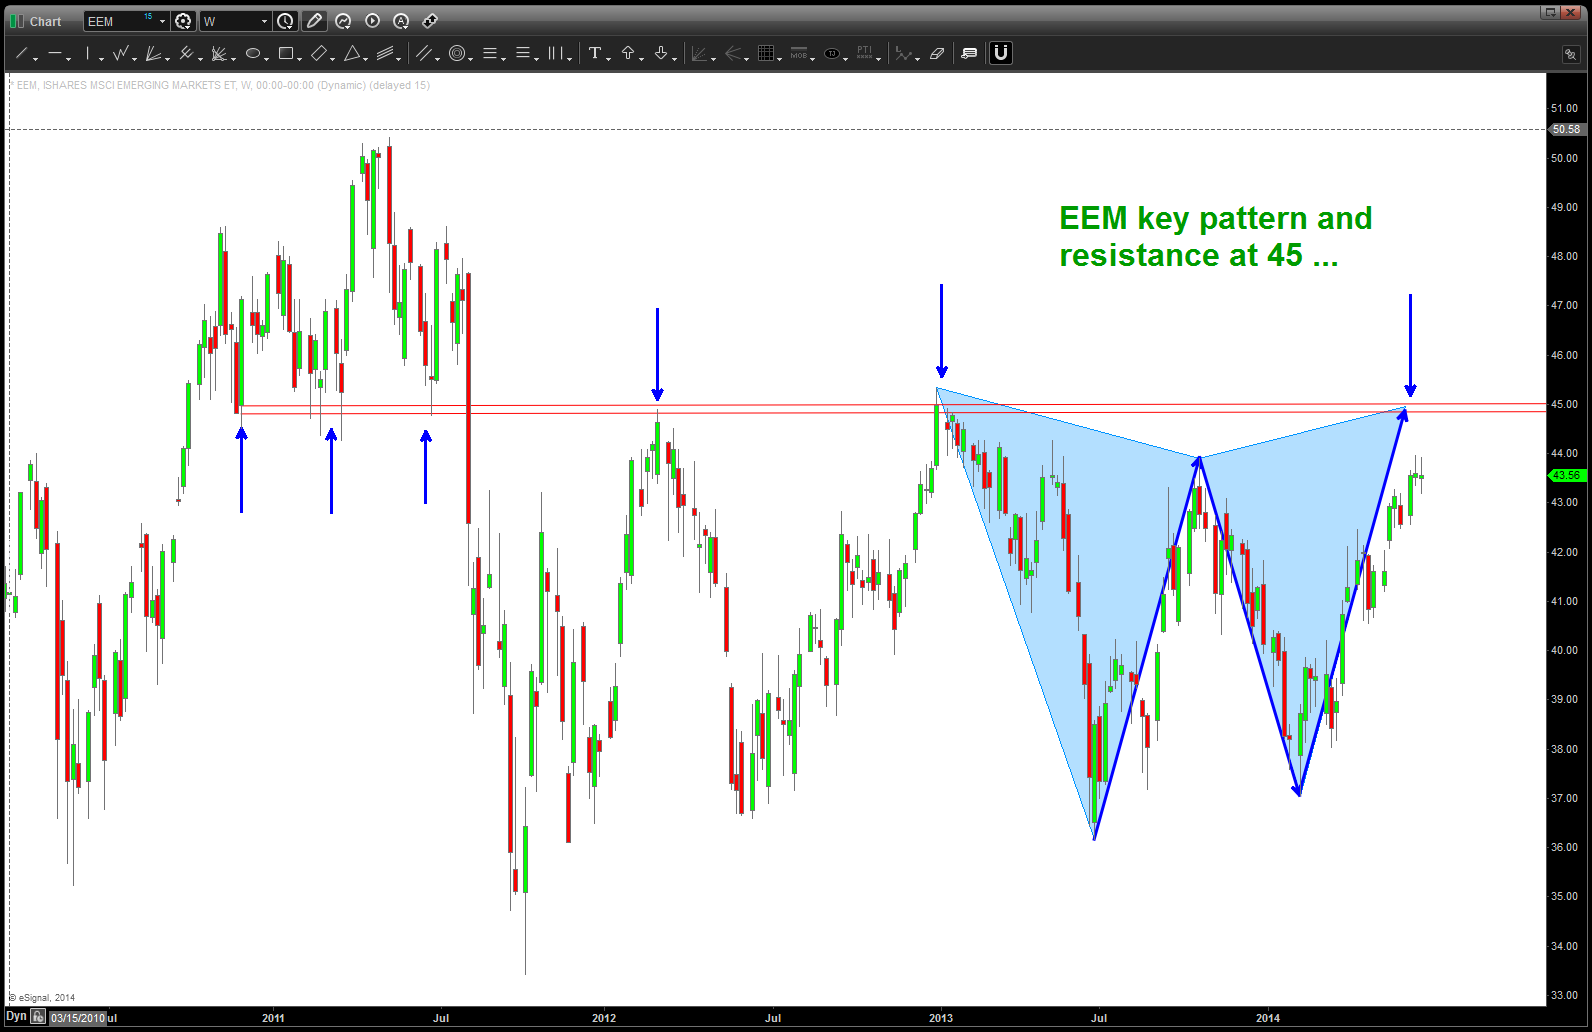
Emerging Markets and Crude …
Posted on June 22, 2014 2 Comments
CLIFF NOTES: note on the EEM chart below the “time” and “price” pattern that has completed for time but, perhaps, we’ll got up and see 45 as the target. This is very key as it has held the EEM back for over a year. The basic concept of polarity is shown w/ regard to the blue arrows. Now, take a look at the second chart – it’s Crude and EEM on top of each other. They have moved pretty closely together … so, now, the EEM chart get’s interesting. Our thesis is that the EEM pattern will fail – which will send Crude higher OR it will work causing a sell off in the EEM here or around 45 and therefore exert pressure on Crude Oil. Note, Crude closed at the .786 last week ..
Nothing to do, yet. But watch these levels .. .closely.
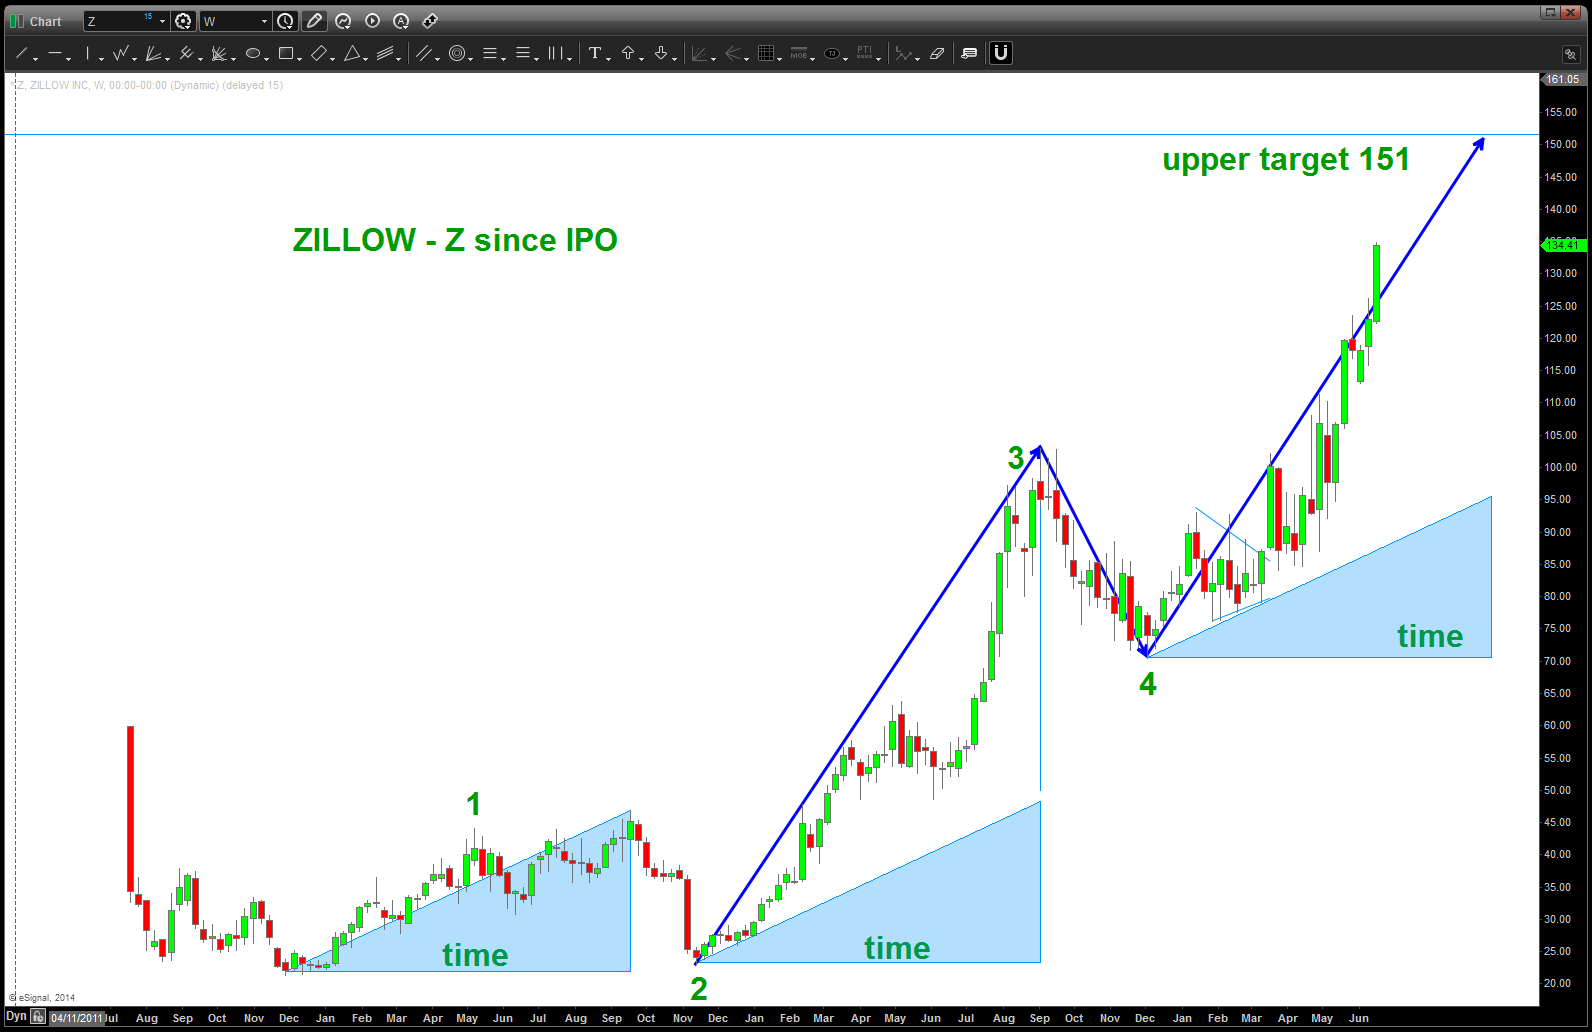
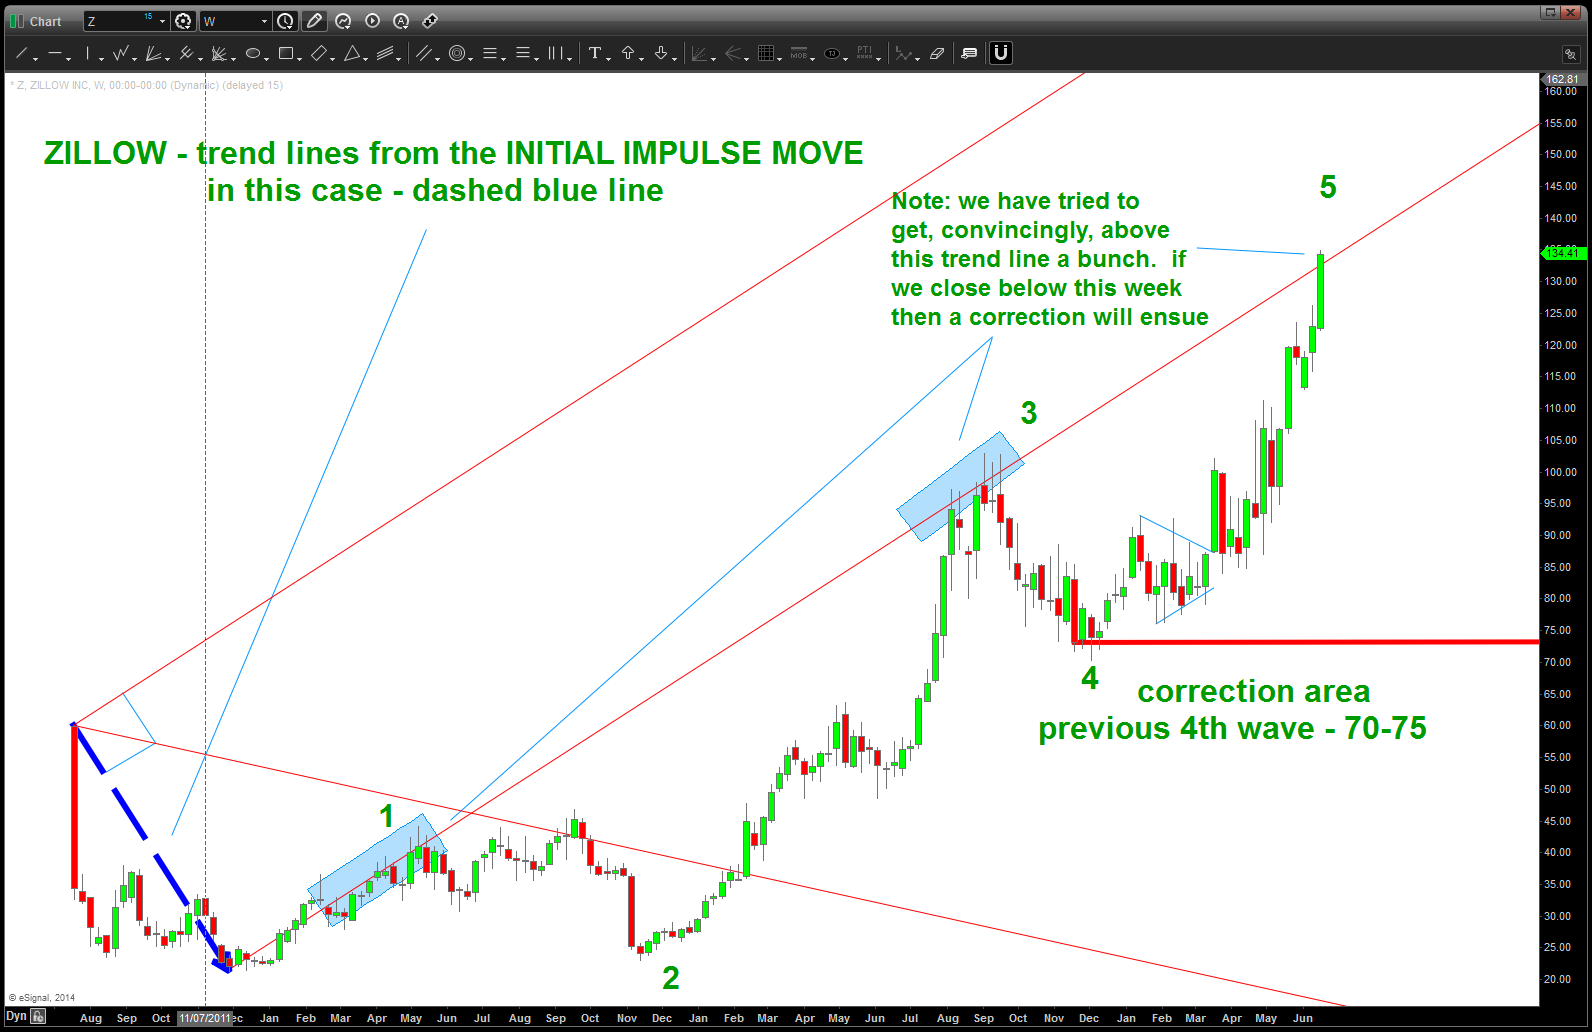
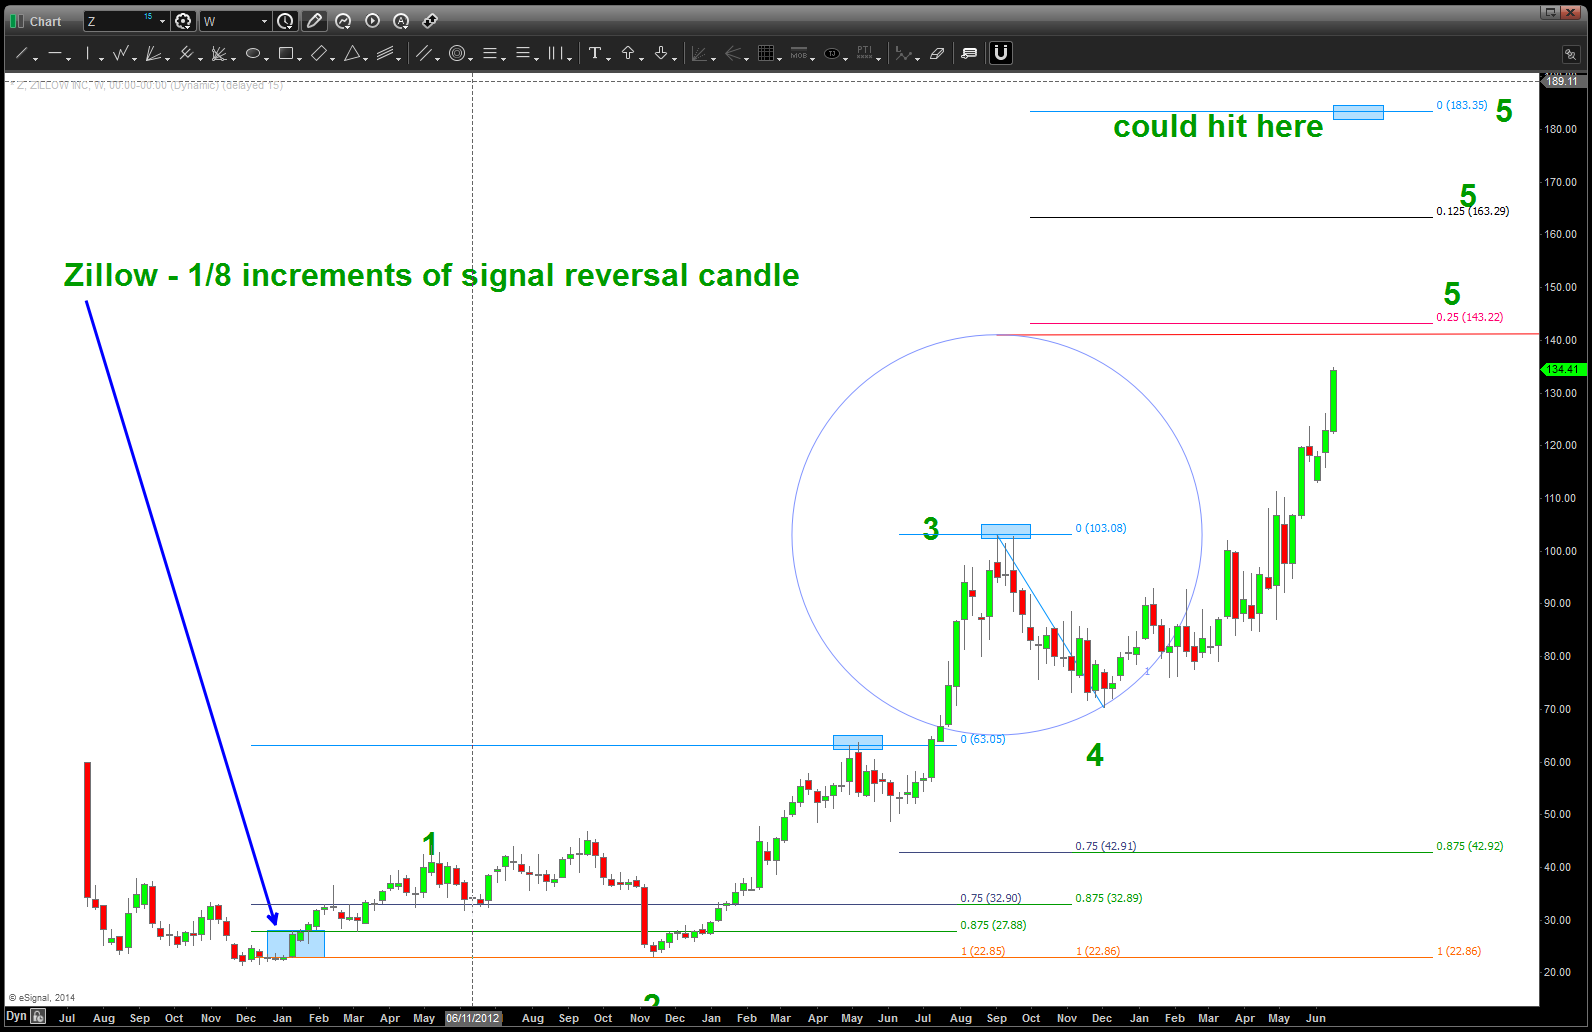
ZILLOW
Posted on June 22, 2014 Leave a Comment
CLIFF NOTES: case can be made for 5 waves. 5th is in progress w/ some targets noted below. Bottom line is this puppy (much like IBB) has NEVER broken a swing low in this run so run w/ this one until a swing low is broken on a “closing weekly basis.” This count sure looks like we are in a 5th and the geometry sure looks like it’s “just starting” to go parabolic.

INTC on the move
Posted on June 20, 2014 Leave a Comment
CLIFF NOTES: INTC is on the move breaking thru and CLOSING (KEY) at the high end of the range, above a 9 year resistance line and now testing the higher end of the bearish resistance zone on the RSI. The base it has moved up from has carved out an inverse head and shoulders in addition to basing for 10+ years. Watch this stock for leadership.
GAMEPLAN is, however hard it is, to let this move go and then look to buy the “outside return” against the neckline around 28. Initial targets are shown …
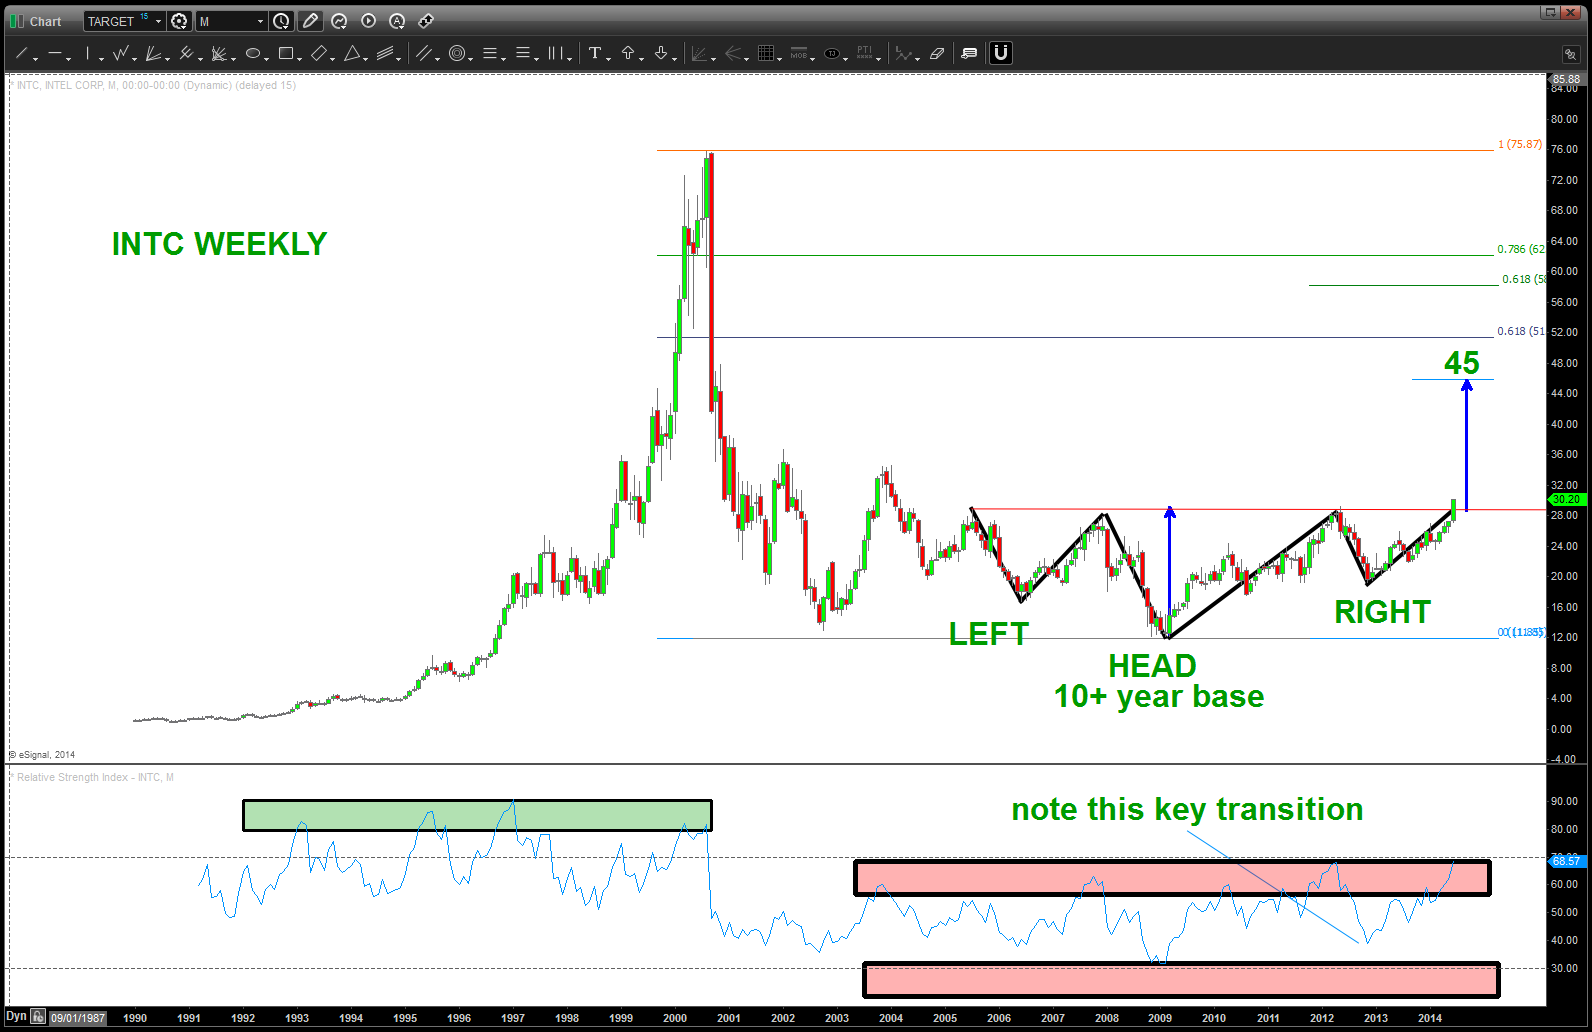
INTC WEEKLY
Now, we need to ask ourselves, how is the stock doing against the NASDAQ? This is where we go to our ratio analysis and look at the picture below … banged right off the .786 retracement level and perhaps this is a rotational play by the institutions. What a nice picture …
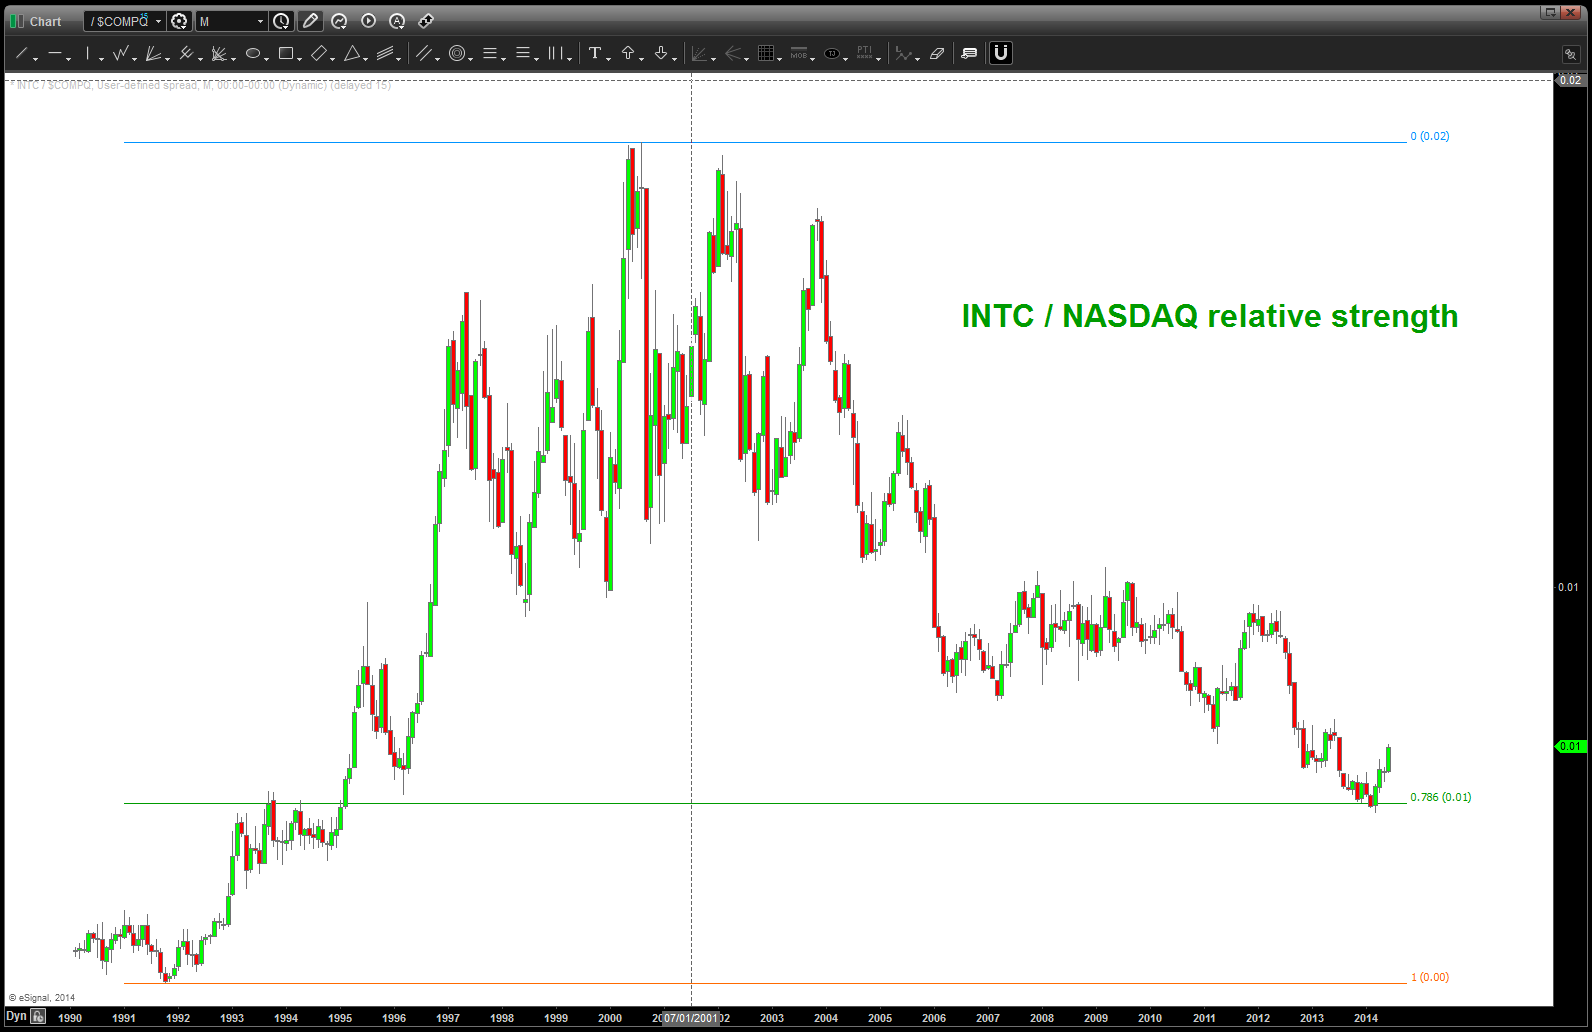
ratio analysis of INTC / NASDAQ
Gold game plan potential
Posted on June 20, 2014 Leave a Comment
CLIFF NOTES: prior Gold work – https://bartscharts.com//?s=gold
CLIFF NOTES 2: 1370 will be key to the last leg of a triangle, thrust DOWN and out of the triangle and then a BUY.
CLIFF NOTES 3: note the first chart. Again, it’s ratio analysis of GLD vs SPY. What we are looking for is a PATTERN to show a SHIFT in the relative strength of one security versus another. In this case, the S&P 500 has out performed, tremendously, the GLD since 08/2011. But look what just happened .. we completed a pattern at the .786 and 3 weeks ago,we found support and NOW it’s starting to move UP along w/ SPOT GOLD, ABX and the overarching Gold/Silver Index. A key development …
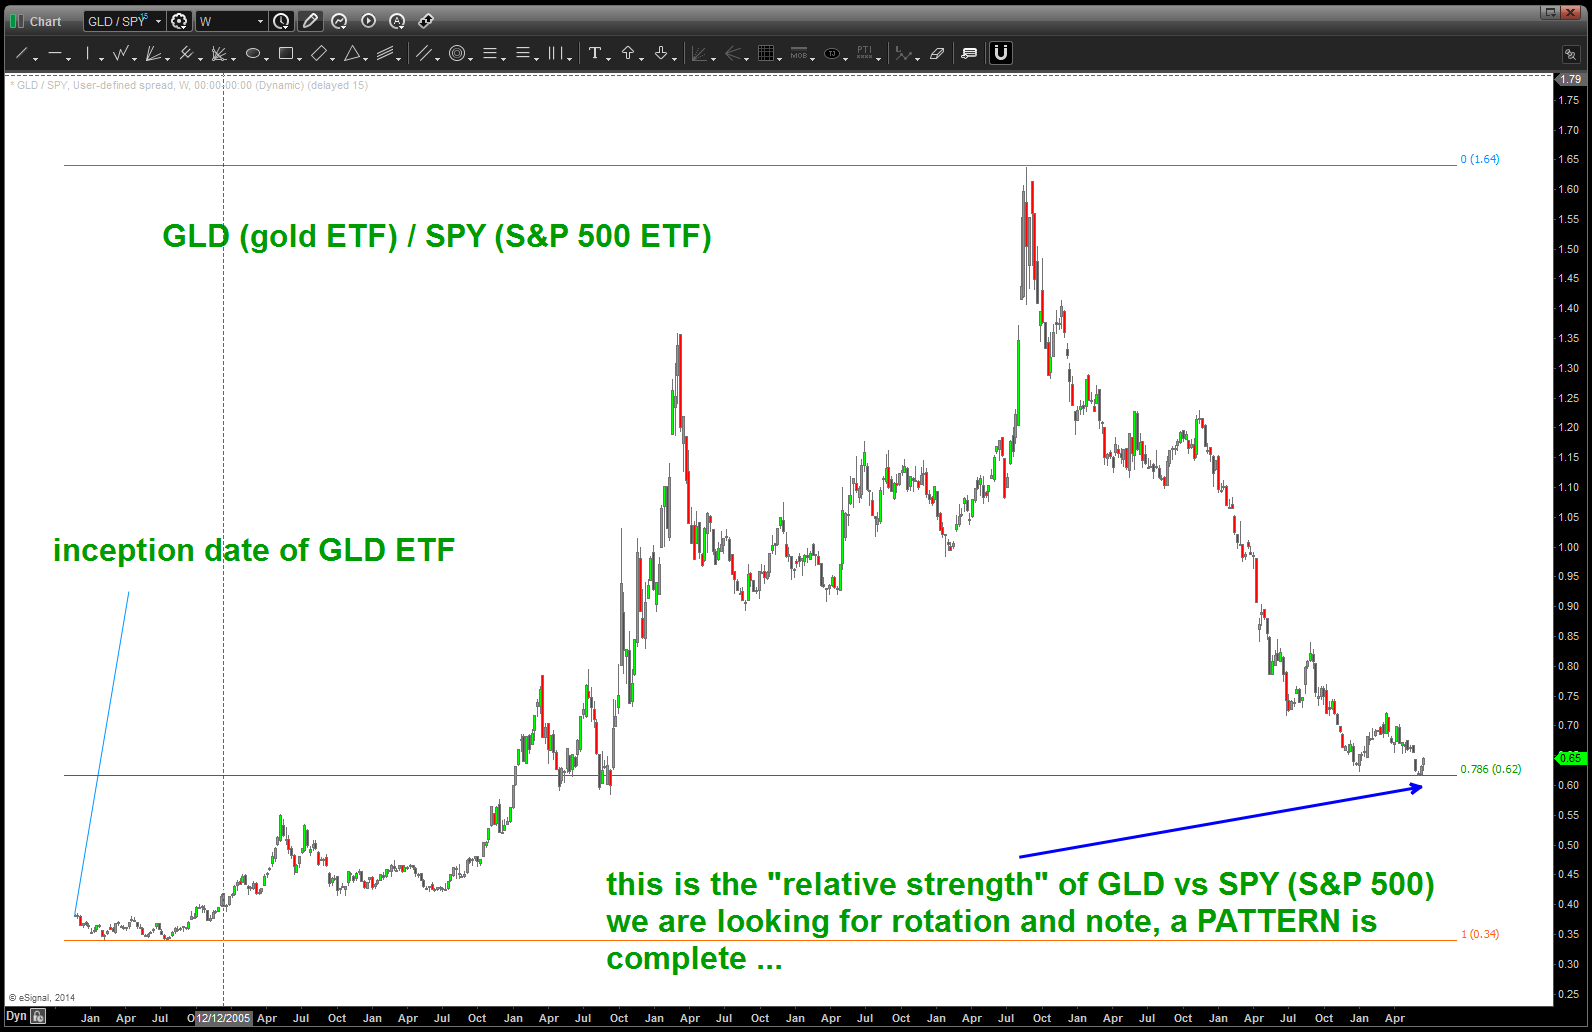
ratio analysis of GLD to SPY
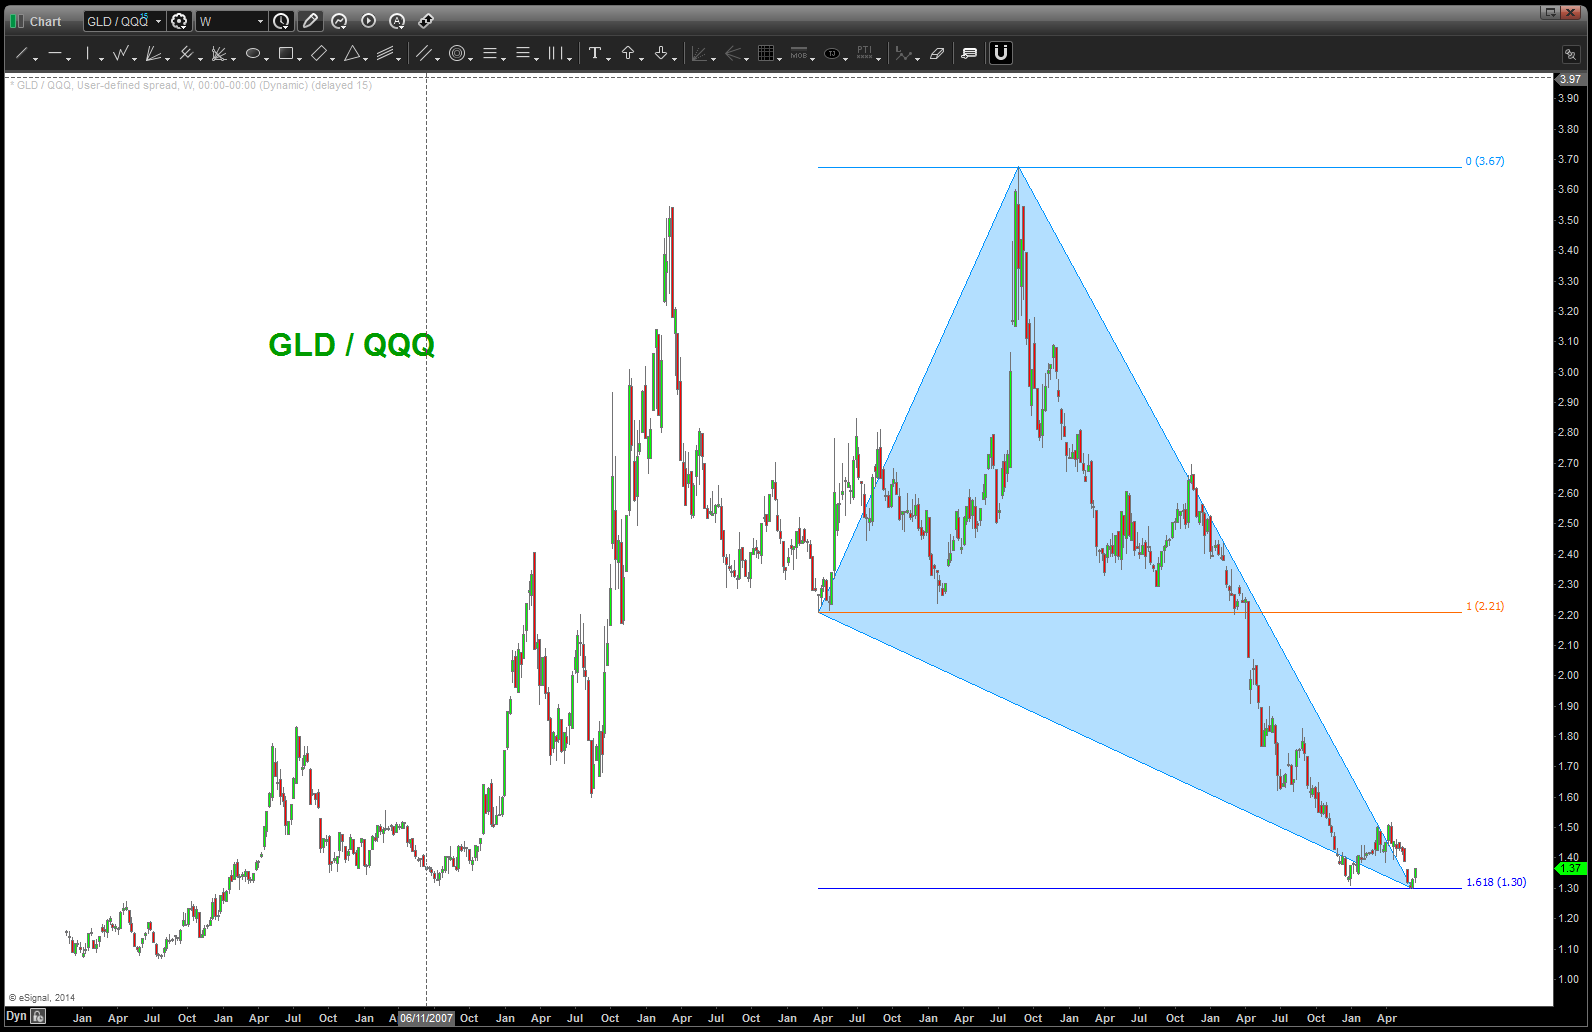
GLD vs QQQ
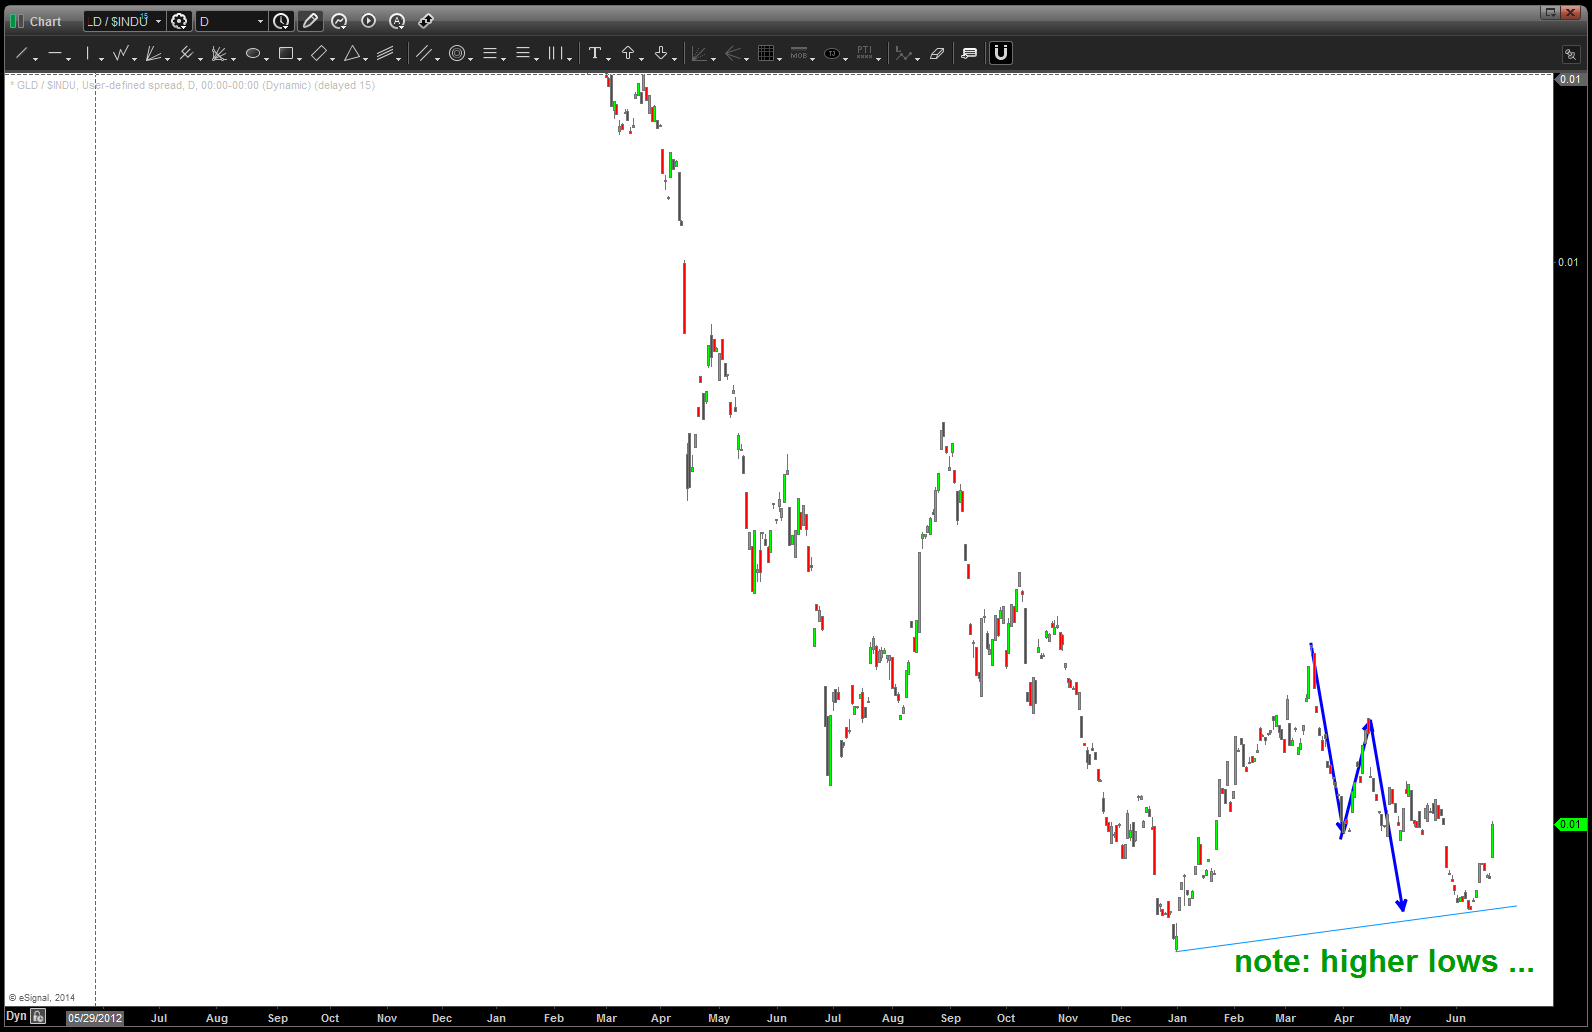
GLD / DJIA
THIS IS A CHART W/ HISTORICAL PRICES SINCE 1913
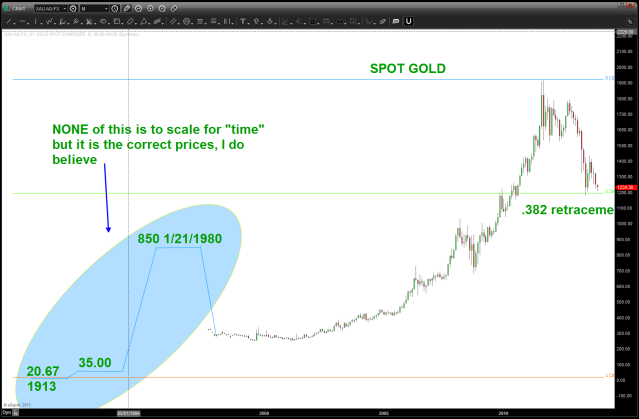
gold since 1913
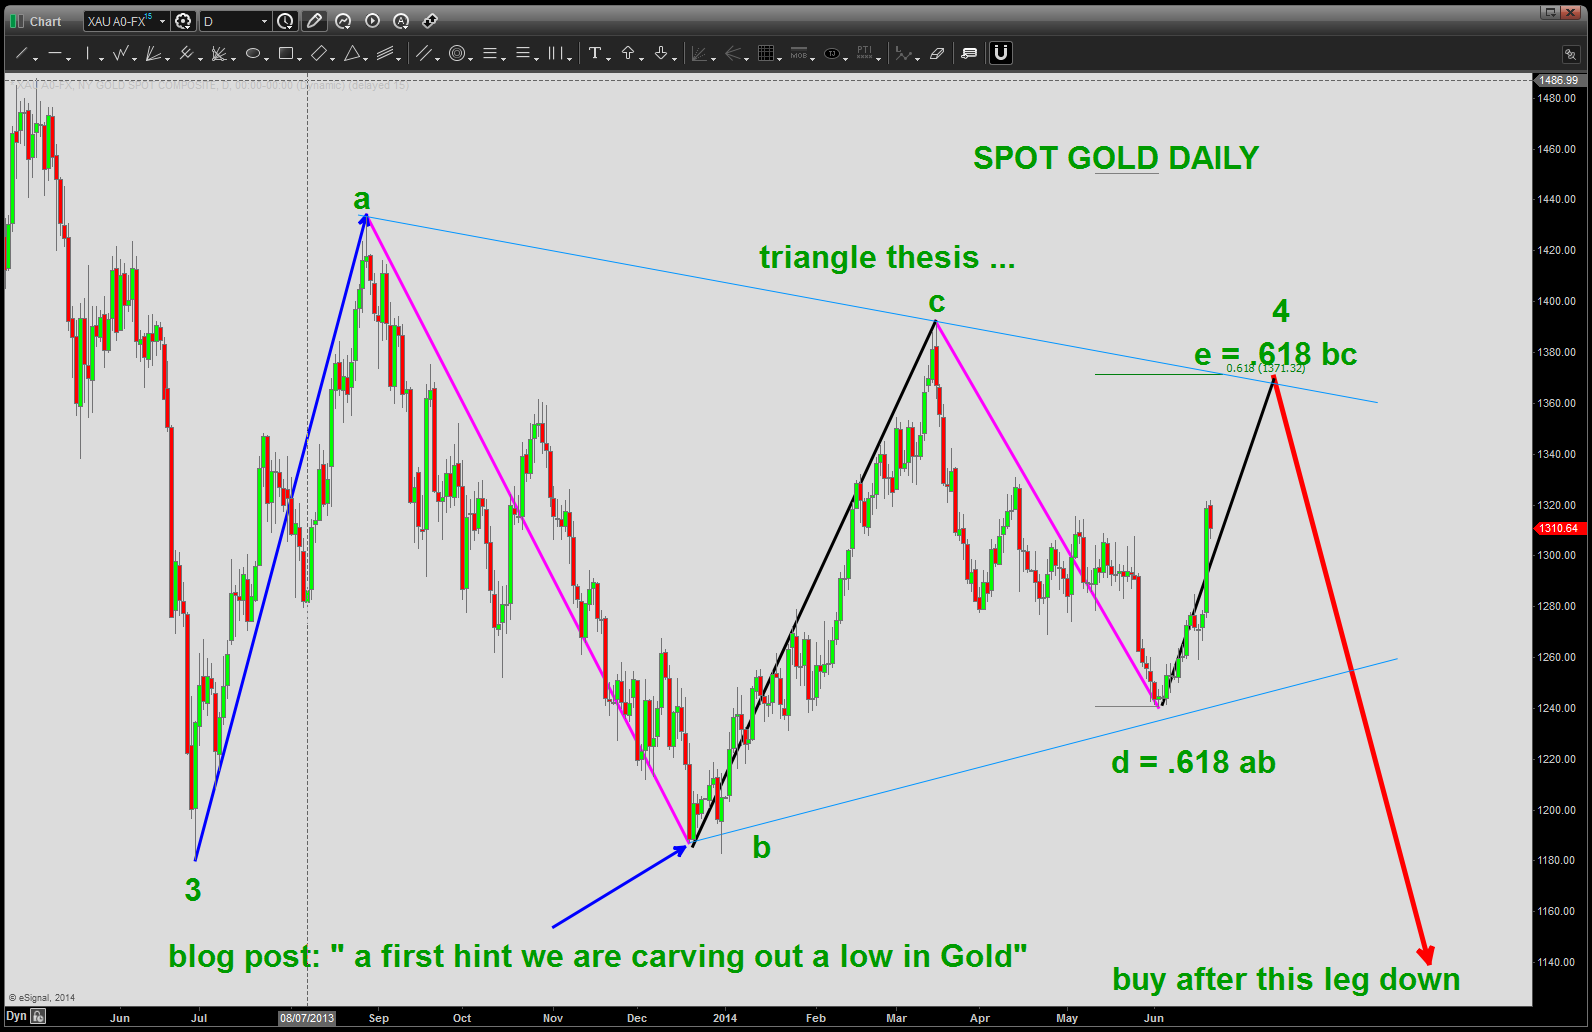
gold gameplan
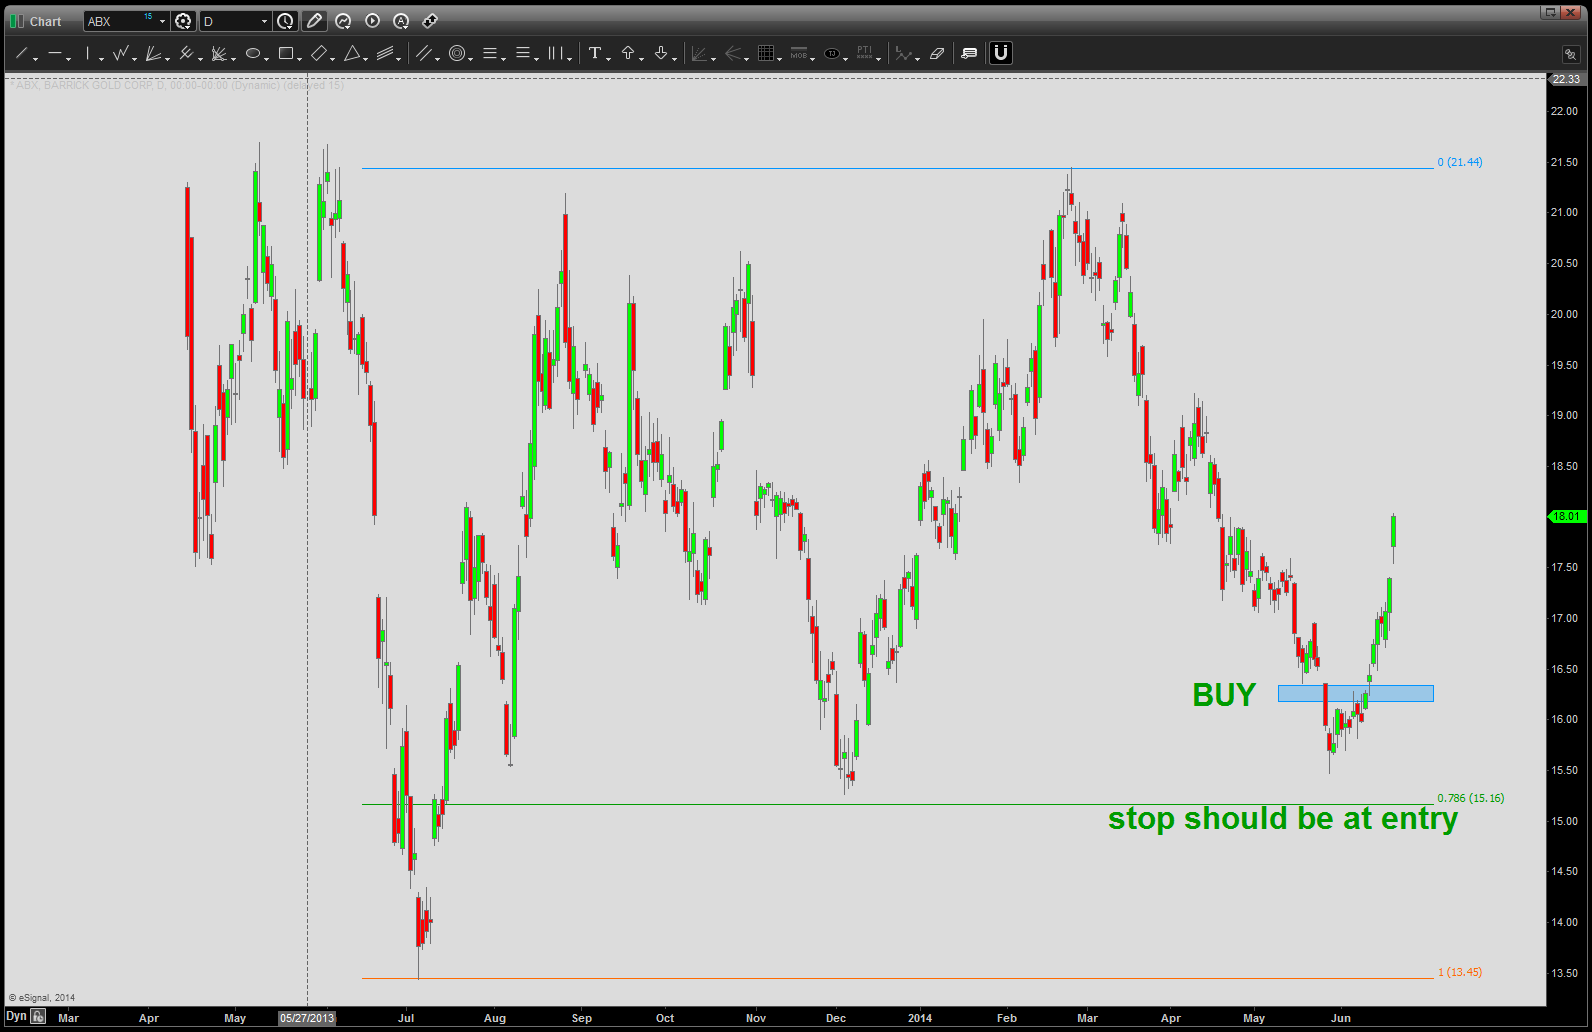
note ABX – Barrick Gold is confirming this move … a revisit of our BUY recommendation. ( https://bartscharts.com/2014/05/21/abx-buy/ )
ABX
Gold/Silver index appears to be on par to put in a MONTHLY signal reversal candle … (https://bartscharts.com//?s=gold+silver+index )
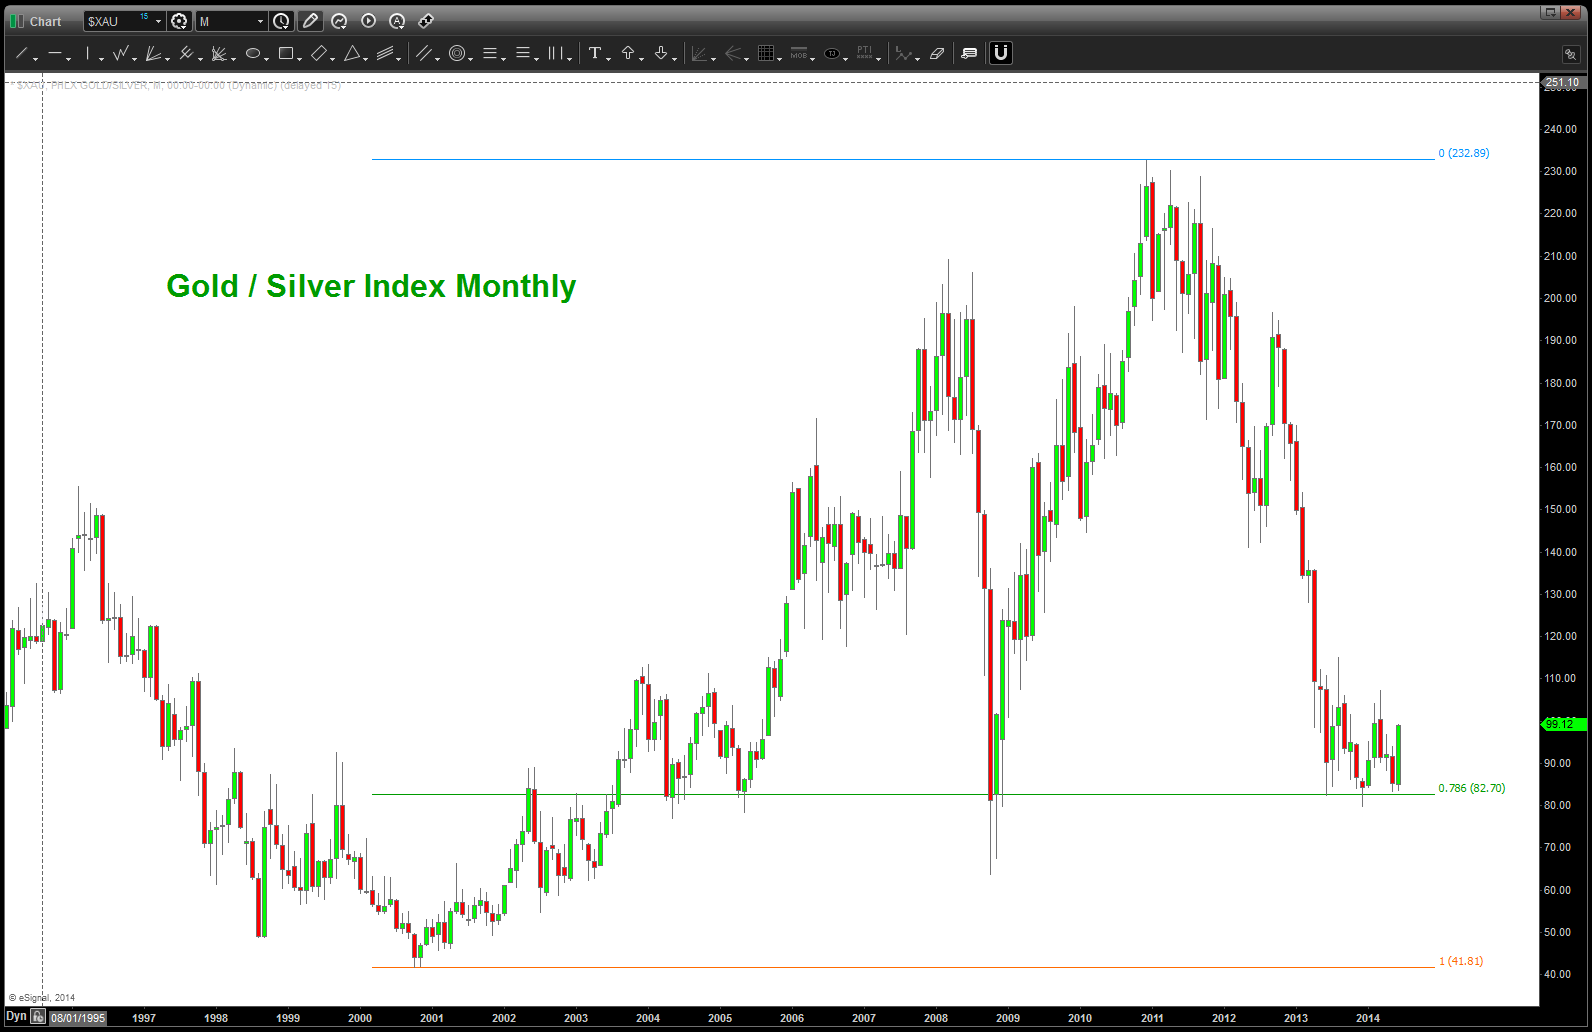
Gold Silver Index
Sugar – that was some gap up!
Posted on June 20, 2014 Leave a Comment
CLIFF NOTES: previous Sugar work – https://bartscharts.com//?s=sugar
CLIFF NOTES 2: am going to have to go back and “see” why 16 didn’t hold but we went thru our target area by a buck and are rallying again. Most recent gap, is to say the least, pretty impressive.
Folks, looks like it’s time to get on the Sugar train.
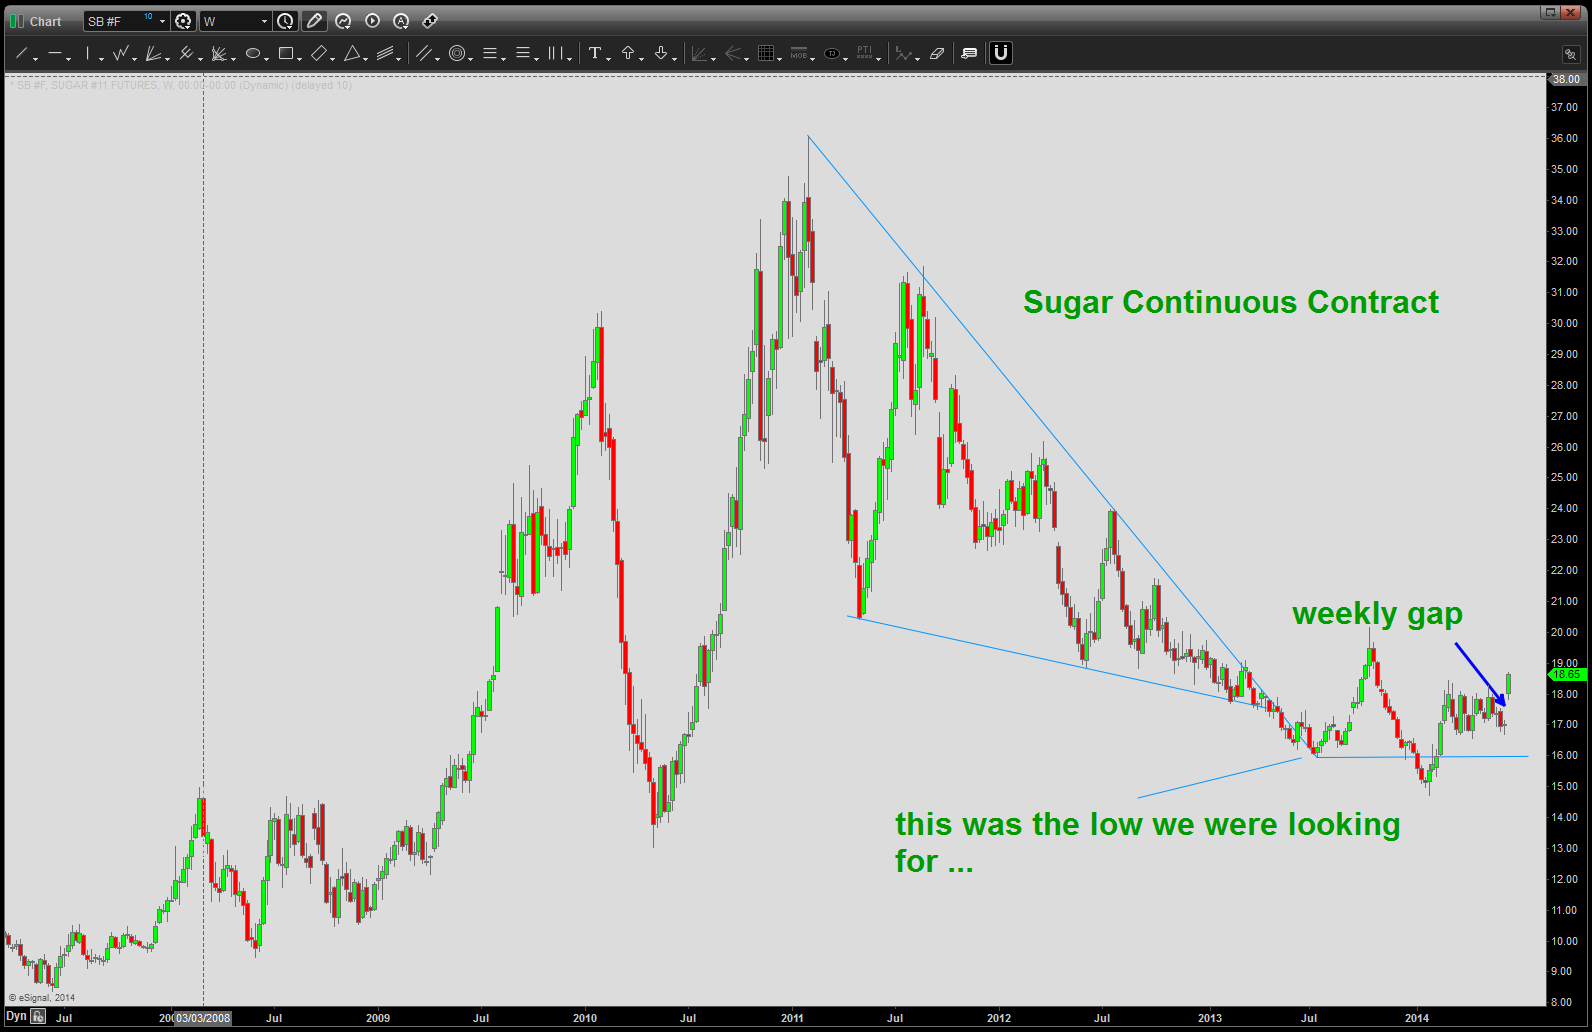
Sugar Continuous Contract
EURO gameplan w/ FED meeting on tap
Posted on June 18, 2014 Leave a Comment
CLIFF NOTES: trust your indicators.
MONTHLY RSI (blow up) – when I use to teach the capstone CMT Level III course RSI portion I used to say “look for the key transition.” The market will tell you when it’s “shifting a grid,” so to speak. The Monthly RSI is showing us that the BEARISH RESISTANCE zone 55-65 have held every rally attempt…HOWEVER, NOTE THAT THE LOWER END OF THE BEARISH SUPPORT ZONES HAS NEVER BEEN TOUCHED AND WE HAVE HIGHER LOWS. Talk about a mind screw … the resistance zones are clearly showing a BEAR market while the lower end is almost right in between the lower zone of BULLISH support and BEARISH support ON THE RSI. Folks, that’s a triangle for you. One of the other things that I used to teach is the vaunted “RSI M” and note at current levels we have an M formed at the end of a 1.5 year leg. We have to wait for the end of the month to see if it closes below that horizontal blue line, so be patient if you are a longer term swing trader – like me. MONTHLY RSI CONCLUSION: a hint to the downside, but no major grid shift evident (a BEAR or BULL market) evident till we test the RSI support zones.
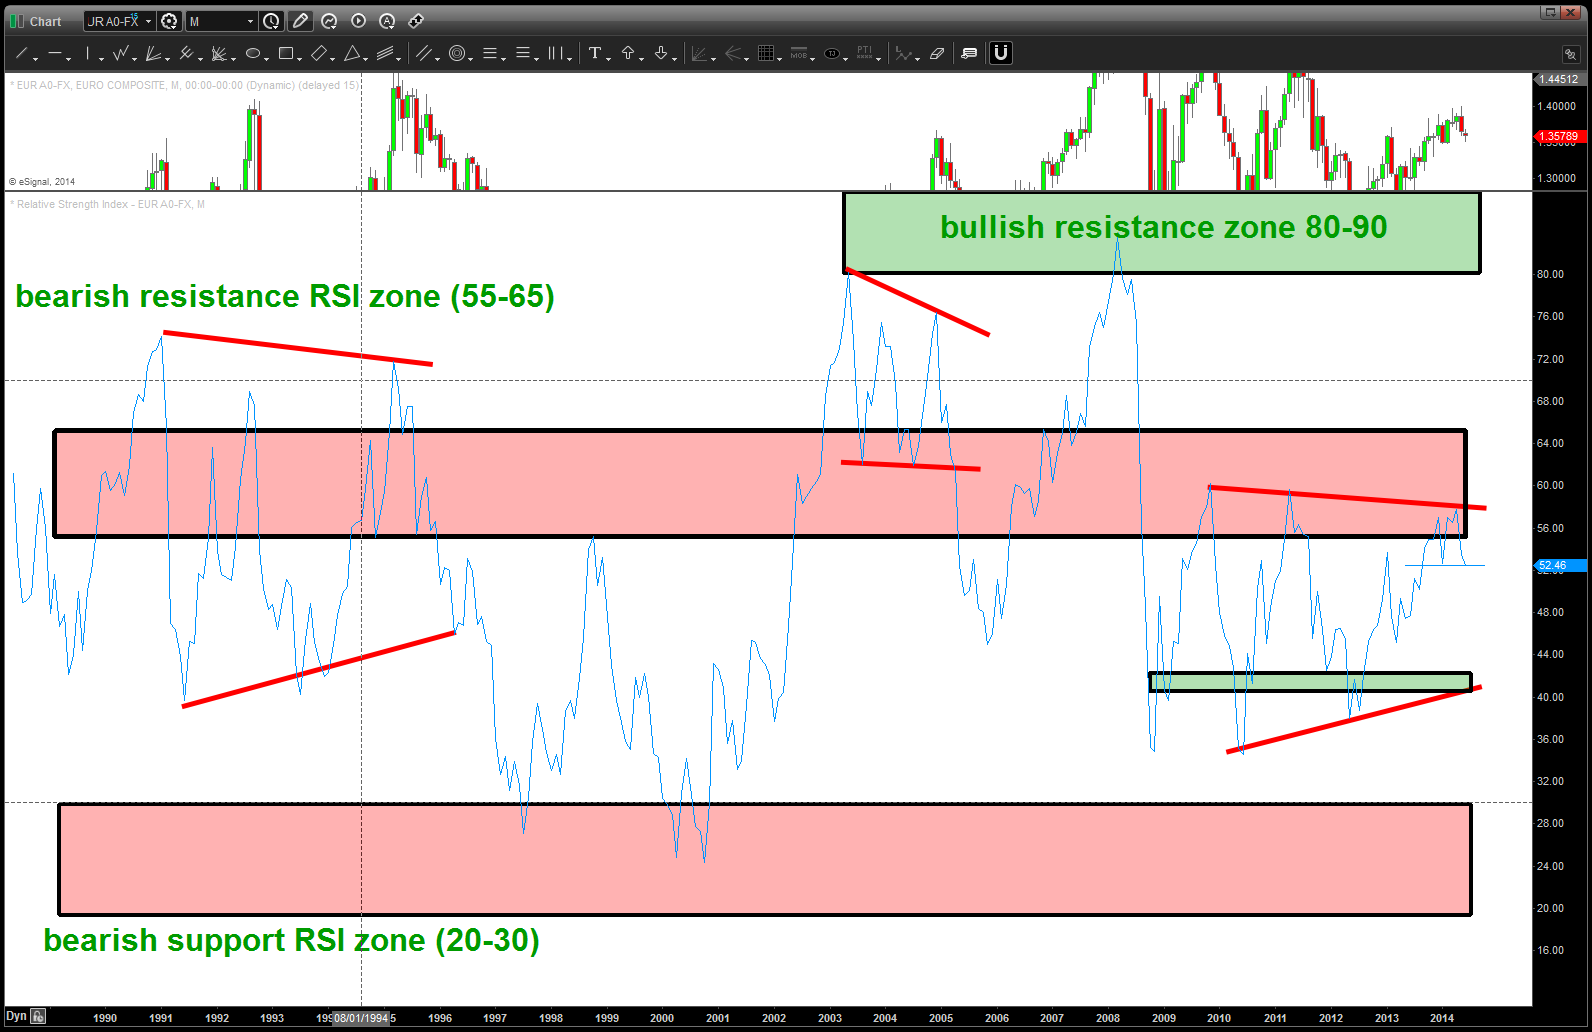
EUR vs USD Monthly RSI study
Weekly RSI: The bearish RSI resistance zone has worked, like the monthly throughout this long, consolidated 5 years. As we dove into lows at the 1.2 level notice we even went to bottom of the RSI bearish support range. BUT THEN A KEY TRANSITION OCCURRED !!! The market came down and bounced off the TOP of the RSI bearish zone (30) and then the next support range bounced right off the lower end (40) of the BULLISH RSI support zone (denoted by the green horizontal line on the RSI) Folks, this is the “grid shift” we discussed and really throws this into a neither BULL or BEAR state of affairs. An, notice the “depth” of the RSI correction in comparison to the move in price … RSI dove for the deck, price corrected buy not “that much” and we found support right on the BULLISH RSI SUPPORT zone. Folks, this is, actually a BULLISH weekly RSI indication. WEEKLY RSI CONCLUSION: oversold finding support on a BULLISH RSI support zone … a continued bounce up in the foreseeable picture?
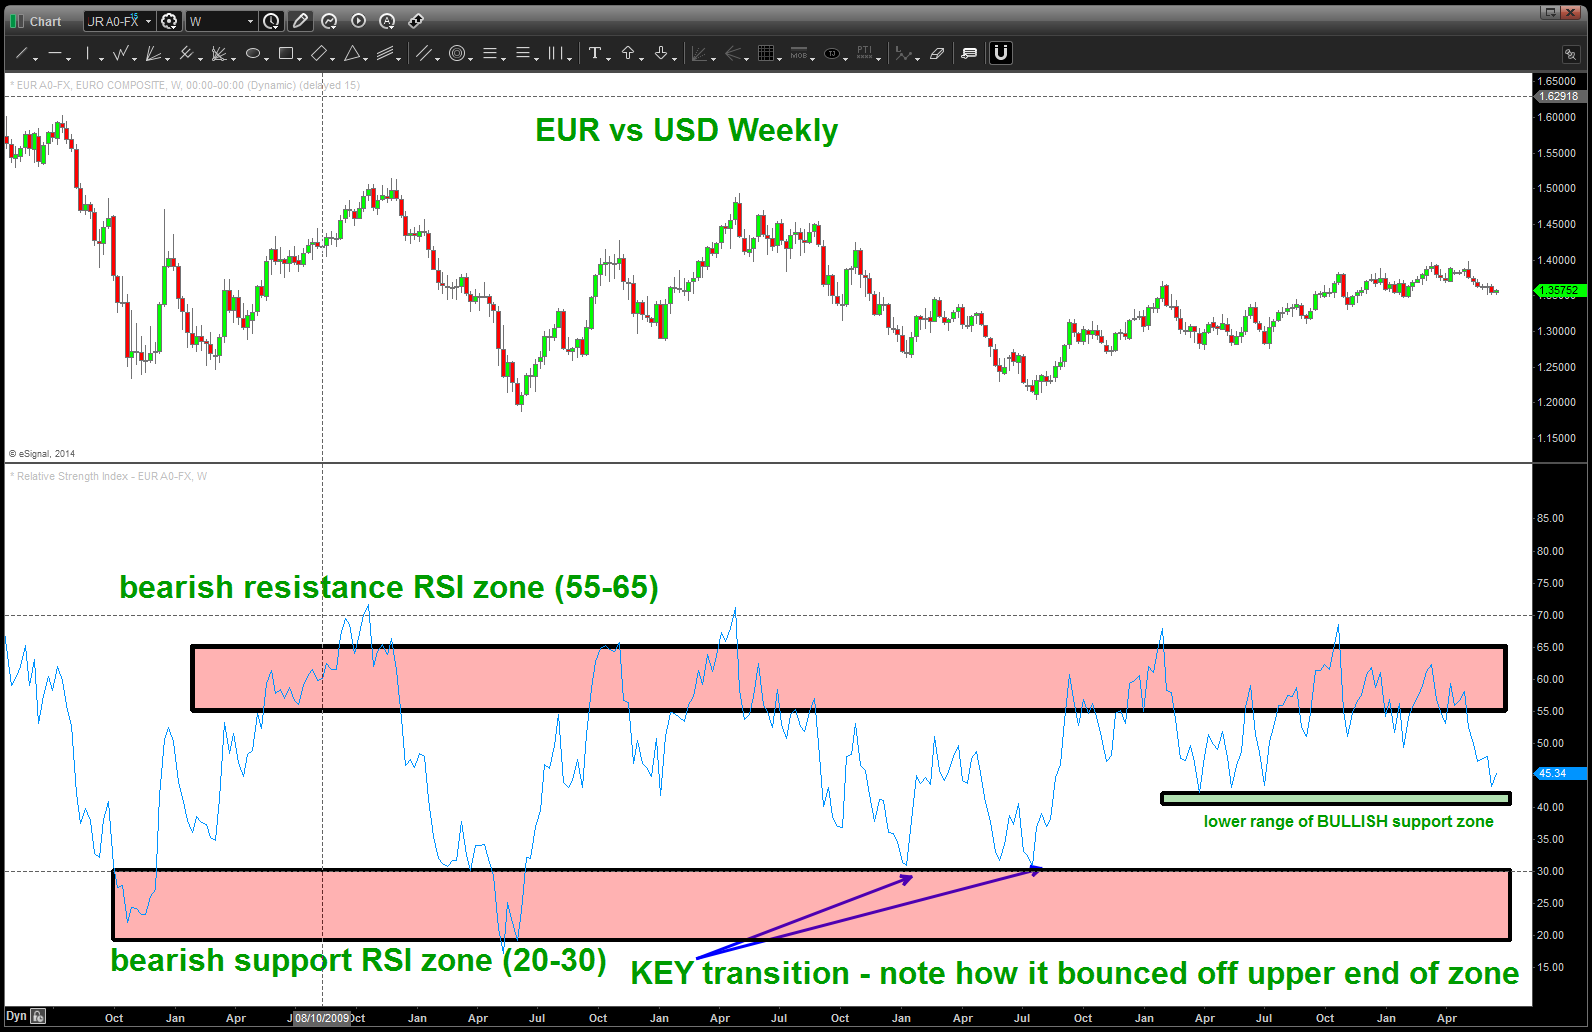
WEEKLY RSI Study EUR vs USD
DAILY RSI: key here is as we were making HIGHER highs from Oct 2013 to present, the RSI was making LOWER LOWS …KEY IS right at the upper end of the bearish RSI zone resistance. Then, as we dove down from the highs made in May ’14, we found SUPPORT in the BEARISH RSI SUPPORT ZONE. The Daily chart is telling us we are working into a bearish break.
Given this look at the longer term RSI’s we now can state that since the highs in 09′ the BEARISH RESISTANCE ZONES have held and that has been marked by LOWER HIGHS. However, the contracting nature of the price action is such that on a Monthly and Weekly basis, the RSI transitioned to finding support in the BULLISH RSI band. In this type of situation a triangle or contracting type of price action is evident and, most everyone, get’s chopped up like the meat grinder in Pink Floyd’s The Wall.

the triangle meat grinder
in a triangle, the corresponding waves are supposed to be .618 of each leg the proceeded it … in this case our UP moves are .886 (exactly) and .618 that makes up the “e” leg of this potential scenario. This is important … please see below:
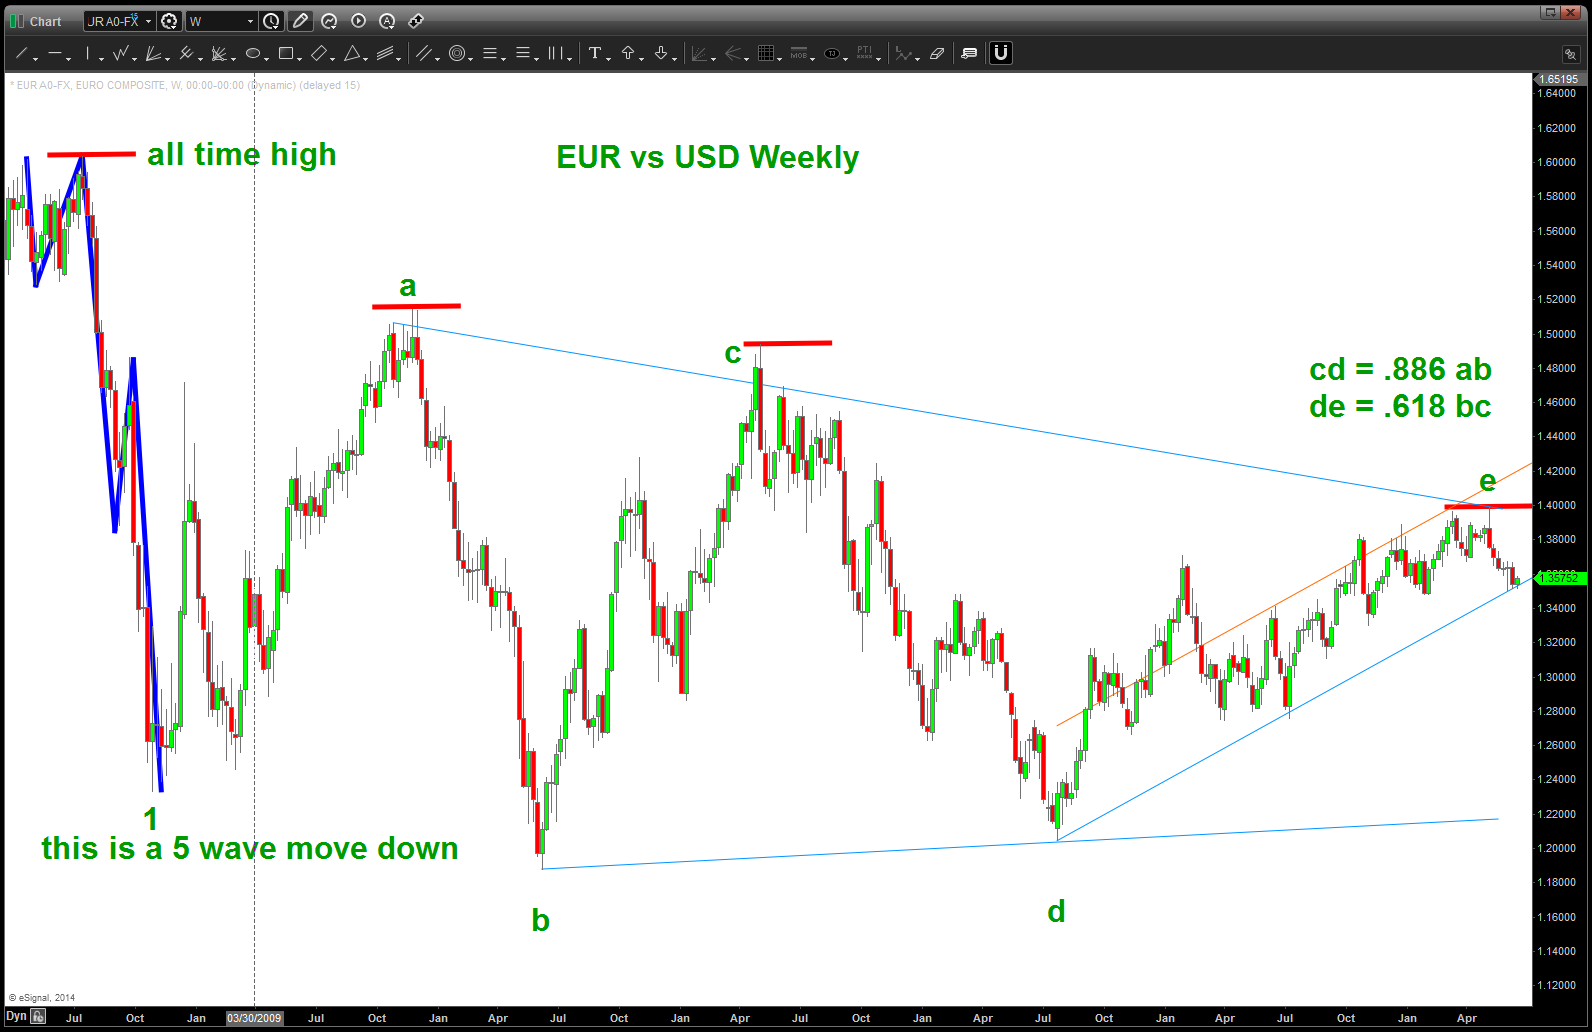
EURO bearish triangle
also, note that from the high we traced a 5 wave move down (bold blue lines) that do not break any “counting rules.” So, the ramification is this is 2nd or perhaps B wave triangle completing and we are starting a 3rd of 5 down or a C wave. Time will tell …
So what do we do to position?
1. there is a “minor” pattern completing in/around 1.3620. I don’t like this because the pattern “isn’t complete” w/ regards to C
2. we have a flat completing around 1.3680. that “could do it” but w/ the FED talking a BIG OLE’ BUY program could rip this thing 100-1550 pips easily.
I would expect each of these areas to be resistance zones but …
3. I really like the 1.3800 area due to a LOT of numbers coming together and the “pattern” completing and making sense.
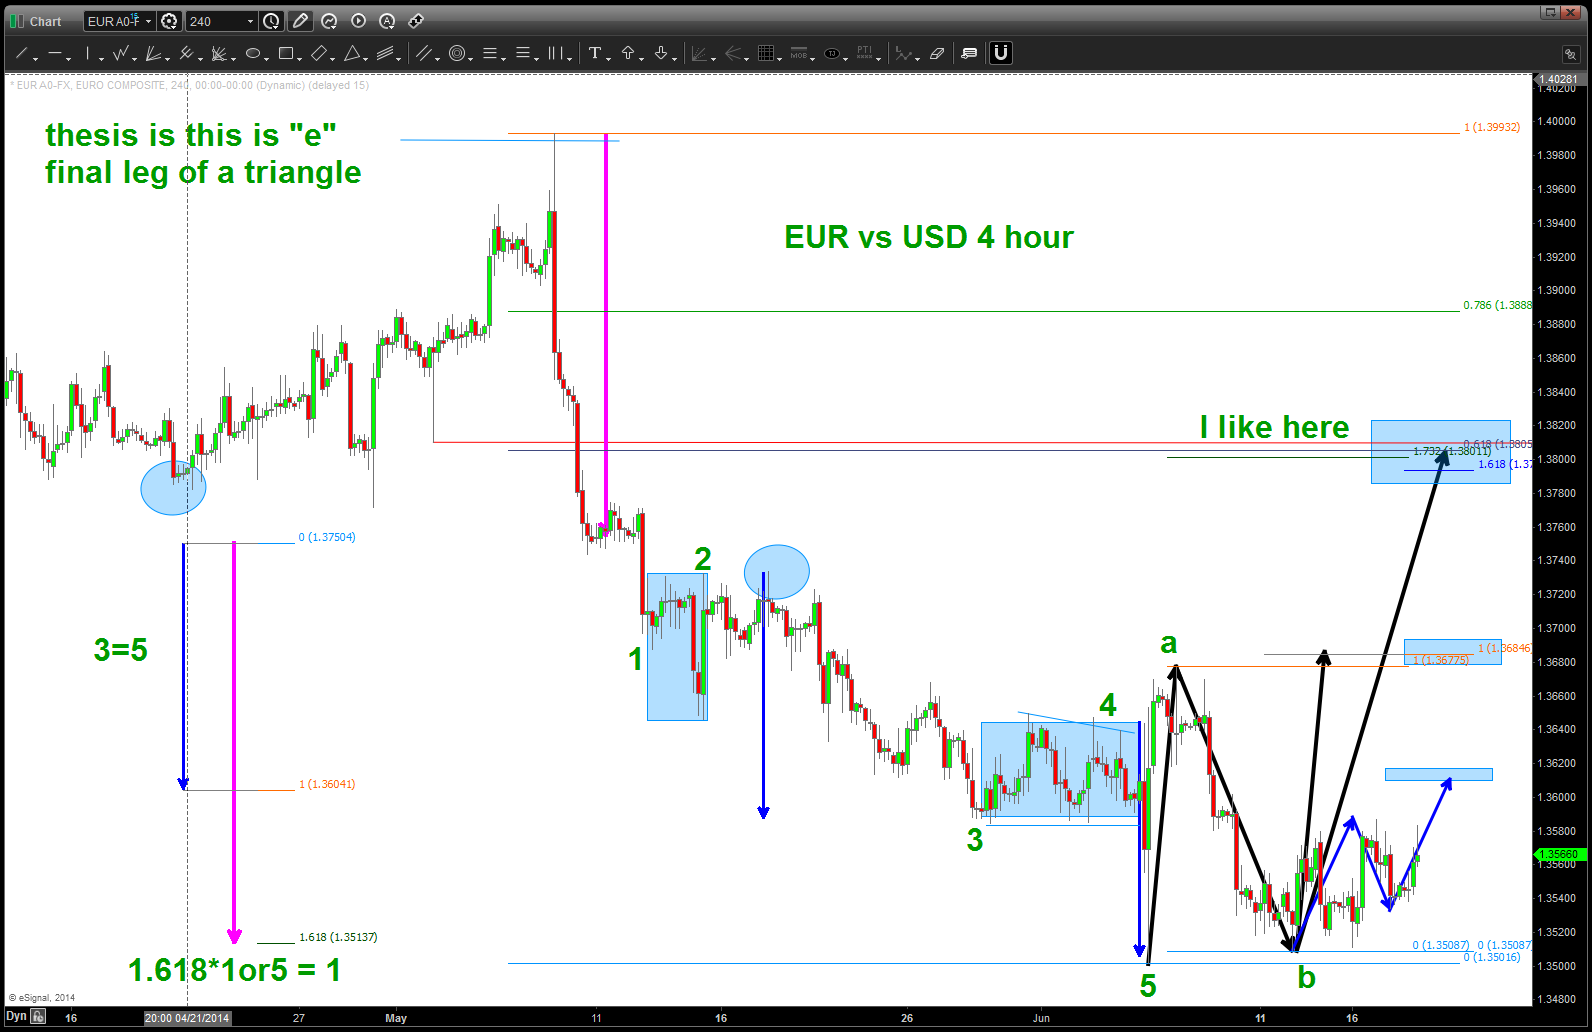
EURO 4 hour intraday
My “hope” is that we do not break thru the lows but RALLY UP into the targeted short zone….guess only time will tell but here is a pretty well thought out gameplan.
Enjoy the ride …
WYNN should go back to 175
Posted on June 15, 2014 Leave a Comment
here is the work leading up to the HIGH in WYNN: https://bartscharts.com//?s=wynn
here is an updated look … case can be made for a move back to 172-176. Note the swing lows …
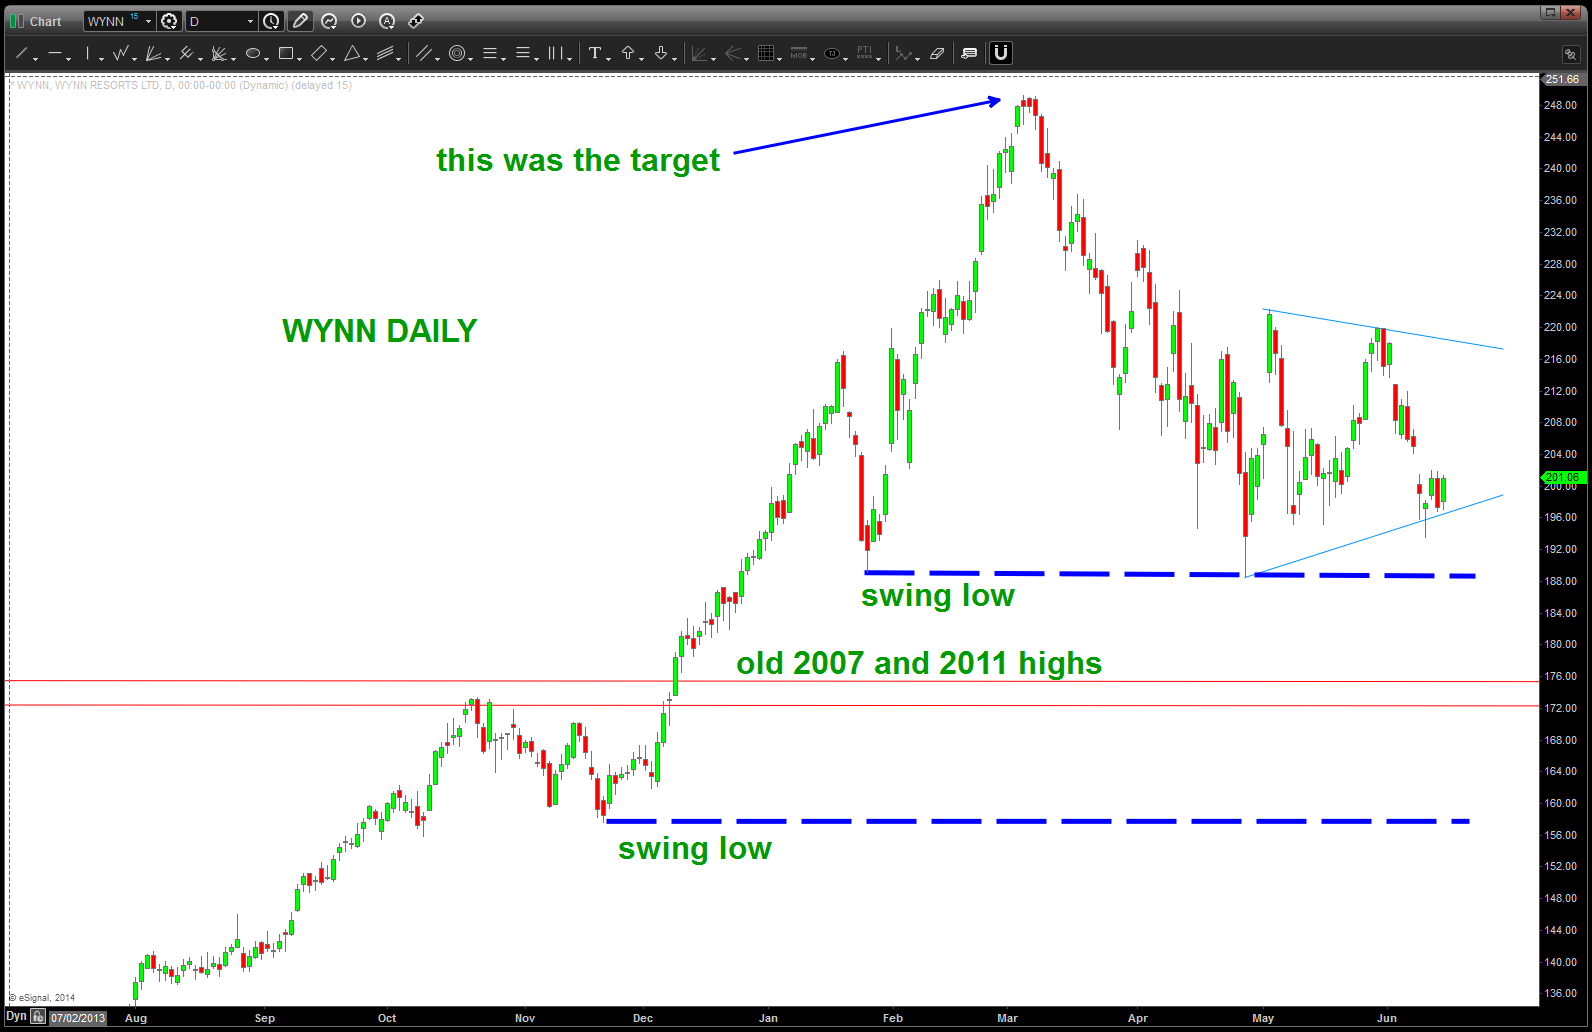
WYNN
