FXI and Copper
Posted on June 15, 2014 Leave a Comment
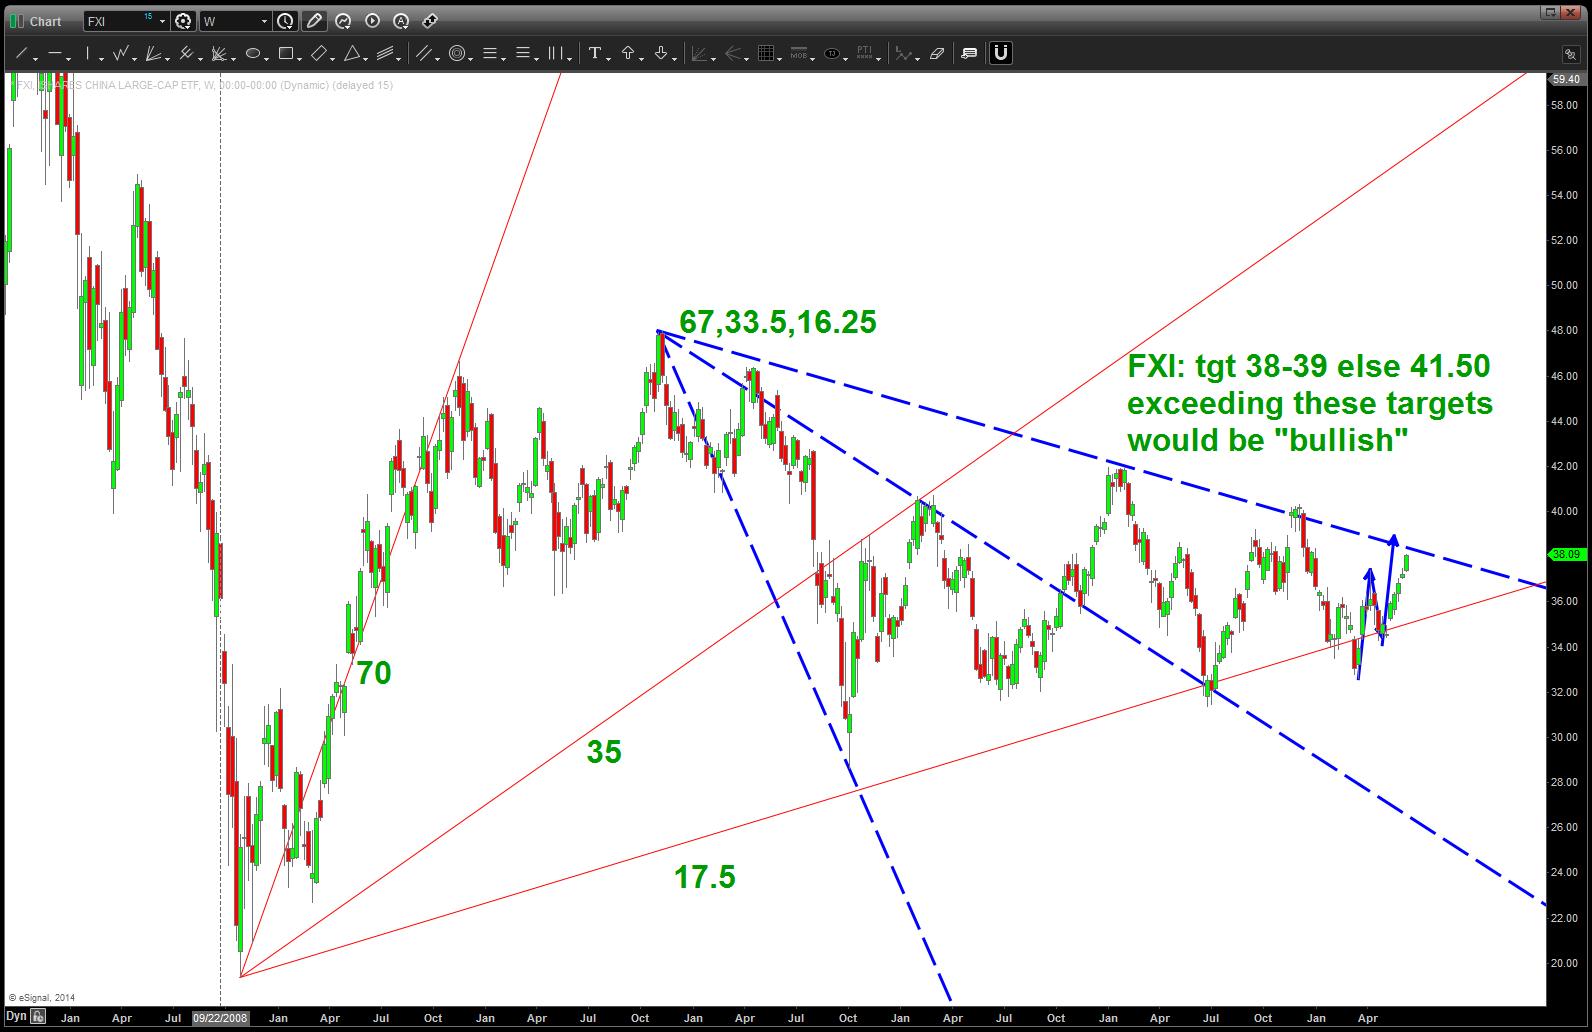
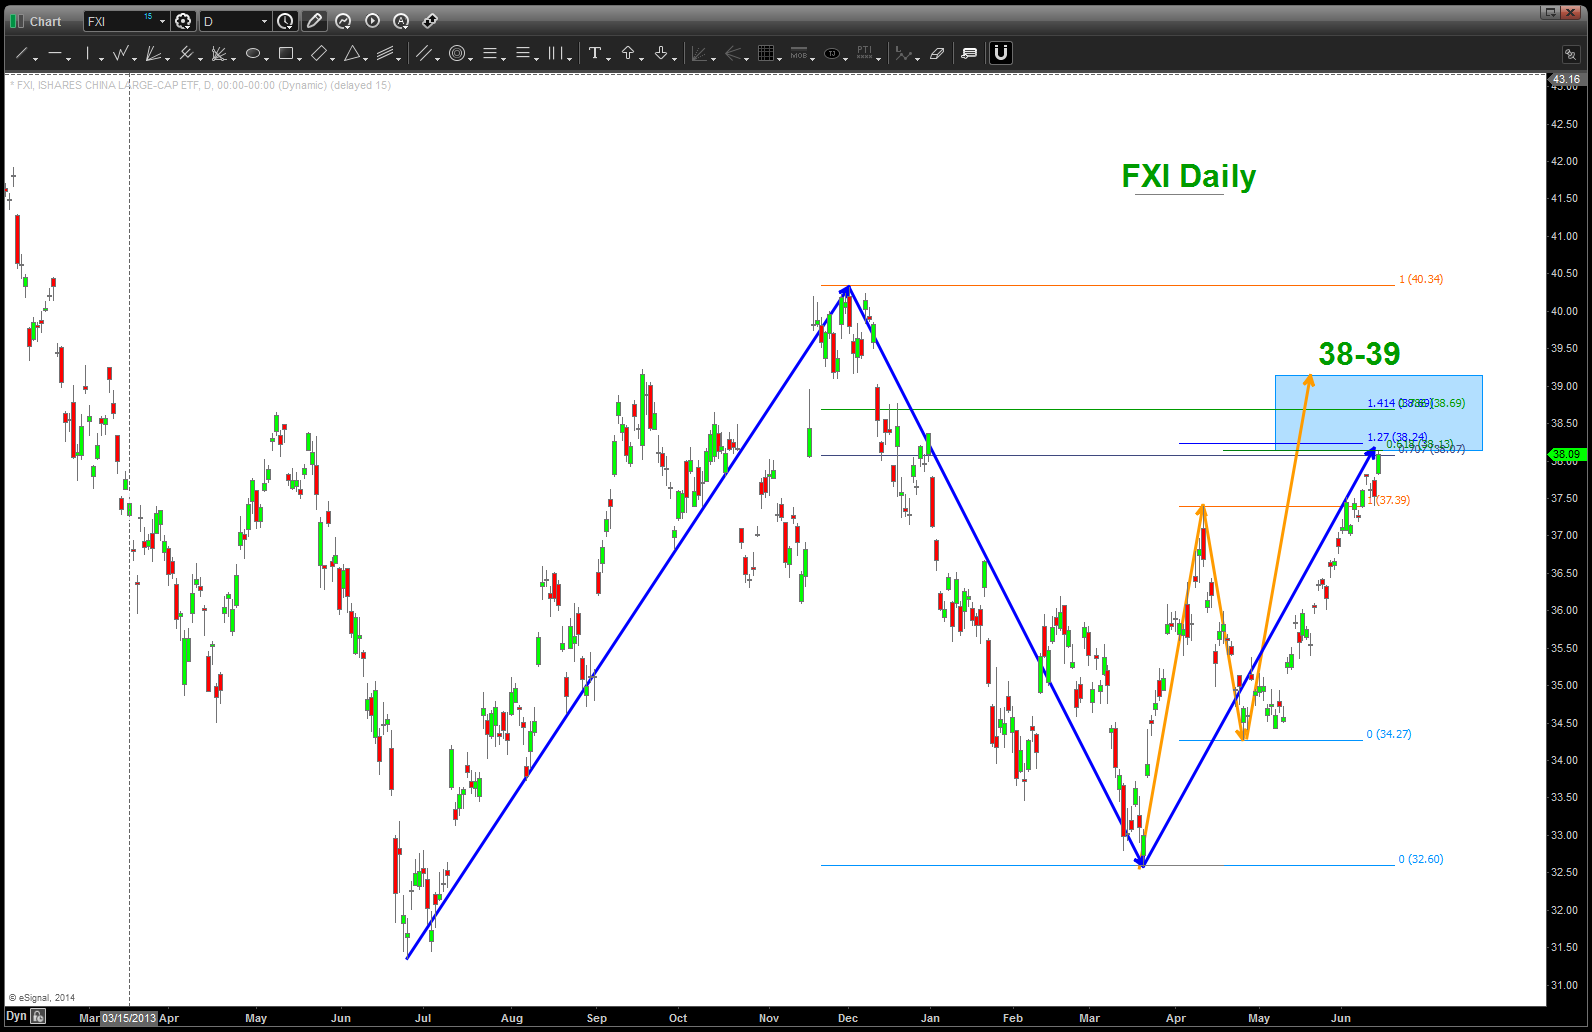
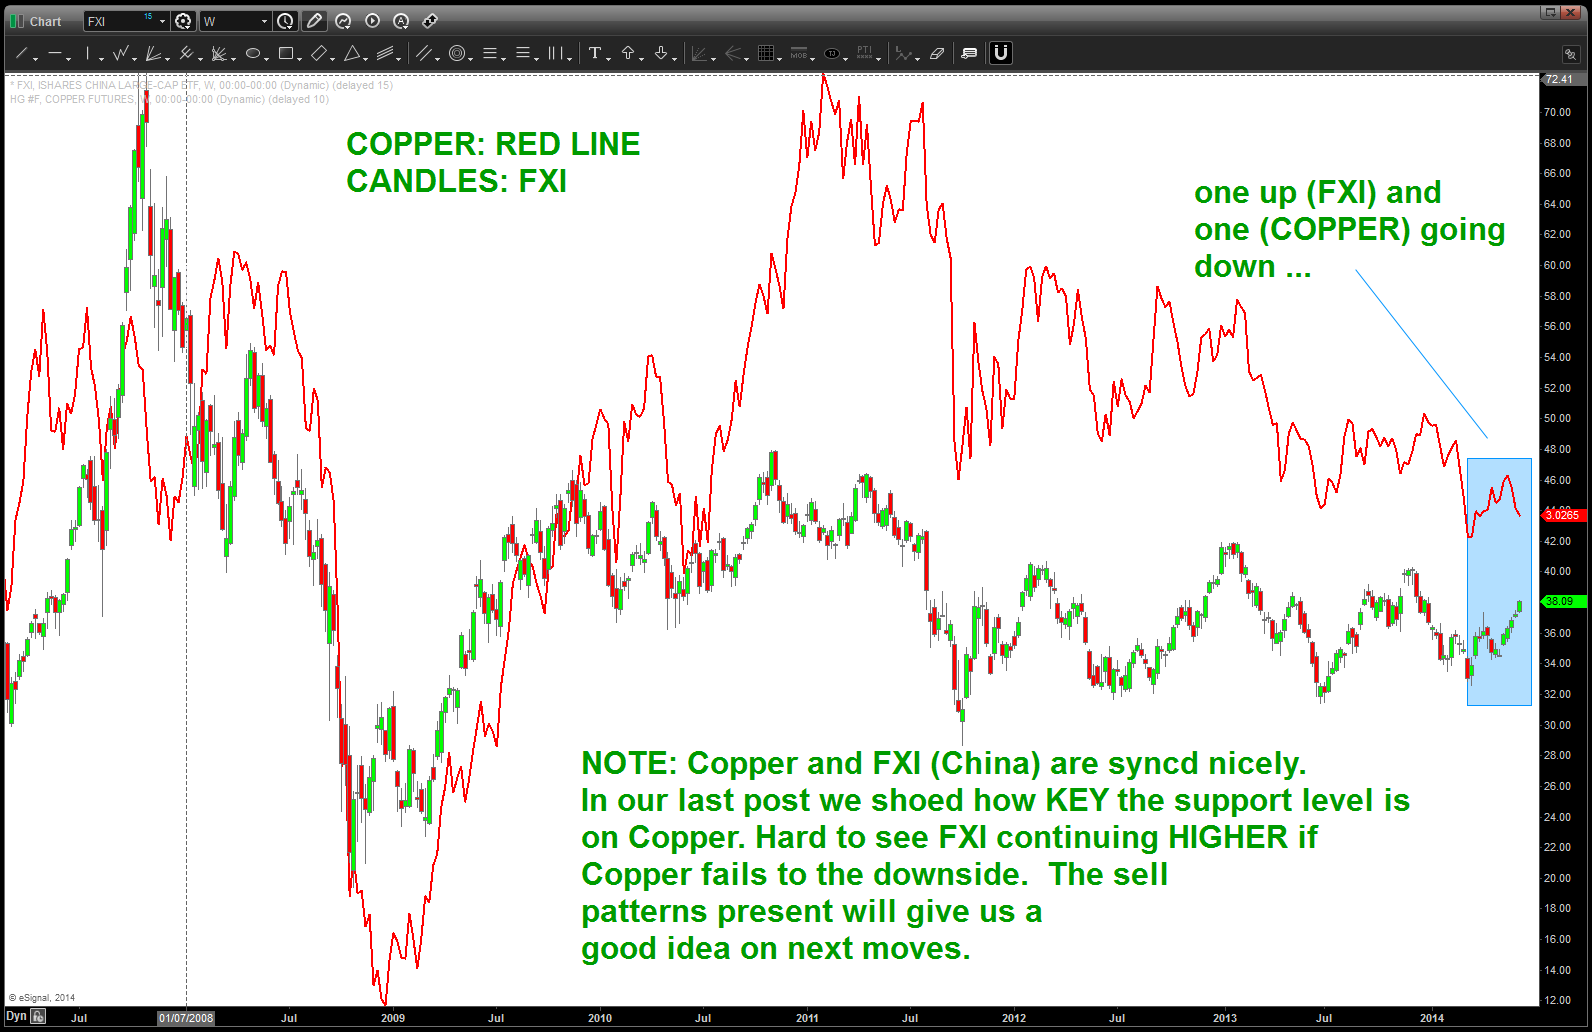
CLIFF NOTES: the key w/ PATTERNS is they enable one to make adjustments, develop gameplans and manage risk. In this case, we have a SELL pattern appearing on FXI. The correlation w/ Copper is pretty high. In our last post we showed the “probability” is HIGH that the Copper will fail the support level at 3.0. If that is the case, THEN the SELL patterns on FXI should work. (remember, every market moment is unique and it’s all probability) However, based on the synchronization shown below there is nothing that should cause a major divergence so let’s see who will win out ….
- Will the FXI bust on thru to the upside and therefore cause support to continue to hold on the Copper? Even though the LONG TERM COUNT shows a convincing argument for a MAJOR 5 waves complete on Copper? Or, will Copper fall below 3.0 and start down enabling the targets shown on FXI to hit and cause selling to resume attacking the 30 support level?
Stand by ..
Copper Script Part II
Posted on June 15, 2014 Leave a Comment
CLIFF NOTES: the probability is high that we break the key support line in/around 3.0 that has been holding copper up since 2010.
CLIFF NOTES 2: here is the link to the “Copper Script Part I” to watch how a BUY was recommended in the midst of the crash in 2009: https://bartscharts.com/2013/12/20/the-copper-script/
Note, a potential gameplan is shown by the light blue lines …

Copper Continuous Monthly
Last call .. shots of XLE being served at the bar!
Posted on June 14, 2014 Leave a Comment
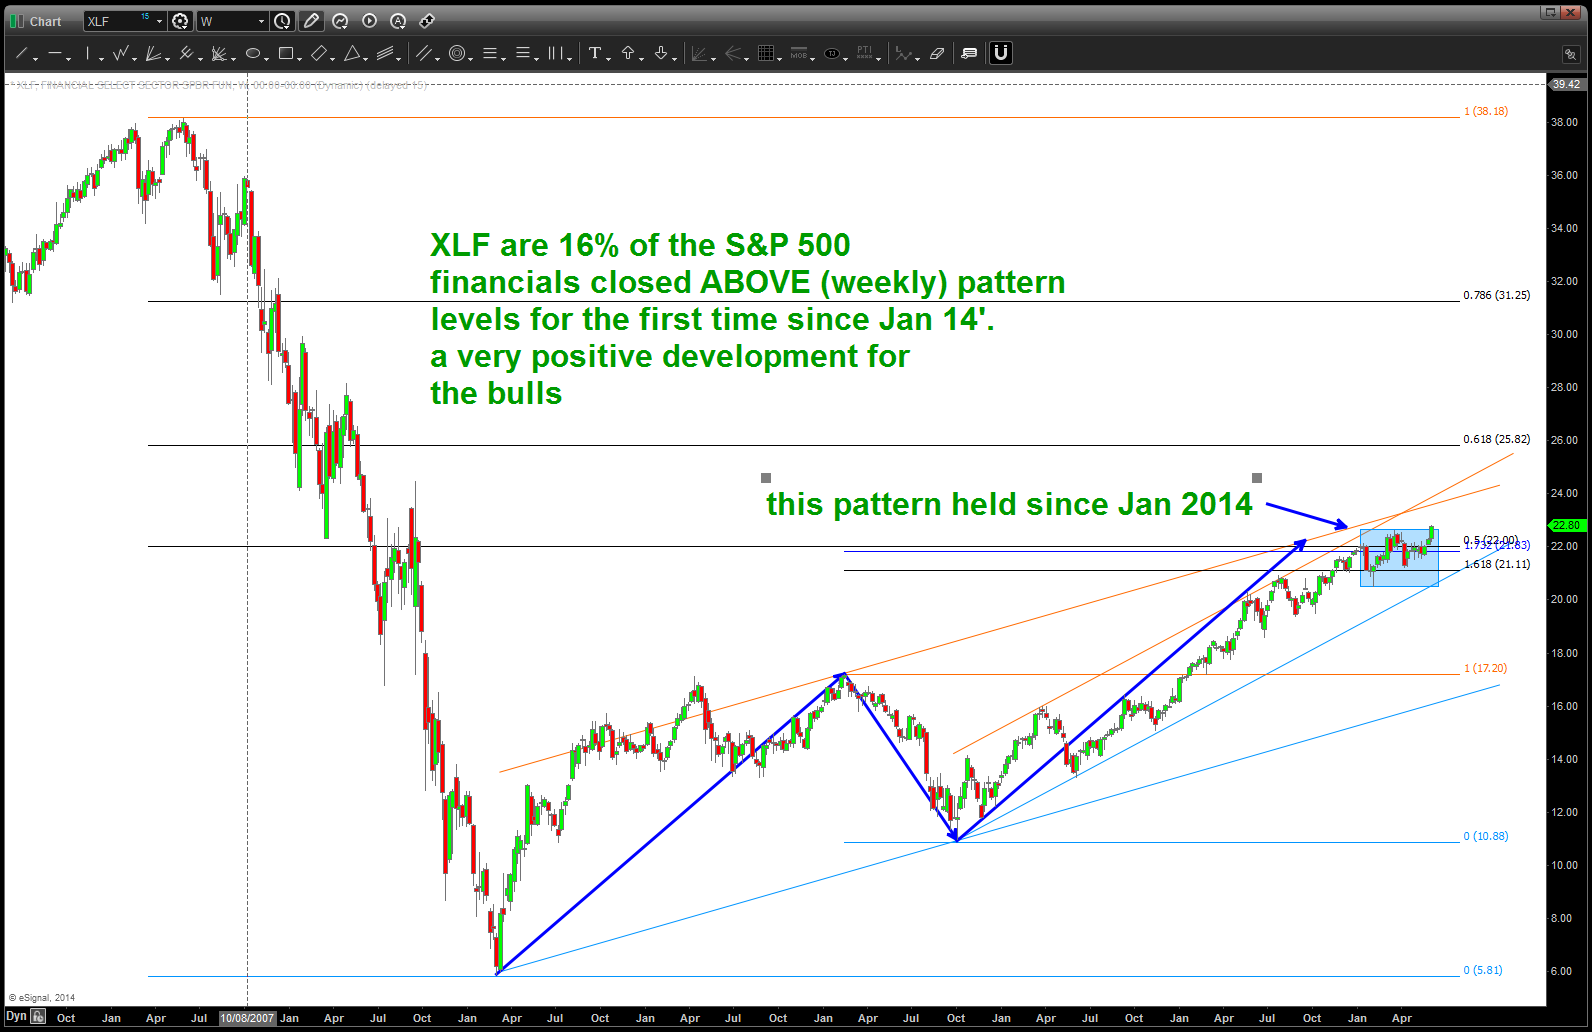
CLIFF NOTES: a picture does paint a thousand words. So there are some pictures below. I’ve included the chaos that was 2009 just to demonstrate that, guess what, at the lows in 2009 a BUY appeared on the XLF (Financials) and guess what … when I was Chief Technician for the When 2 Trade Group we put out a piece to BUY THE XLF. Did anyone in there right mind want to do that …? Of course not. Same reason why NOBODY in their right mind wants to sell out and miss any of the last couple percentages of this run.
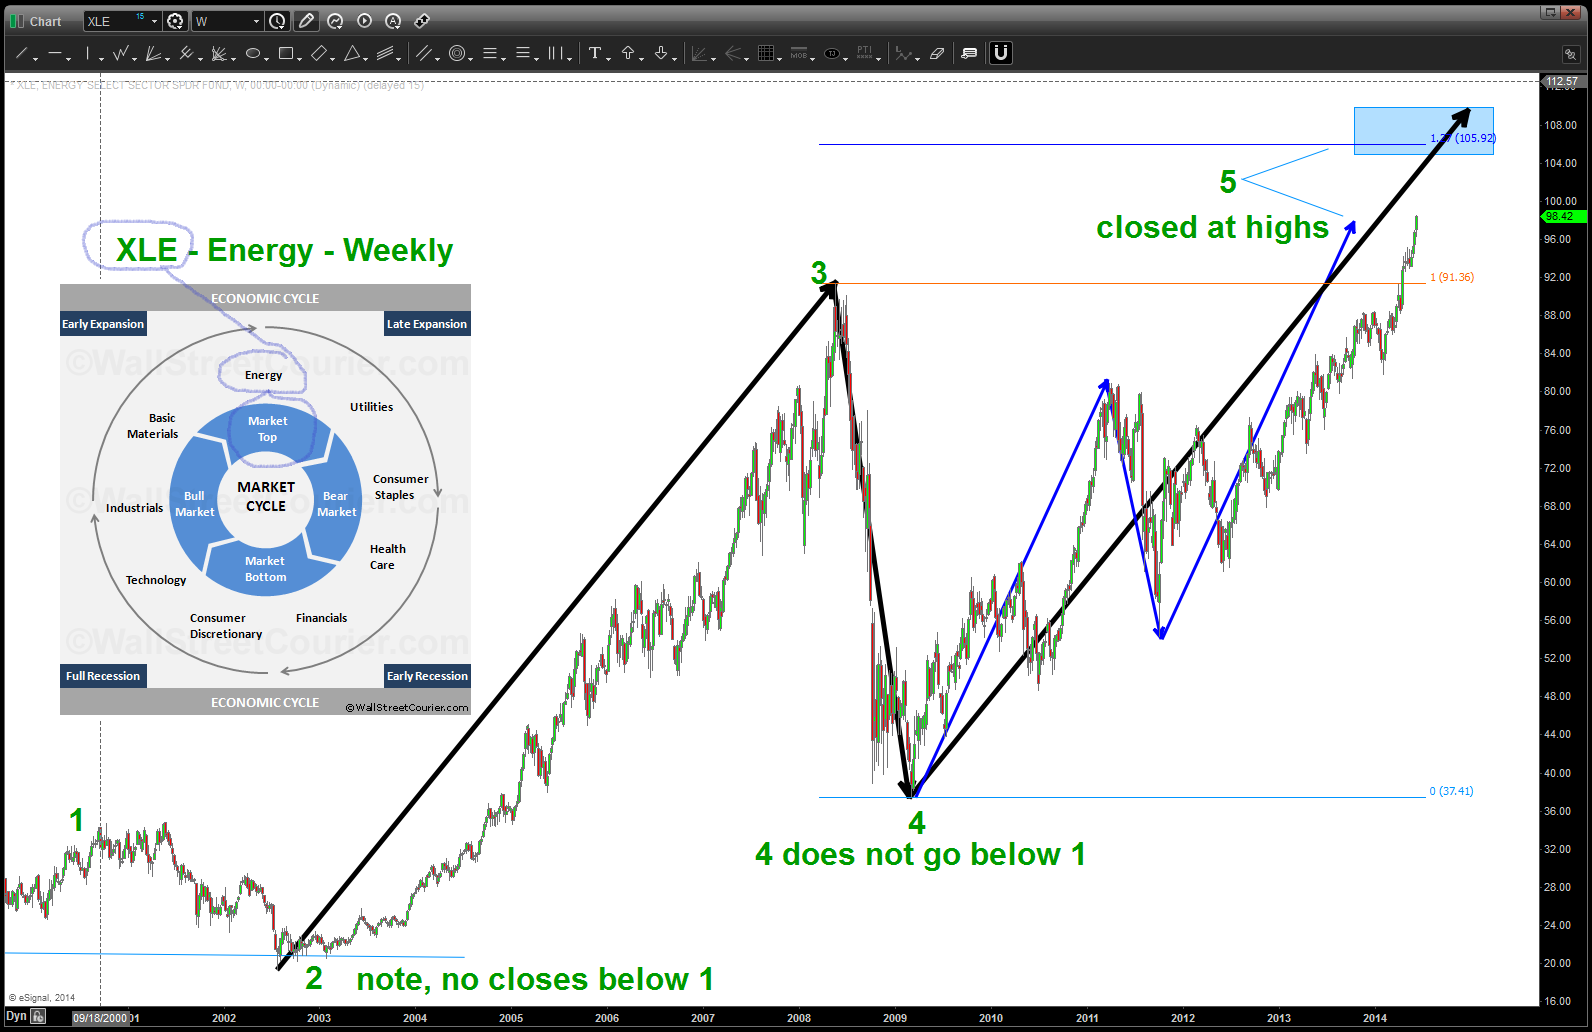
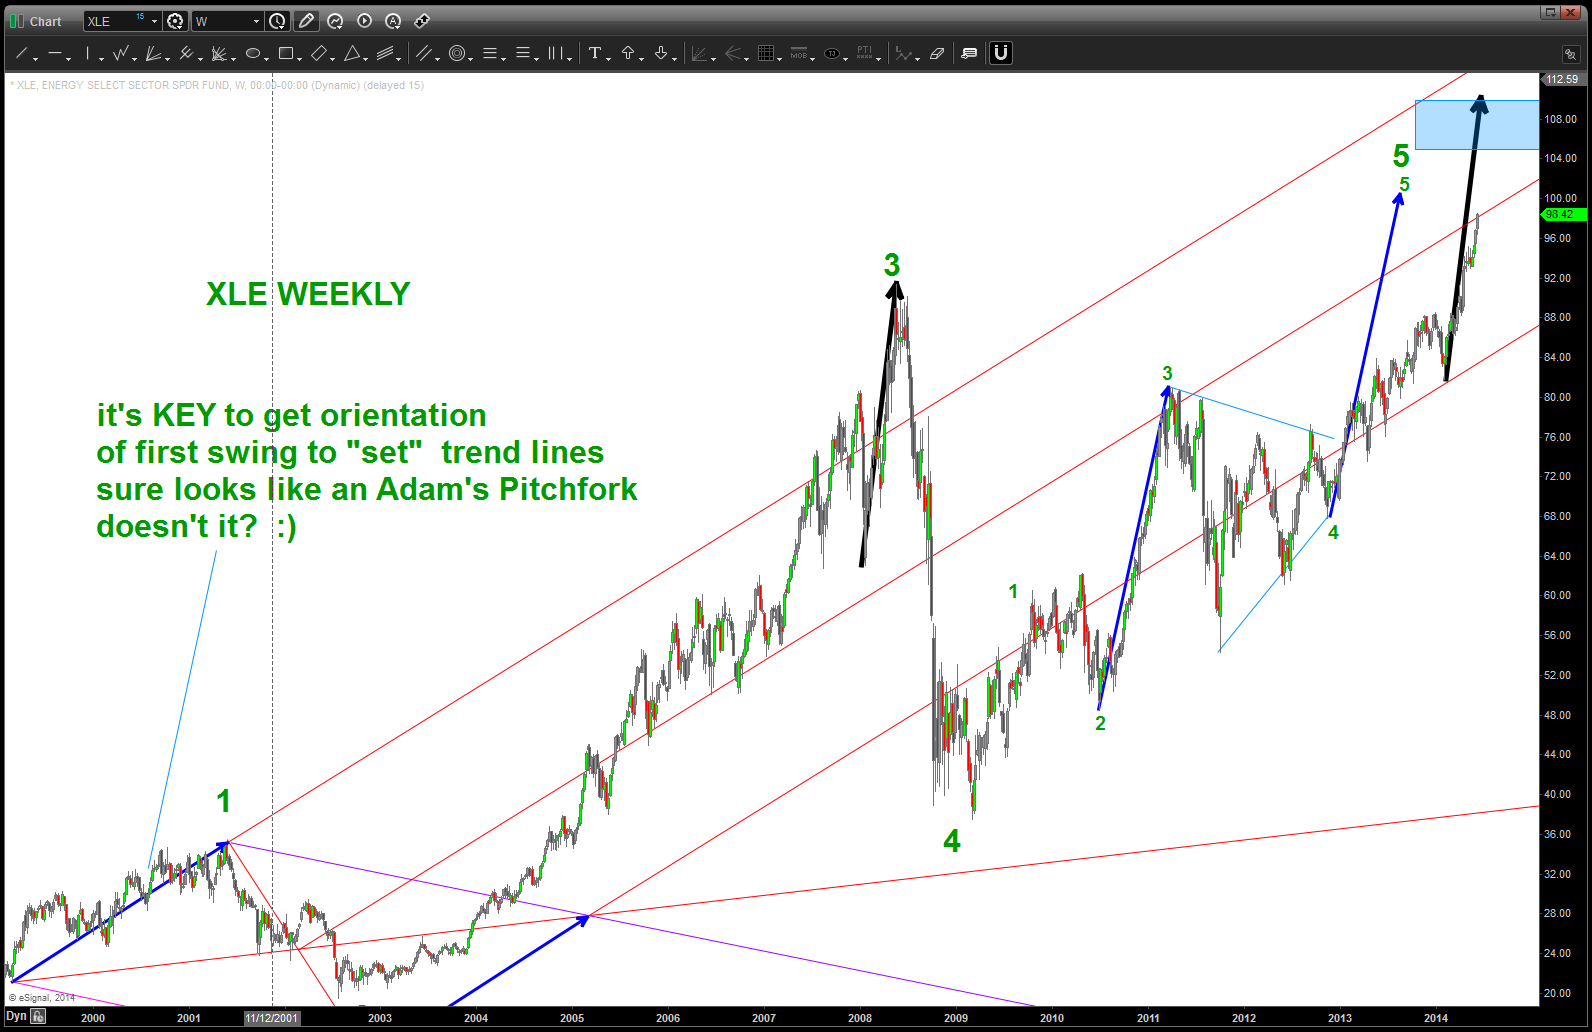
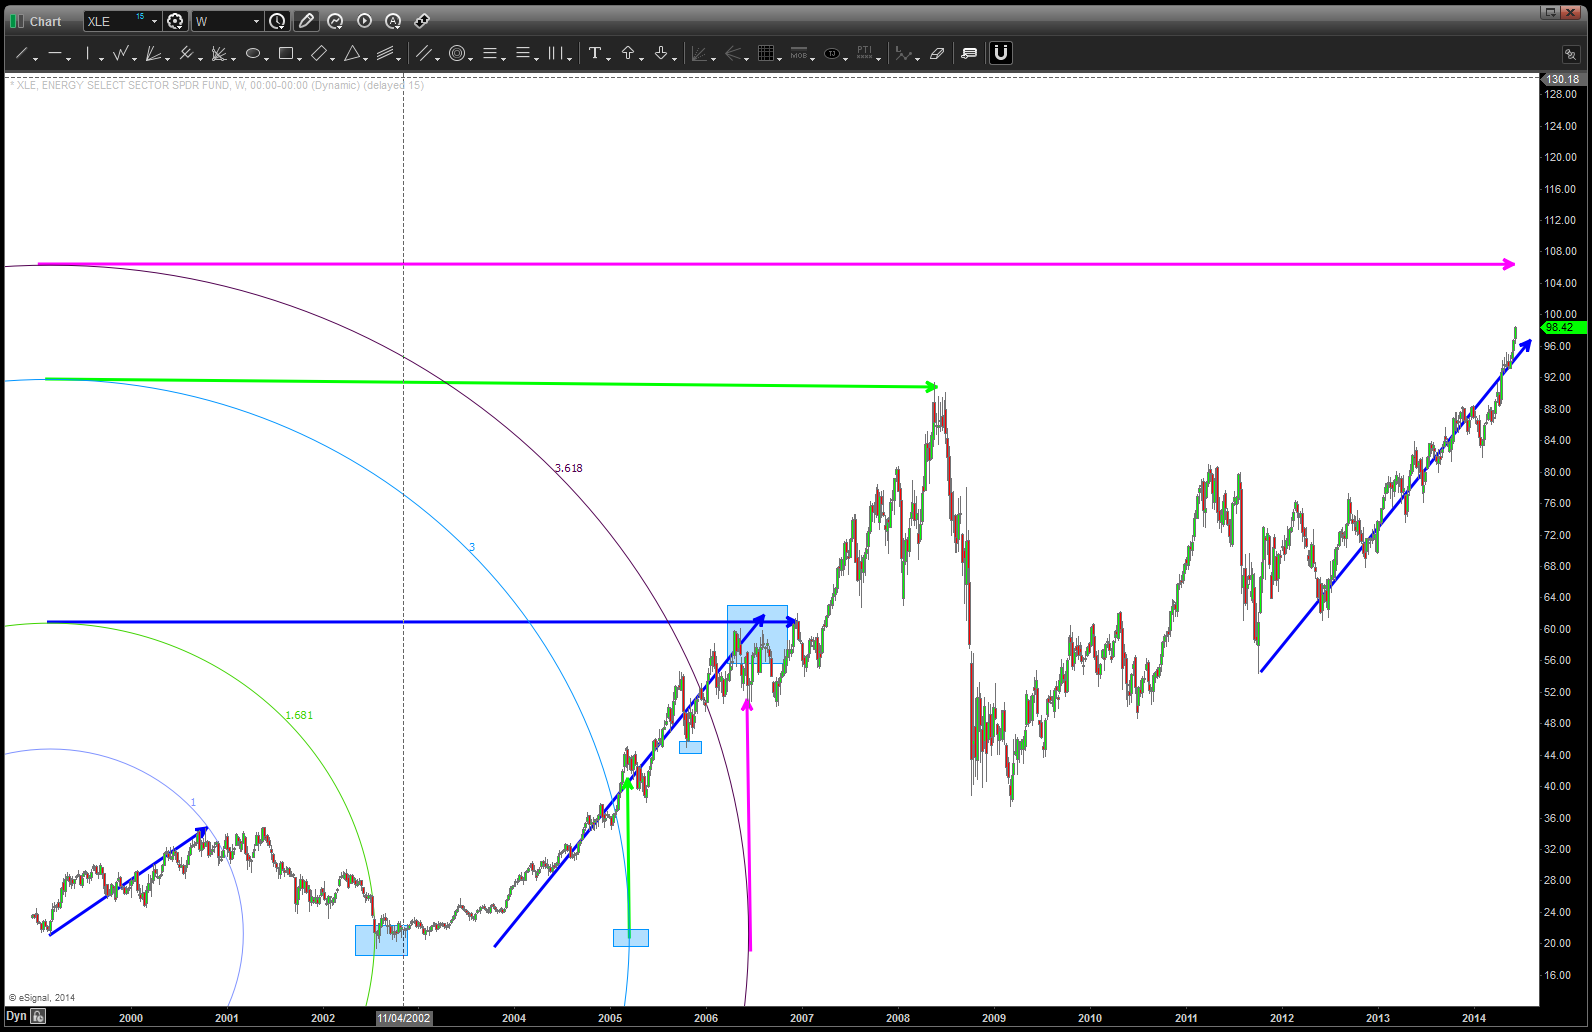
CLIFF NOTES 2: if you look at the count below, do realize that 2 does go below 1 a couple times BUT NEVER CLOSES BELOW. Folks, that’s good enough for me. Then we roll thru wave 3 not being the shortest and 4 not going below the end of 1 and all RULES are satisfied for this count. What’s that tell us? A good case can be made that we are in the 5th wave for the XLE. And, w/ the sentiment at RECORD HIGHS and the IRAQ situation and the blah blah this puppy has the potential to explode like a shake and bake handshake!

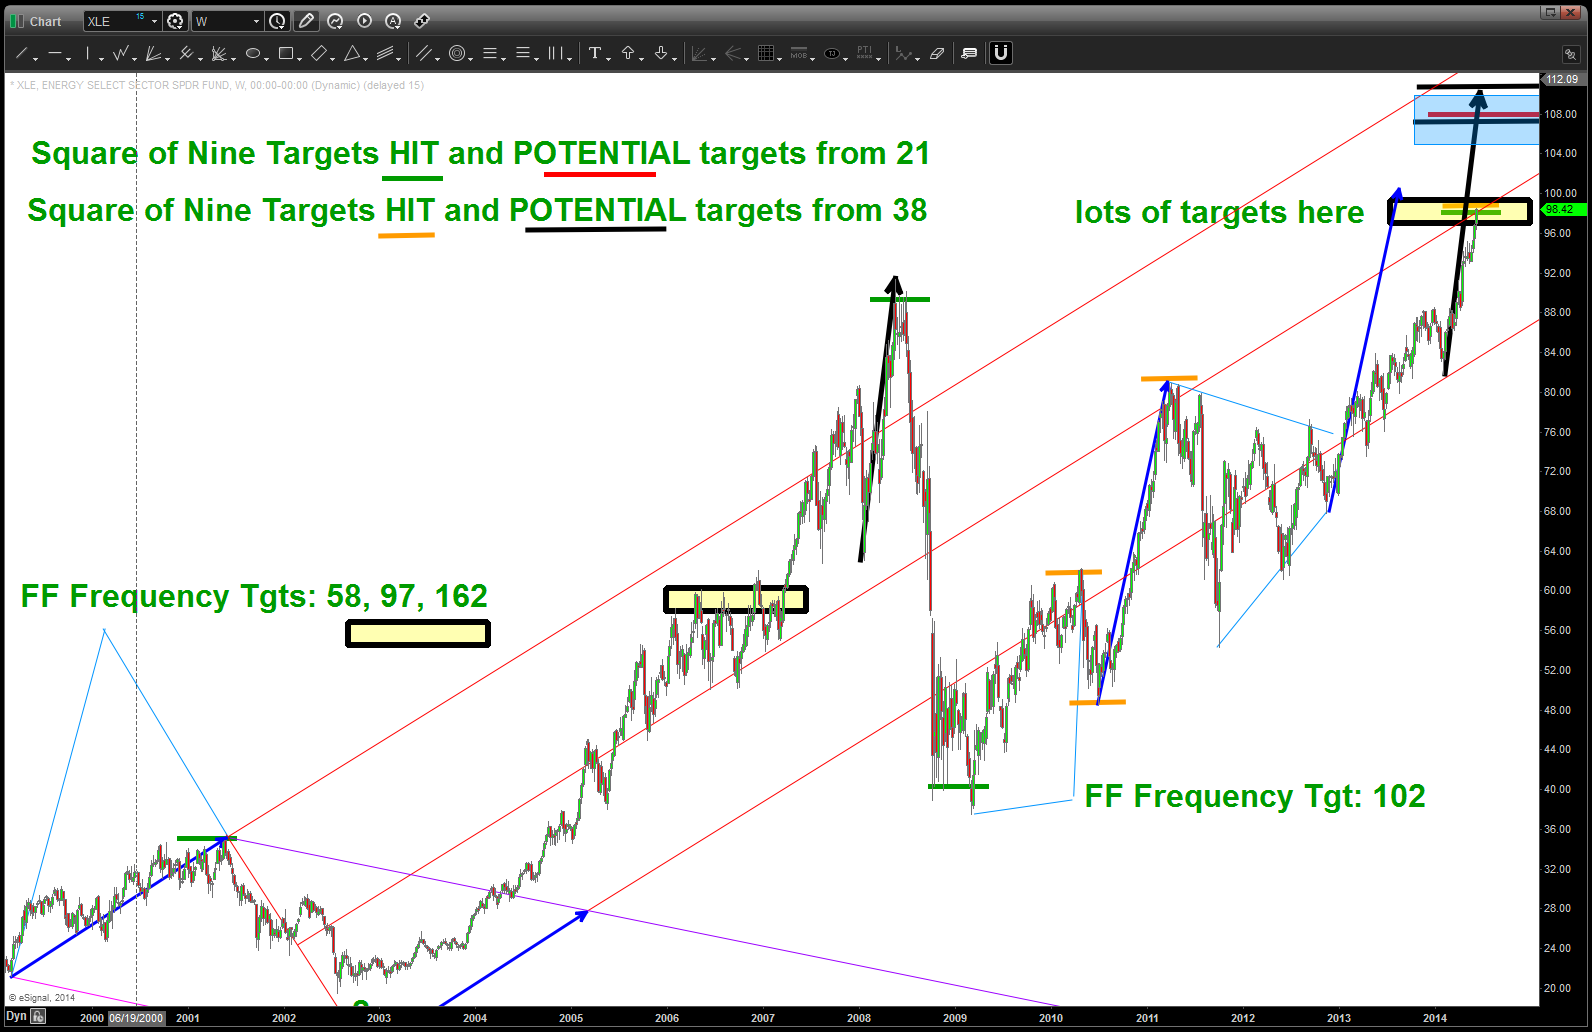
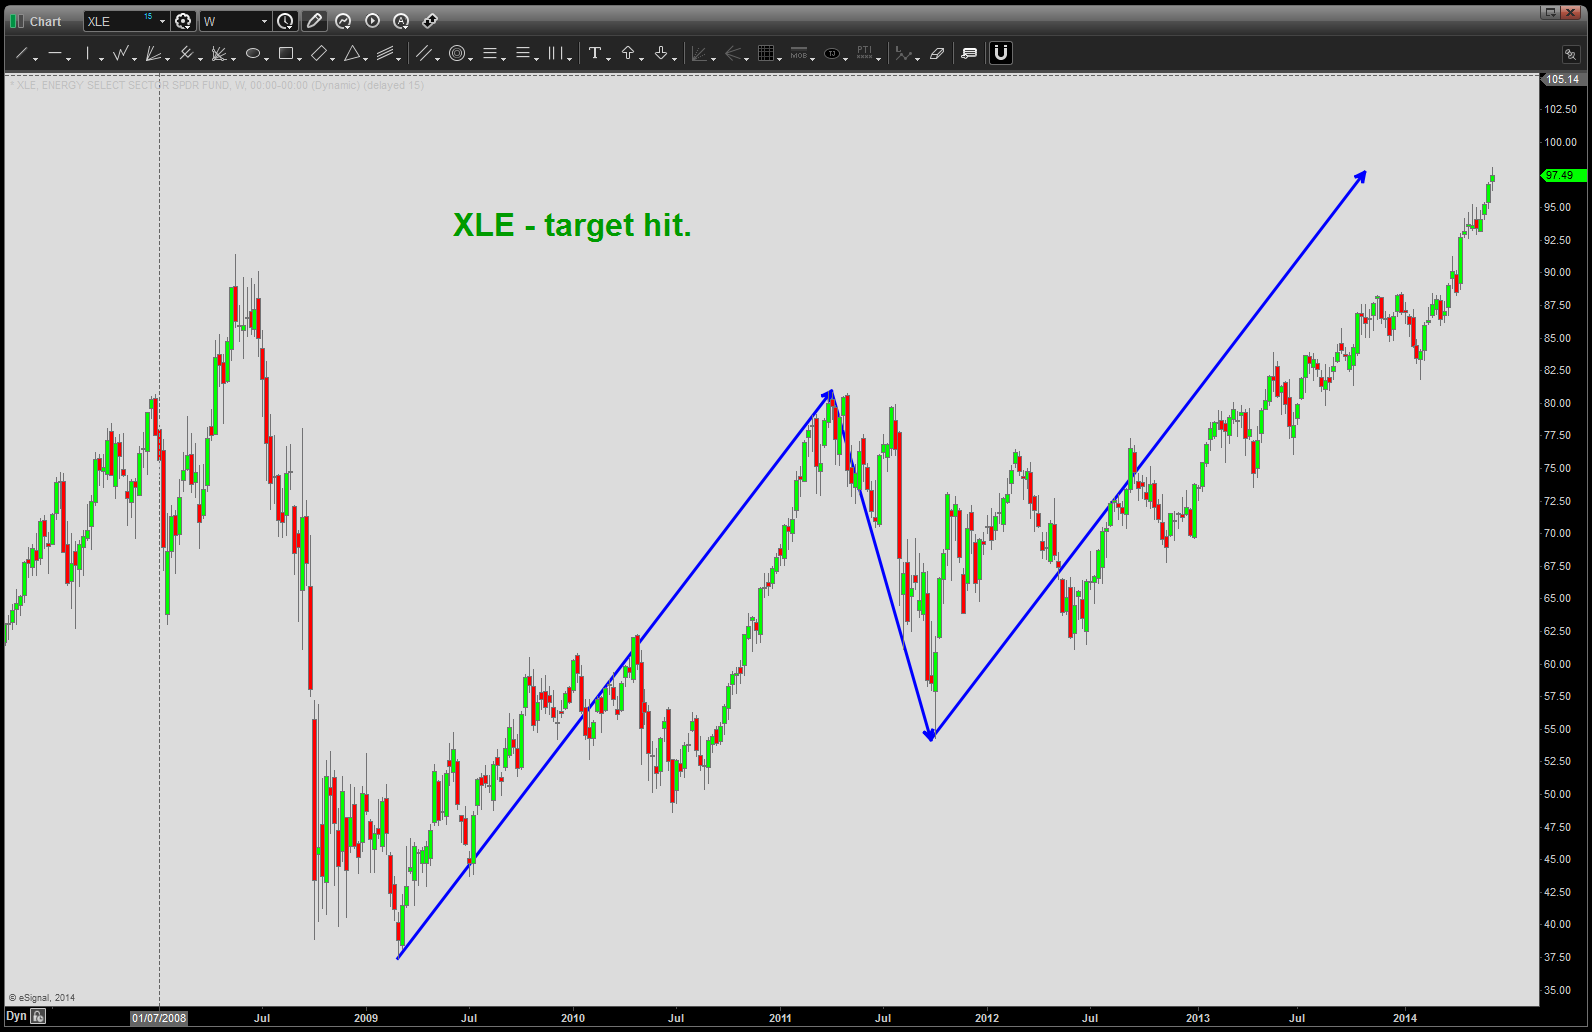
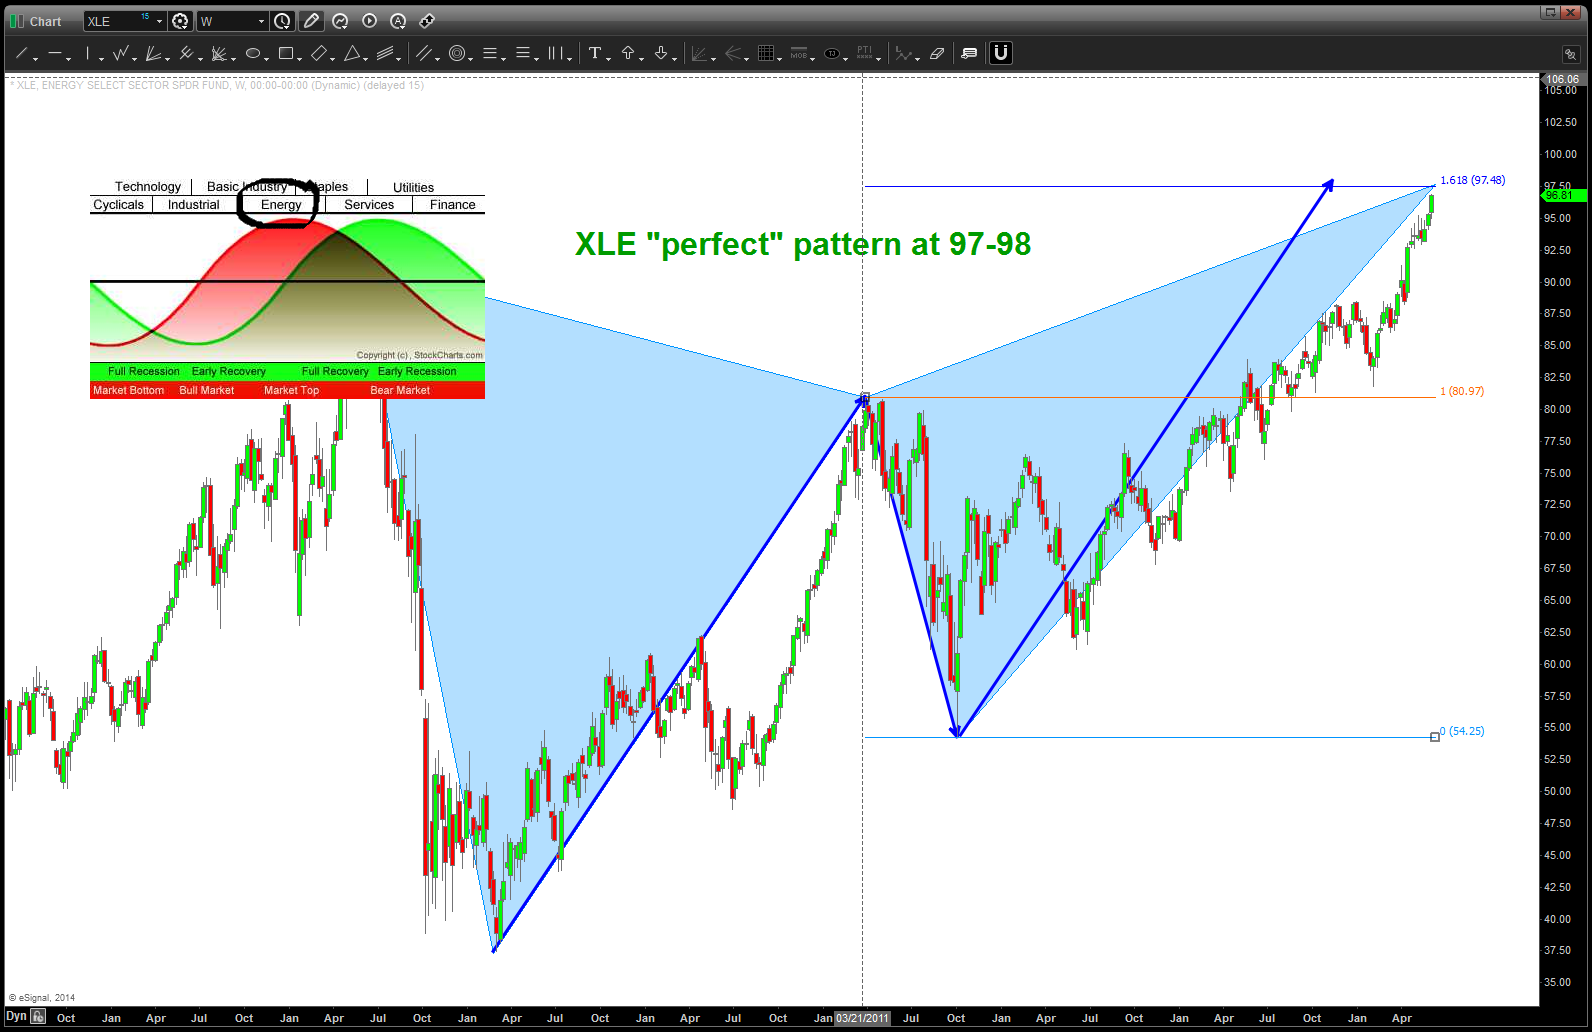
CLIFF NOTES 3: our minor target is hit in/around 97-98 and closed at the “high range” of the weekly candle. That usually denoted strength so we can “assume” the higher target in/around 105-110’s is in play. As far as patterns go … that one is a very nice LONG TERM pattern. If/when XLE does top it will signify the circle of life w/ regard to sector rotation is complete. WATCH THIS TARGET AREA.
CLIFF NOTES 4: go back and look at my “Swing Low, Sweet Chariot” post a couple weeks ago. Swing lows need to be broken before any bull should throw in the towel.
Enjoy the weekend and Happy Fathers Day out there to any fathers out there.
Bart
Here’s the XLF Recommendation. NOTE THE DATE! 😉
W2TG Tech Rating Chg XLF SB030309
Here’s the PATTERN and the picture as it appeared on March 03, 2009. Note, the CLOSE was 6.18. (.618 for any of those Fibonacci challenged)
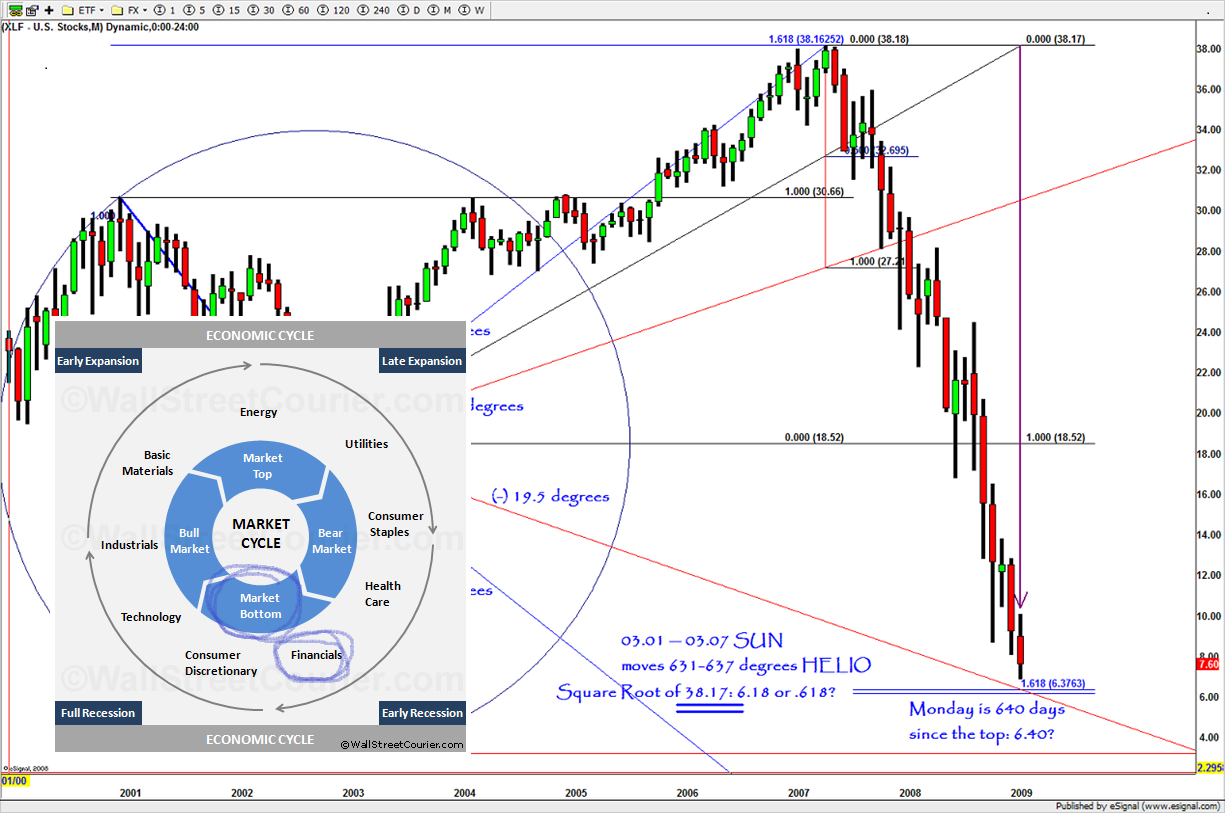
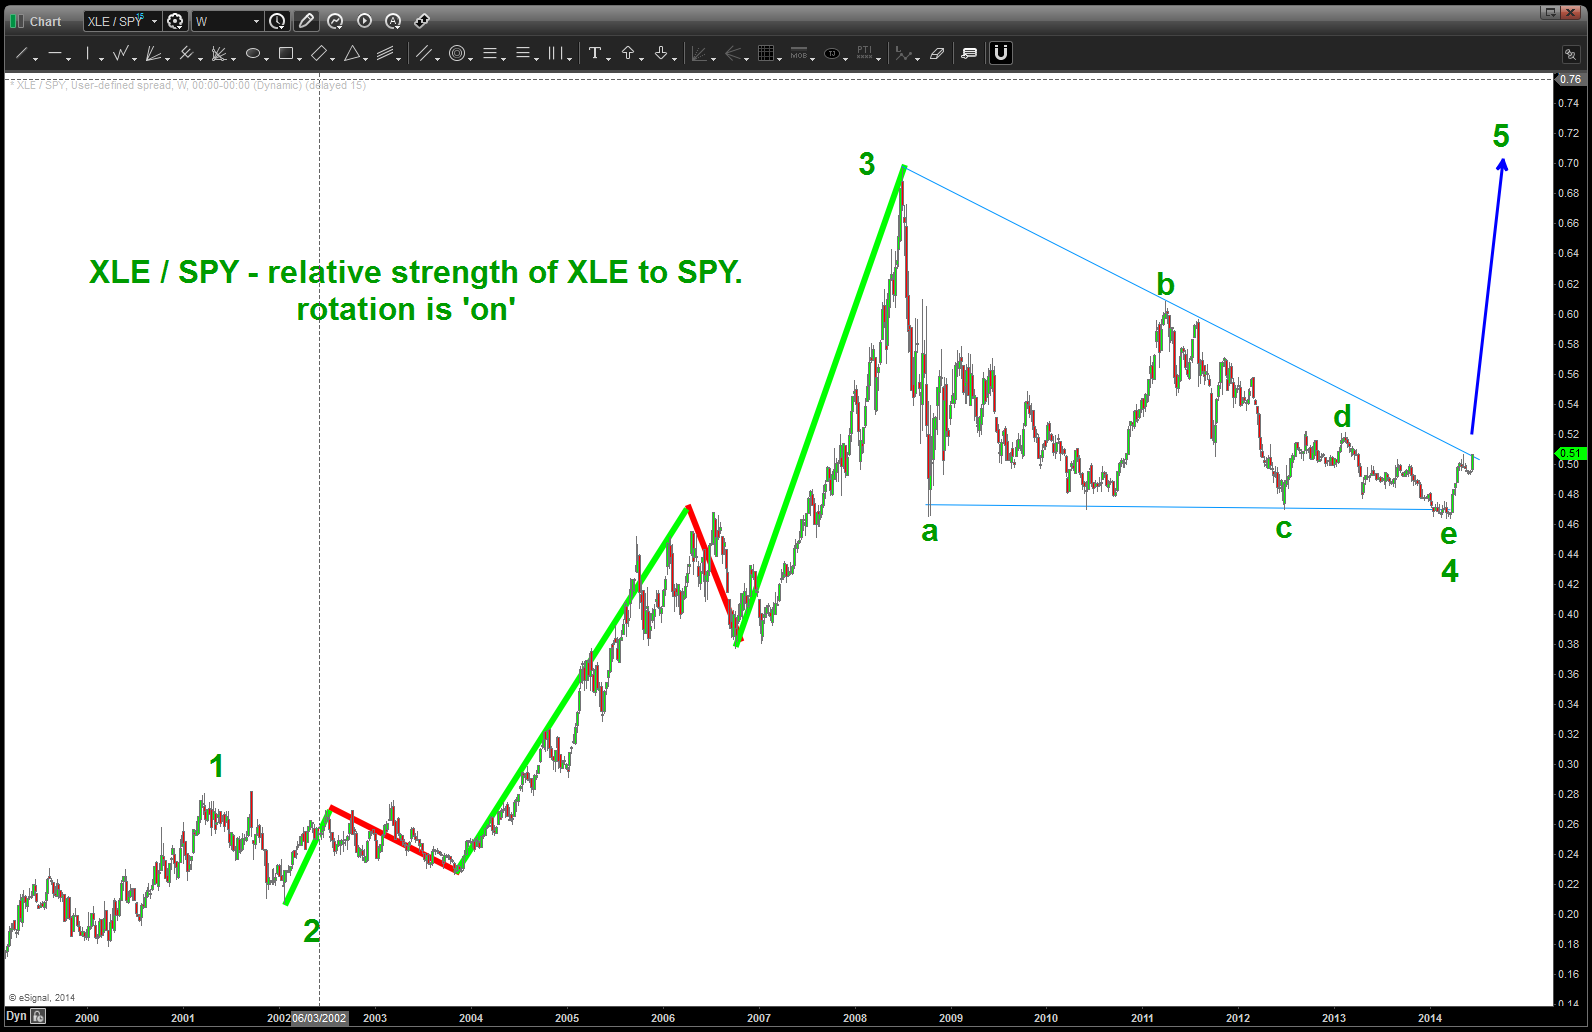
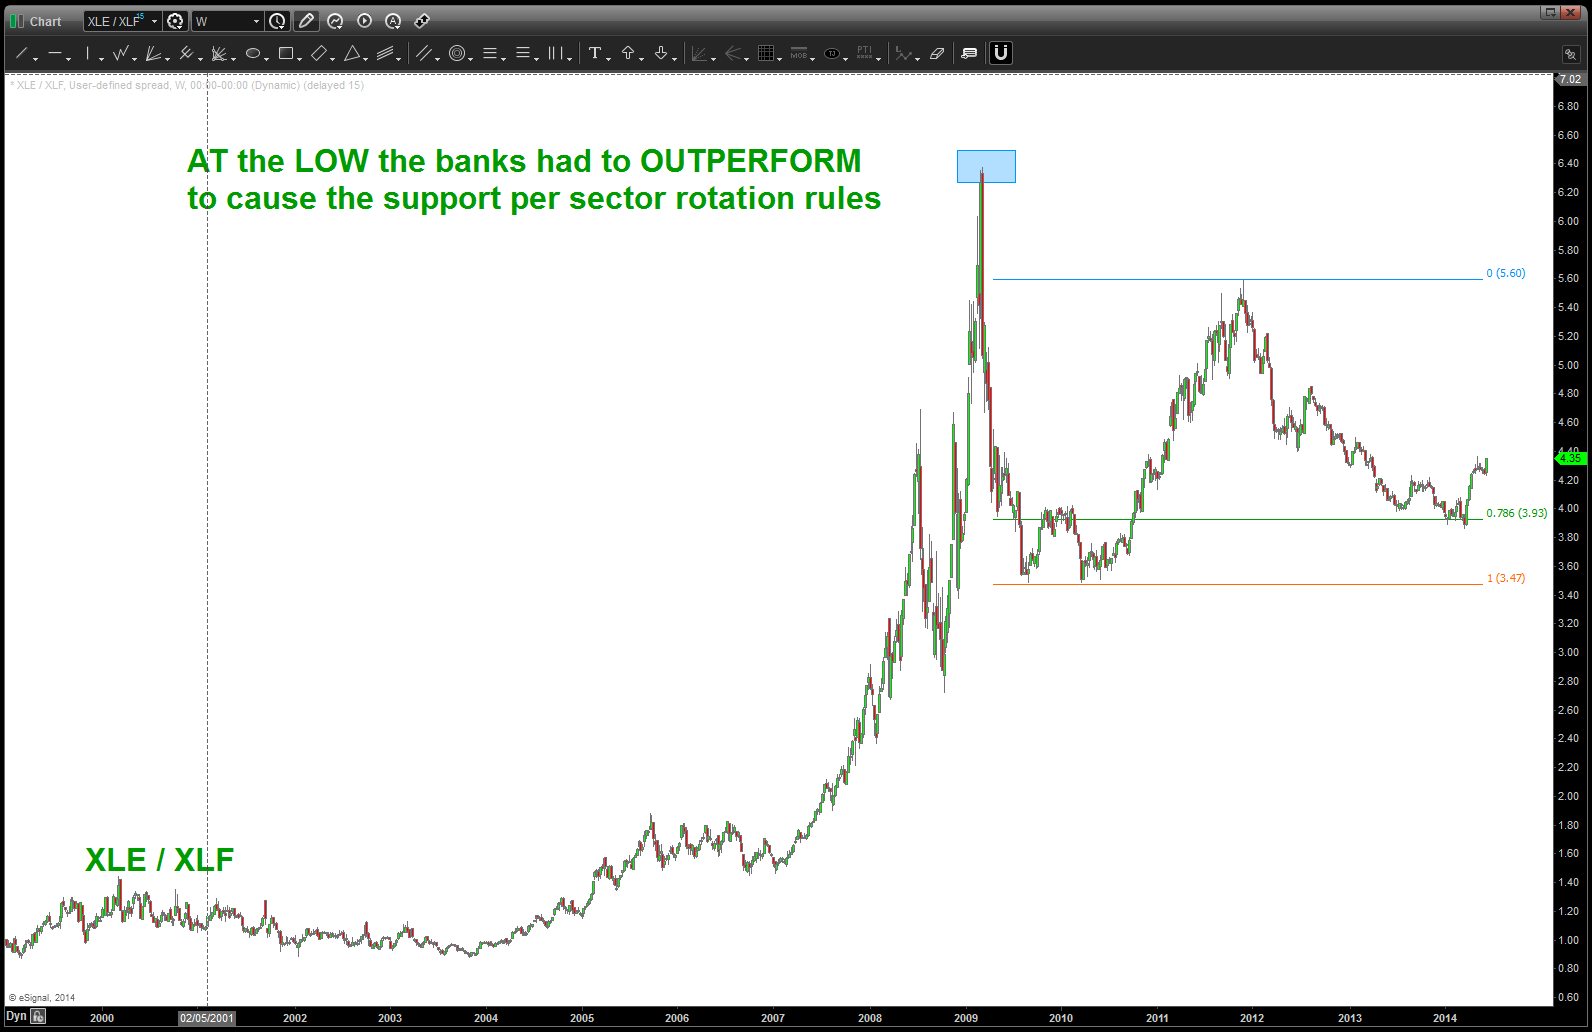
XLF and the importance of sector rotation.
here is the picture now, note where XLE (Energy) sits in the sector rotation model:
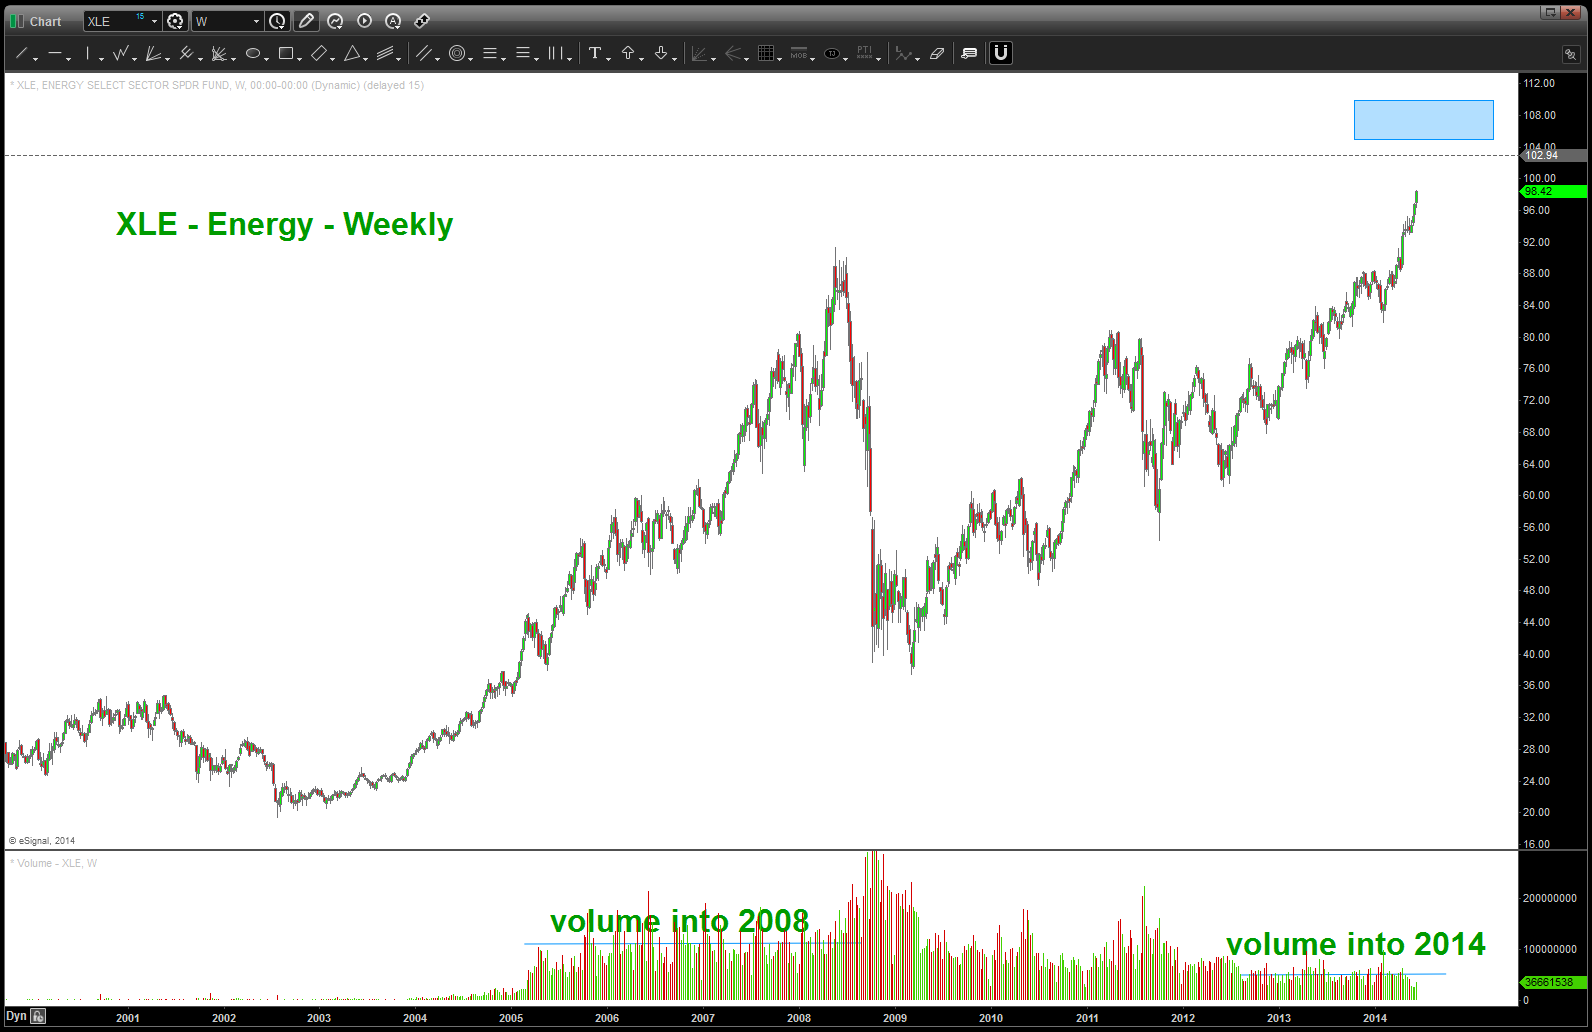
some more chart work on XLE, key here is notice the volume below is significantly lower than the march into the highs in 07-08.
here is our good old RSI ..a work horse in any technicians tool kit. NOTE – and this is probably our biggest “hint” of things to come – NO TOP IN THE XLE HAS BEEN MADE SINCE IT’S INCEPTION W/OUT THE PRESENCE OF BEARISH DIVERGENCE. Does that mean one of our targets can’t get hit and it falls like a stone. NO. But the PROBABILITY is in our favor that the XLE will hit a target, back off and drive the RSI off it’s highs THEN price will go up and seek a new high and the RSI will fail to make a higher high and THEN we can look for major inflections. Also note – in 2008 it took 8 weeks for the XLE to top and finally crack. In today’s day and age of texting, twitter, digital addiction can you sit on a position and get chopped up for 2 months waiting? Probably not …
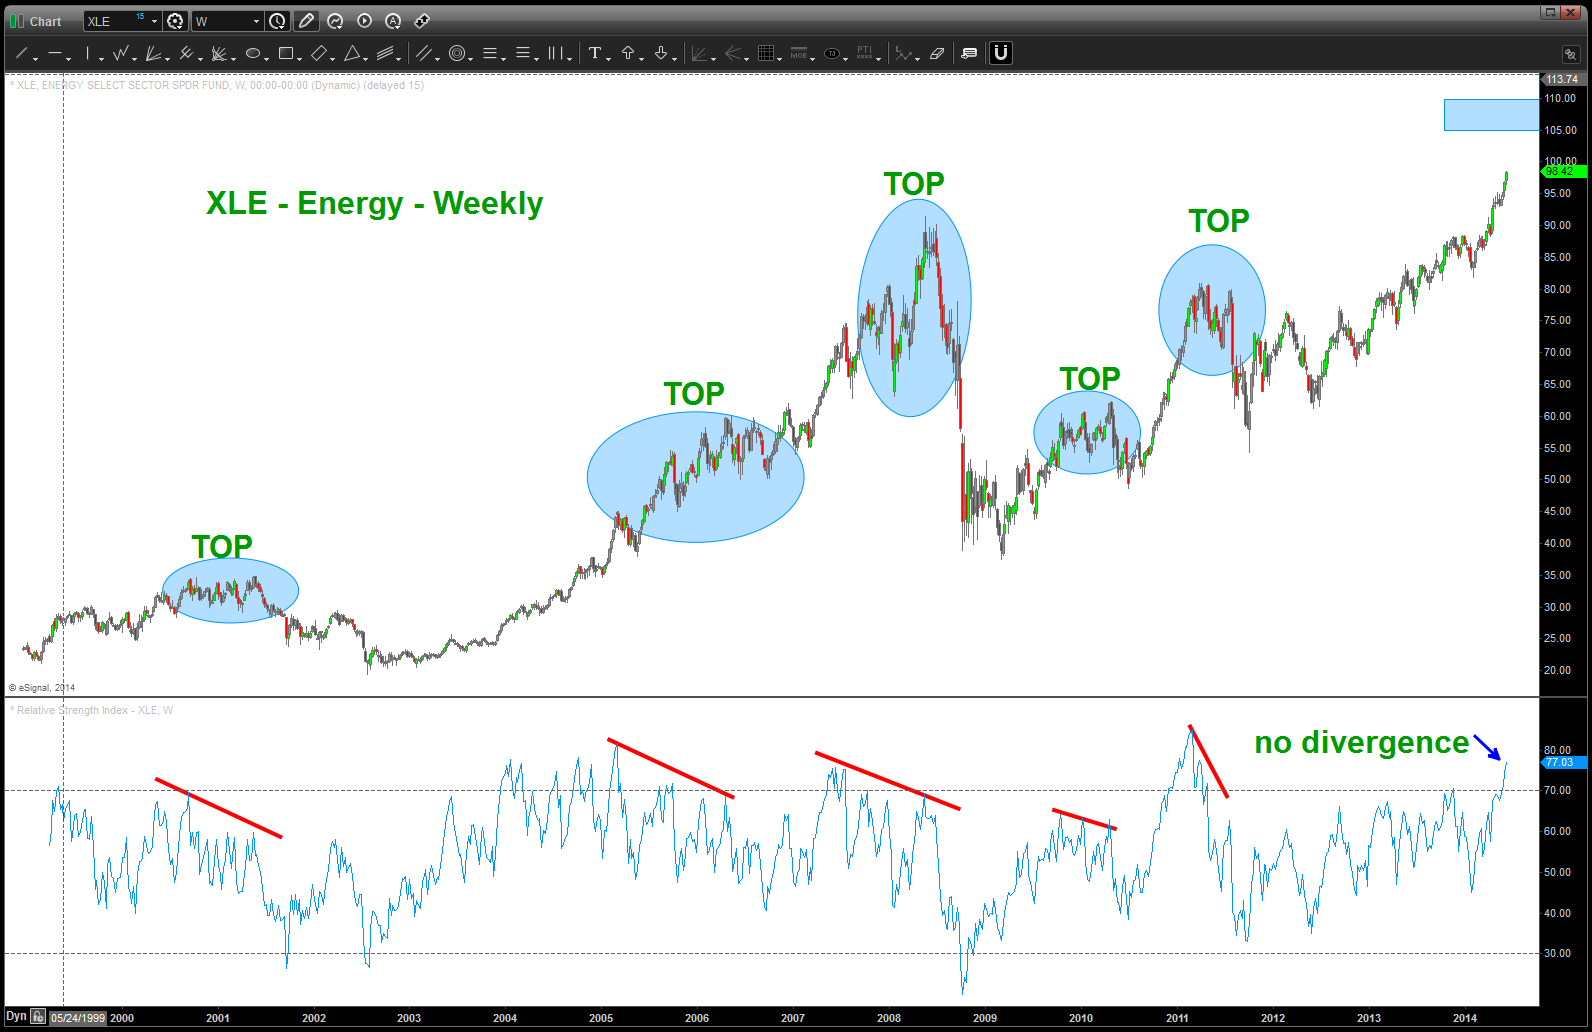
RSI on XLE – note divergence is usually present at inflection points
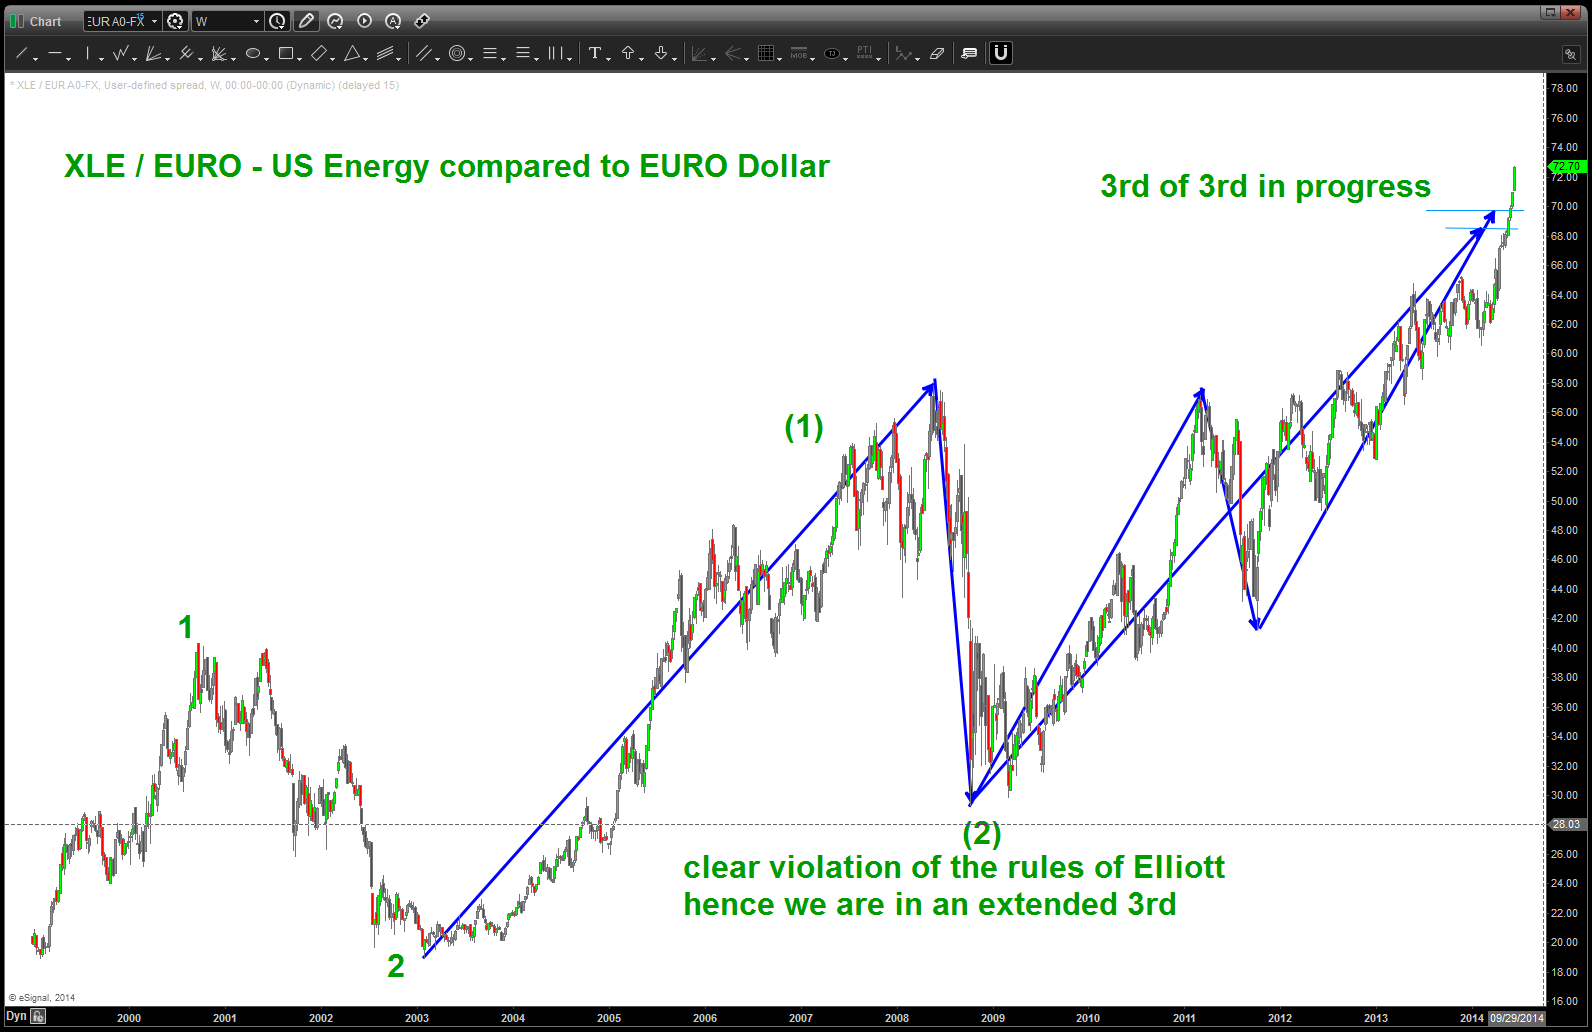
BE PATIENT … full disclosure I have been waiting over a YEAR to short the EURO. Just my style and I know once I jump into the cage w/ the gorilla’s juggling dynamite the die is cast, so to speak.
My former business partner and friend told me his grandfather offered sage advice …
“in this game, you need to just SEE and FEEL that there is money in the corner and you just go and pick it up.”
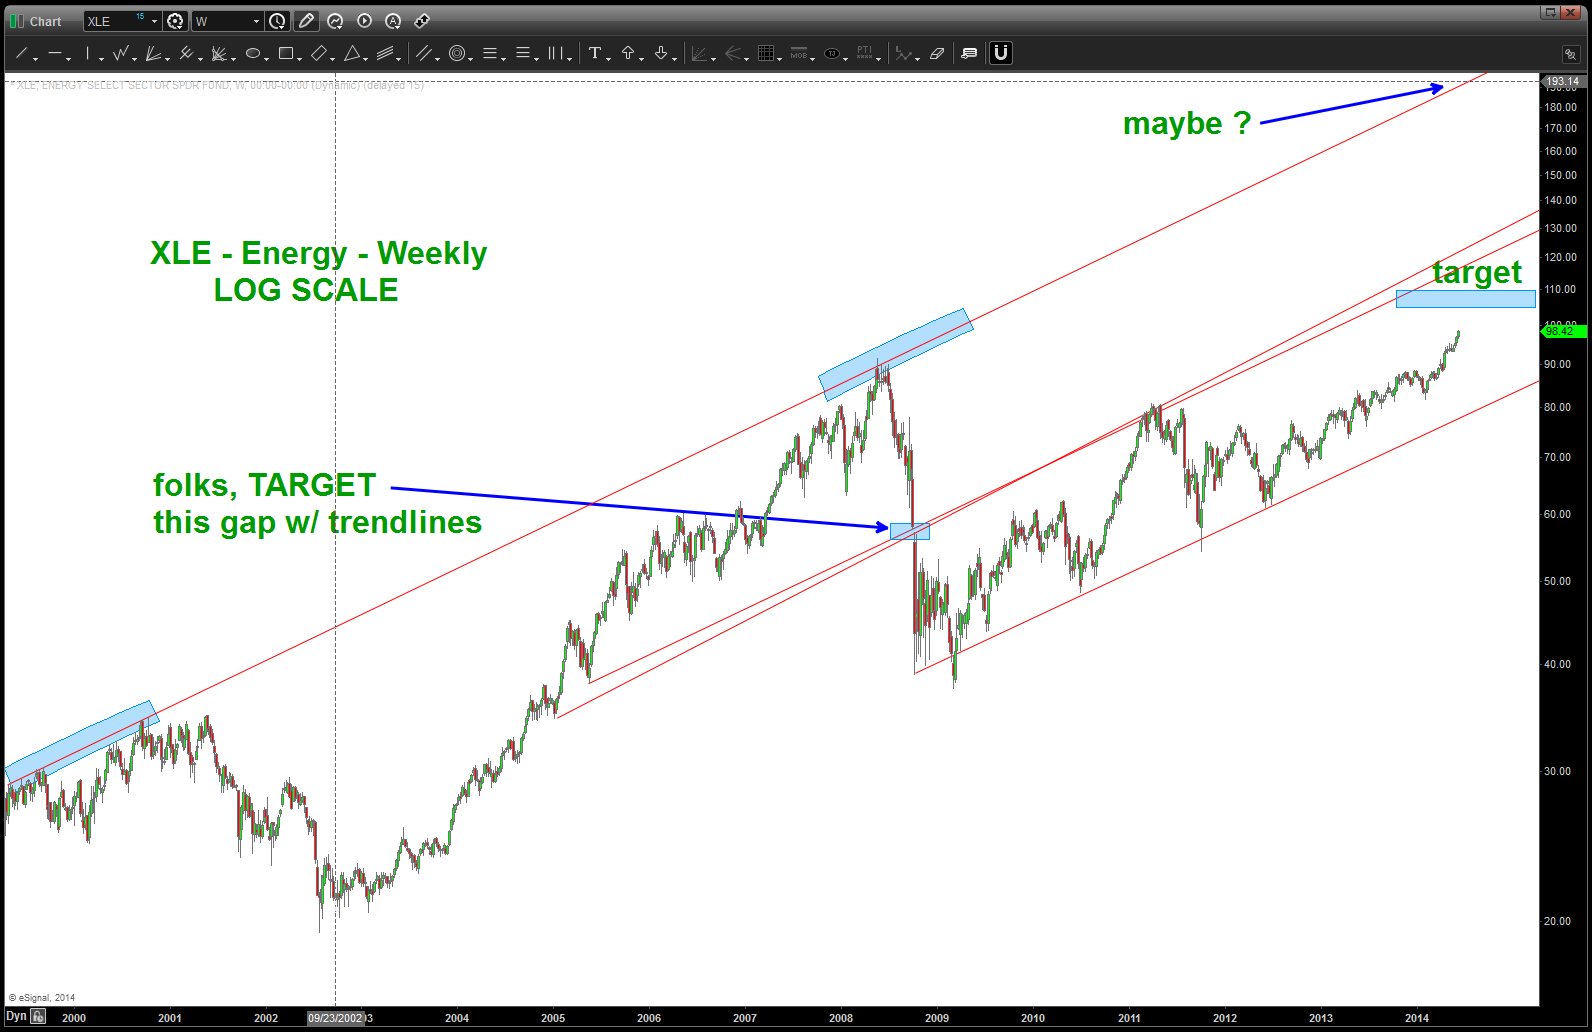
XLE LOG SCALE
Here is a “quick look” at the trend lines and rhythm of this security. Note, the key to the entire thing is the first impulse move UP from the low. Use that to set the geometry.
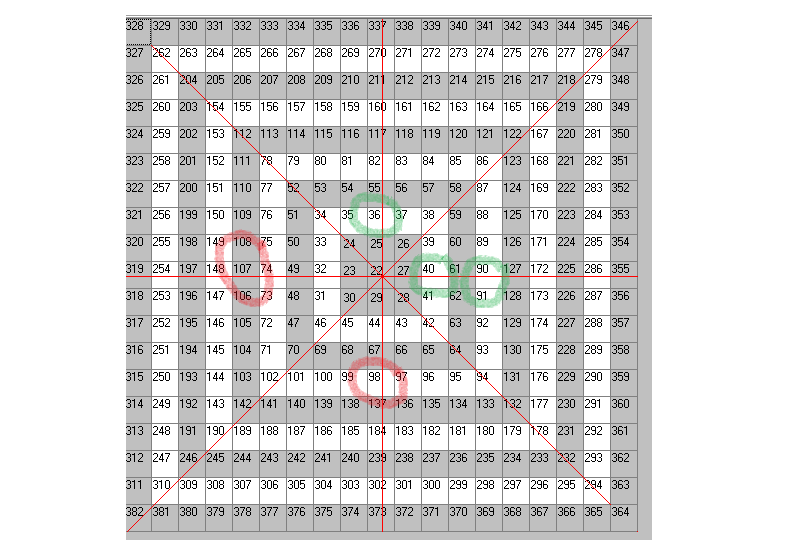
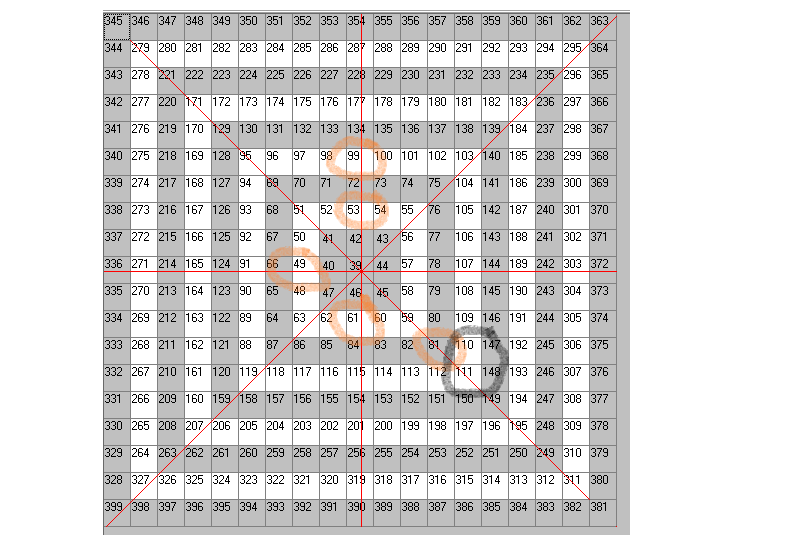
XLE GEOMETRICAL trend lines
here are some more targets being generated … note the placement of the LOWS in the CENTER of the square.
Dow Jones Transports and the Major Seventh …
Posted on June 12, 2014 Leave a Comment
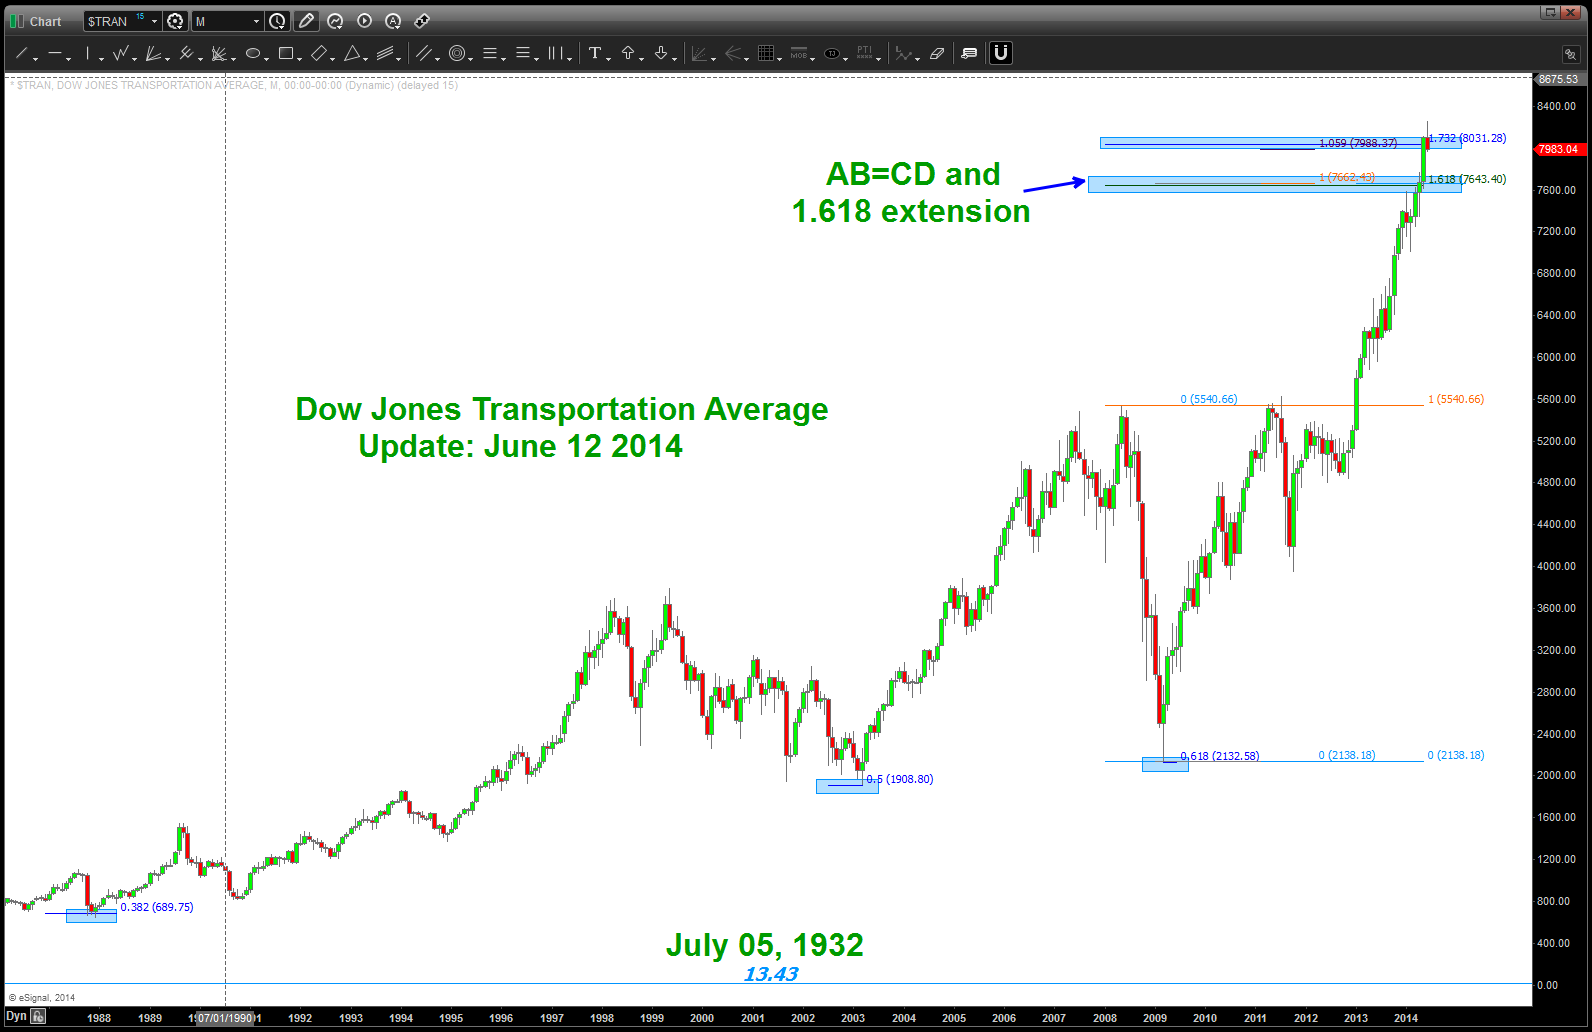
CLIFF NOTES: more than likely, you saw my long term transports post a couple months ago and as this target got attacked I was truly looking for a “little” resistance. I mean, come on, it was the ALL TIME LOW to the “old” ALL TIME HIGH and we have a 1.618 extension RIGHT ON TOP OF THE LEVEL. As patterns go .. this was a doozie. However, as patterns go, it failed. Folks, it didn’t even put up a fight …
so, I hit “erase all” on the chart and, quite frankly, left it alone. the joy of patterns and charting …
I went back to it tonight and I still think we have a pattern forming so I went back and said “self, what did it do the last time we surged past an old high and into a new high? Well, guess what? It surged thru the 1.618 extension in 2007-2008 an stopped on the 1.8877 extension! TILT … 1.8877? Well, that is exactly a major seventh ration in the equal octave scale of music. So .. perhaps it did that again? Please see below …we smacked into the minor and, quite frankly, the major is still out there. However — this sure looks like a MONTHLY 3 DRIVES TO A TOP pattern.
Keep the mindset (defensive) of ‘breaking a swing low’ …until we do break a weekly or monthly swing low this puppy will still keep running but if we break 2 or more weekly swing lows … we could see this thing drop to the old highs at 5600. Stay tuned …
What a run! Hugh?
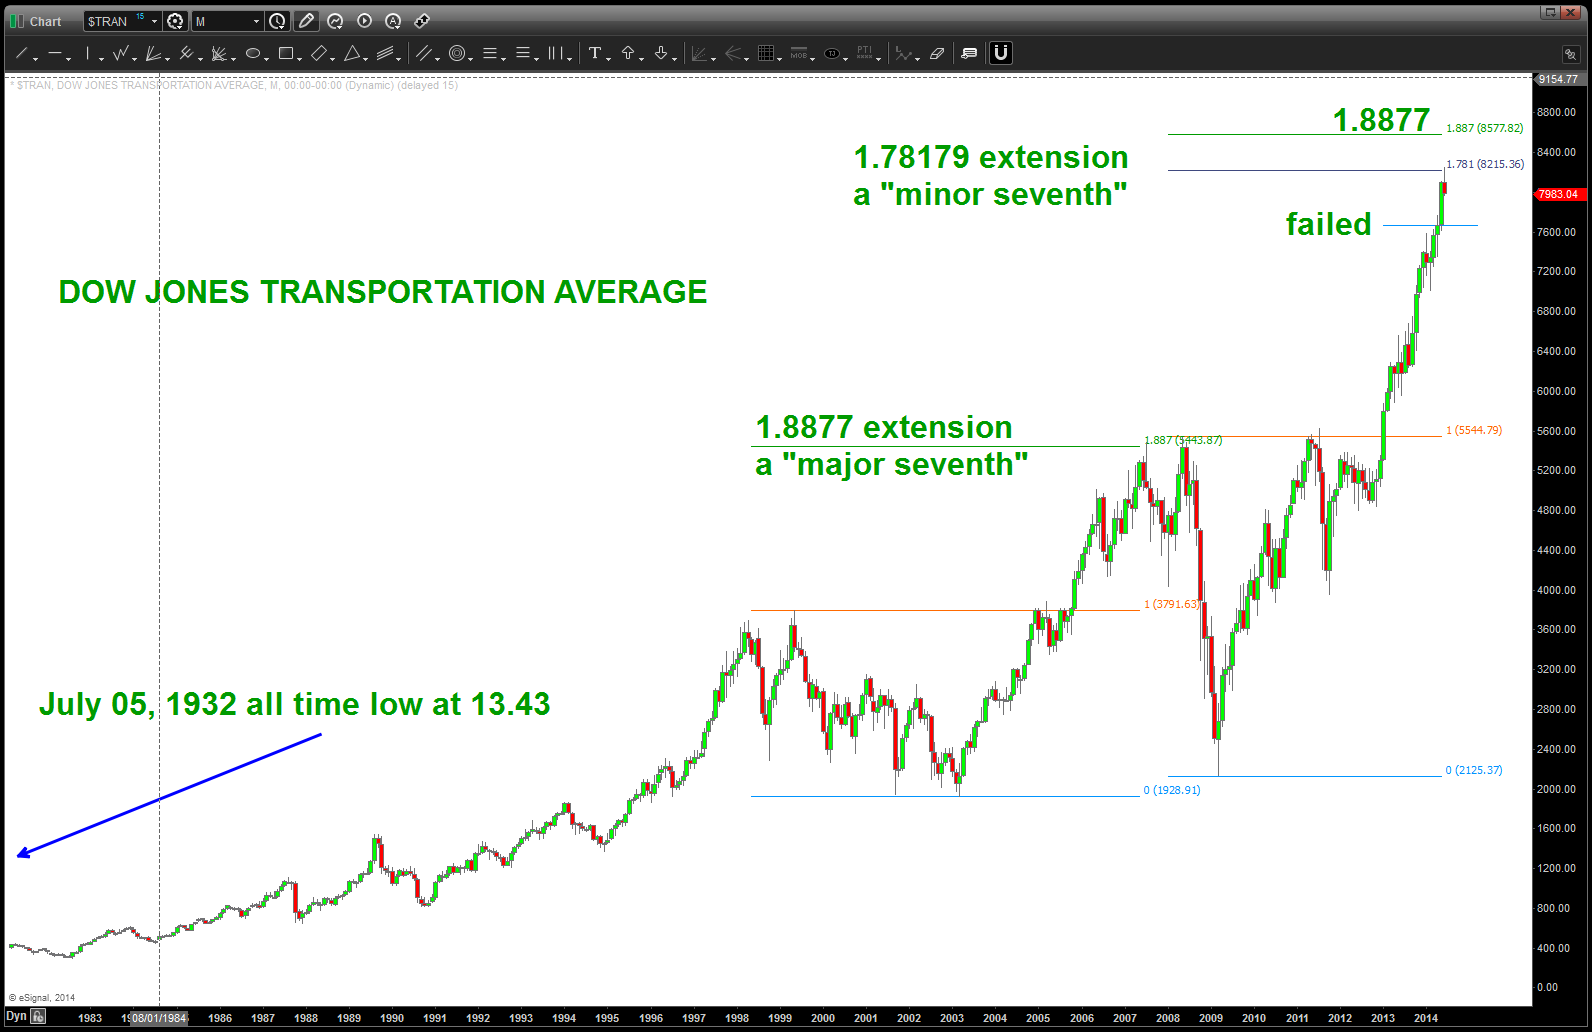
Also, please be advised that a reader corrected me on the price and time of the old time low. I did some more research and it appears the low was in the 1930’s around 30 points lower than the one in the late 1800’s. Negligible when we are up at 8000 BUT extremely important.
When you look at the Yahoo Finance Chart below – try to disregard this is the entire life cycle of the Transports – and just look at the symmetry of the 3 drives to a top pattern that is appearing.
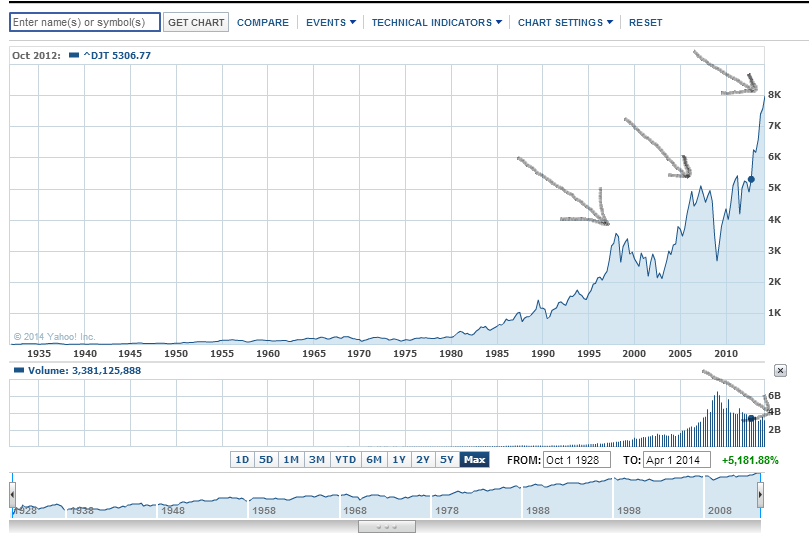
notice the decreasing volume and POTENTIAL 3 drives to a top
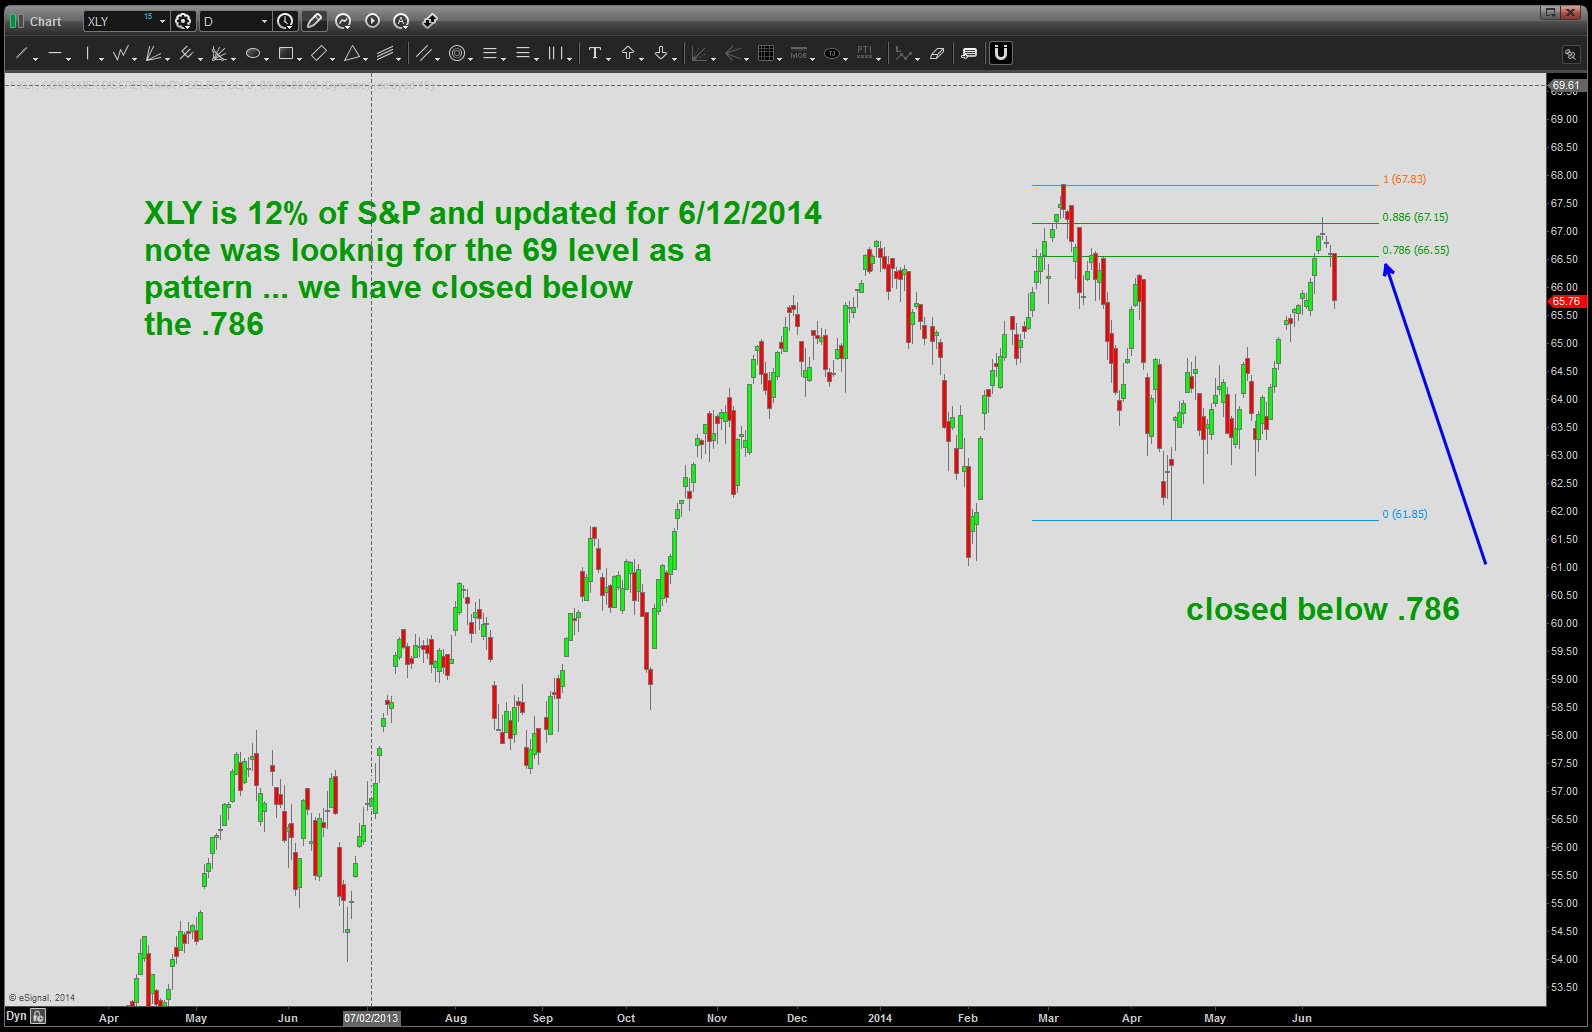
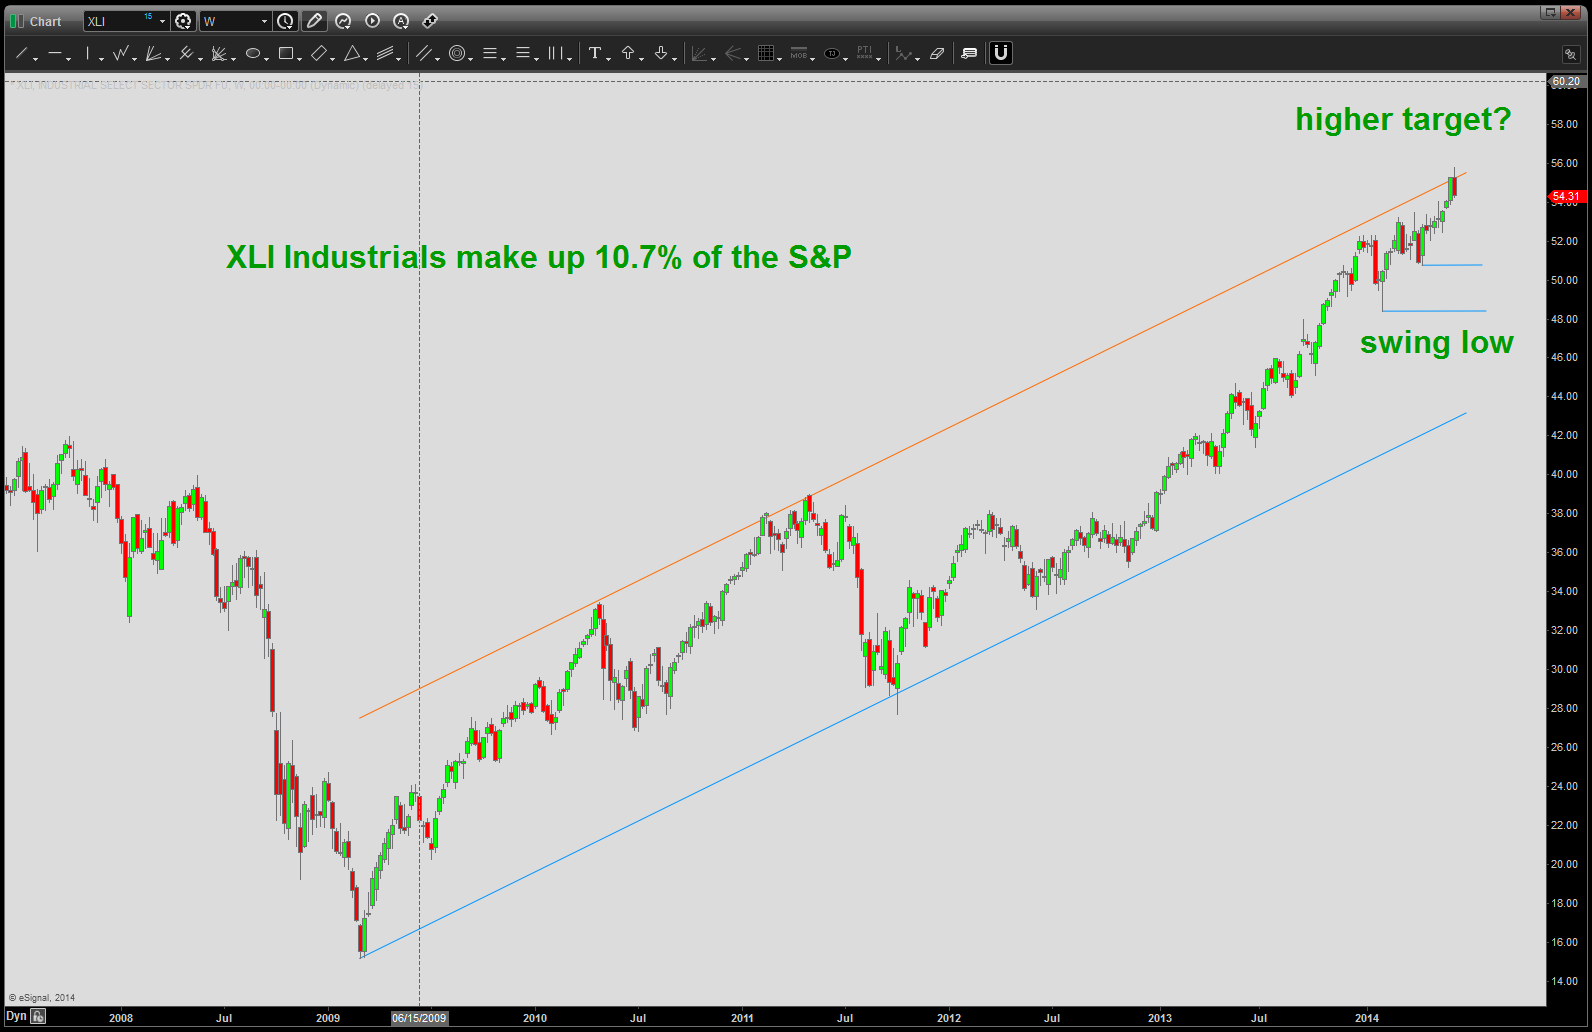
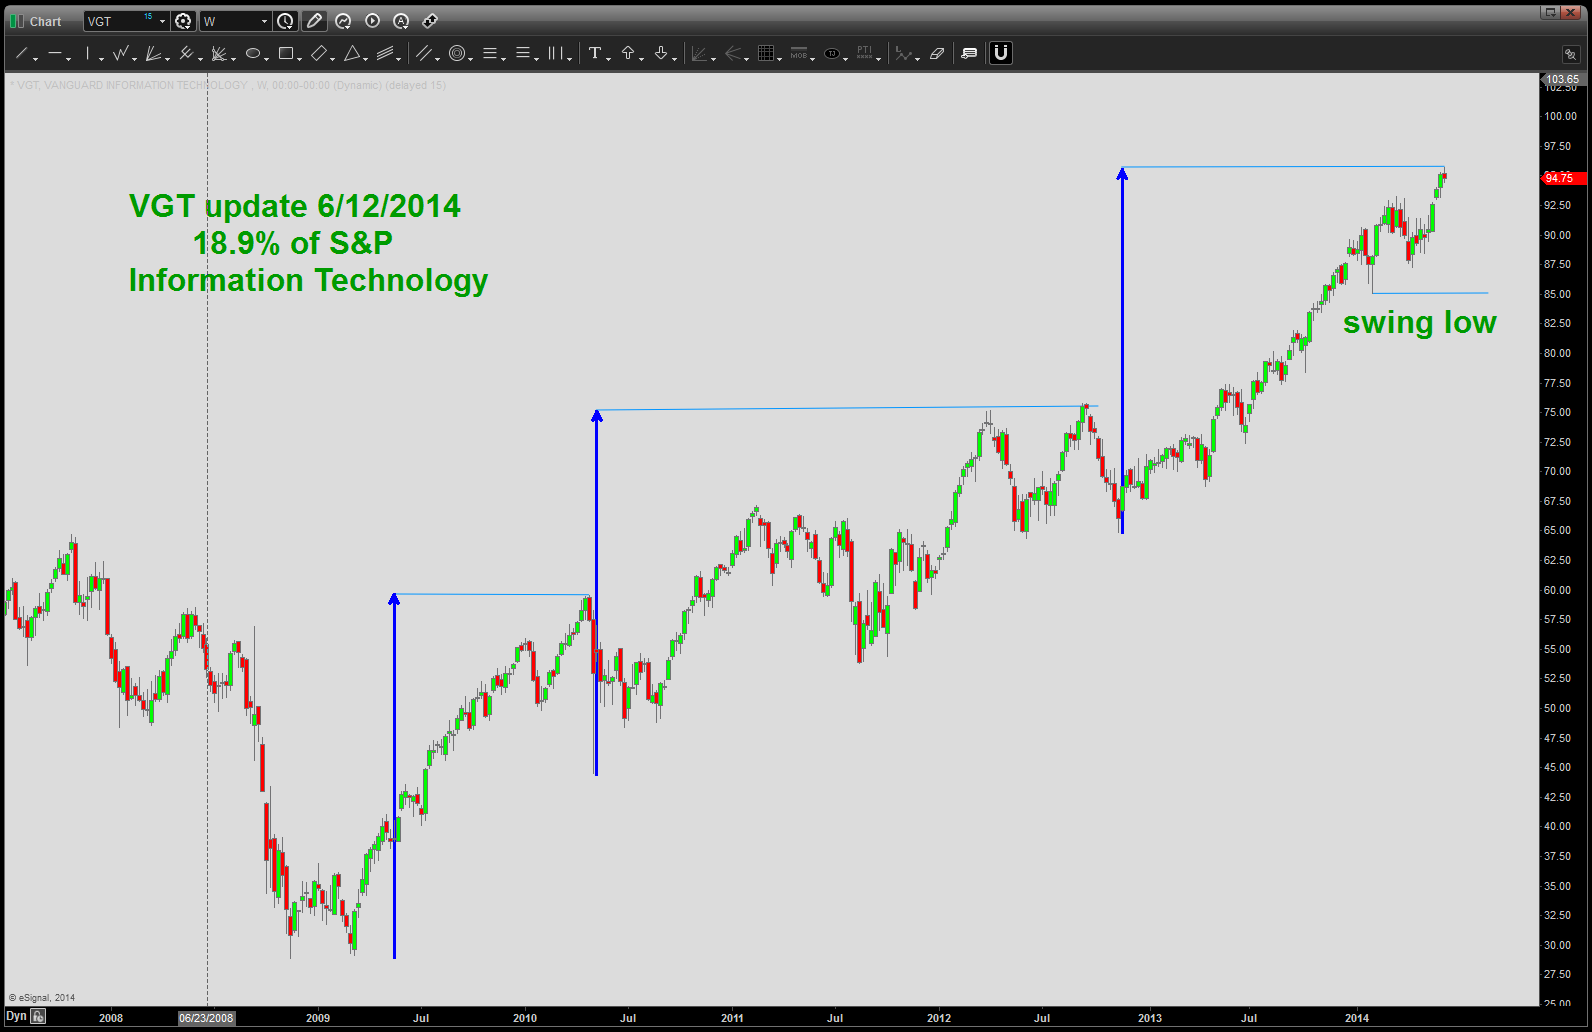
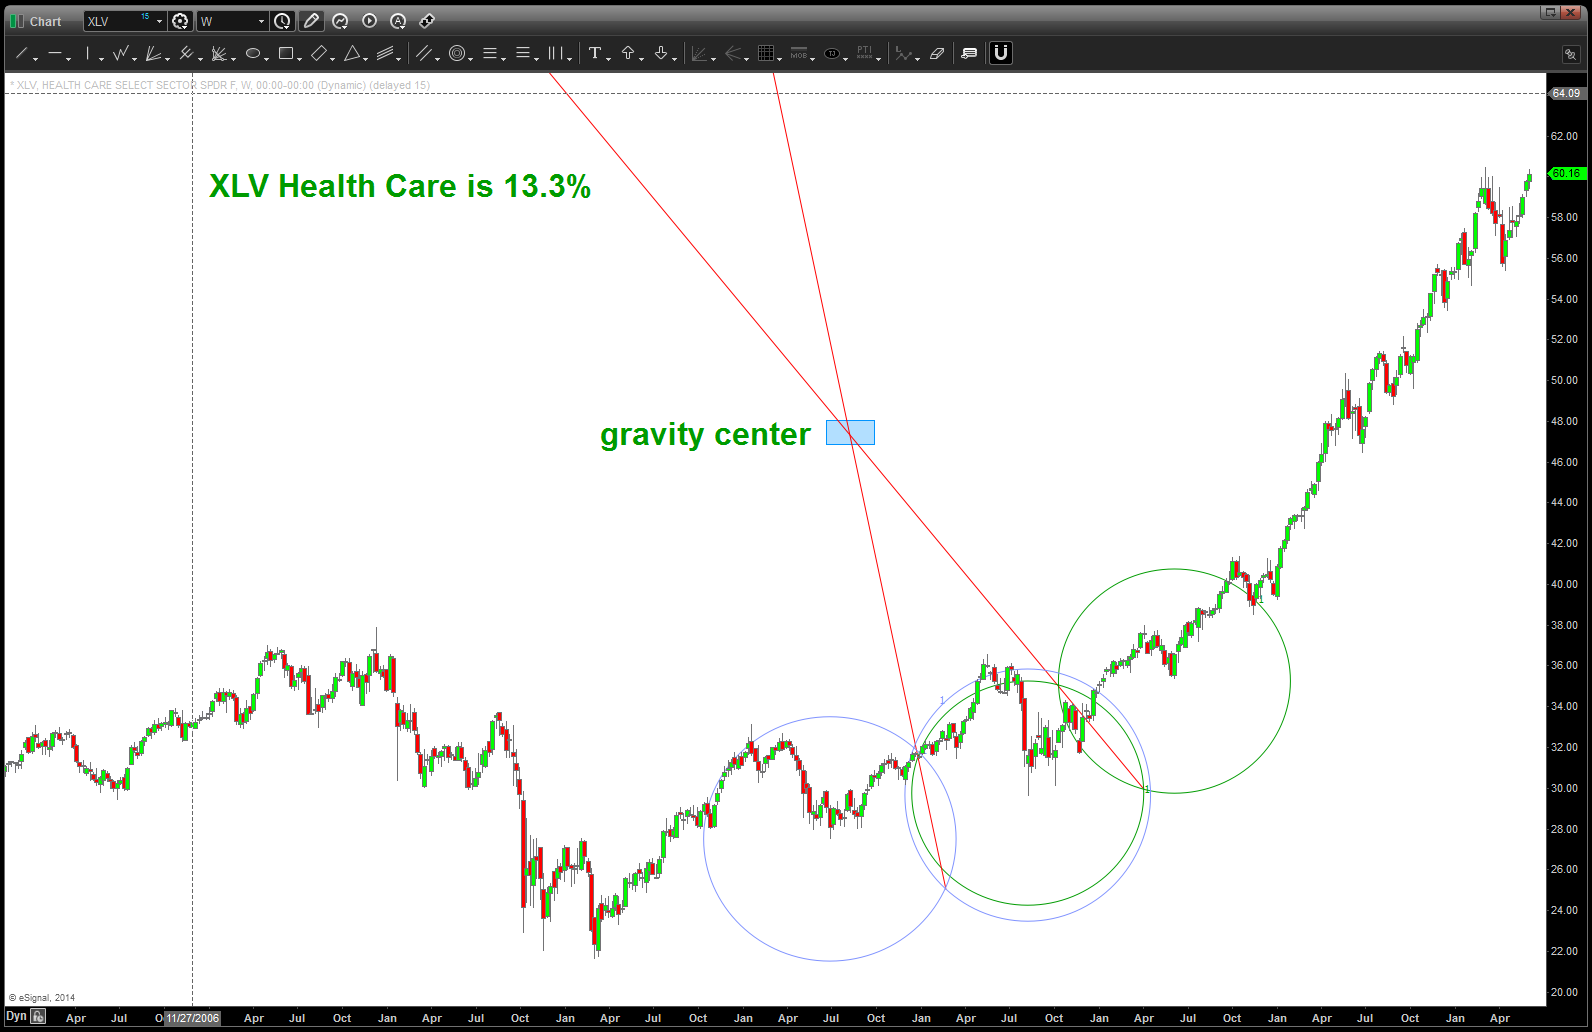
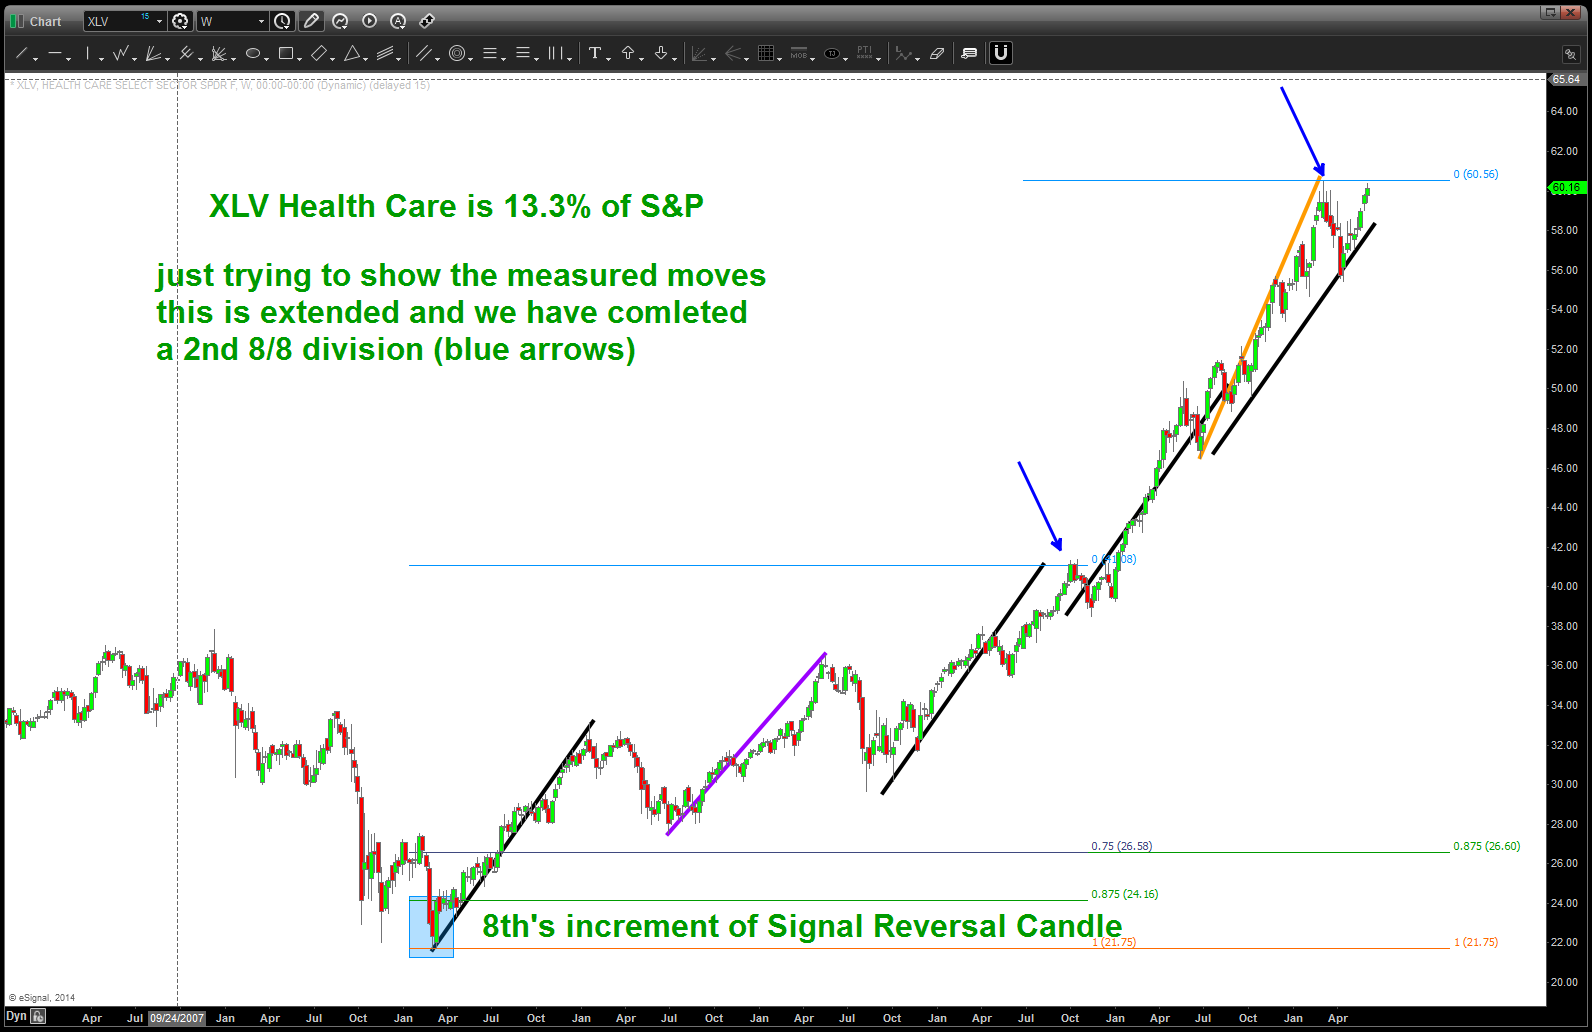
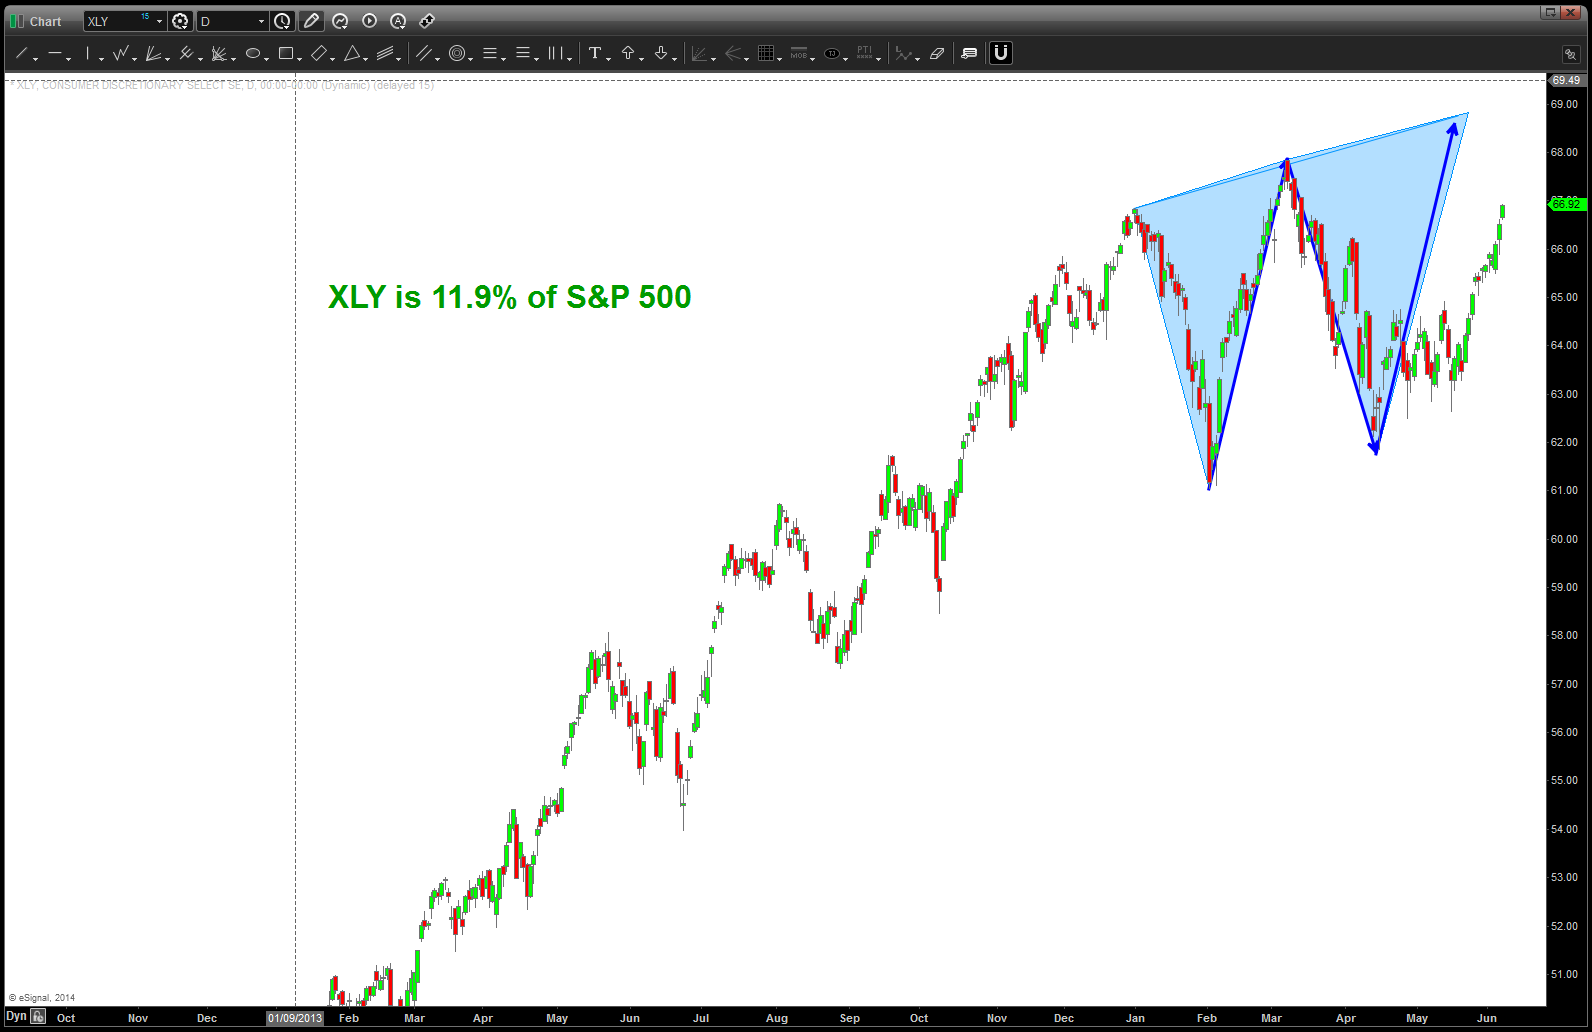
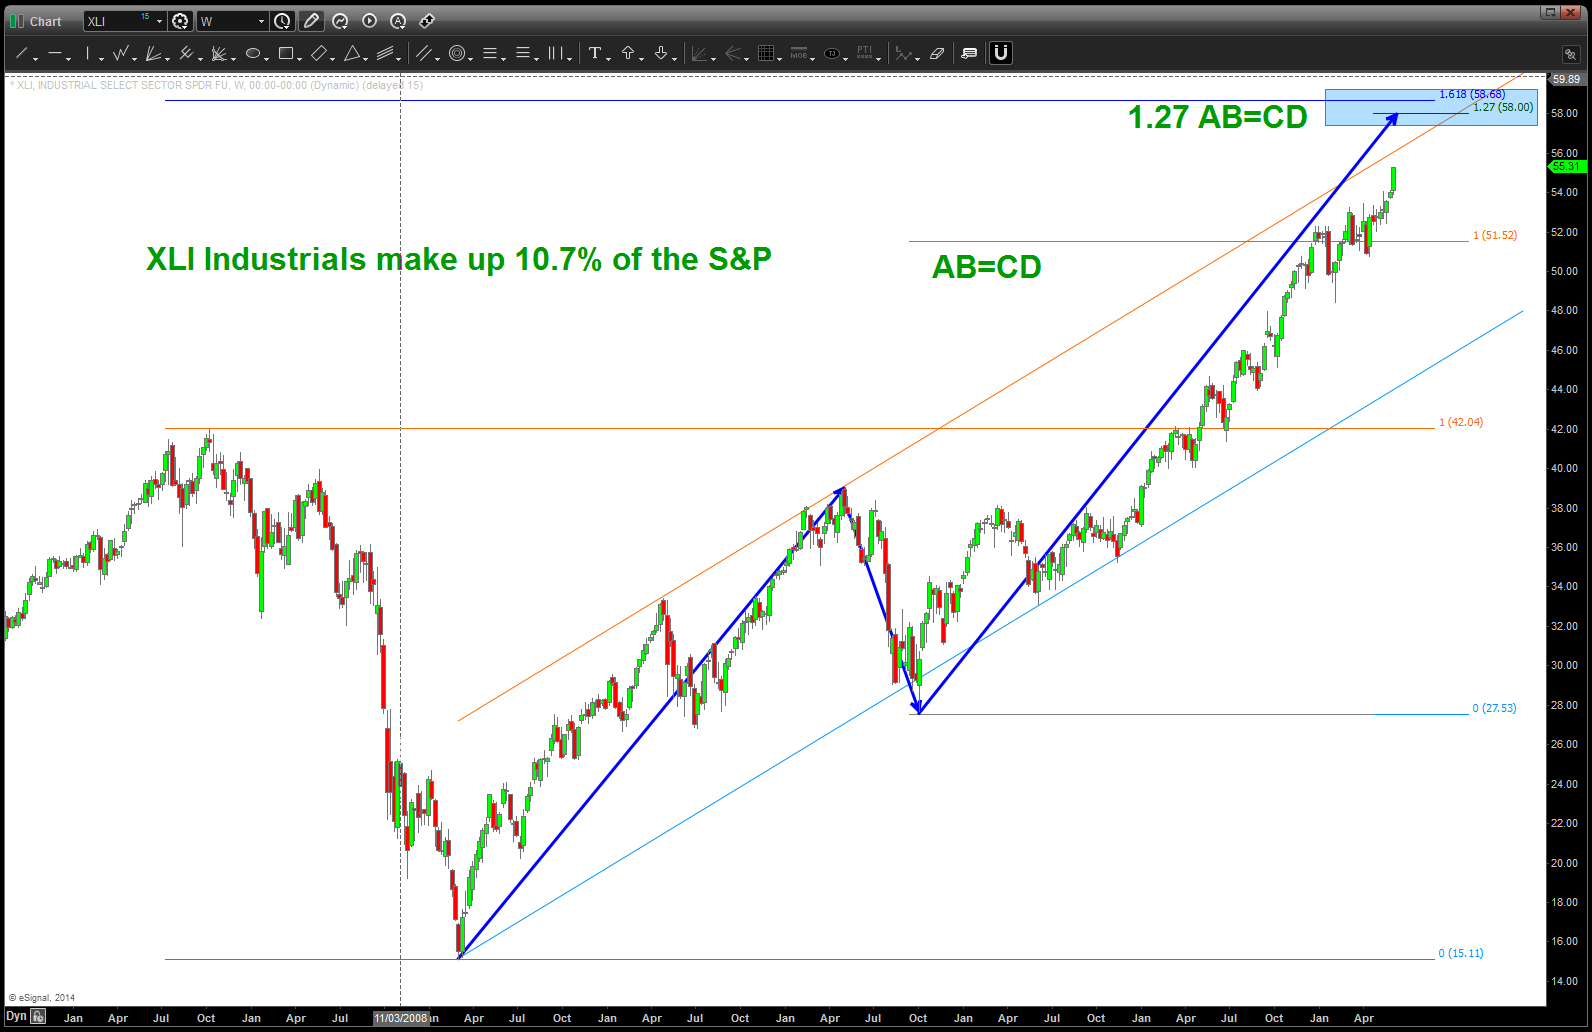
monitoring the top 10% weighted sectors ….
Posted on June 12, 2014 Leave a Comment
I really liked this post: https://bartscharts.com/2014/03/16/swing-low-sweet-chariot/
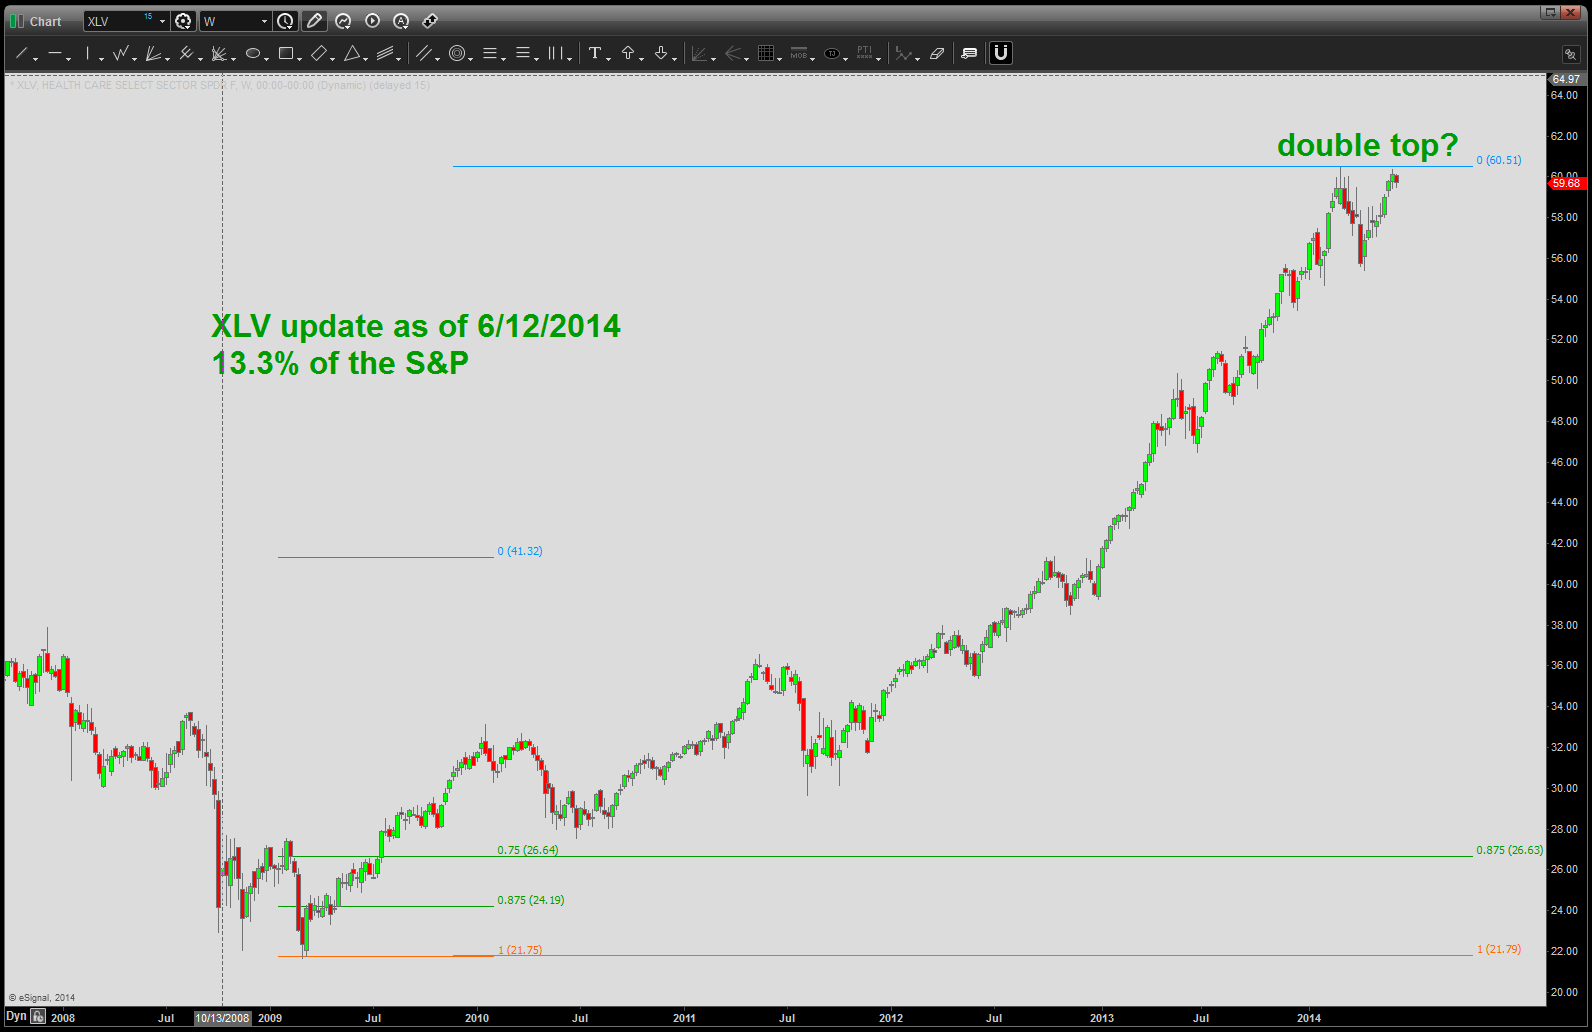
CLIFF NOTES: our PATTERNS have been hit across the board in the top weighted sectors of the S&P. However, doesn’t mean a darn thing till the swing lows are taken out. Review the post above …
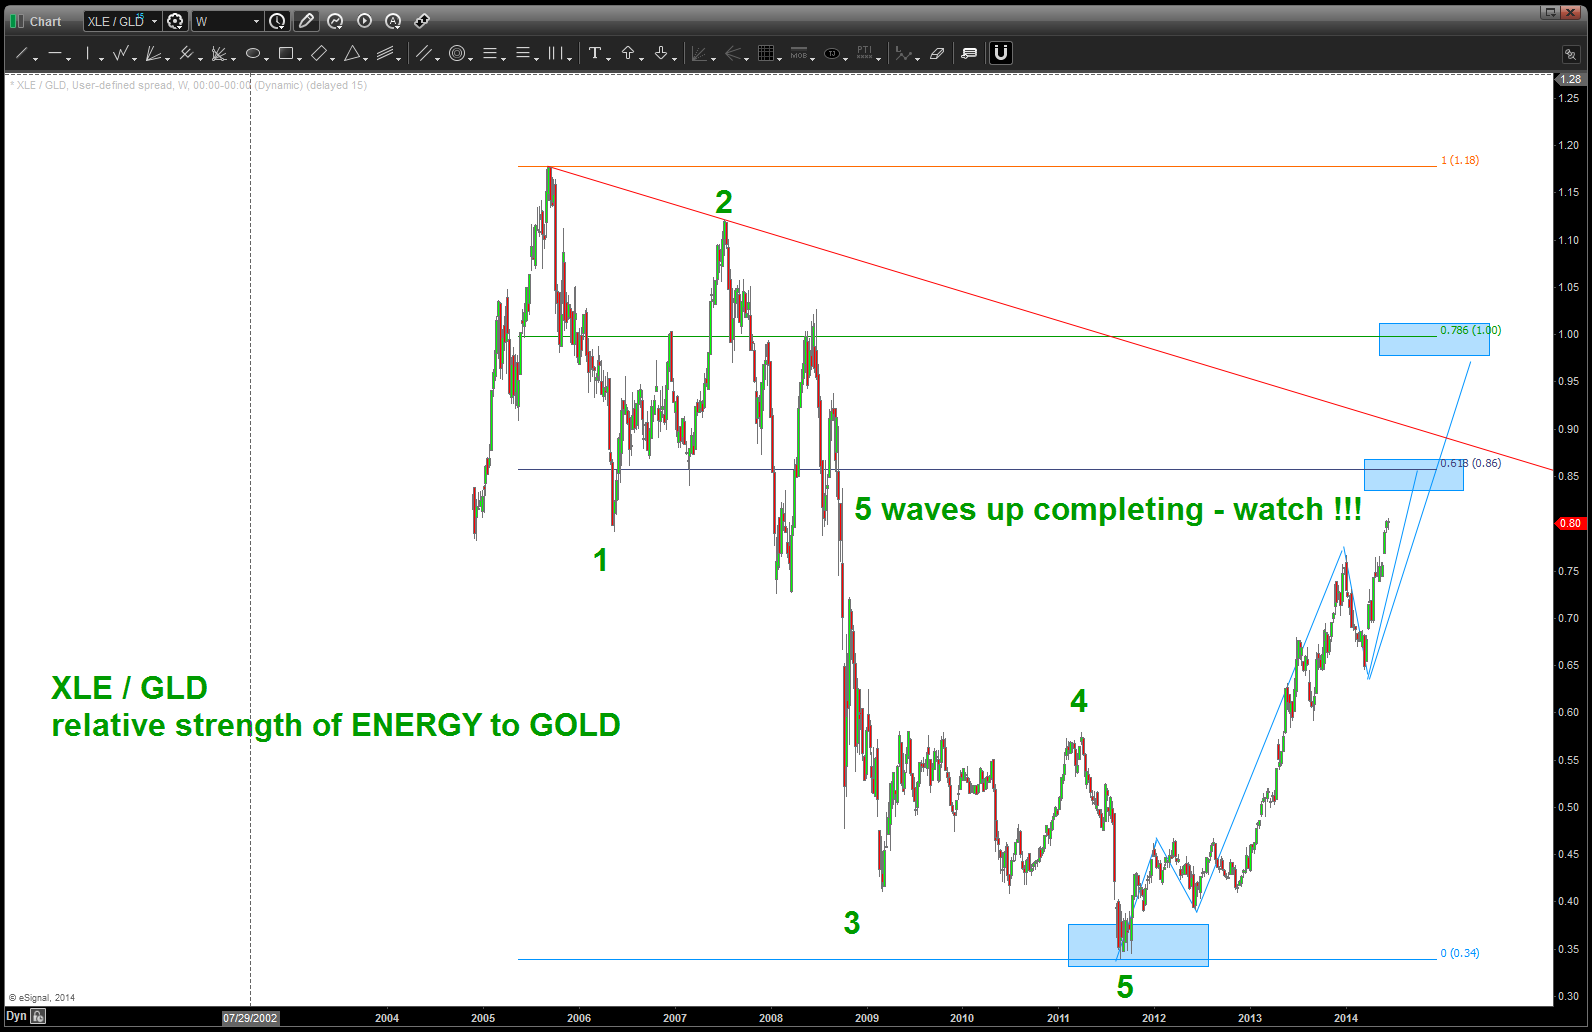
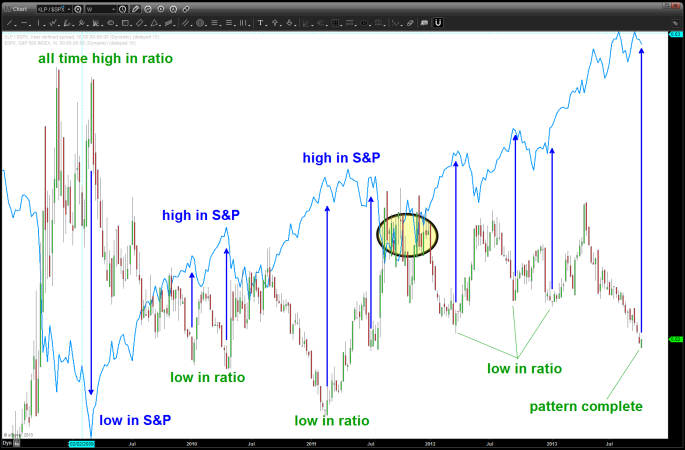
Using ratio’s for relative strength comparison
Posted on June 8, 2014 Leave a Comment
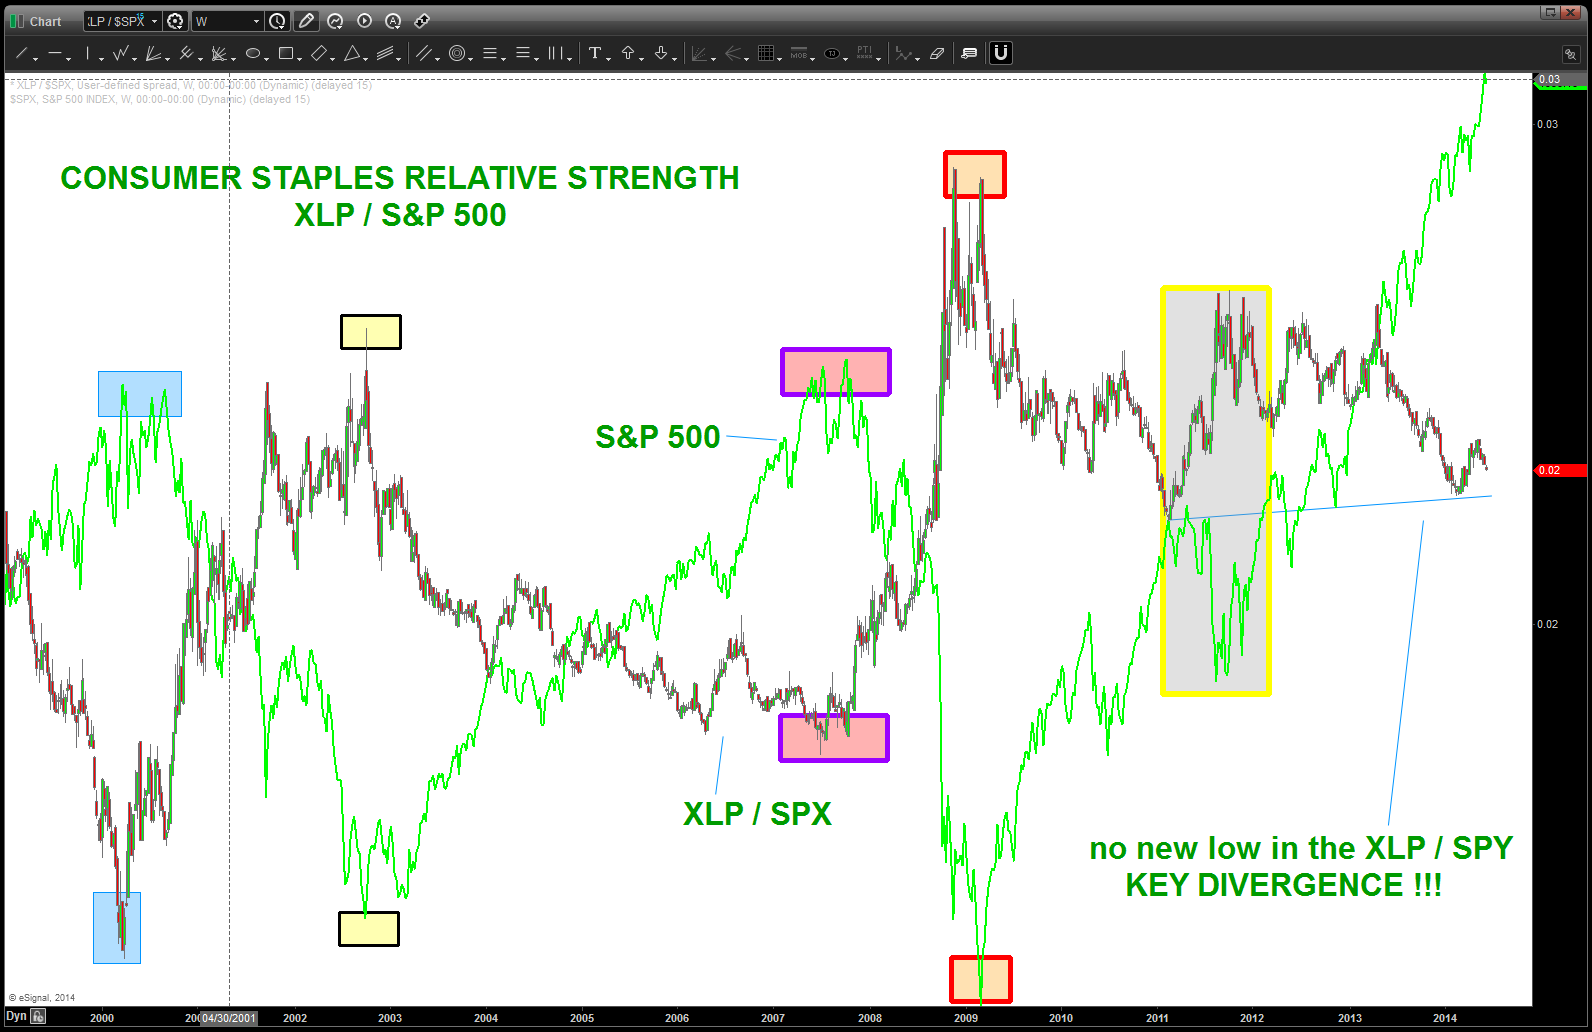
If the Numerator is bigger than the Denominator then the ratio goes UP. If vice versa, the ratio goes down. If we put one security over another then we can plot the relative strength and note when a shift in this relative strength takes place. This shift can show rotation. What you’ll find is the XLP/$SPX ratio EXACTLY nailed all the highs and lows since 2000. Yes, the high in 2000 was accompanied by an inflection in the ratio … what is of interest now is the ratio has not made a new low while the S&P makes new highs. This divergence is important …

XLP/SPX showing a buy after a typical a-b-c correction
here’s a long term monthly of the ratio posted on this blog in/around November. 2014 has shown a divergence that has not occurred since the XLP came on line. The divergence is a “new high” in the S&P while the ratio has NOT made a new low. Monitor …
long term chart showing tops and bottoms since 2000 have corresponded in the XLP/SPX ratio inflection
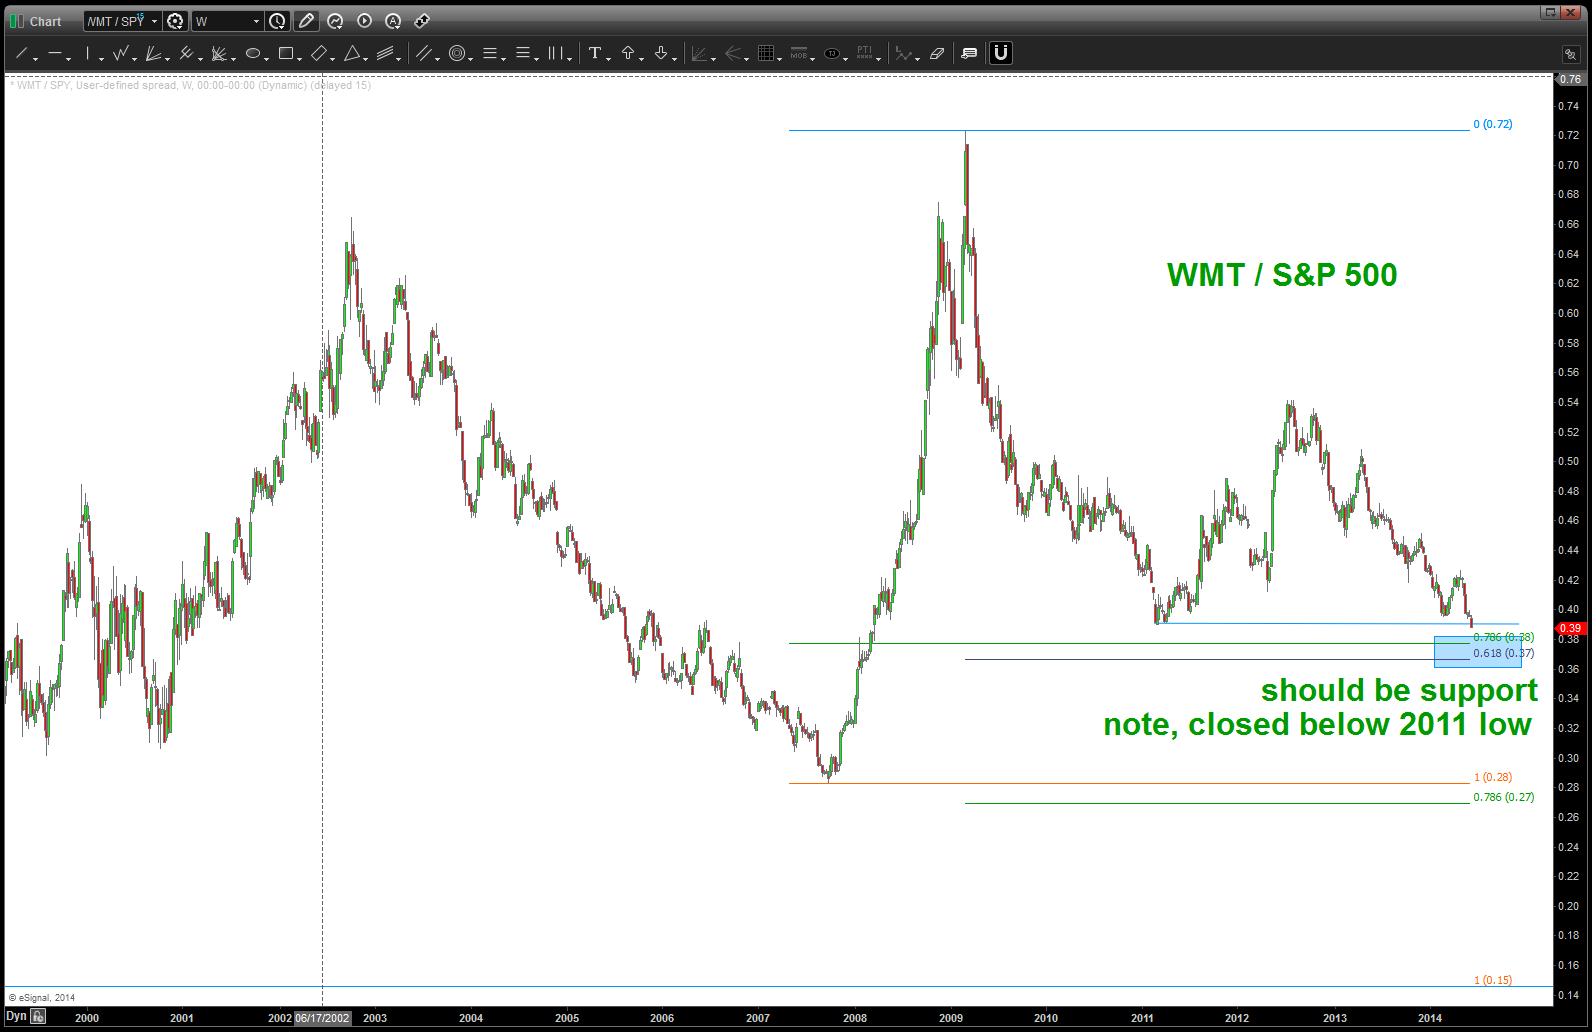
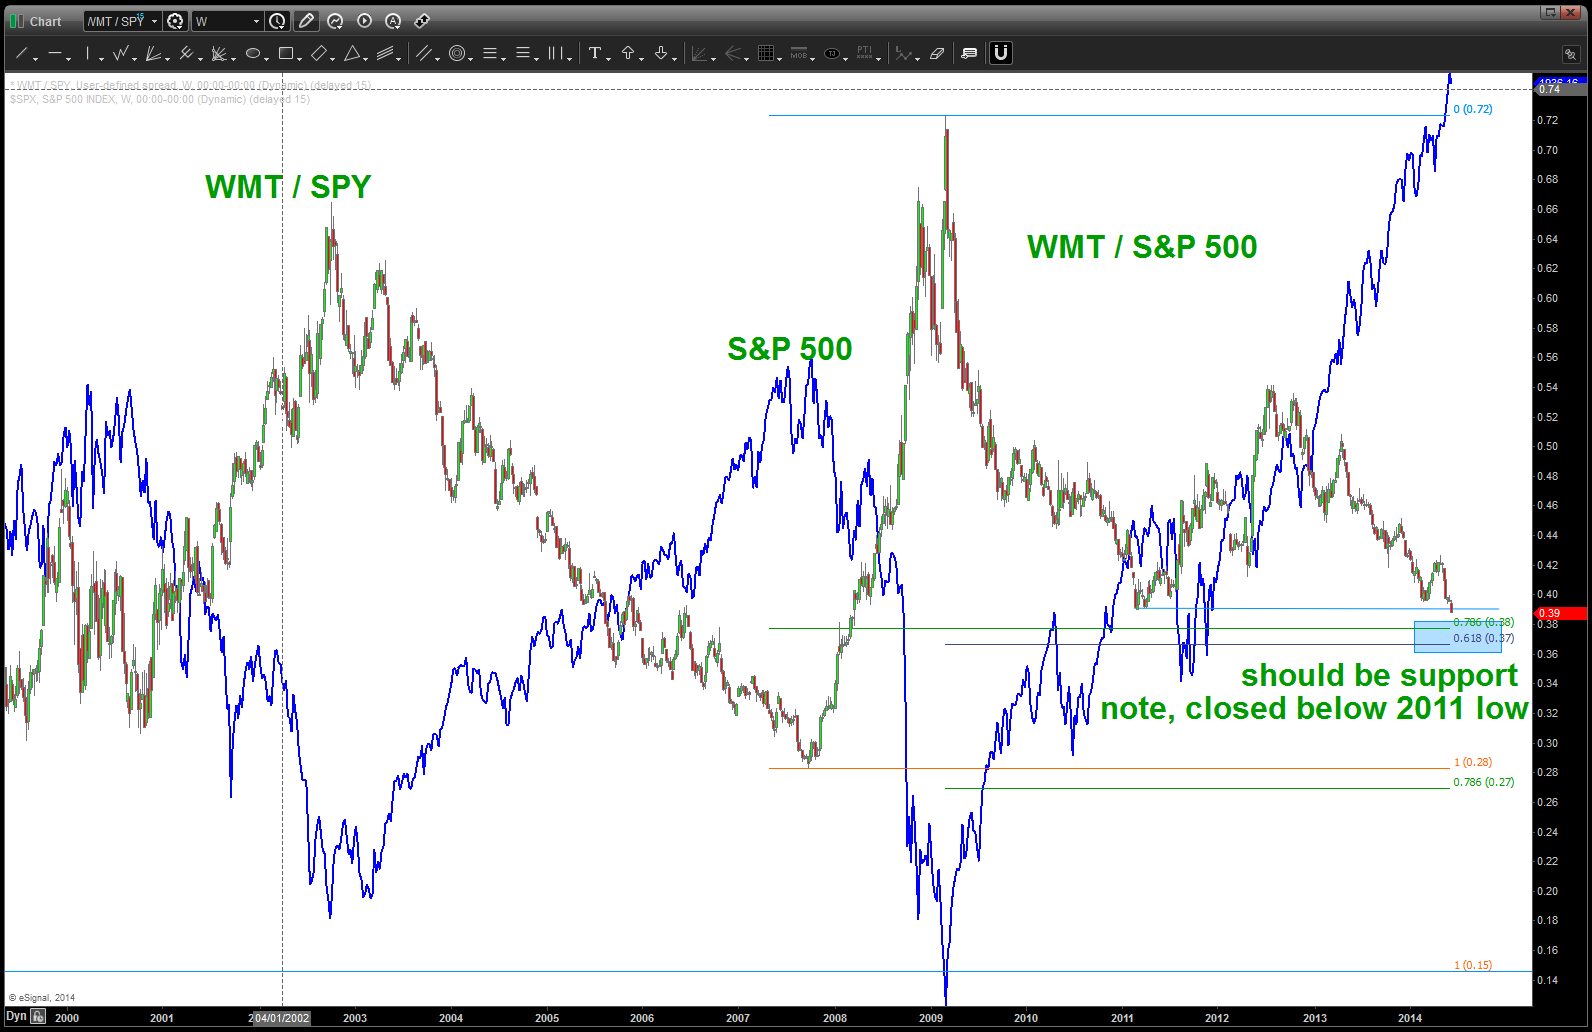
lastly, I like to use a “real world” or “main street USA” stock to monitor w/ the ratio analysis … WMT/SPX has also been extremely helpful in topping or bottoming at major inflection points. Suprisingly, this ratio has not made new lows either. In the classic technical analysis realm – looks like a double bottom forming.
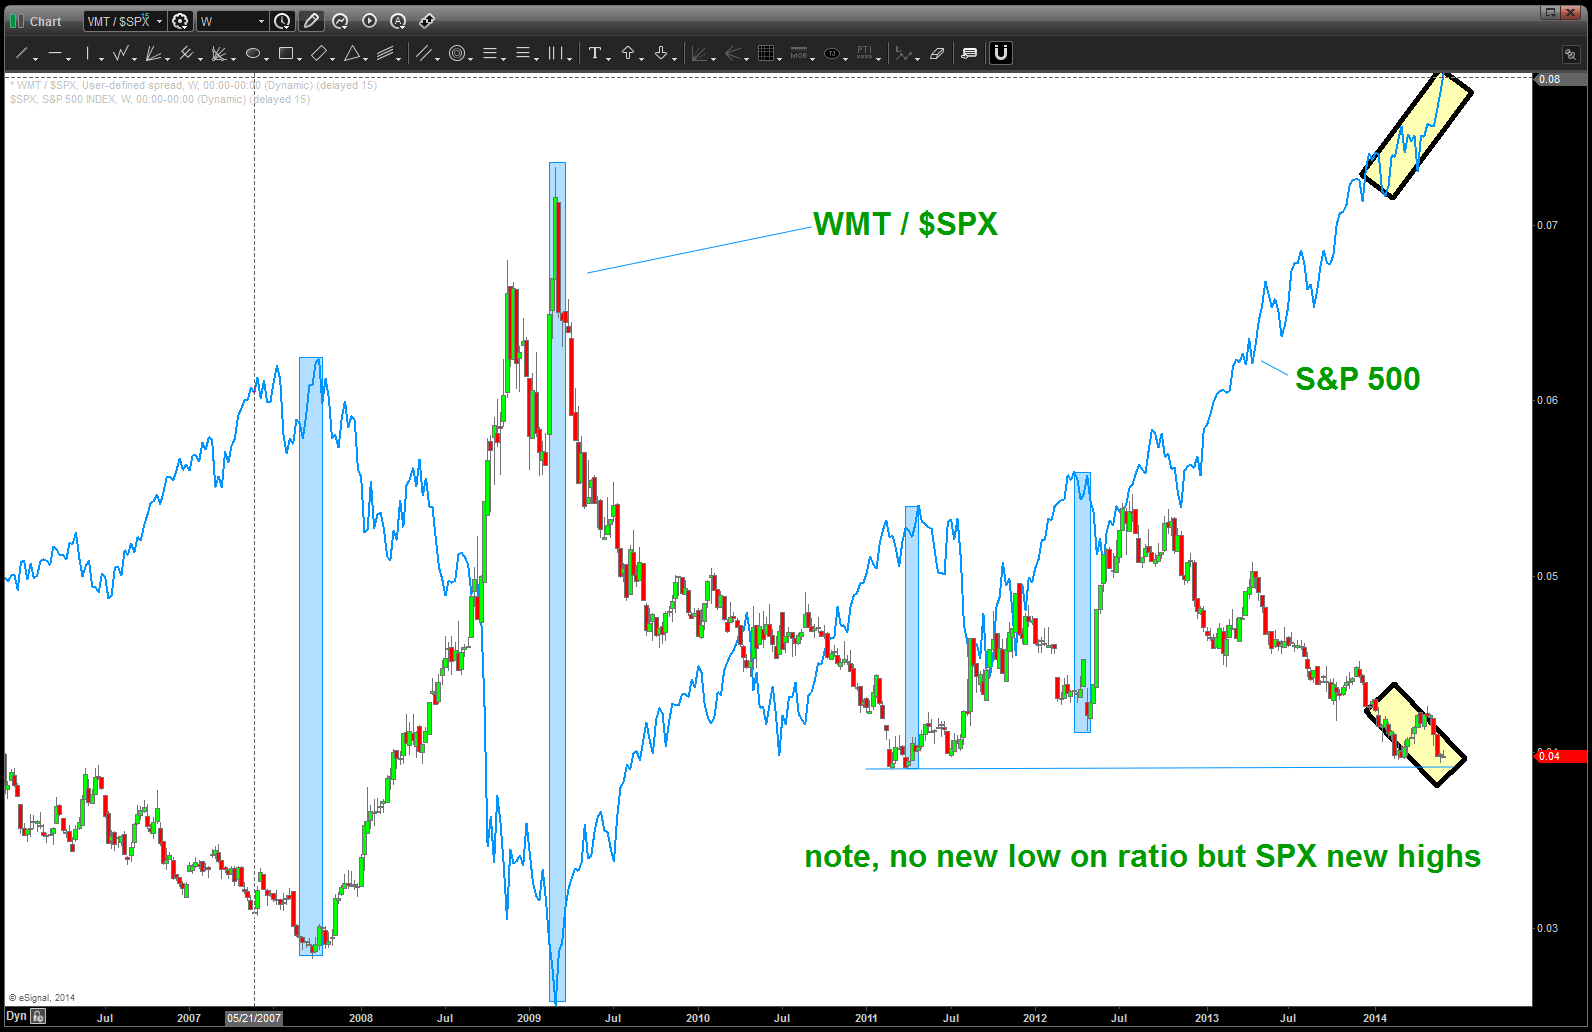
WMT/SPX ratio
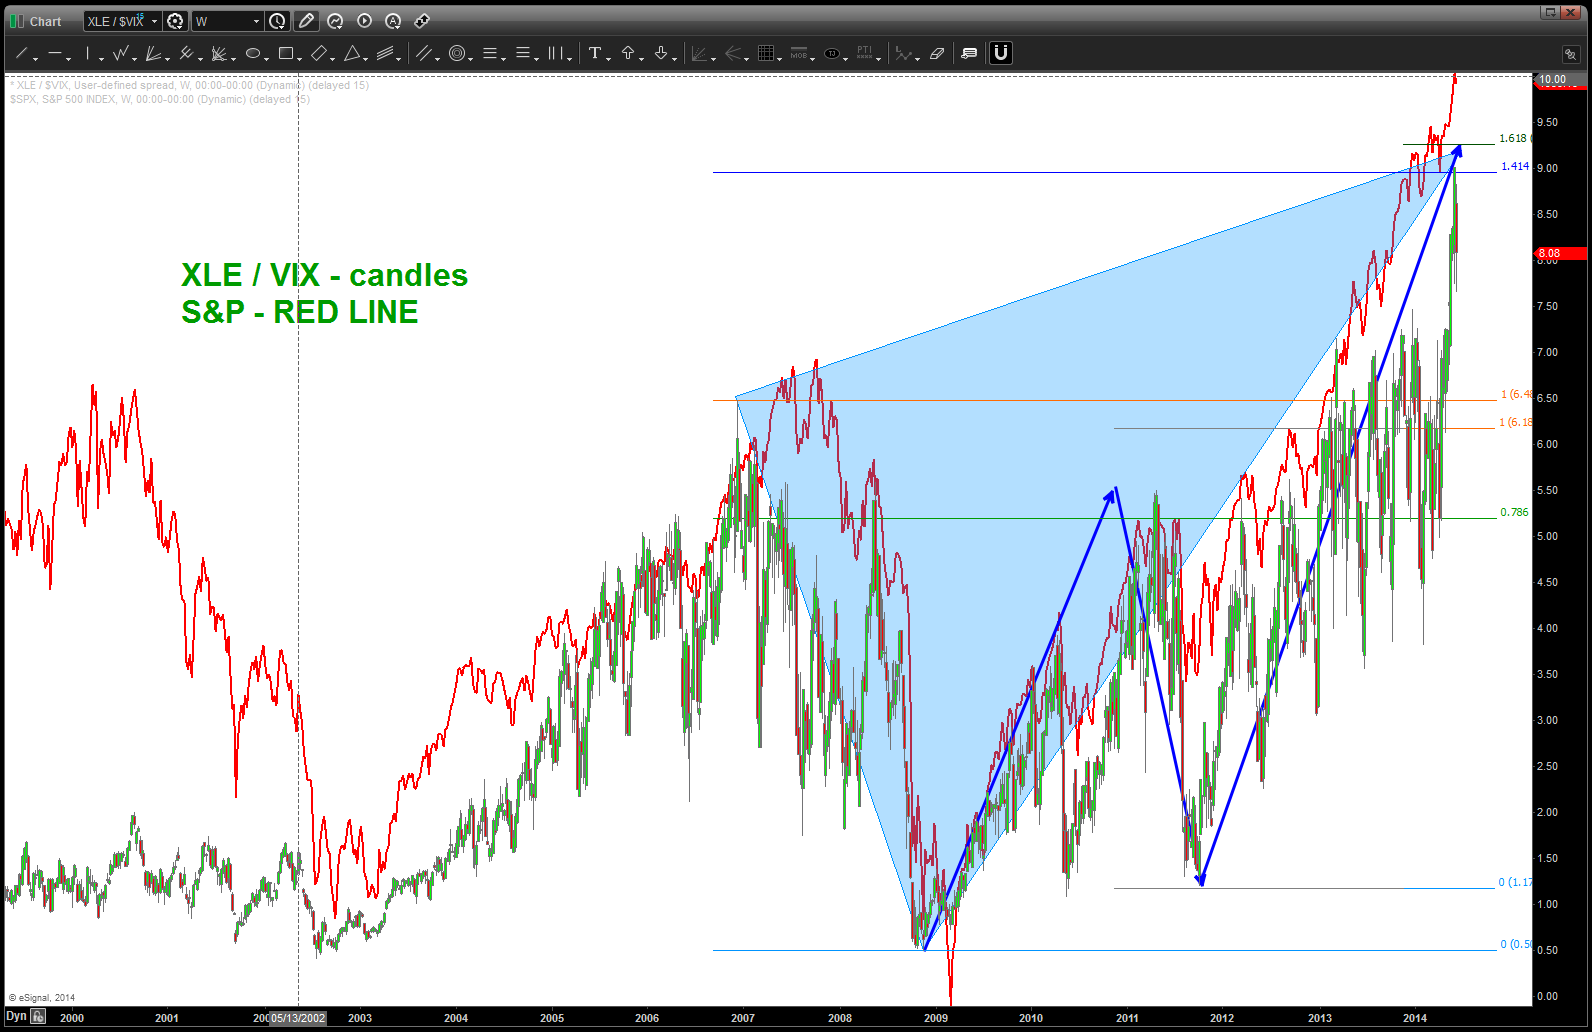
quick review, importance of XLE in the circle of life and sector rotation
Posted on June 7, 2014 Leave a Comment
if you go back some posts you’ll find me recommending to BUY the banks in March 2009. YES .. BUY in MARCH 2009. there was a PATTERN.
additionally, if you go back you’ll find that the XLF had cracked a couple weeks/months before THE top in 2007 but the S&P 500 kept going. It was pretty obvious that ENERGY was running this puppy and even though the XLF had started down, the XLE (crude) had taken off into a parabolic run to 147. And, after that topped the entire thing caved in.
AGAIN – THIS IS NOT PLAYING OUT RIGHT NOW. THE XLF CLOSED ABOVE OUR PATTERN LEVEL FOR THE FIRST TIME SINCE 2014. AGAIN – PATTERNS PATTERNS PATTERNS. The XLF is going up, the S&P 500 is going up AND the XLE is going up. The playbook was PERFECT from a sector rotation last time. Banks cracked (thank you) and then energy/oil ran and then cracked and then we caved, per the sector rotation model. NOTE – the first XLE target is coming into play. THIS IS THE EXACT SAME TYPE of pattern that the DJ Transports crushed. Don’t know if that means it will fail or not – but it’s the same basic pattern of an AB=CD into a 1.618 extension. A “perfect” butterfly SELL pattern on the XLE. So .. again we have a long term PATTERN on the DAX, a pattern on the XLE and a failed pattern on the XLF.
may you live in interesting times …
Continuing to watch the components (>10%) of the S&P 500 – an update
Posted on June 7, 2014 Leave a Comment
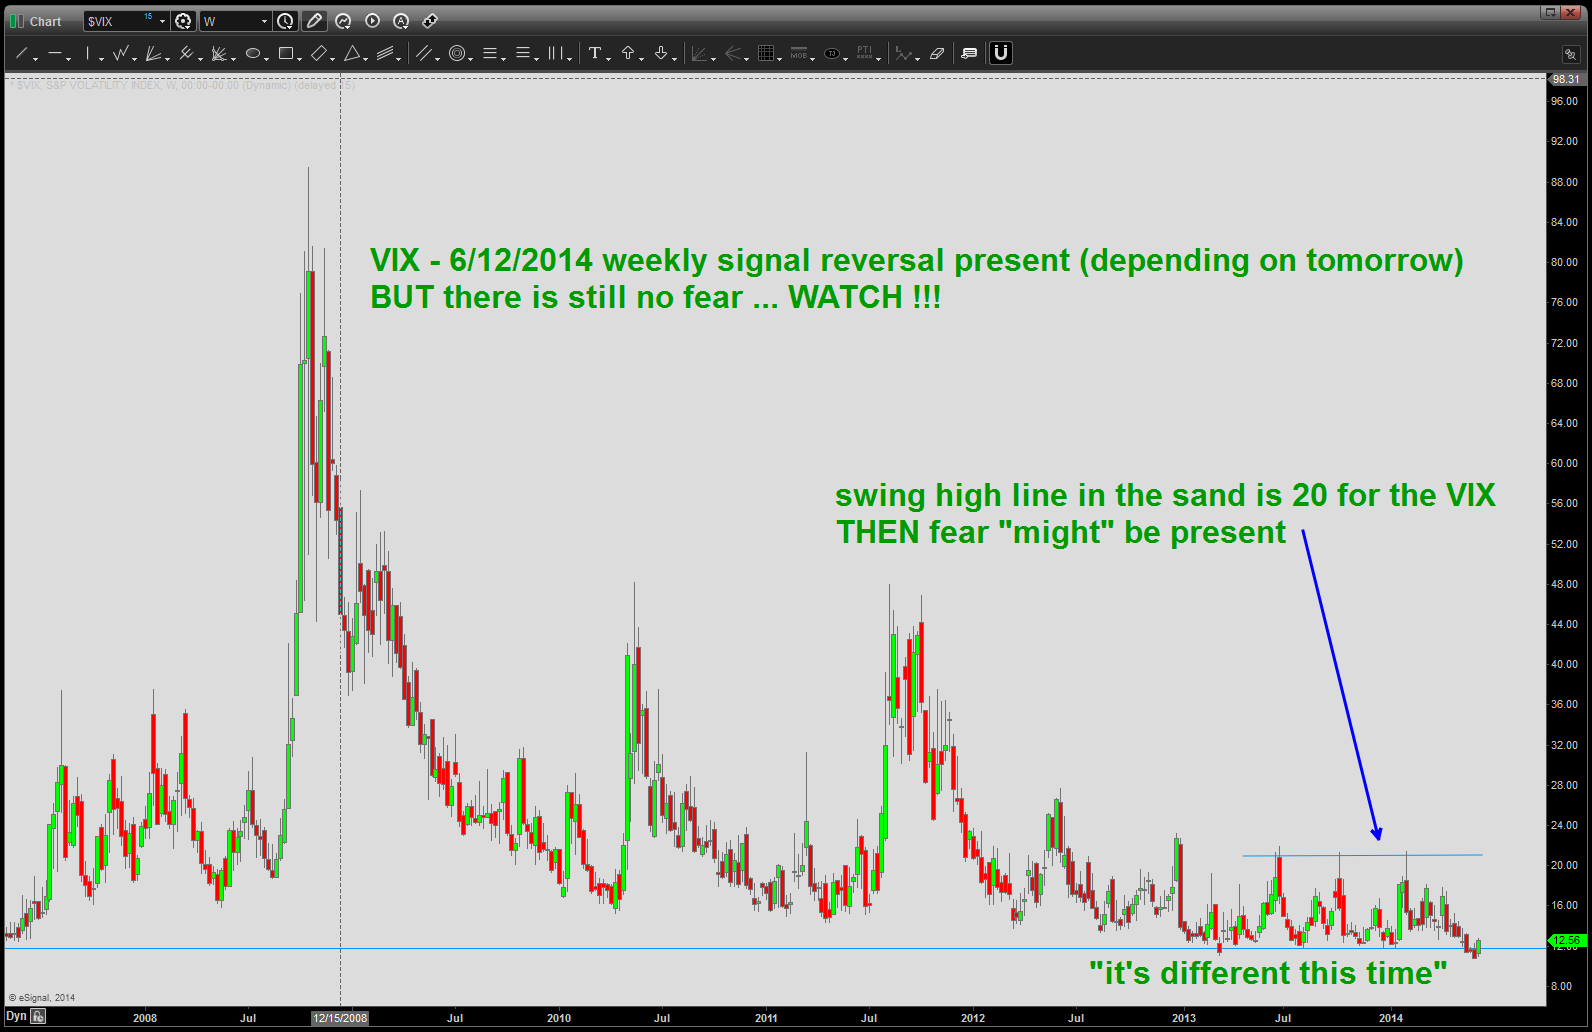
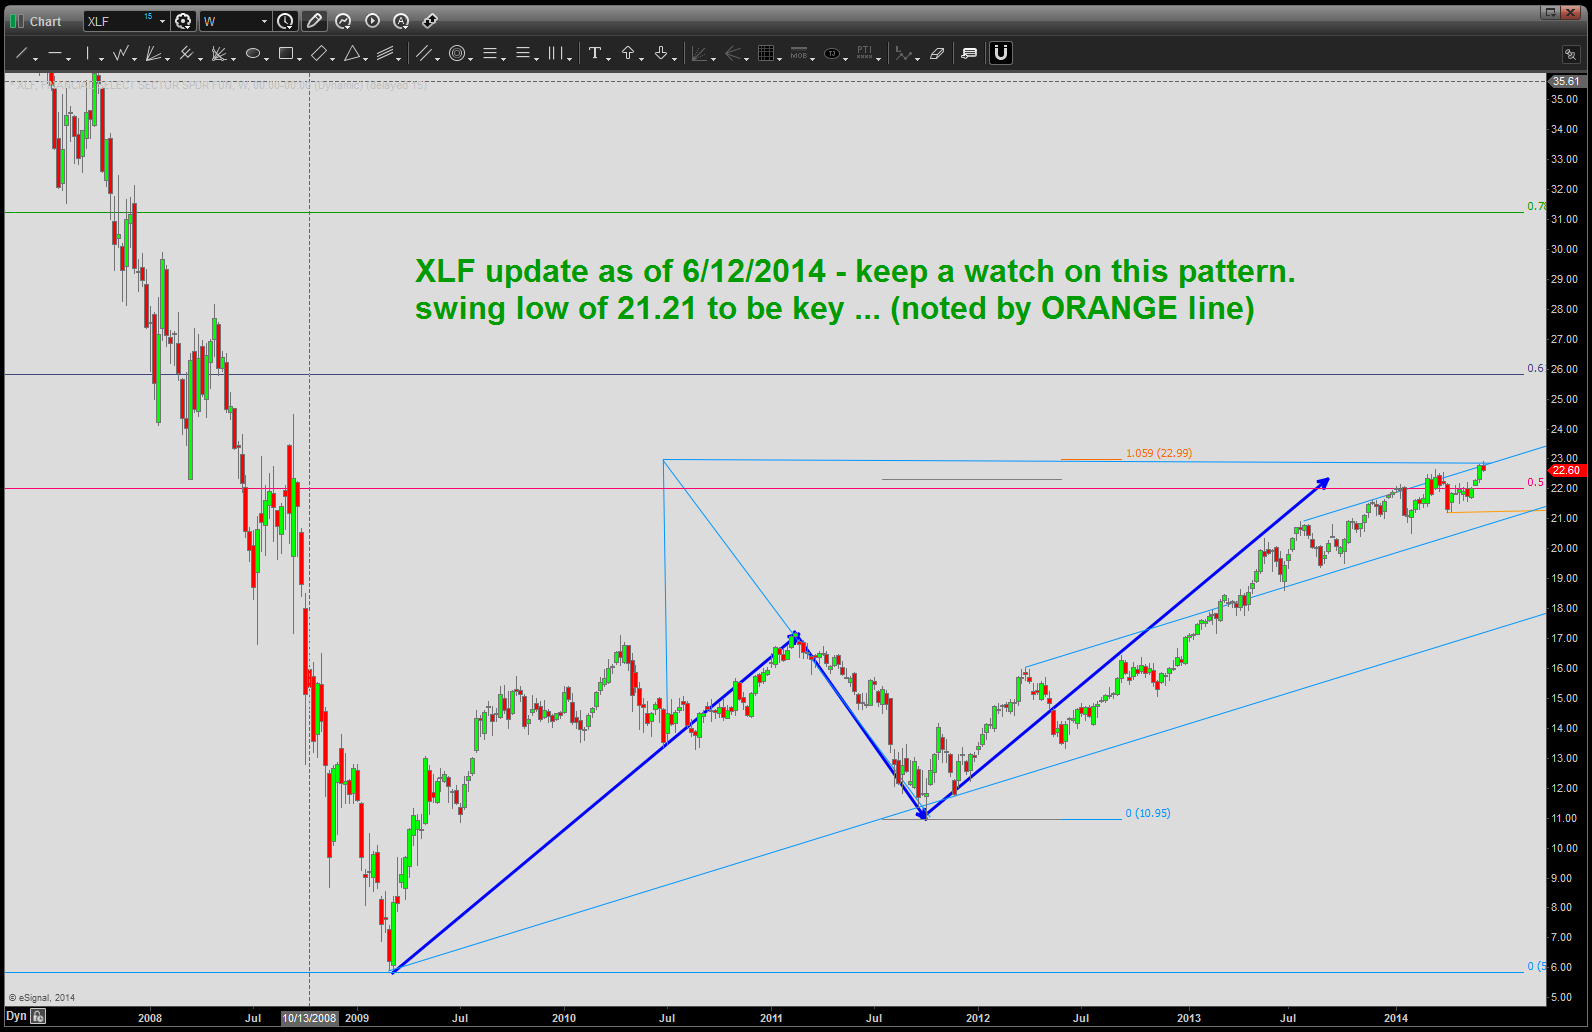
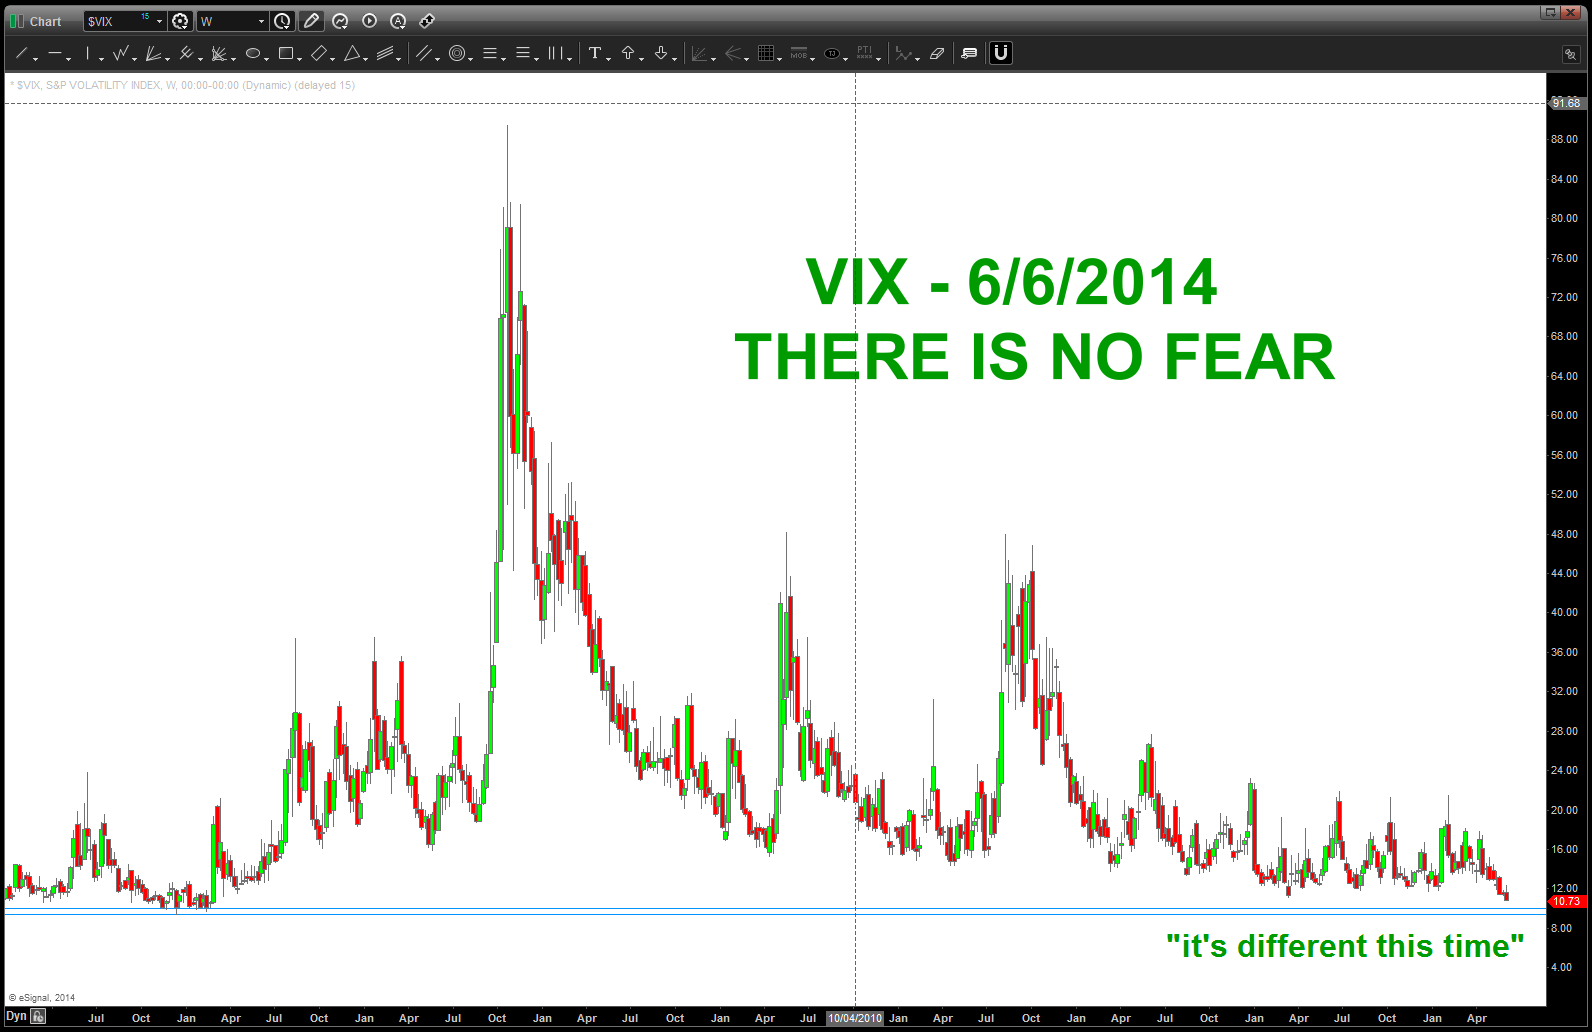
CLIFF NOTES: the biggest development of this past week was the CLOSE above our pattern level on the XLF. It is my belief, and history has shown, that the banks LEAD us UP and LEAD us DOWN. As long as the banks are stable, this market will continue it’s “Wizard of Oz’s” climb …also, my last post had the “white flag” at the bottom as I have given up and thrown in the towel to the bear patterns. It’s different this time …
“Great Googalooga, can you hear me talking to you?”
Posted on June 6, 2014 Leave a Comment
Ball of Confusion
In a normal environment this market would be correcting …

another pattern from an all time low .. this one is the German DAX
Posted on June 6, 2014 Leave a Comment
CLIFF NOTES: as I’ve said for the past 6 months (it hasn’t even been a year blogging!) this is a PATTERN RECOGNITION blog. And, guess what … we have ANOTHER PATTERN from an all time low. Here’s the pattern …
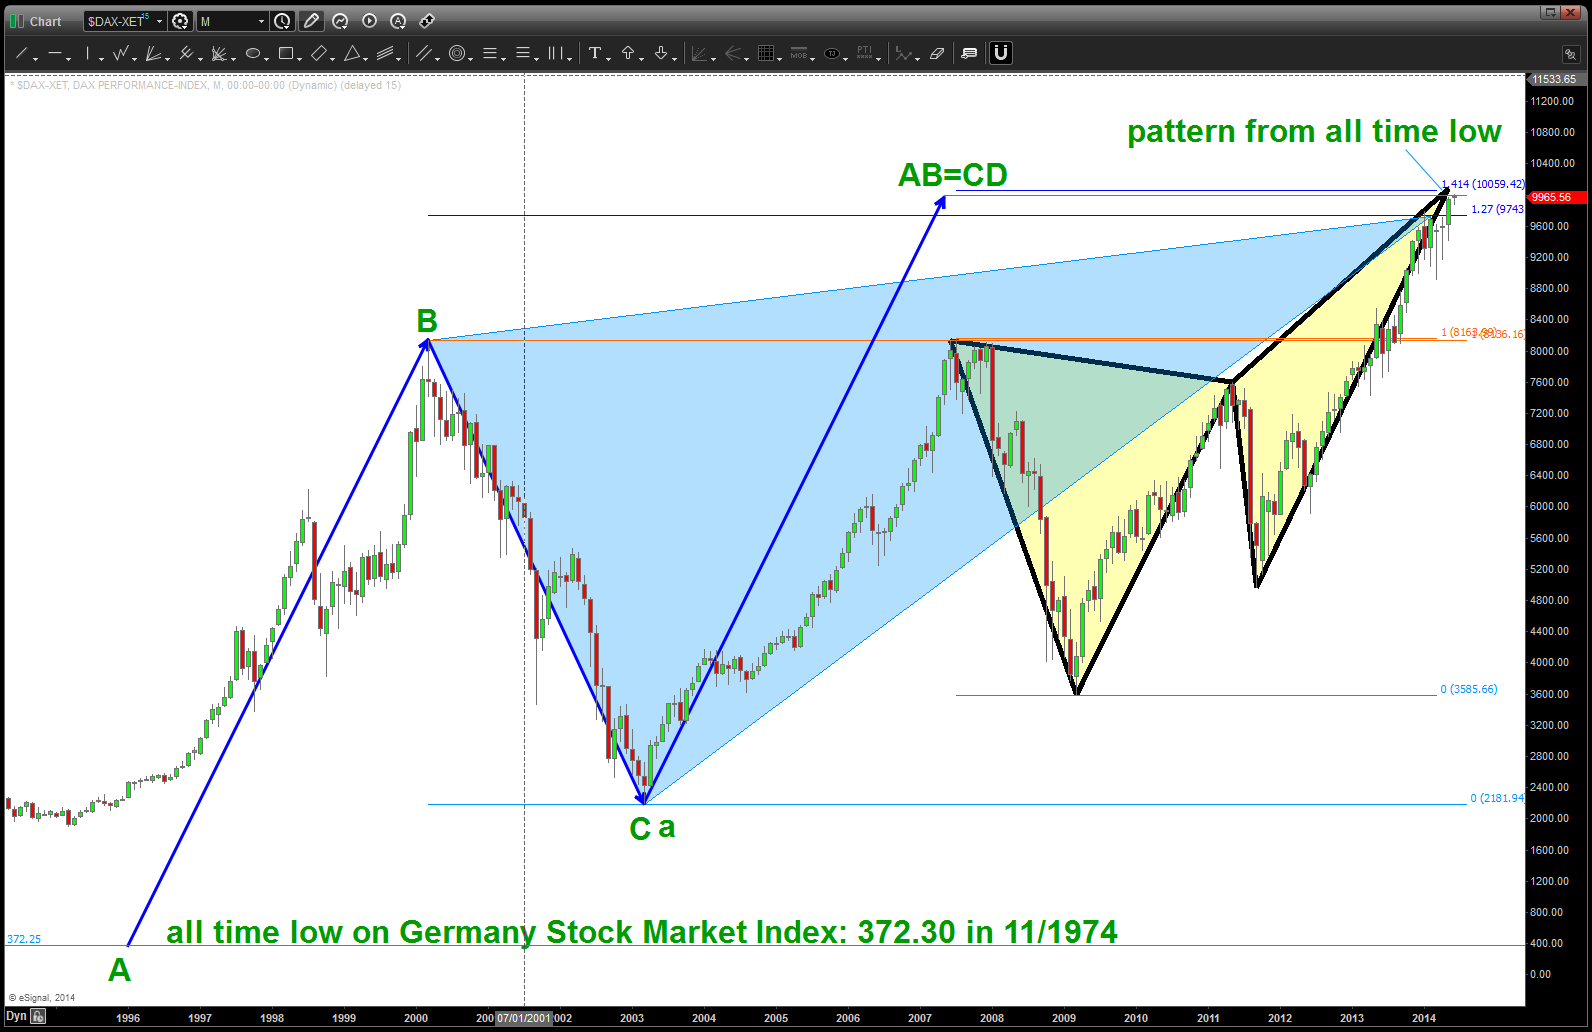
German Dax
