not sure what to title it, so just going to call it Part I
Posted on July 11, 2014 2 Comments
“There is a geometry of art as there is a geometry of life, and, as the Greeks had guessed, they happen to be the same.” — Matila Ghyka
I had the wonderful opportunity to sit down and have cocktails w/ JC this week … want to, again, thank him for a bunch of things.
- Thank you for getting me to blog … almost been a year and I really enjoy it. Thanks …
- Thank you for advancing the art of technical analysis the most of any technician in the past decade. (my opinion) Quite frankly, he’s energetic, accurate and shows the world that you don’t have to be a geek to understand TA.
Everyone has a story and he got an earful of mine …(I bought the drinks so he was required to listen (JK)) We discussed a myriad of subjects but the bottom line is he told me to “tell the story.” So here we go …
One caveat … it DOES NOT matter how you enter/exit the market. Just “find” YOUR edge, believe in it and pull the trigger.
My edge is “advanced pattern recognition” – we both tried to come up w/ a name for it and this just sticks. So if you dare to start down this quest (trust me it is a quest) then here’s where we start….
It is crazy that the largest market in the world – FX – will stop on a dime and pivot at the completion of a PATTERN based on harmony, geometry, music, square roots and the like. So, if it is crazy, then how in your right mind can you take a trade if you believe this is the case? Well you can’t … so before anyone starts down the path of market harmonics, music, vibration, etc. it is imperative that they read, digest and enjoy this book:

http://www.constructingtheuniverse.com/
IF, the big IF, you can’t put this book down (like me) then your hooked and I’m sorry. 🙂 If you struggle w/it and it doesn’t resonate w/ you then, do yourself a favor, and STOP and don’t go changing. It’s not that your not intelligent or anything like that … it just doesn’t resonate w/ you, so don’t force it. Trust me, you’ll know.
So …after reading this book and posting some great numbers I was asked by my friend Cody Taefel, CMT to lecture at the University of Richmond. Here’s the intro slides that I used to summarize vibration theory in 15 minutes or les:
I was also asked by my good friend, Jeff Lay, CMT to give a 15 minute presentation at the 2009 Annual MTA Seminar as an “Emerging CMT” – here’s the link of my discussion:
http://mta.s-fx.com/videos/2009/symposium/emerging-cmt-panel/emerging-cmt-panel.html
It was my thought that this presentation would be well received. It wasn’t … not sure why, but for whatever reason, it didn’t necessarily resonate w/ the crowd and I went back to Leesburg VA. That was 5 years ago …
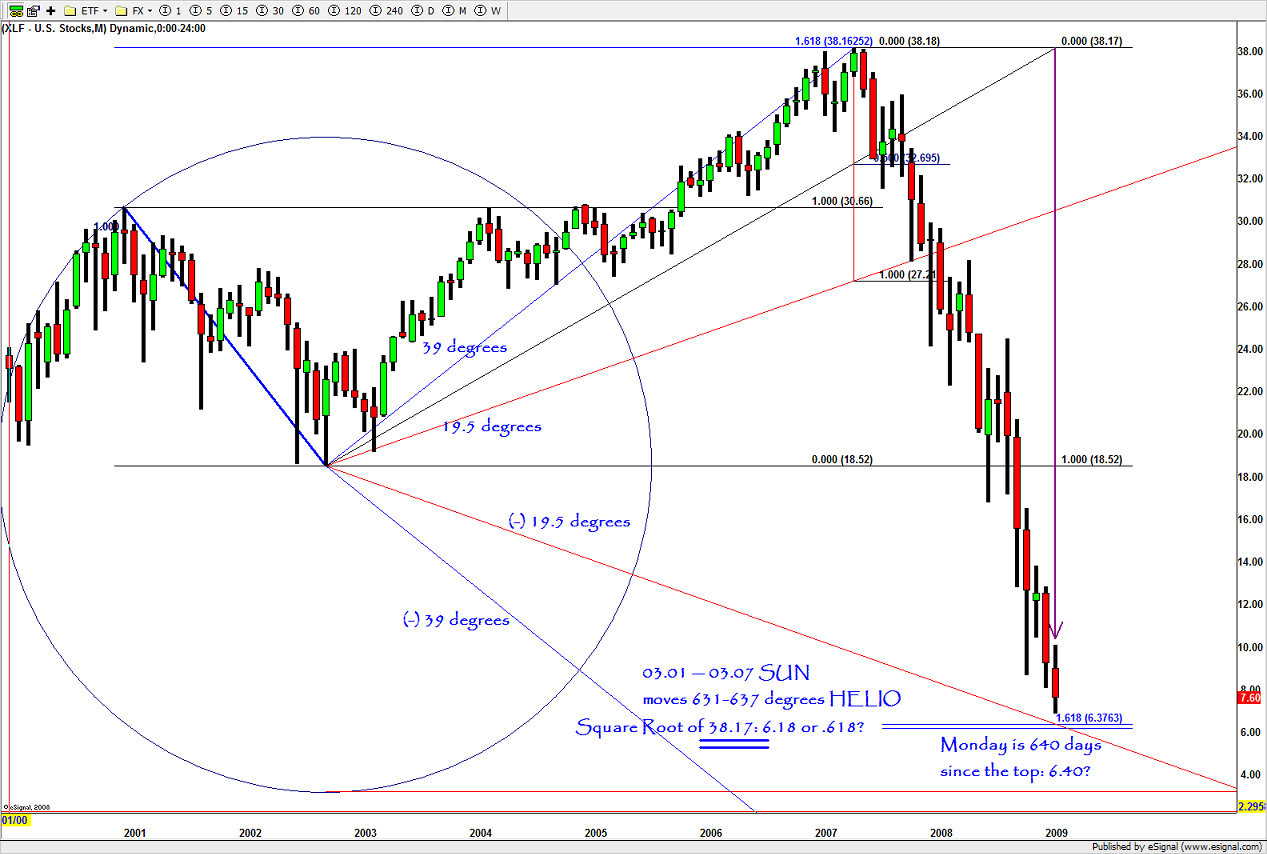
Now, for one last chart on why I believe this is an EDGE (an edge is simply a higher probability of something happening than not happening) I am going to post the “call” that I made as Lead Technician for When2Trade Group on March 06,2009. It was to BUY the XLF ..
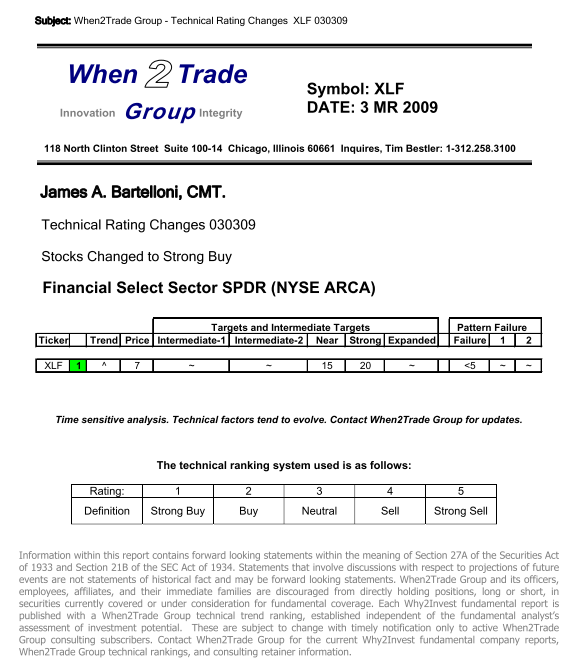
So, that’s the beginning. Start w/ an open mind, go buy the book and see if it resonates (vibrates) w/ you … if it does then devour it and get ready for a fascinating journey. I am still amazed when it works …and when it doesn’t, well that’s what stops are for. I think advanced PATTERN RECOGNITION is the holy grail in that it let’s one know exactly where you are WRONG.
Bart
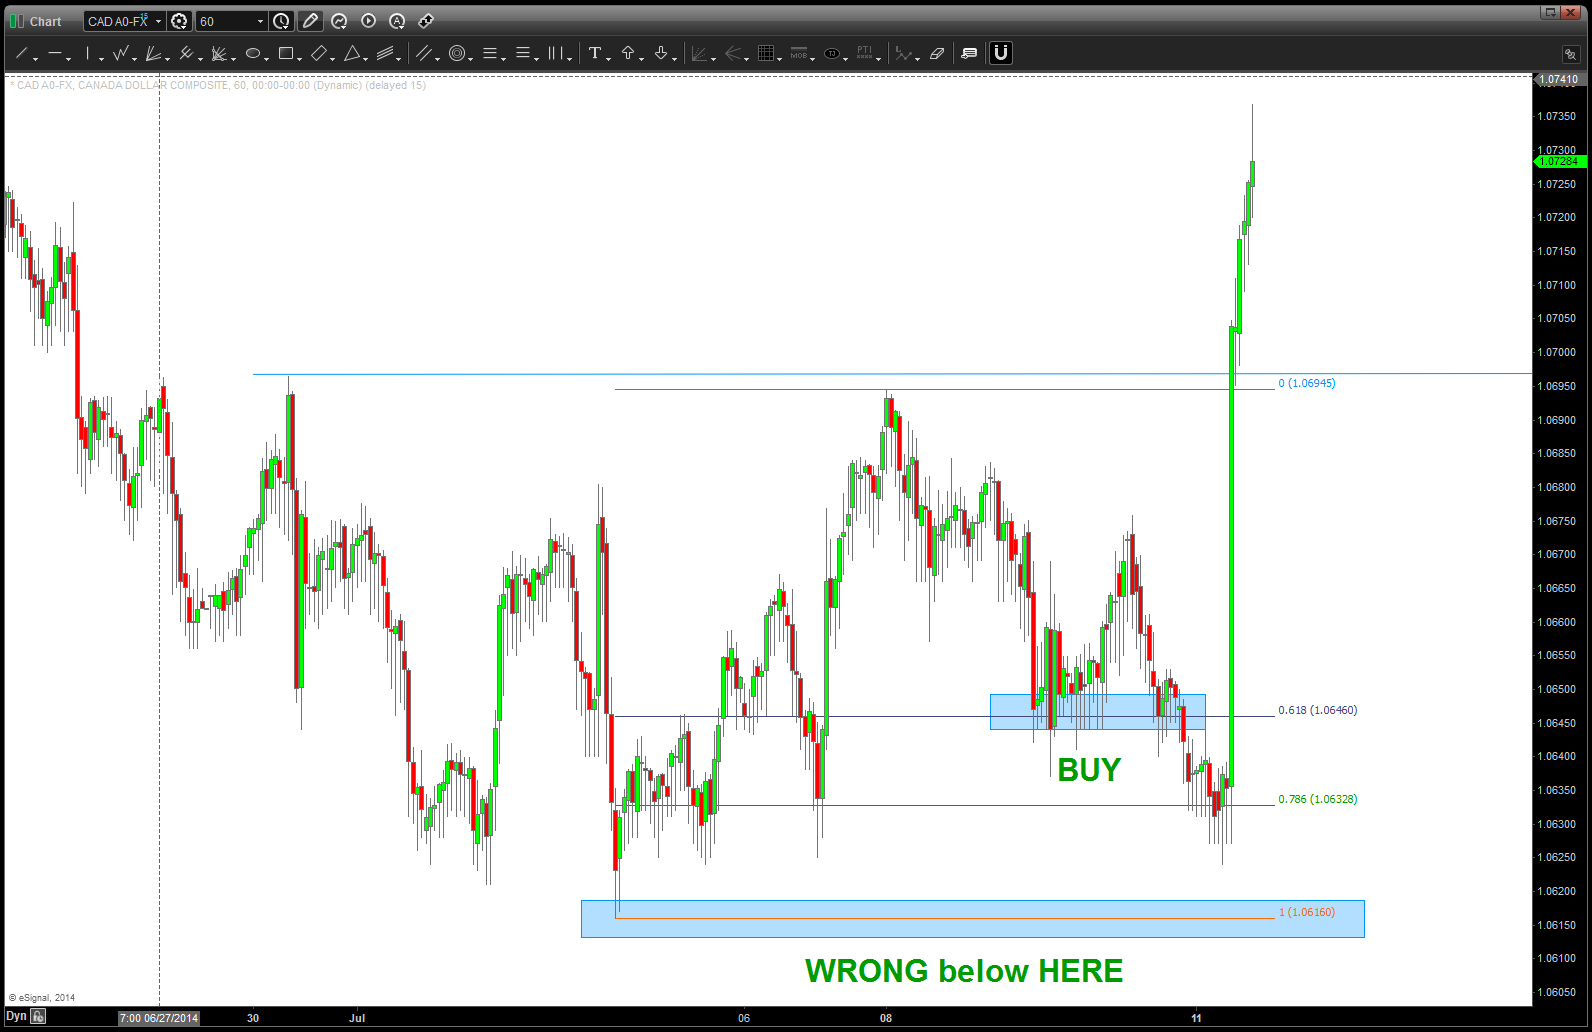
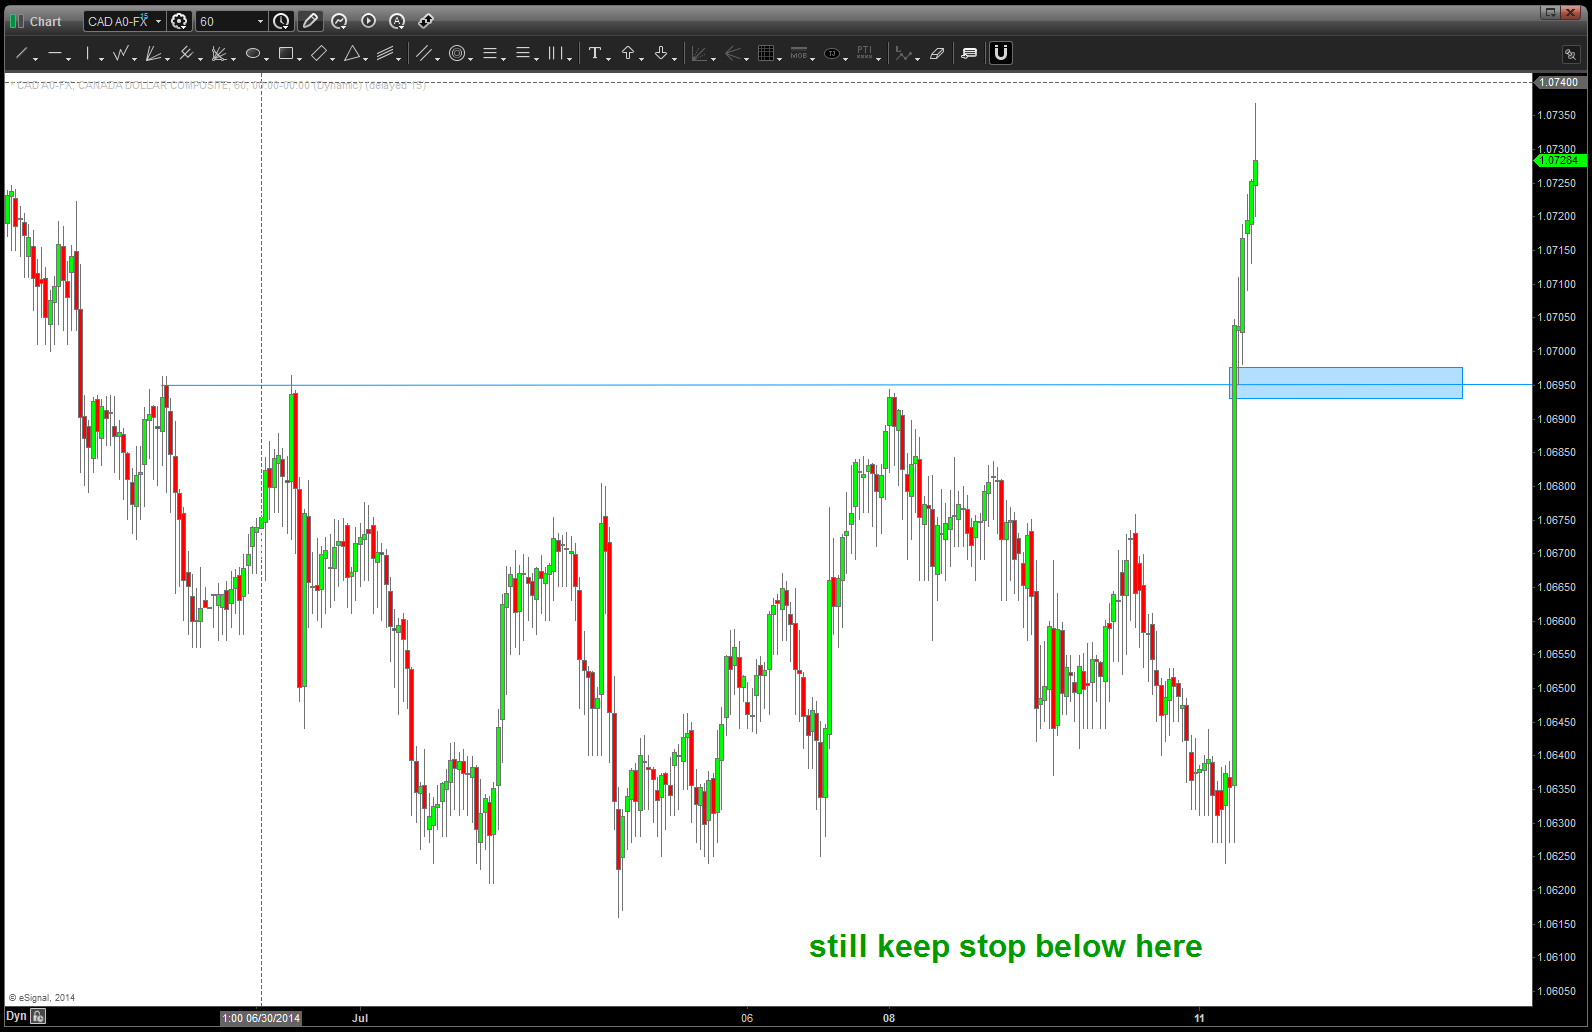
Loonie Update
Posted on July 9, 2014 Leave a Comment
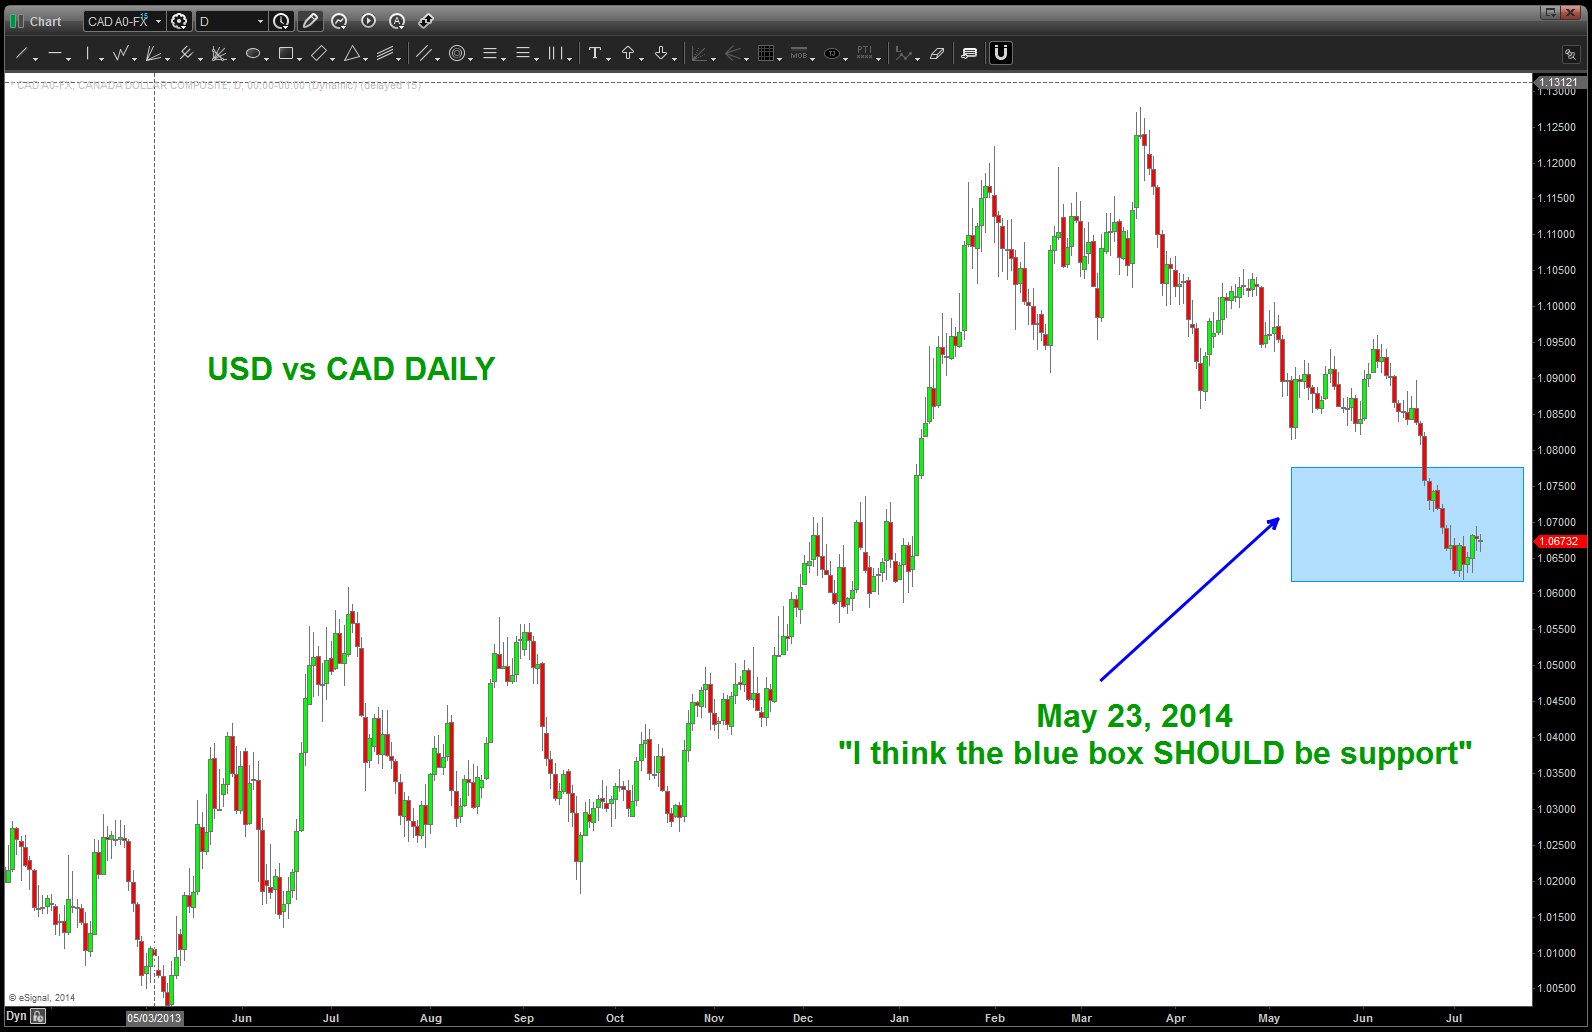
CLIFF NOTES: back on May 23, 2014 we generated a zone of POTENTIAL support. If you are a equity trader, then you might not think this zone is that big….folks, 150-175 pips is a VERY wide range. And, as you can see, in this case of course it decided to go all the way to the bottom of the box…ain’t that they way the cookie crumbles? So, here’s the post and the work that went into this zone: https://bartscharts.com/2014/05/23/loonie-vs-the-usd-and-how-to-build-a-case-for-managing-risk/
Now, here’s the multi-time frame work that is now building a “first case” for entry on the USD vs the Loonie. Cross correlation the Oil Services Index and Crude also gives “some” (not a lot) of confirmation that this “corrective move” is over. Also, take a look back to the left … we broke thru some major resistance a couple years ago so it “SHOULD” act as support. That, along w/ patterns on top of this polarity makes a case for entry seem reasonable.
support ZONE
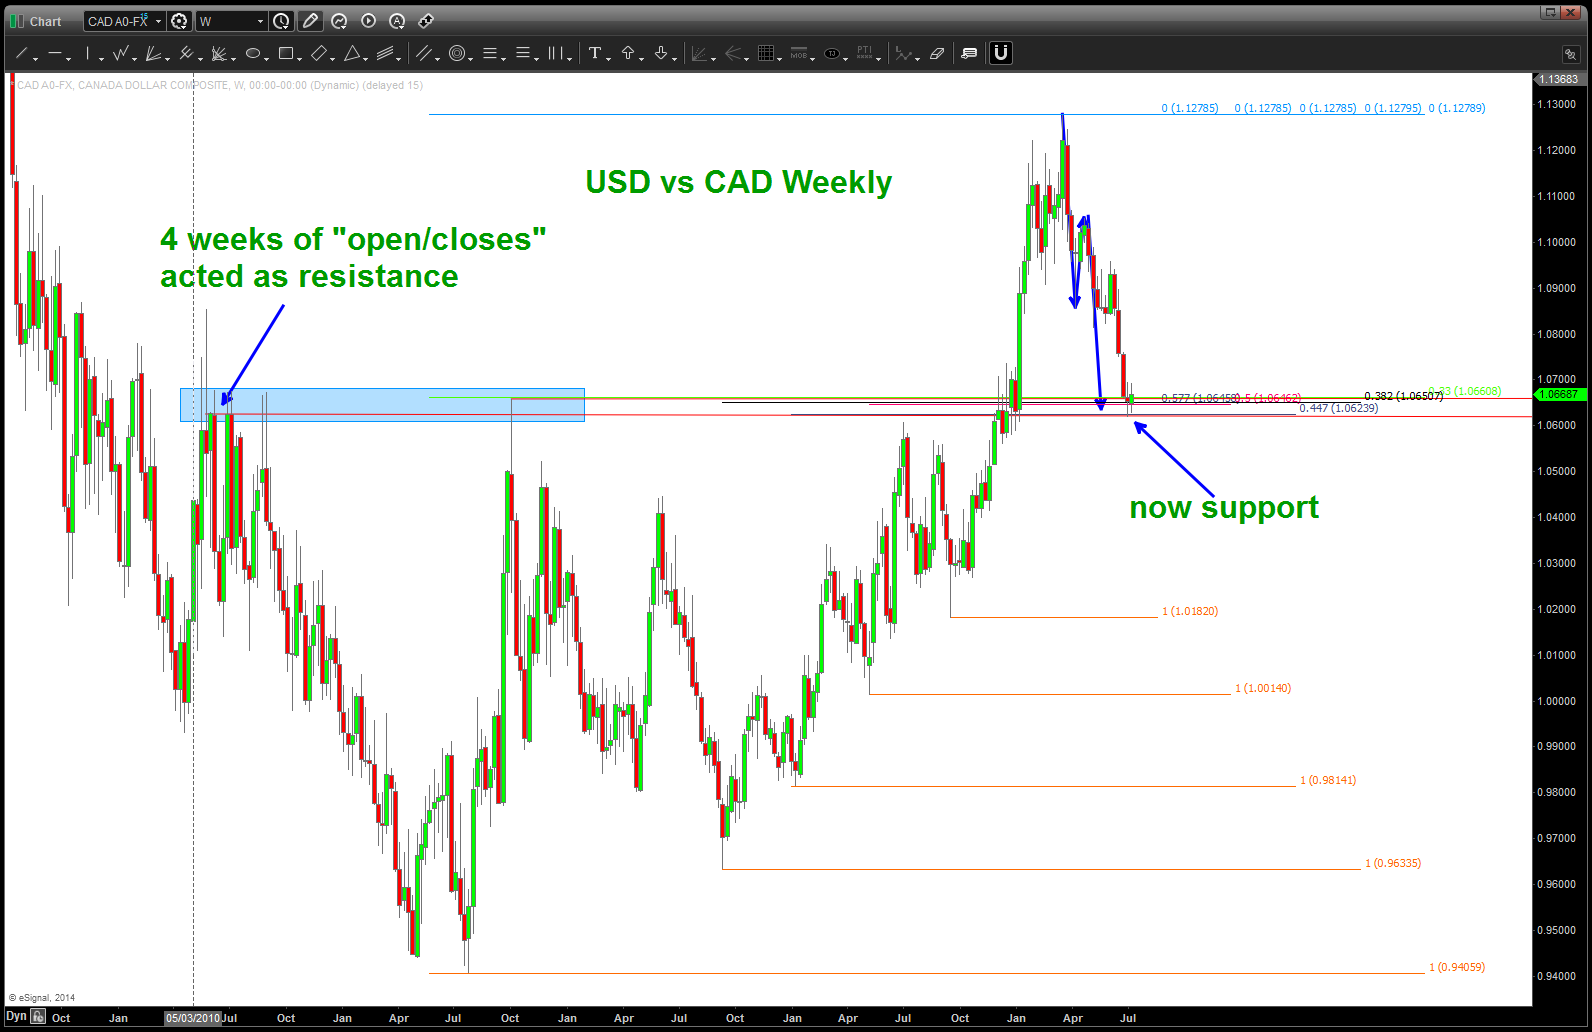
USD vs CAD (Loonie) Weekly
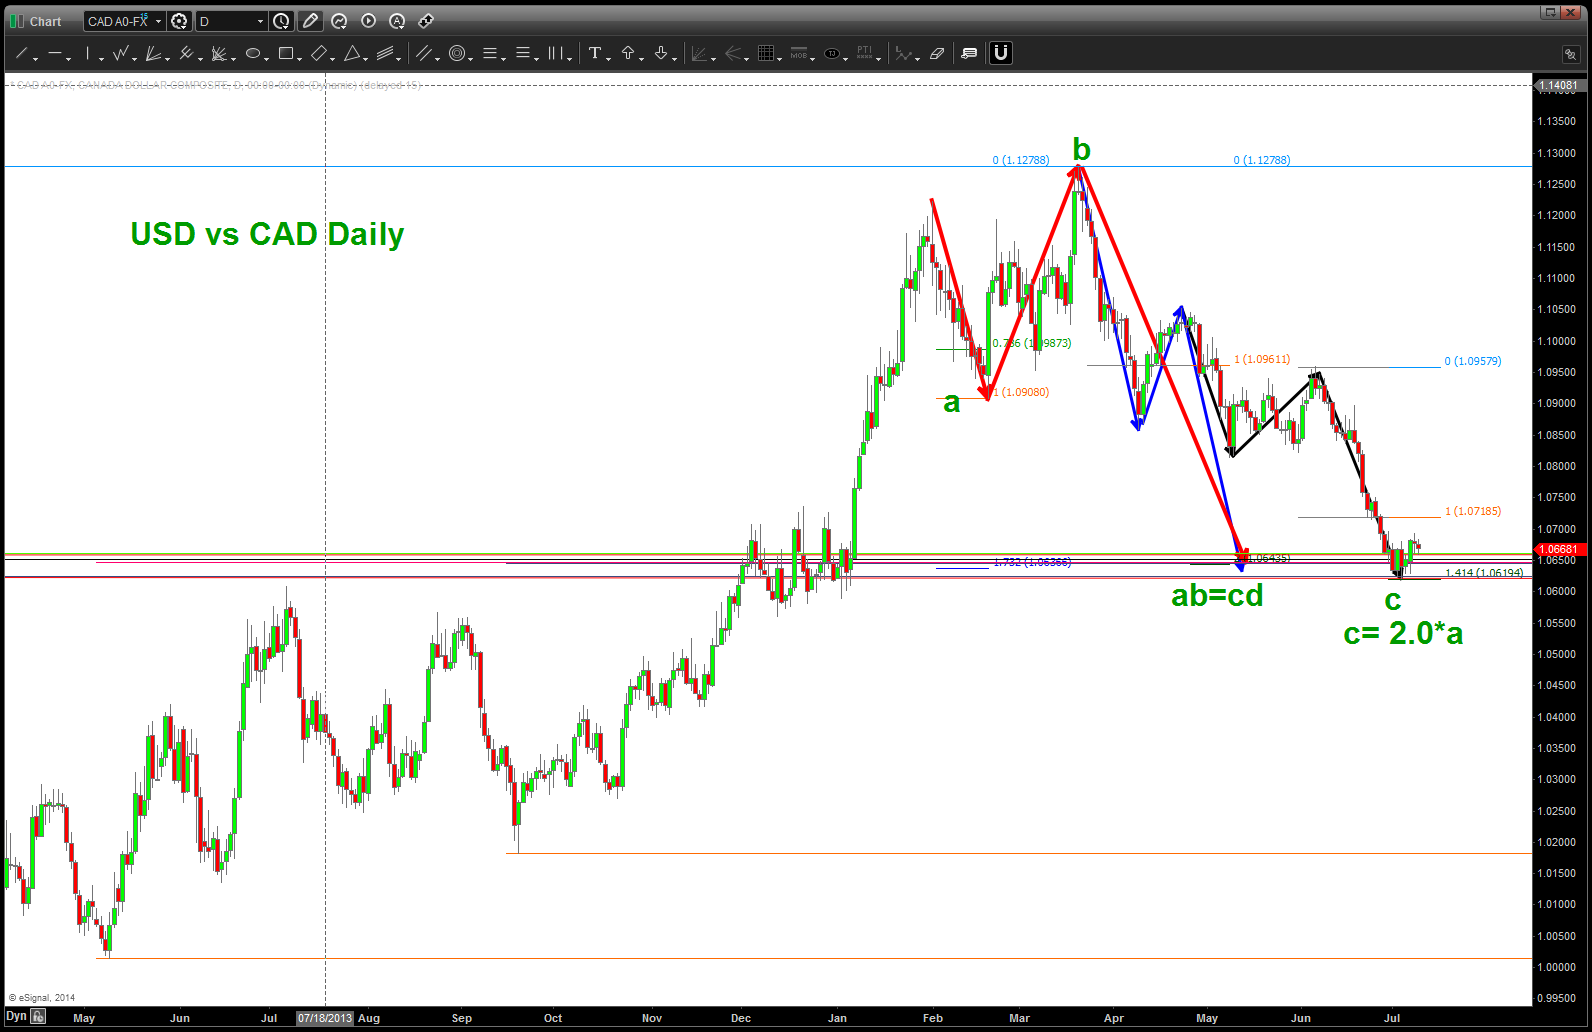
USD vs CAD (Loonie) Daily
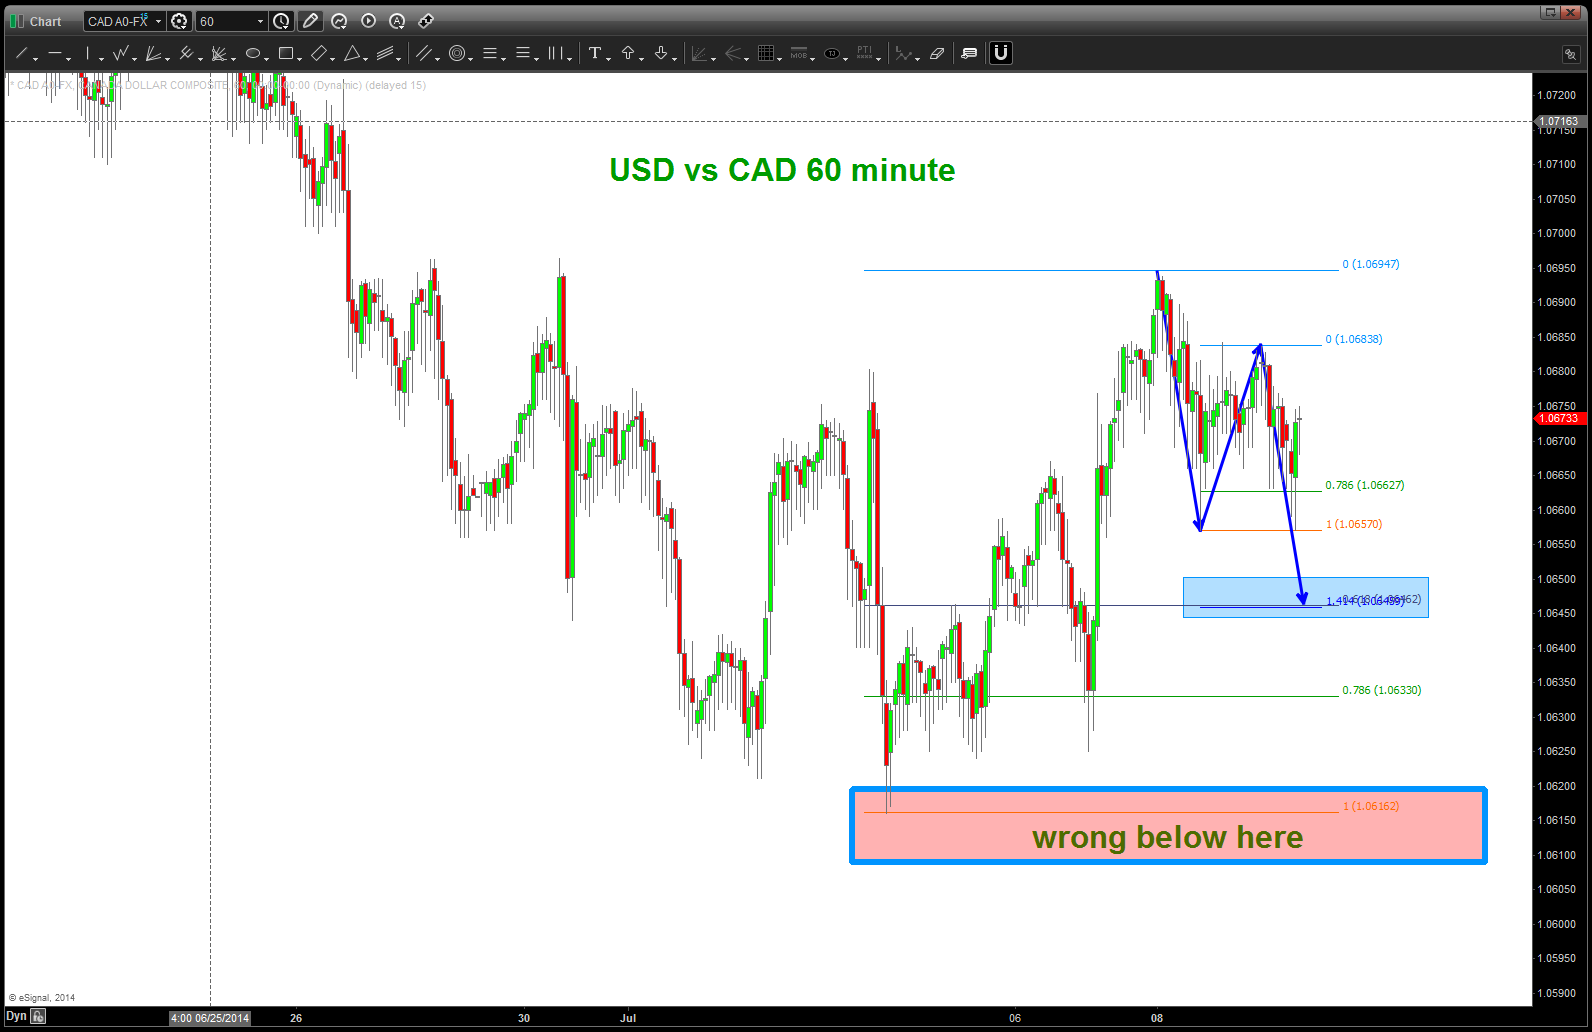
USD vs CAD (Loonie) 60 minute
Transports ..updated
Posted on July 4, 2014 Leave a Comment
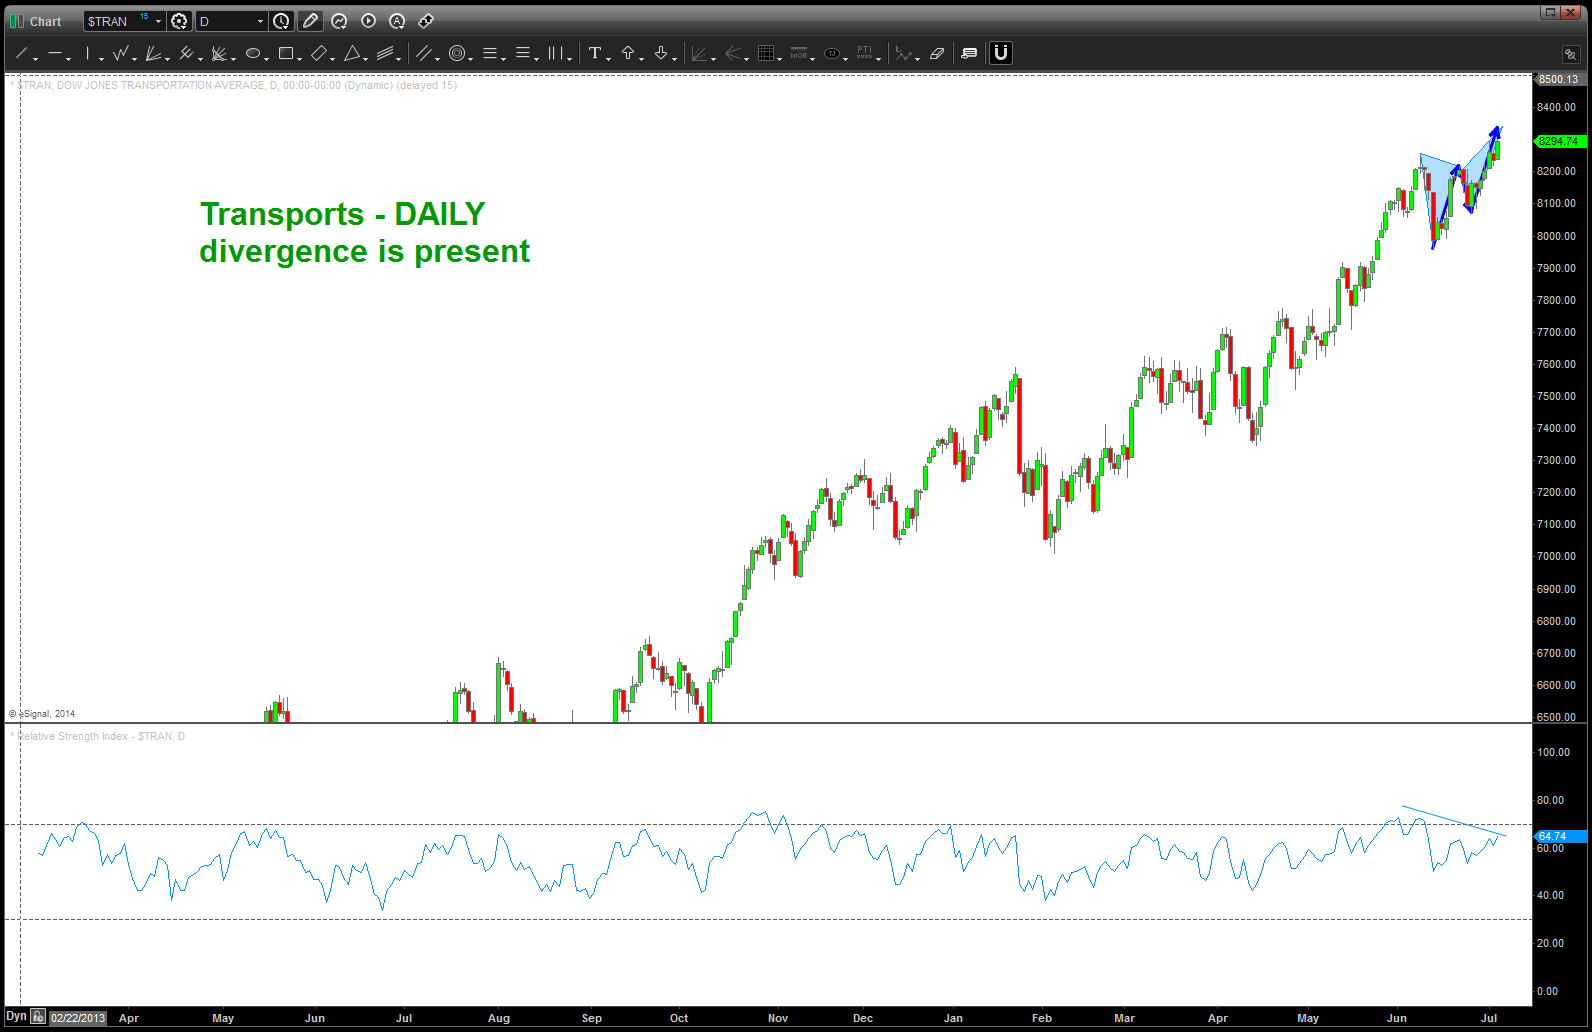
CLIFF NOTES: not even a whimper at the pattern in/around 7660. So, if look at this post: https://bartscharts.com/2014/06/12/dow-jones-transports-and-the-major-seventh/ we will note that the 1.8877 extension worked the last time. So .. that’s a target around 8578. doing some math and dividing 13.43 into that number we get 638.7. Move the decimal point and we get 638.7 – today we are 638.5 months from the all time low. so, perhaps we’ll go another 300 points to tag that target and, why not? Still amazed that the MAJOR target at 7660 was, simply, crushed w/ hardly any resistance.
Onward …

below you’ll find the Daily chart .. of note is their is divergence present w/ a nice butterfly SELL pattern coming into play. the other thing to note is this divergence is present in the 70’s on the RSI. On the monthly we are up at the 80’s …
Dow Jones Utility Average pattern from all time low COMPLETE
Posted on July 3, 2014 Leave a Comment

DOW JONES UTILITY MONTHLY PATTERN COMPLETE
EURO update target hit
Posted on July 1, 2014 Leave a Comment
CLIFF NOTES: the flat correction we have been watching develop has been hit.
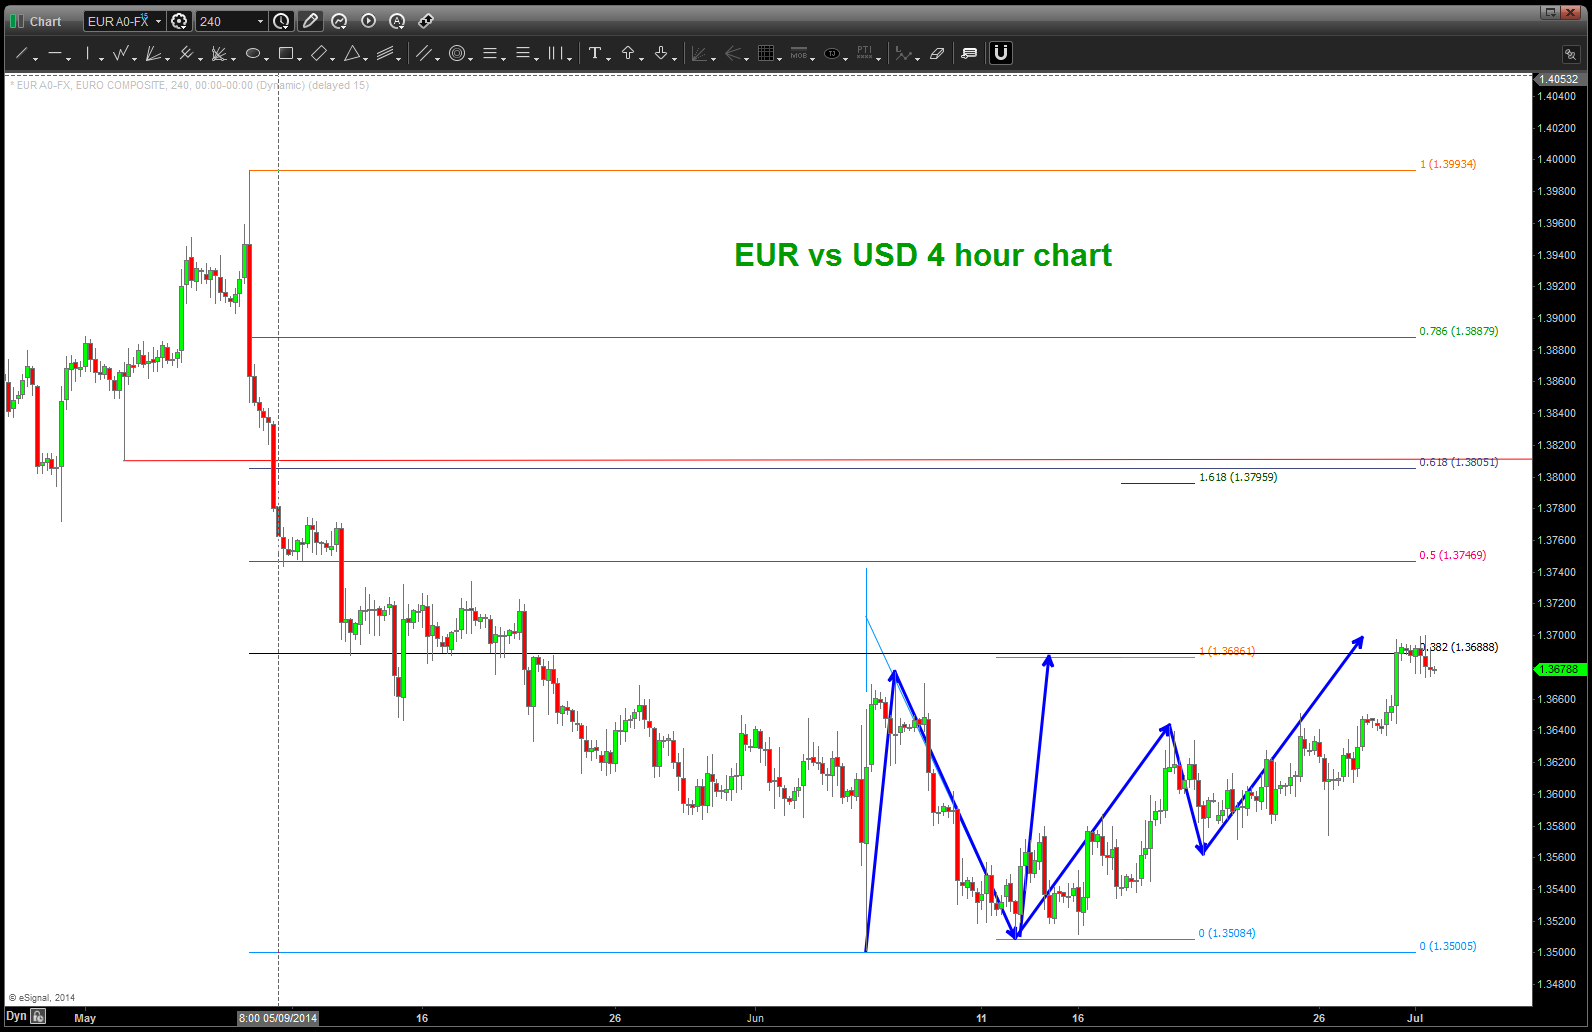
CLIFF NOTES 2: wanted to point out that we have been working w/ the EUR vs USD that, some could argue, is one of the biggest and most liquid instruments in the world. All of this work has been done based on PATTERNS. If you search “EURO” and go back over this blog you’ll find that most, if not all, of the inflection points were forecasted BEFORE they happened and you’ll also see ZERO moving averages, oscillators (I did use the RSI zones for gameplan constuction), Stochastics, MACD, bands, etc …no, in the end, once we CLEAR OUR CHARTS of nothing but PRICE and TIME the PATTERNS emerge. Just a note …
Strategy is crucial here … need the “break” and then the first pullback to SHORT. Still have 1.3747 and 1.3800 area’s to play w/ so being patient is, again, the key.
ENJOY …
MSFT Microsoft
Posted on June 29, 2014 Leave a Comment
Here is the BUY on MSFT – some amazing harmony, form, proportion and balance. Just take one second and look at that chart … no idea what is going on w/ their fundamentals and, it was quite the “crazy” time for it to find support during the 2009 thump. But … a PATTERN is a PATTERN is a PATTERN. so, here’s the BUY on MSFT issued in March 2009.
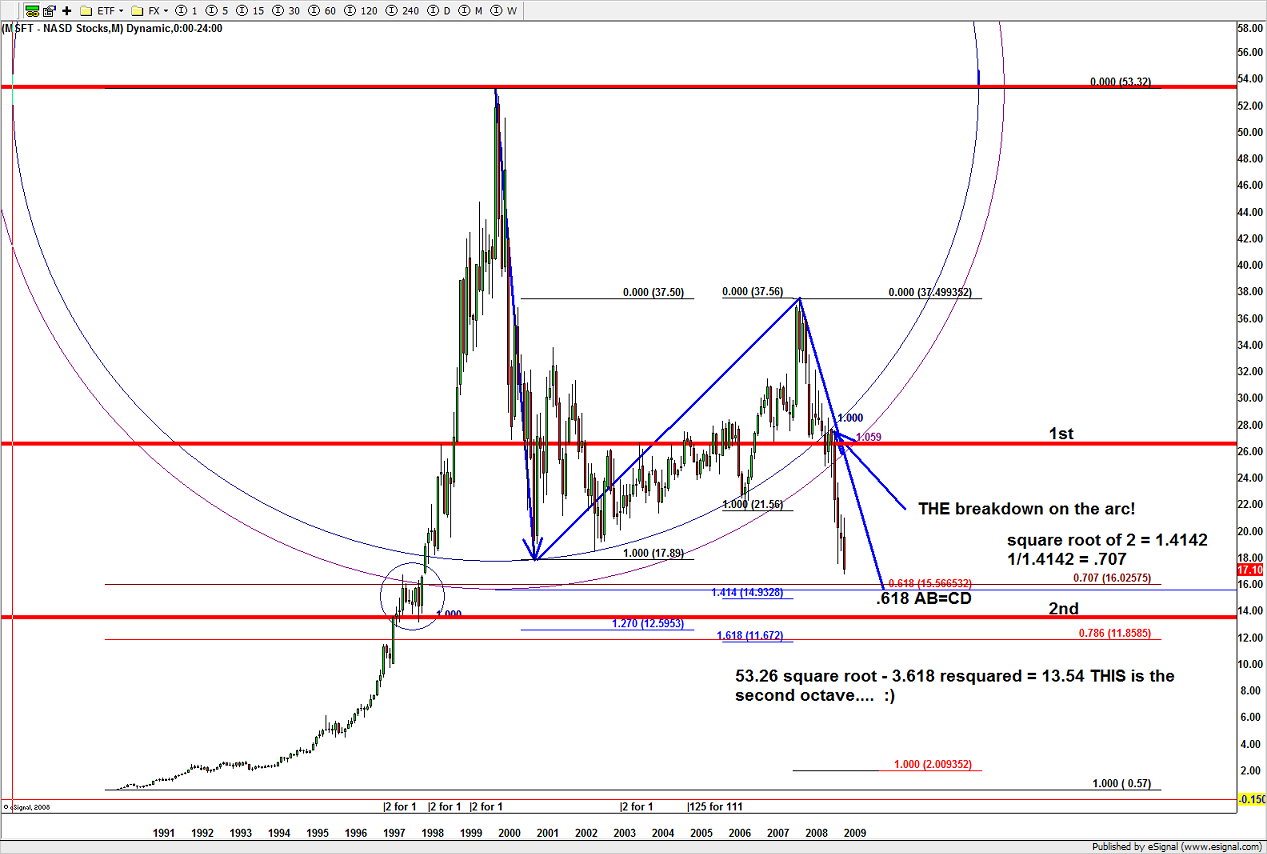
BUY on MSFT in March 2009
so, where are we now?
we are approaching the .618 from the all time high on decreasing volume and an overall market that “should” be correcting. Time to take some off and get ready for the next wave …in my humble opinion. (note – 50-52 is still a target.)
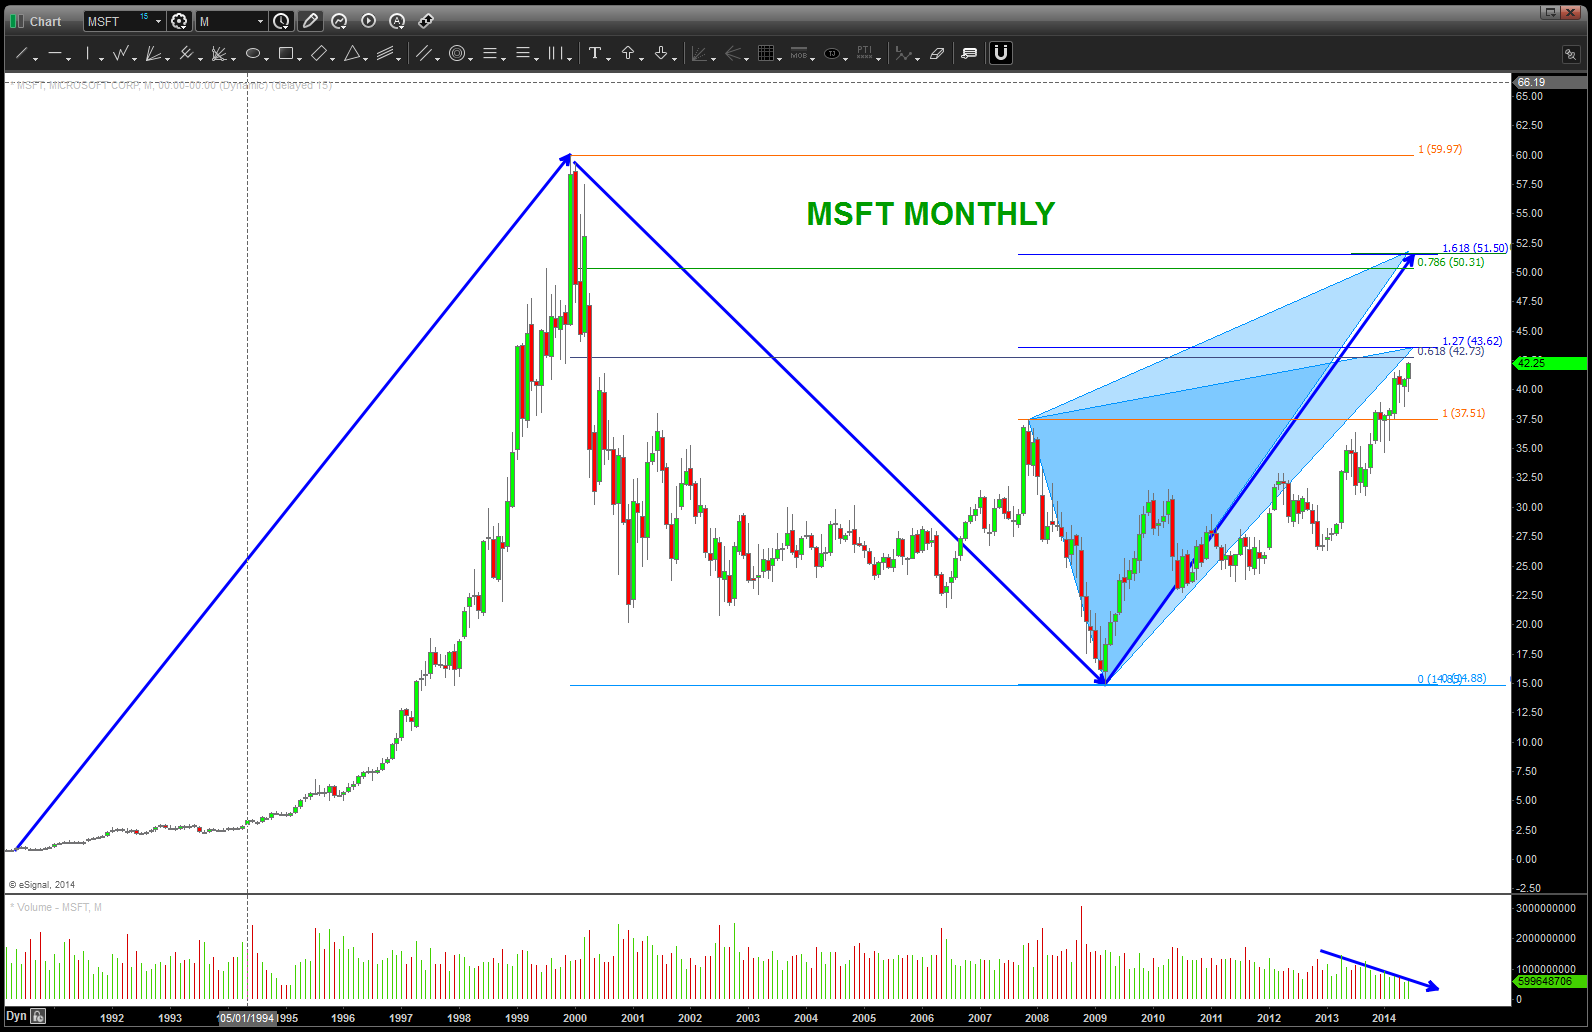
MSFT approaching resistance zones – watch closely or take some off the table
EURO continuing the update
Posted on June 27, 2014 Leave a Comment
CLIFF NOTES: in the world of Elliott Wave, a FLAT correction can be thought of as a big N. It’s Friday night and I don’t feel like relabeling the count. Suffice it to say our target in the 1.3680-1.3700 area still holds. I’ve tried to put the N in perspective so you can see. The key here is the C wave of the FLAT has to be 5 waves. I can see that count playing out so an expectation to deploy capital on the short side should occur next week. It’s taken longer than I thought it would …but it is playing to the sheet of music that I’ve been reading.
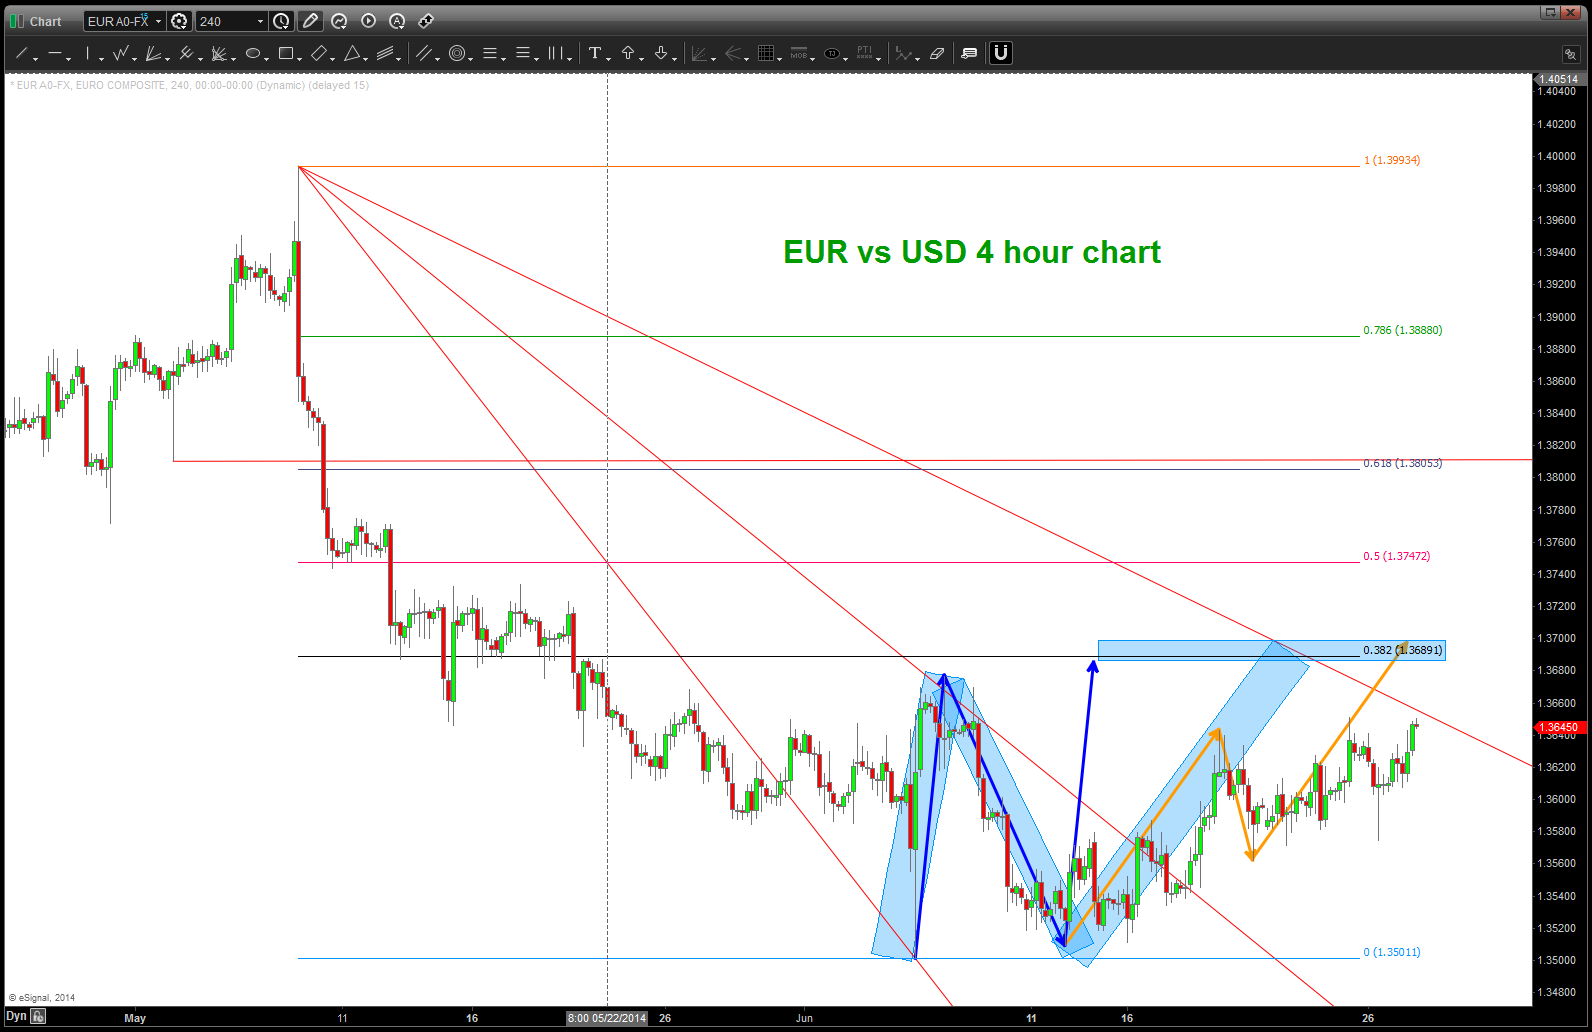
EURO vs USD
Yen … ramifications of this pattern are big
Posted on June 27, 2014 1 Comment
CLIFF NOTES: let’s face it .. 2014 had been a complete YAWN w/ regards to the USD vs JPY cross. It completed a 5 wave move up into the 105.50 and now’s it’s been correcting in a rather less than volatile way. Things are NOW interesting. Again, PATTERNS PATTERNS PATTERNS is what this blog is all about and we have a PERFECT (time = price) pattern completing. Please see below:
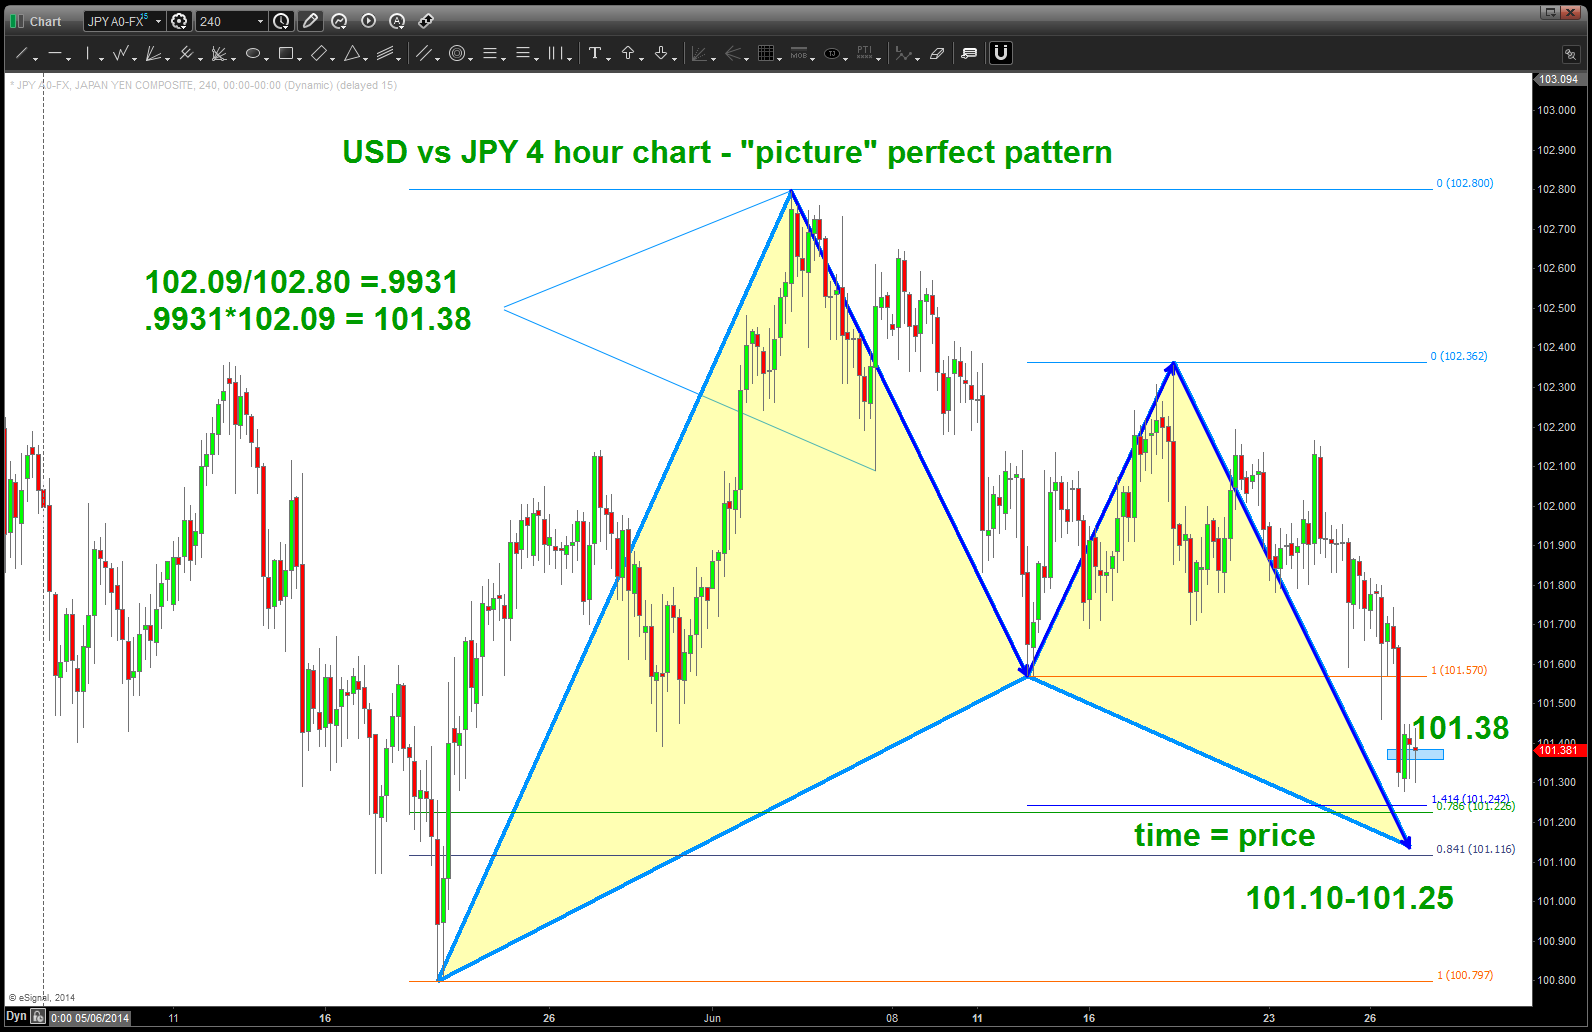
USD vs JPY 4 hour BUY pattern
CLIFF NOTES 2: why is this important …? Well, the pattern is completing right on top of a HUGE support level. So, the pattern works and we bounce, start back up OR it fails and we attack a key support level. This is going to get interesting.
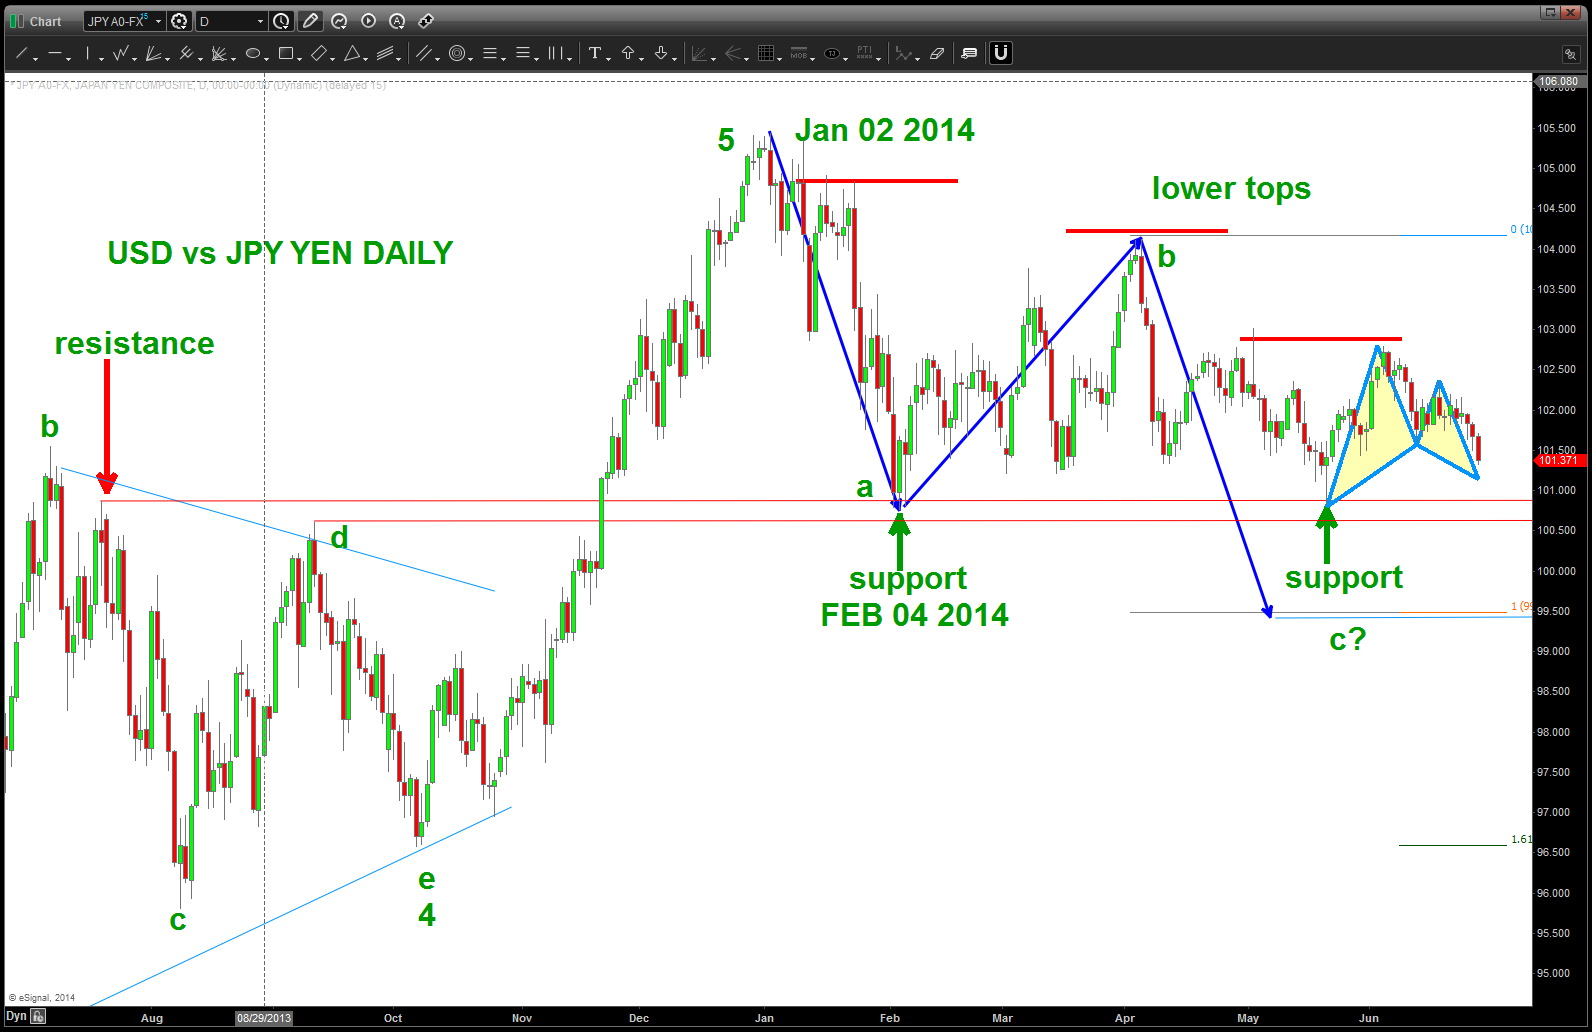
USD vs JPY YEN Daily
CLIFF NOTES 3; take a look at the weekly. appears the RSI is breaking thru the top side of the bullish RSI support zone (40-50) so IF OUR PATTERN FAILS then we can make the probable bet she’s heading lower and into the lower bullish support zone – which on a weekly – can be farther. Right now, the 94 handles looks promising …folks that is 700 pips which is pretty big move.
stay tuned and let me know if you have any questions … watch the PATTERN on the 4 hour and have a good weekend.
Bart
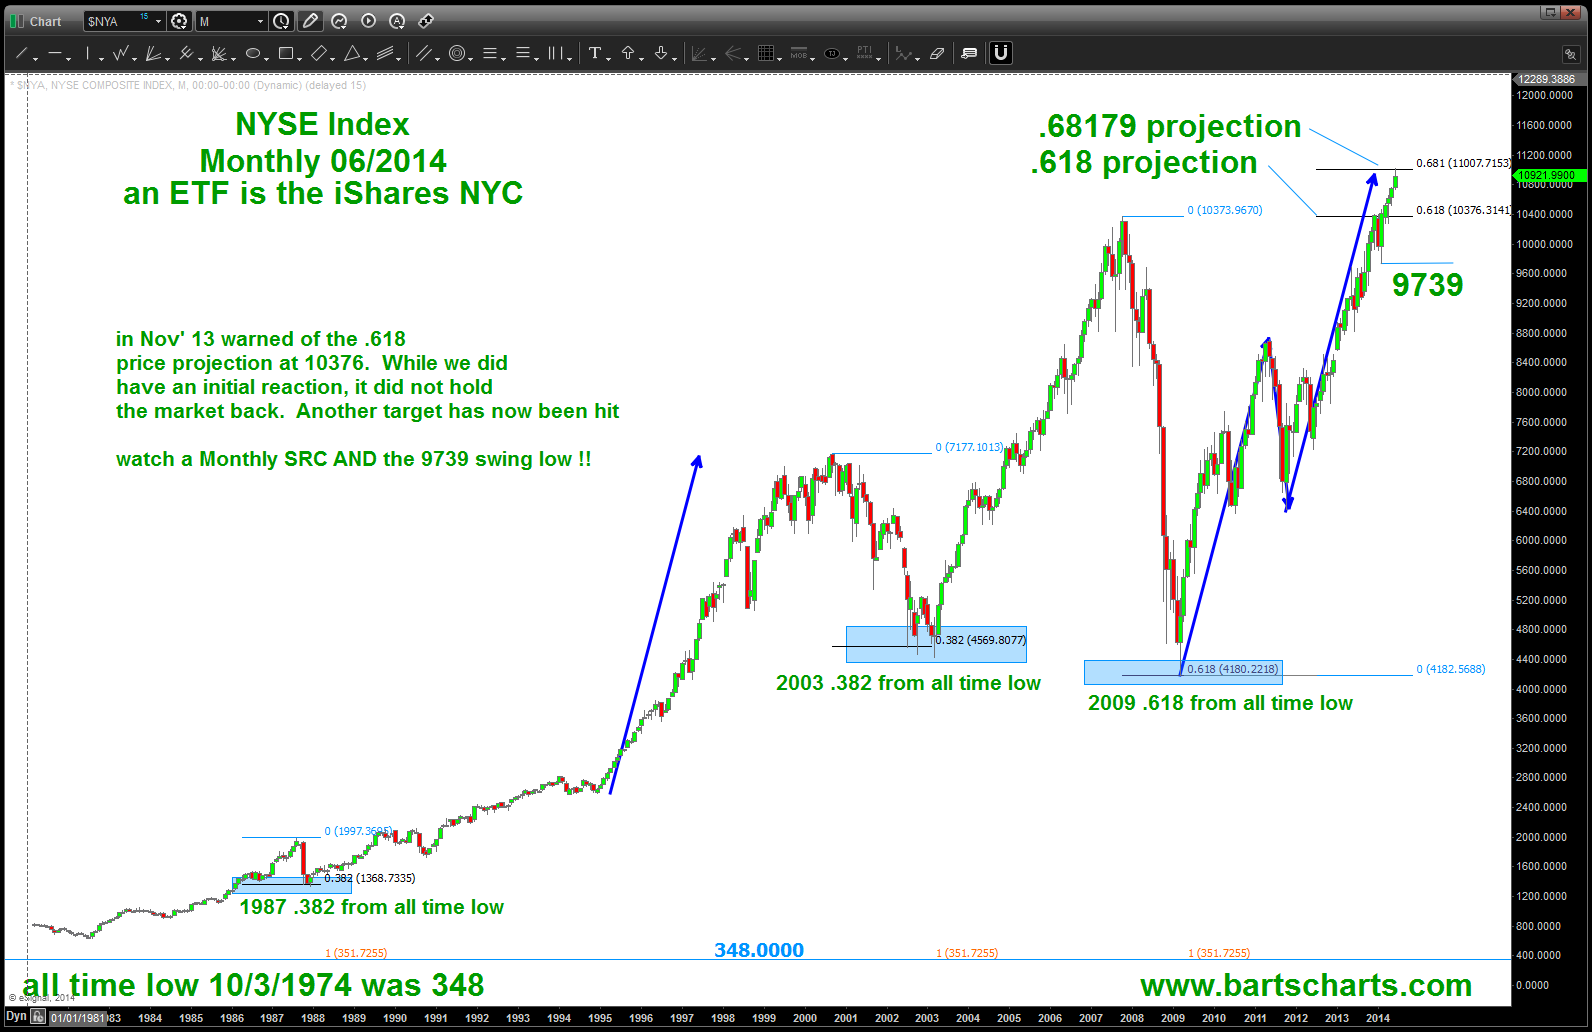
NYSE Index Pattern Complete
Posted on June 25, 2014 Leave a Comment
CLIFF NOTES: in November 2013 I posted that a .618 price projection was hitting in/around 10376 level. while it did cause a month of selling AND gave a monthly signal (go look at the chart) the market subsequently “recovered” and caused the pattern to fail. Now, we have “another” pattern completing as shown below. Patterns do fail. That’s been proven .. however, a majority of the time they WORK. So, watch the swing low (it’s a monthly) and keep your powder dry. Also, the musical note F# ratio of the equal octave scale is 1.68179. Just showing that a .68179 projection works also … it’s all music.
Folks, a 10,20,30% correction is NEEDED.