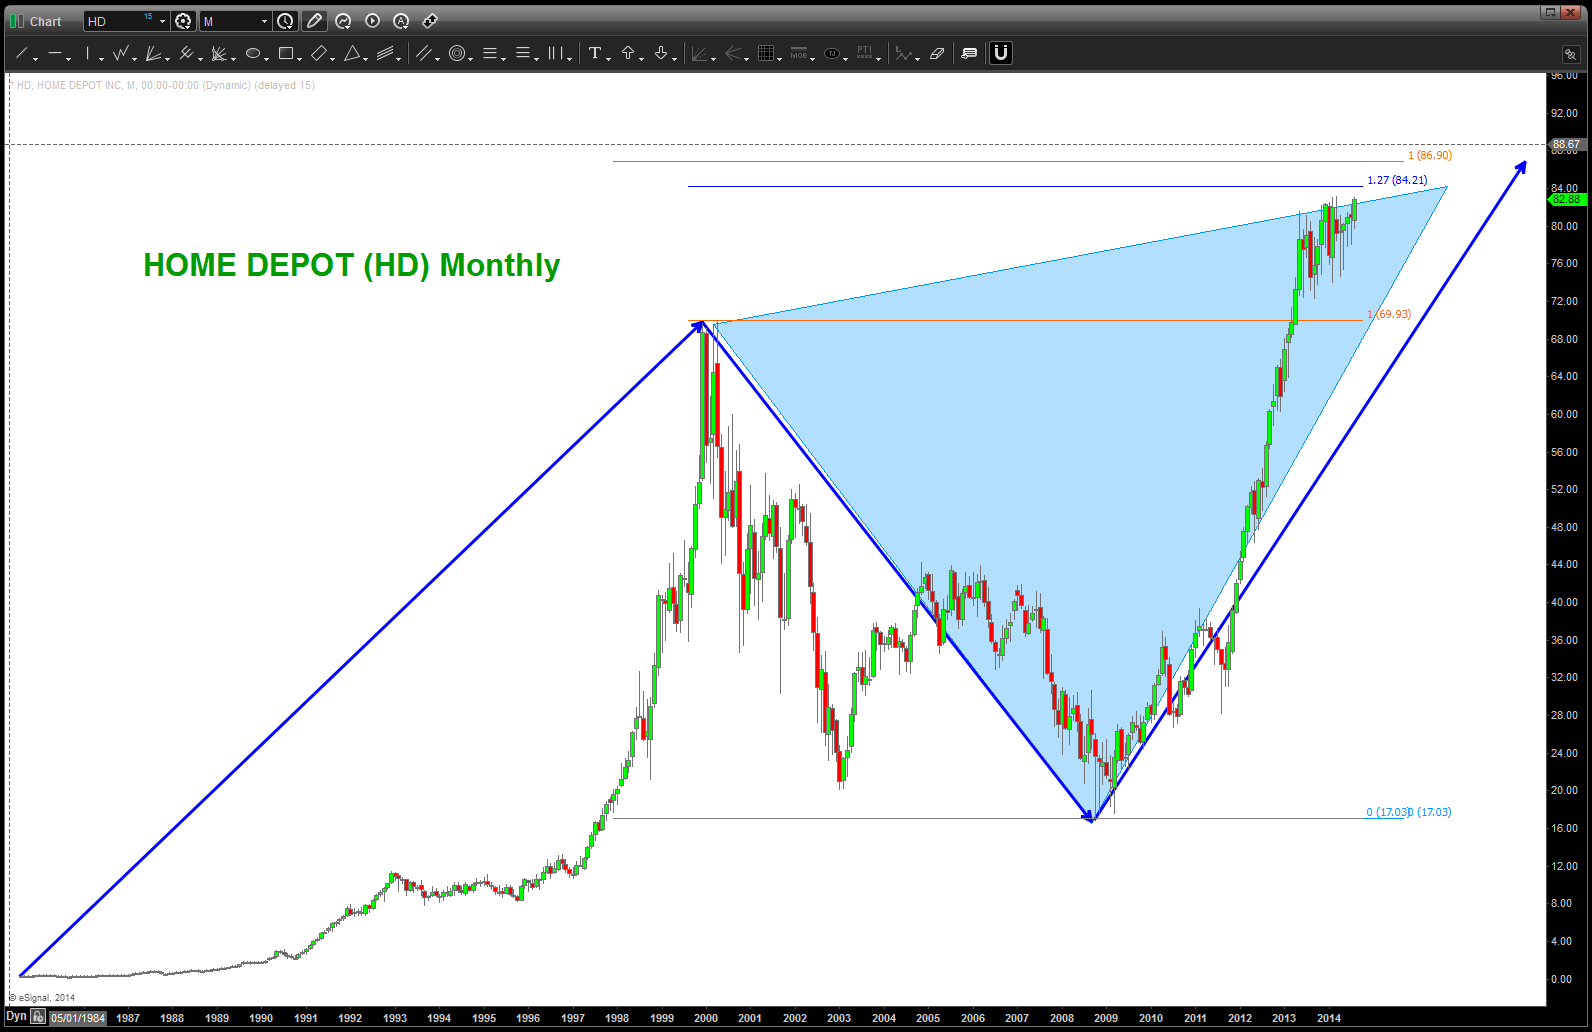
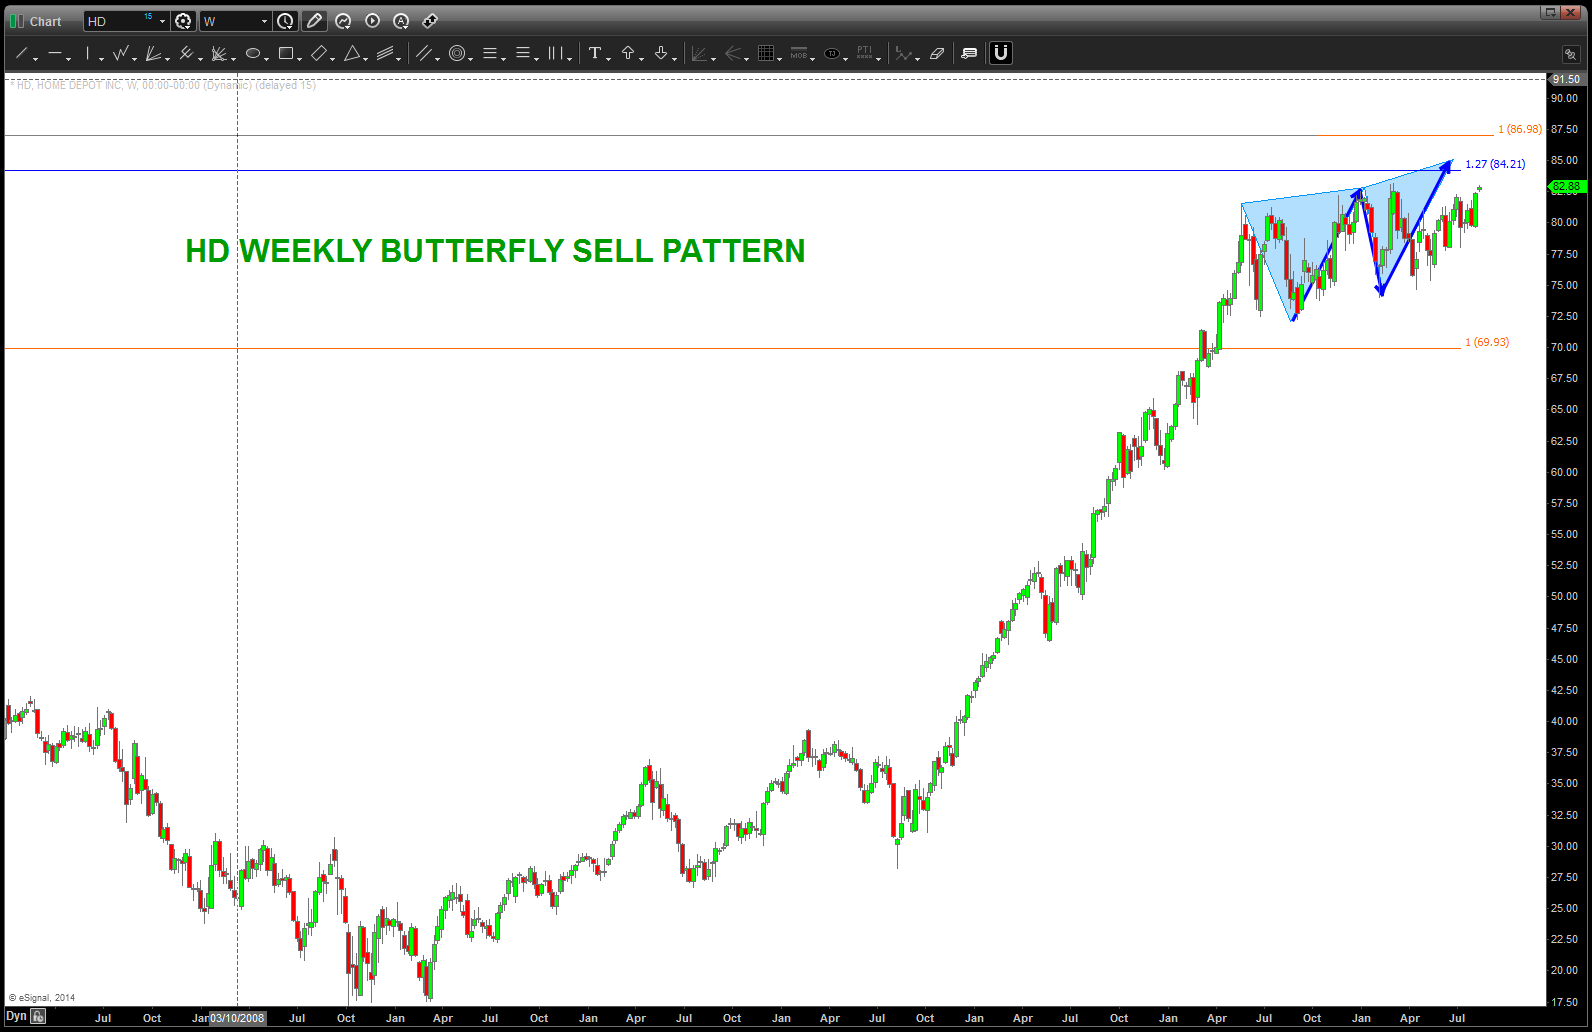
Home Depot 2-4 dollars from judgement day
Posted on August 12, 2014 Leave a Comment
CLIFF NOTES: another pattern beginning from the all time low is completing in the 84-87 area. As HD reaches towards new all time highs, this pattern is sitting right in front of it.
Crude approaching/at key buy pattern for support
Posted on August 10, 2014 Leave a Comment
CLIFF NOTES: a nice TIME and PRICE pattern coming in a little lower on crude for the buy. the reason this price pattern is so key is that, since the low in 2009, NO SWING LOW has been broken (shown by the blue arrows). So, it’s going to be very key for this pattern in OIL to hold as we do not want to see that trend line attacked or the swing low (roughly 91 dollars) to be taken out.
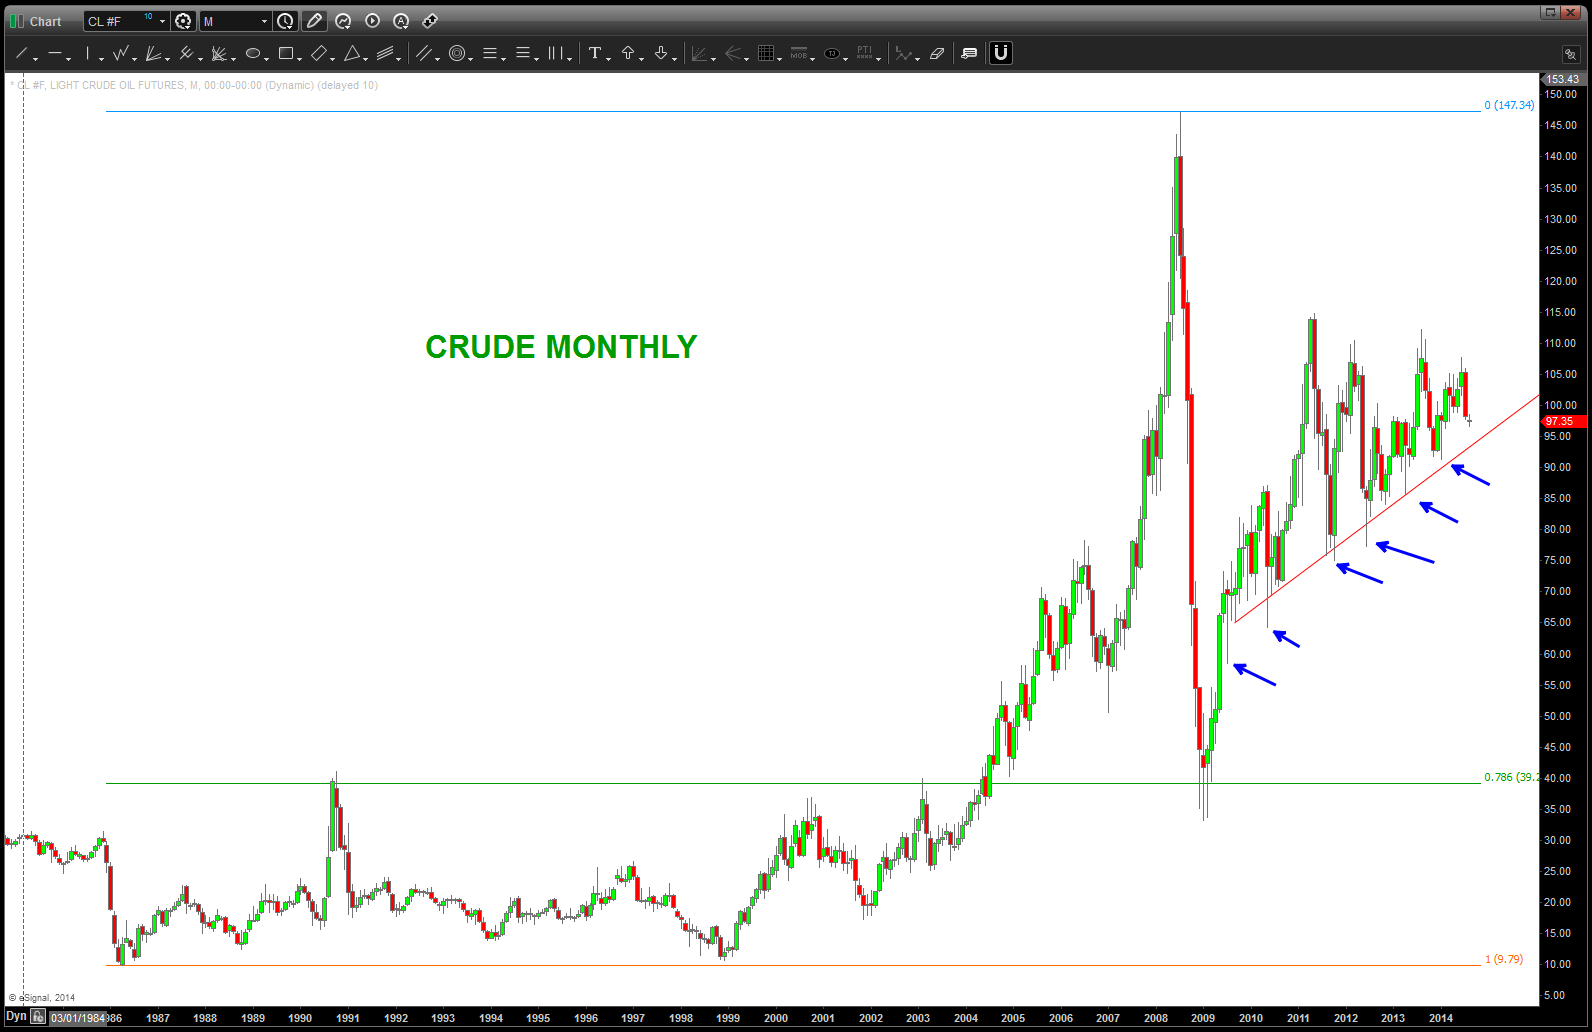
Crude Oil Monthly
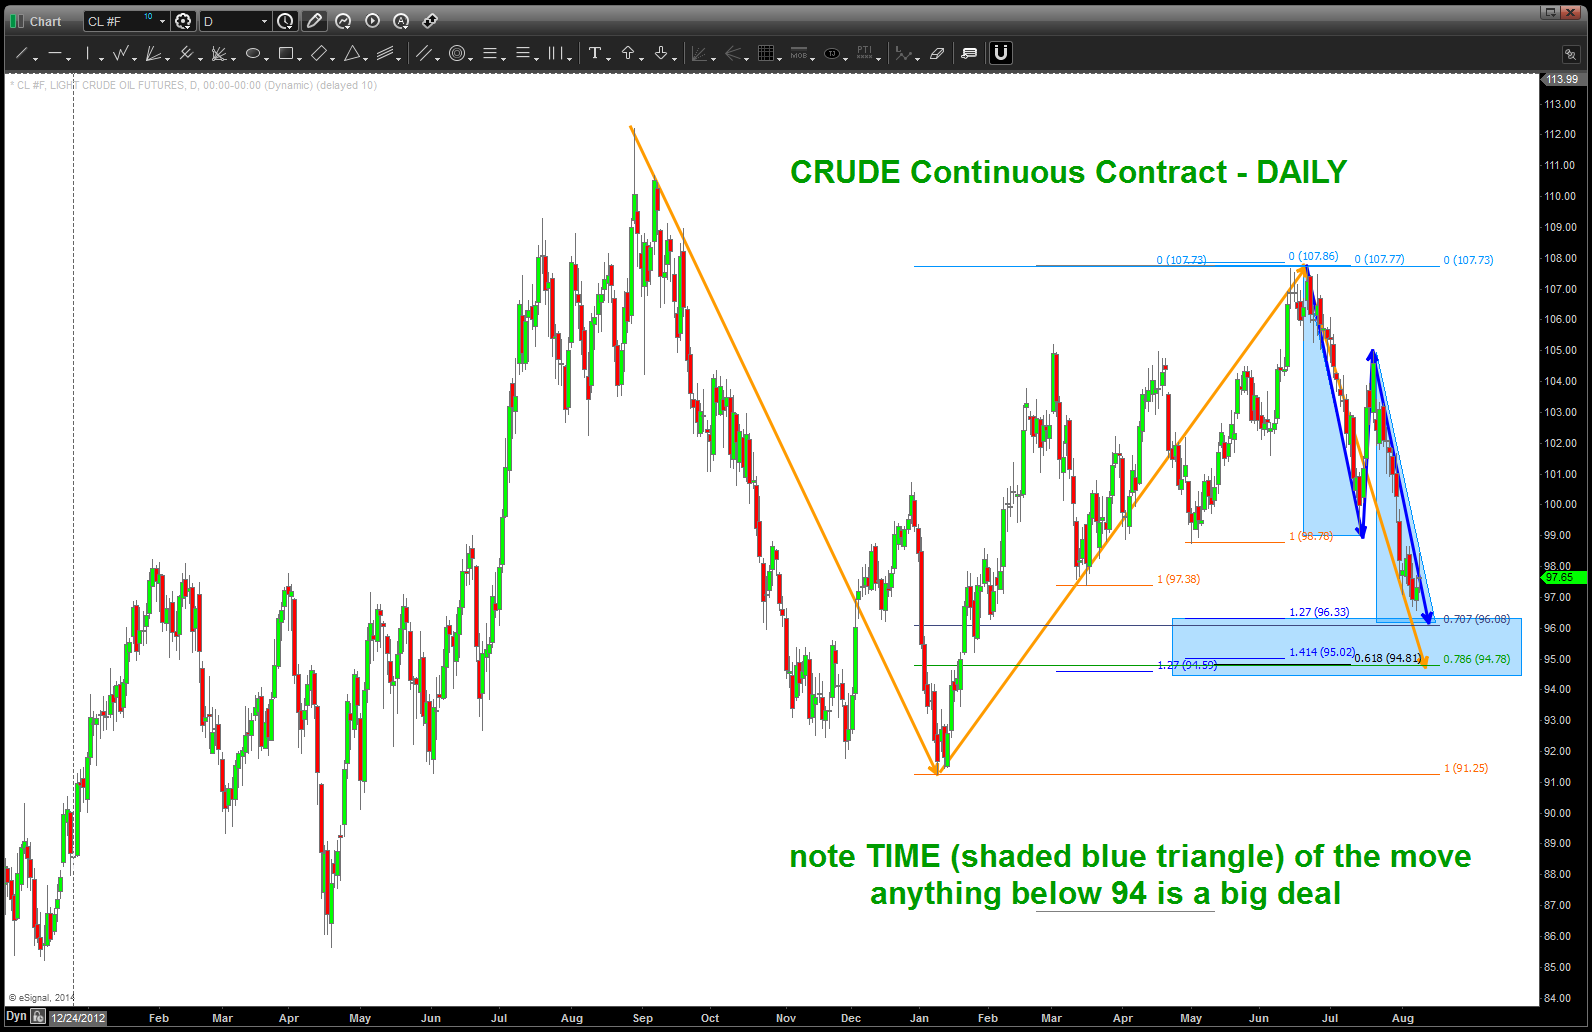
BUY area for Crude Oil
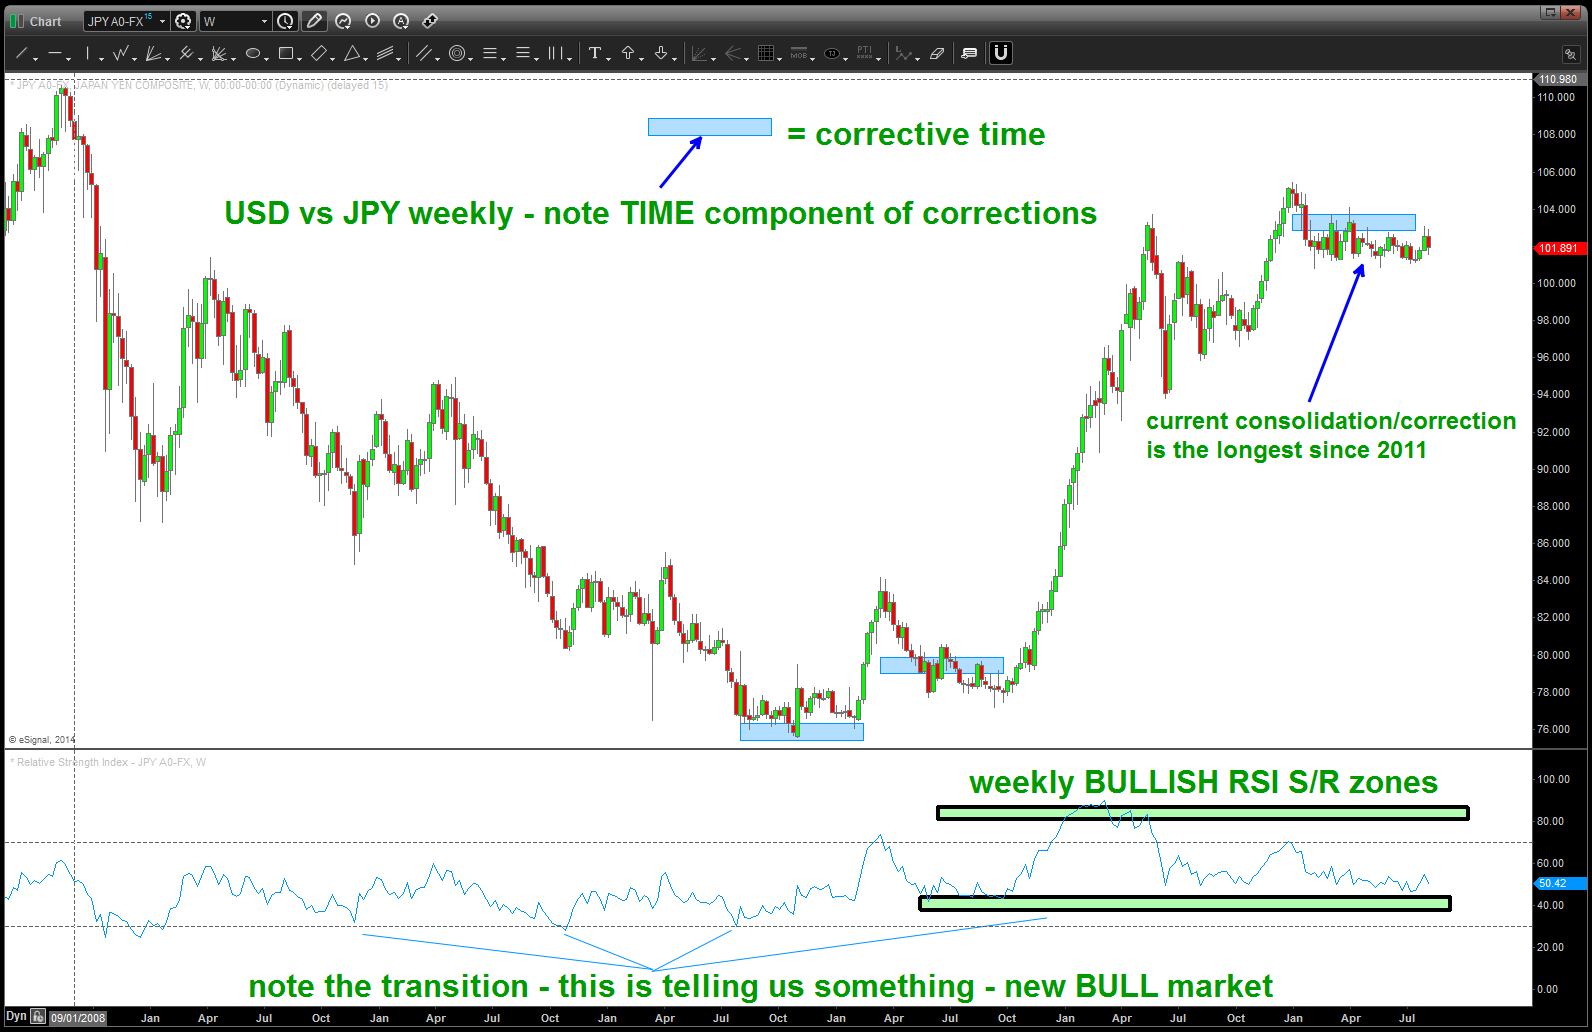
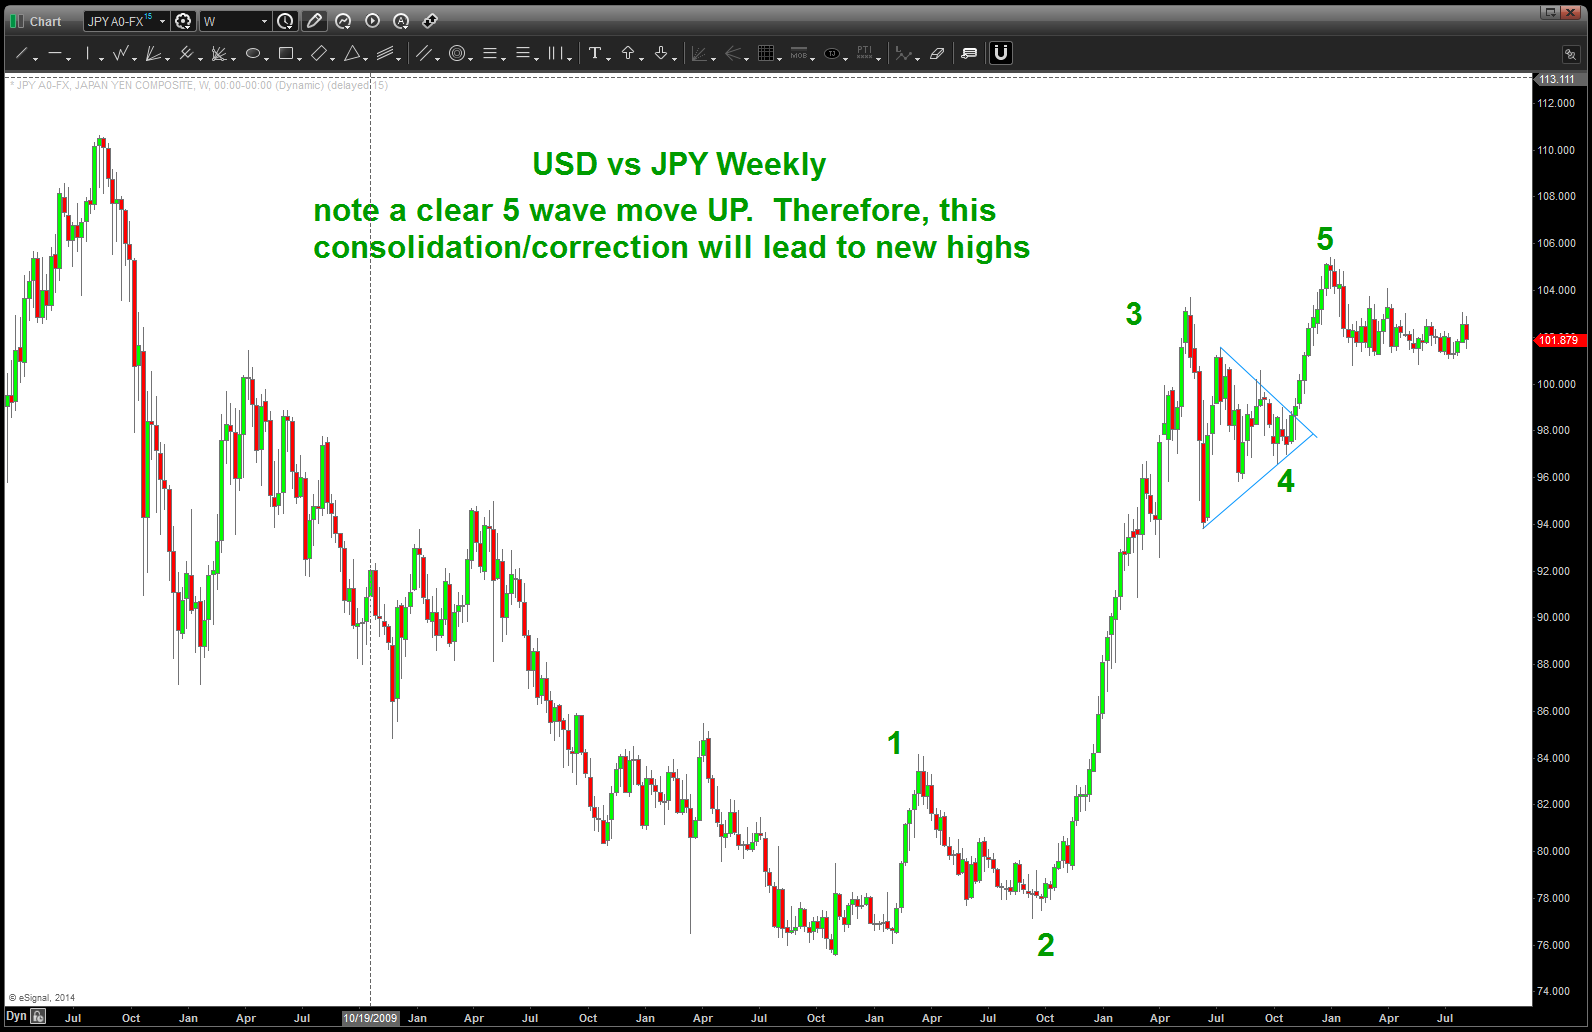
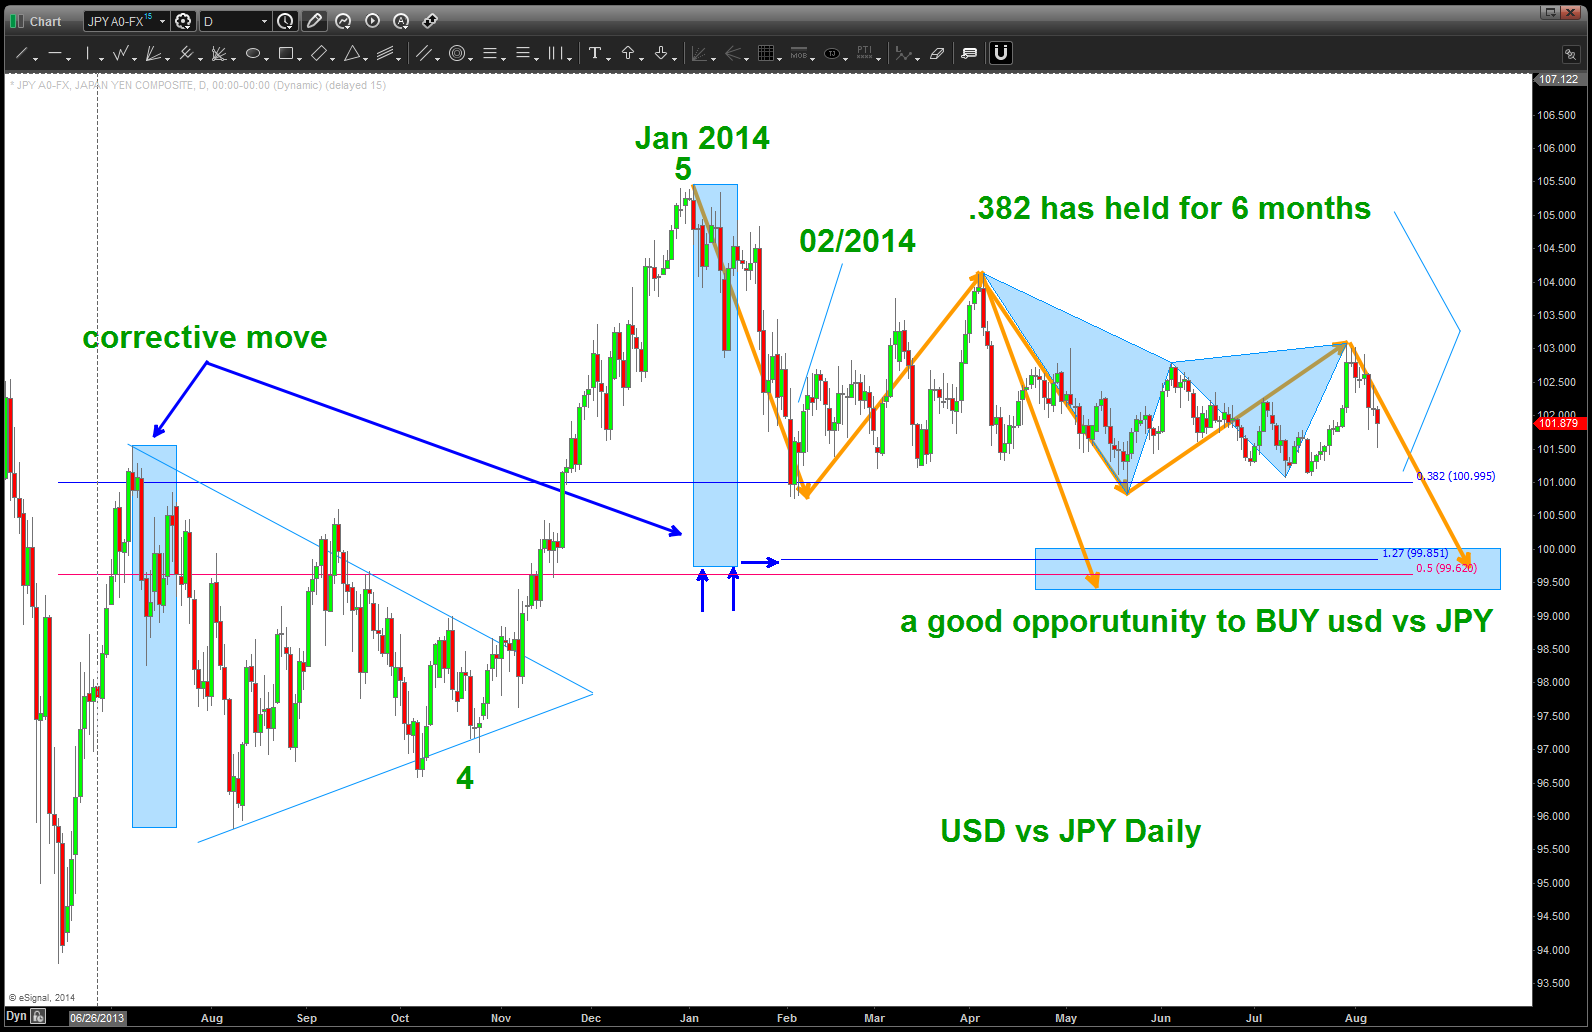
USD vs JPY an update
Posted on August 8, 2014 Leave a Comment
CLIFF NOTES: intraday, the pair has just completed a 5 wave movement down. folks, it’s a tough count in that we are either a-b-c complete and we move UP and highter above 103 from here OR we subdivided and after this brief bounce we continue down to attack the 101 level which has held for 6+ months. If we break 101 a target is shown below. take note – we completed 5 waves up so that is either A or 1. either way, monitor the USD vs JPY closely as the opportunity to BUY again is coming and it will lead to new highs beyond the Jan 2014 high. Stay tuned … take note of the monthly. My gut tells me this is going to be a run away freight train if the 101 levels gets taken out BUT it’s one that needs to be BOUGHT w/ a nice pattern.
get ready to rumble … 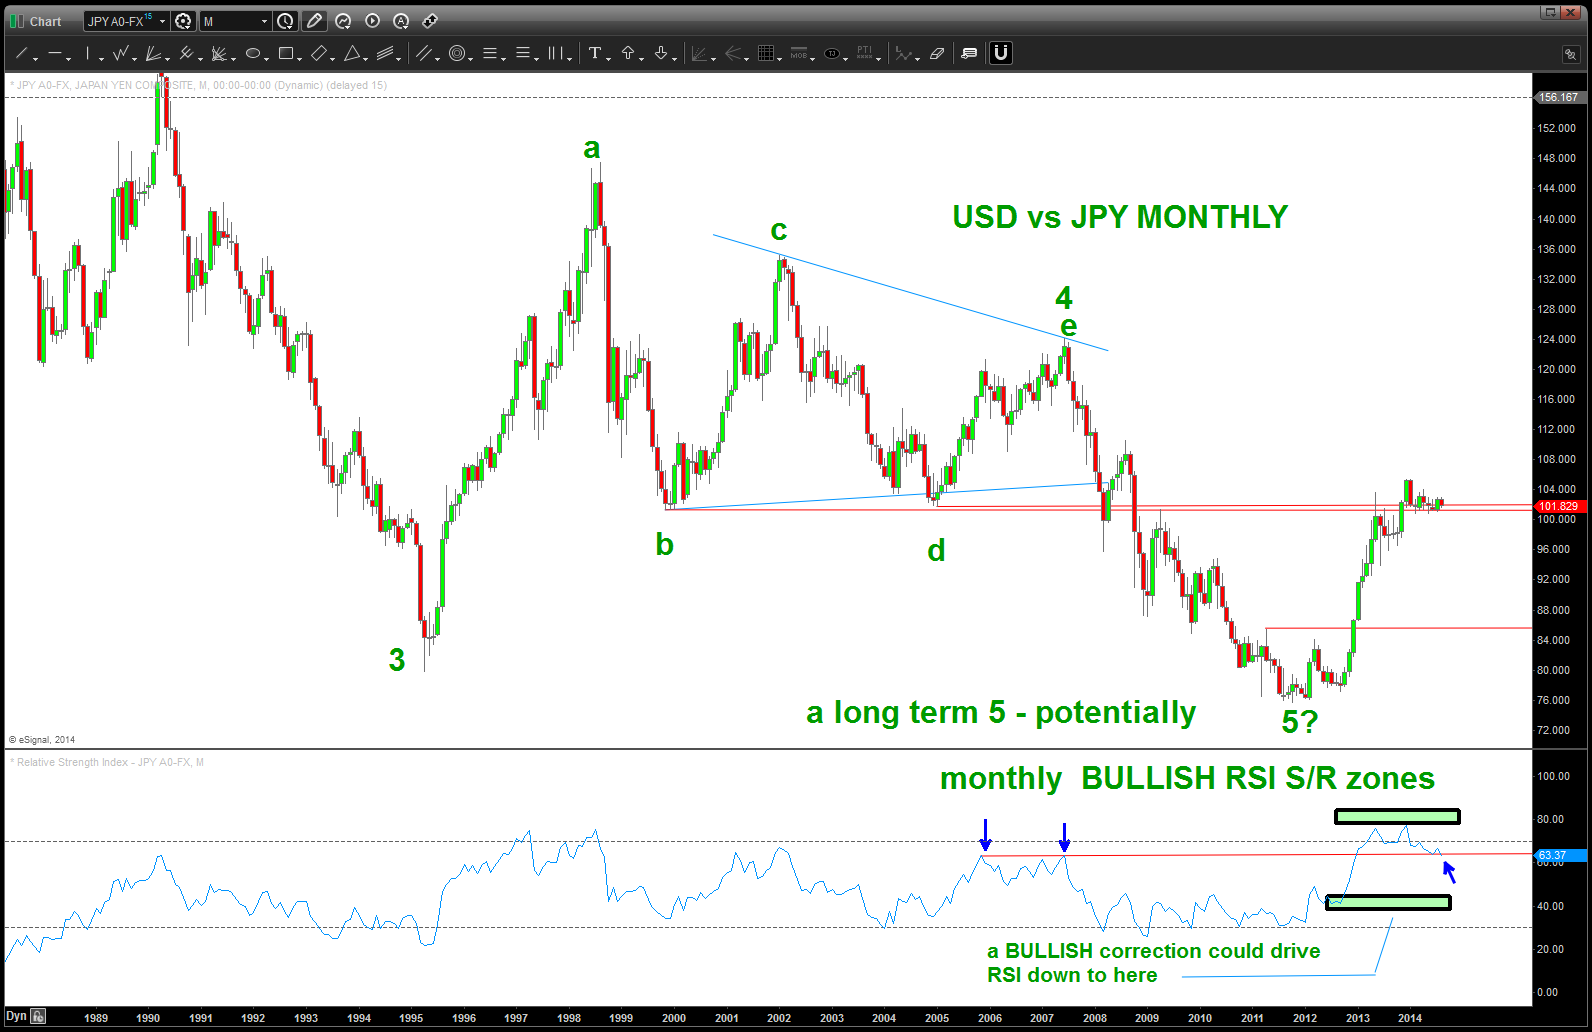
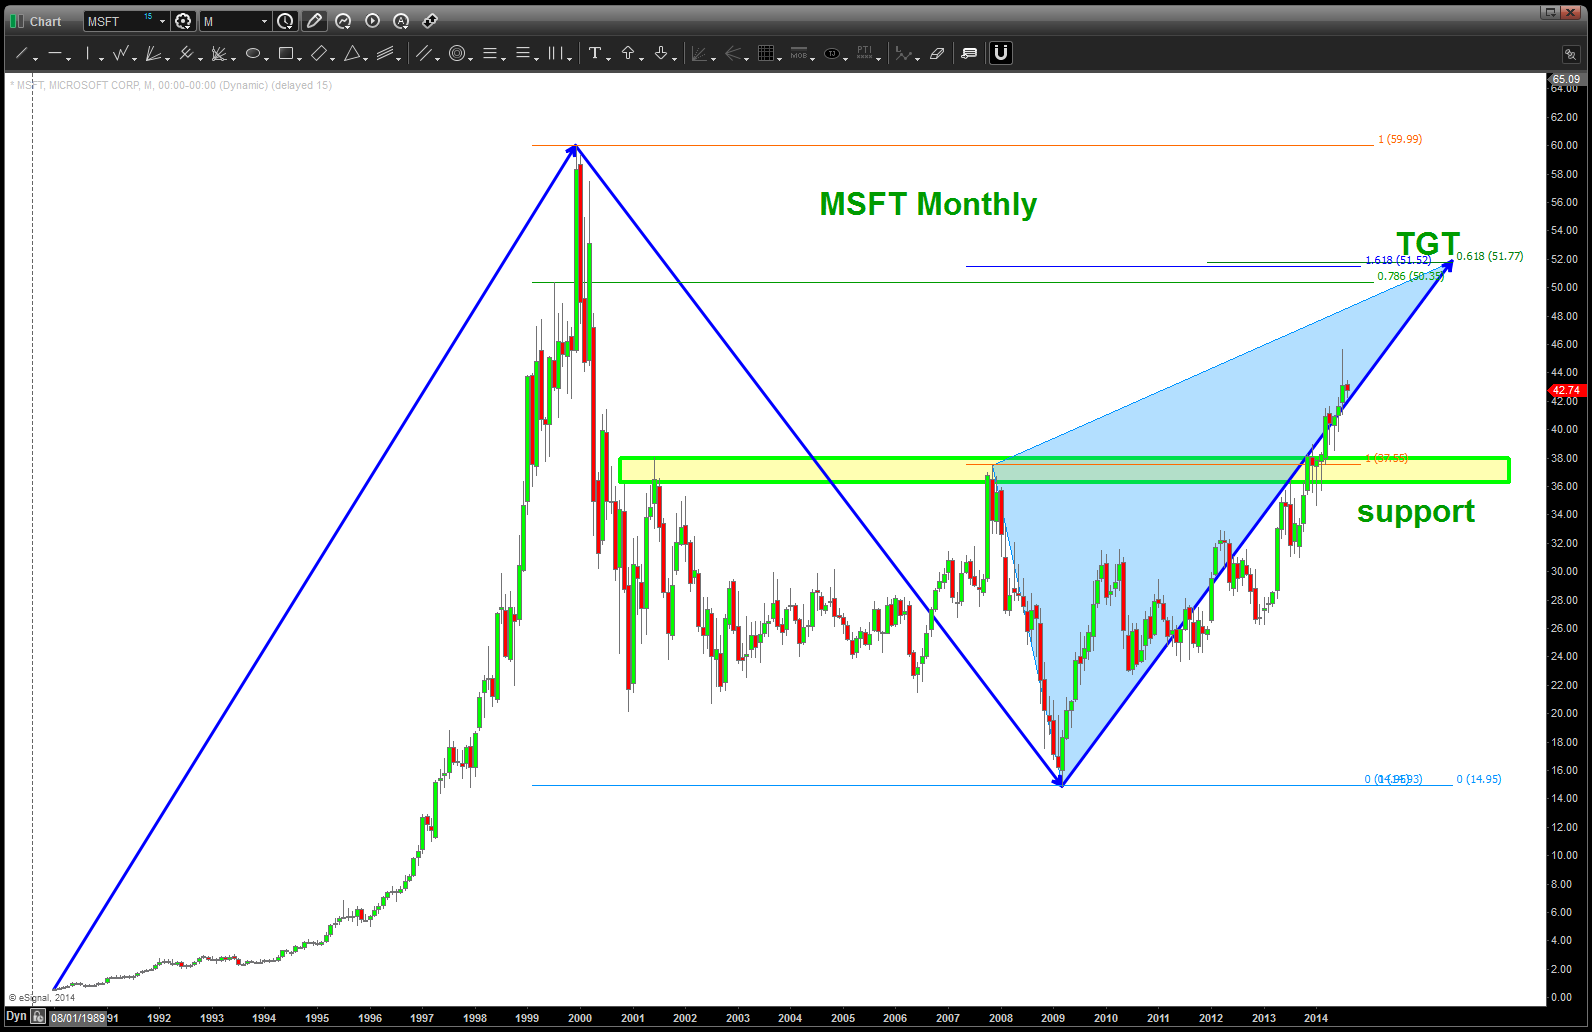
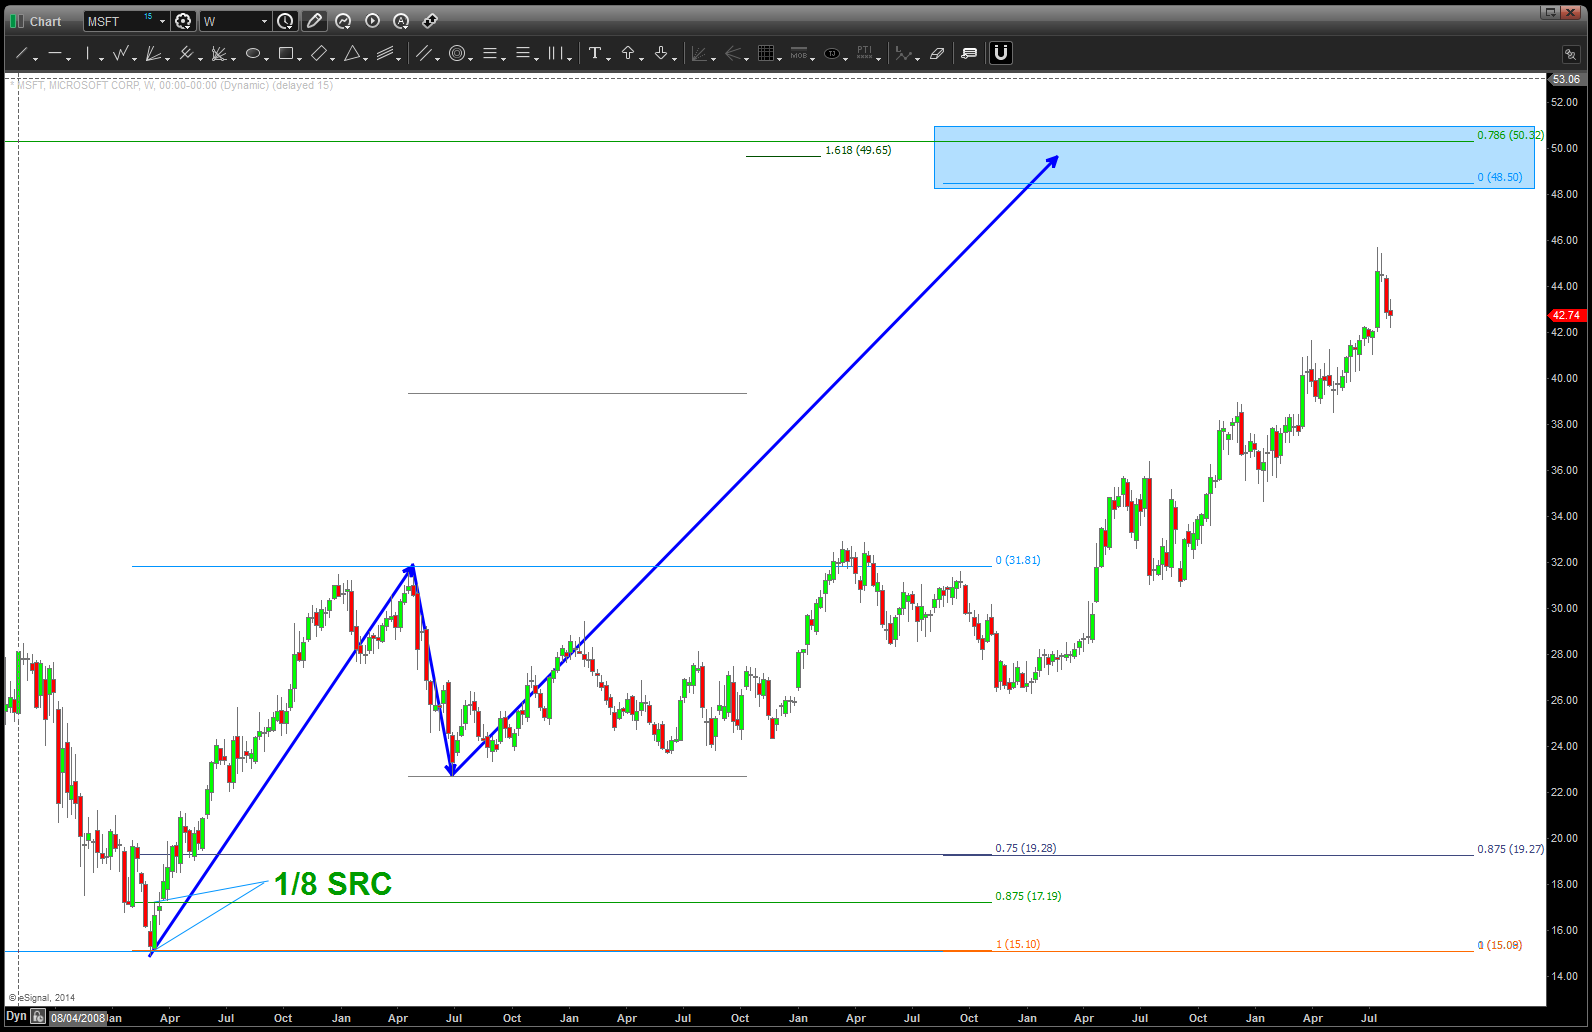
is MSFT making the move?
Posted on August 7, 2014 Leave a Comment
here’s the last post on MSFT: https://bartscharts.com/2014/06/29/msft-microsoft/
take a peak at the RELATIVE STRENGTH of MSFT vs AAPL. No doubt this isn’t too surprising. HOWEVER, it can’t go any lower, can it? Perhaps, just perhaps, MSFT starts to out perform AAPL from a relative strength perspective? the CHART says it can’t get any worse …
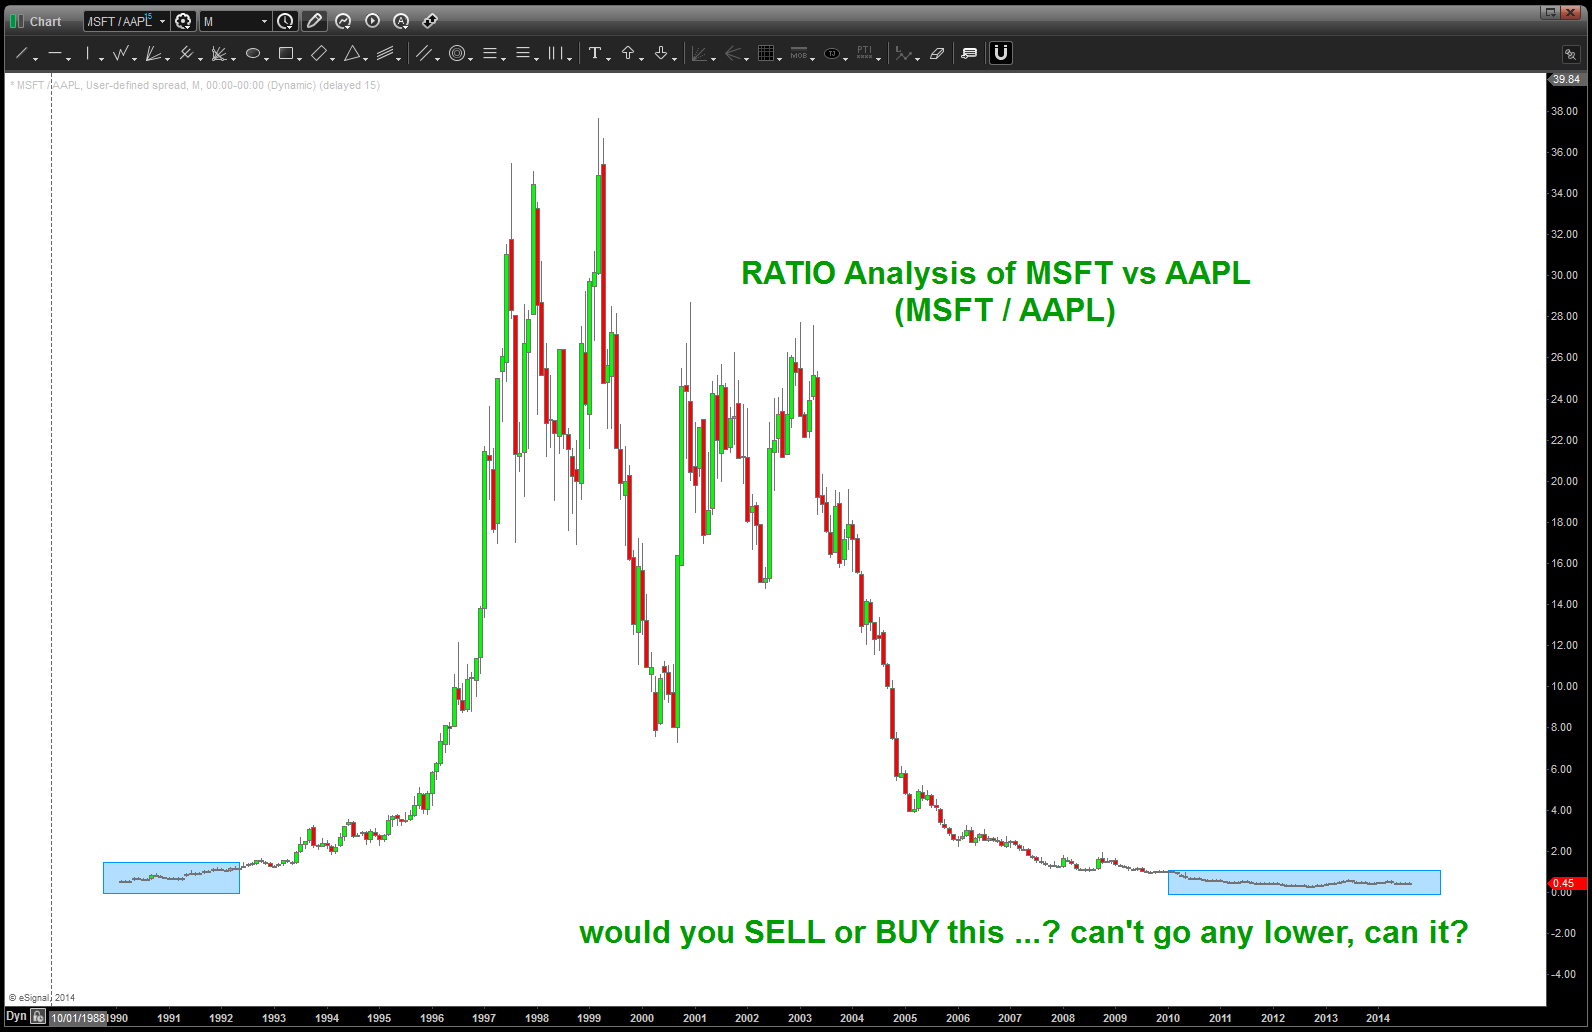
RATIO analysis of MSFT vs AAPL
Chinese Yuan Pattern forming ….
Posted on August 7, 2014 Leave a Comment
For years institutions have “bet” on the continued strength of the Yuan as a “safe bet.”
That might have all changed around mid January of this year … from Jan-March the Yuan weakened appreciably.
To quote one news article – “this move is particularly notable, as the yuan has broken through the 6.20 yuan per dollar mark. At that point, some investments that bet on a strengthening yuan should start to incur “sizeable losses,” (my emphasis added) according to foreign exchange strategists from Bank of America Merrill Lynch.”
Folks, the pattern shown below is a BUY pattern which, if correct, will lead to another move HIGHER – weak Yuan vs the USD. Right now, as we move down from the notable move UP perhaps all seems OK. Put this into the context of the recent sell-off in the equity markets — I’m guessing here, but I bet it’s “safe” to assume 100’s of billions of dollars are tied up in some exotic way for the institutions to grab any yield out there w/ regards to the “safe bet” on the Chinese Yuan. If this thing starts going back up again then my hypothesis (only a thought) is the “institutions” are going to try and unwind these positions – maybe in a hurry.
There are many ways countries muscle their weight around … cyber, traditional weapons, deterrence, etc. In the end, these are usually reactions to the global flow of funds. The next move by the Chinese will be extremely interesting (folks, they control (manipulate) the currency level – it’s not a true float) on the global scale.
If you don’t think it’s true then just think of the masterful move by Mr. Putin. Right before an invasion of Ukraine (maybe) the Russians sign an order to BUY BILLIONS of dollars of planes from Boeing. Now isn’t that interesting …. (http://www.reuters.com/article/2014/08/06/ukraine-crisis-russia-airlines-idUSL6N0QC3JK20140806 )And, why they are at it, let’s give Snowden another 3 years in our country. CHECKMATE … China, your next move please?
WATCH CLOSELY ….
B
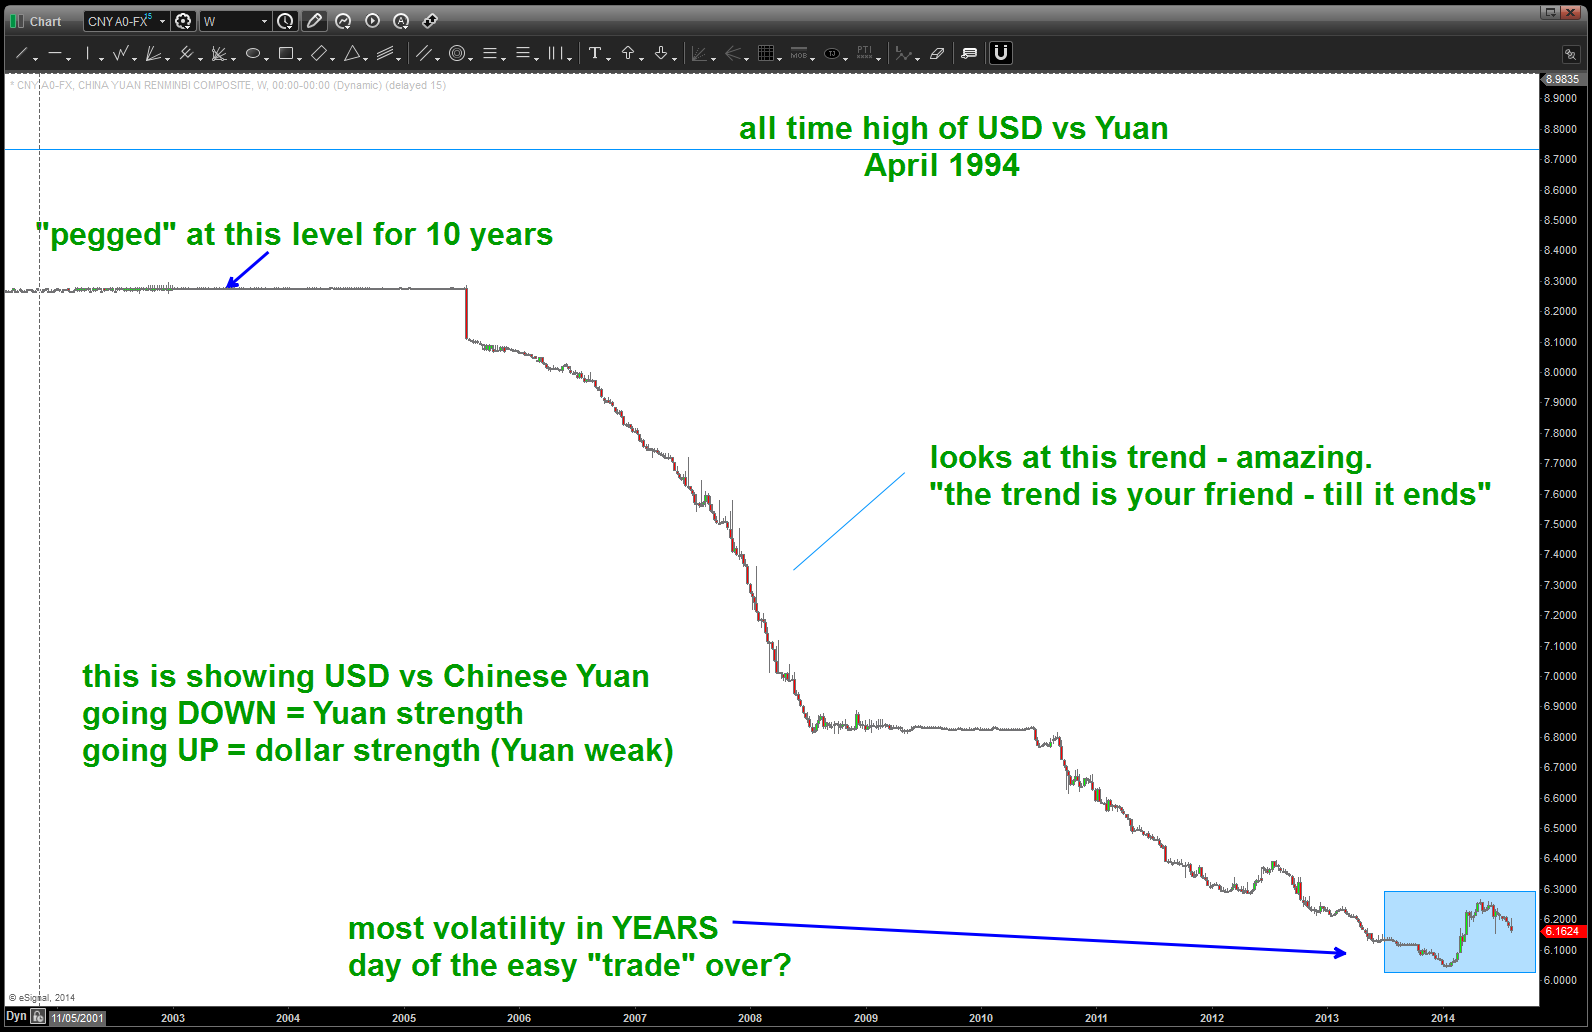
on pressure from the US (and others) the YUAN has steadily strengthened for years … is that over?
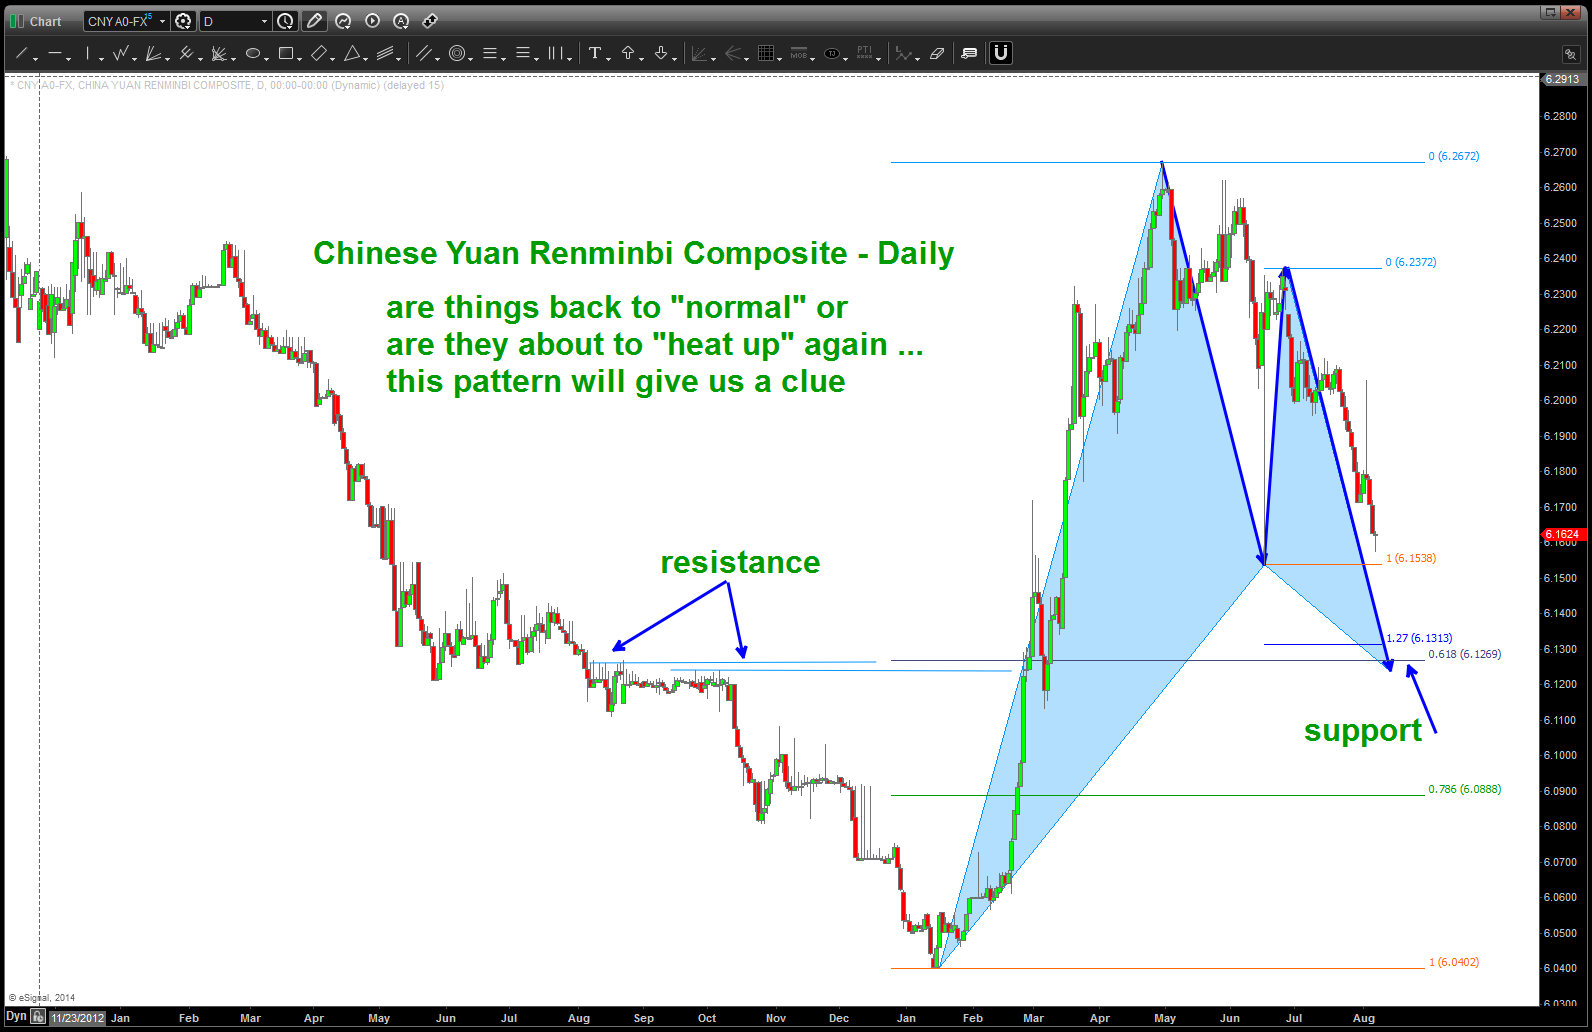
BUY pattern appearing on the Chinese Yuan vs USD (if holds = YUAN weak)
Gorilla’s juggling dynamite … and the US Dollar a redux
Posted on August 6, 2014 Leave a Comment
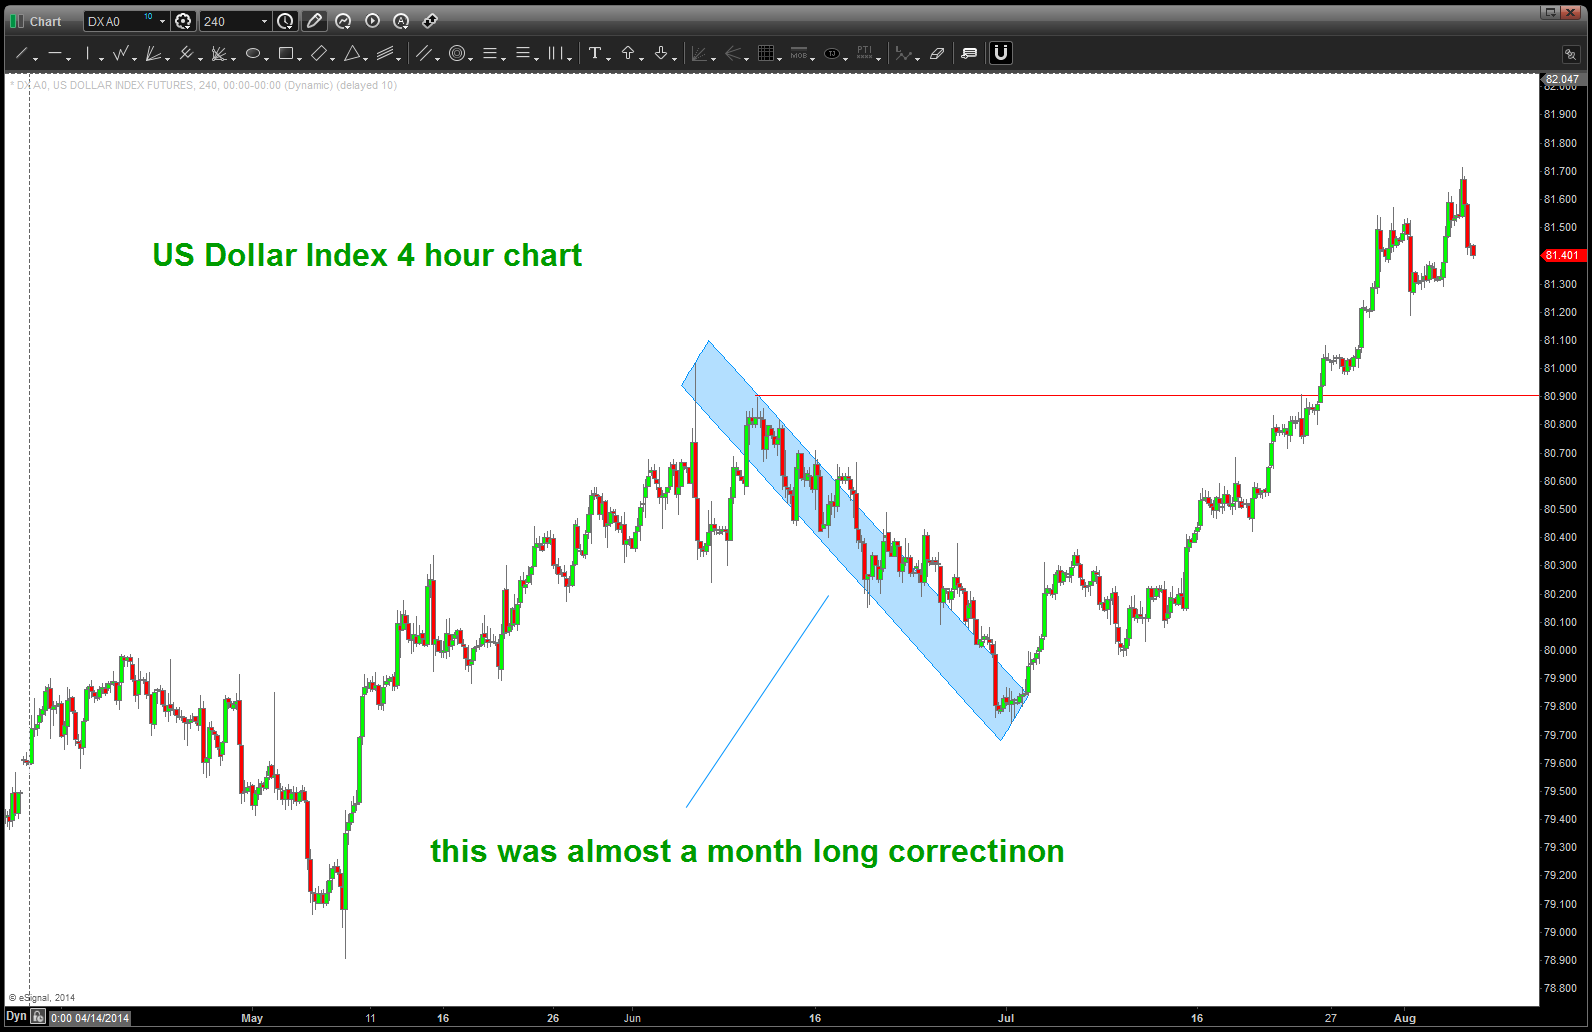
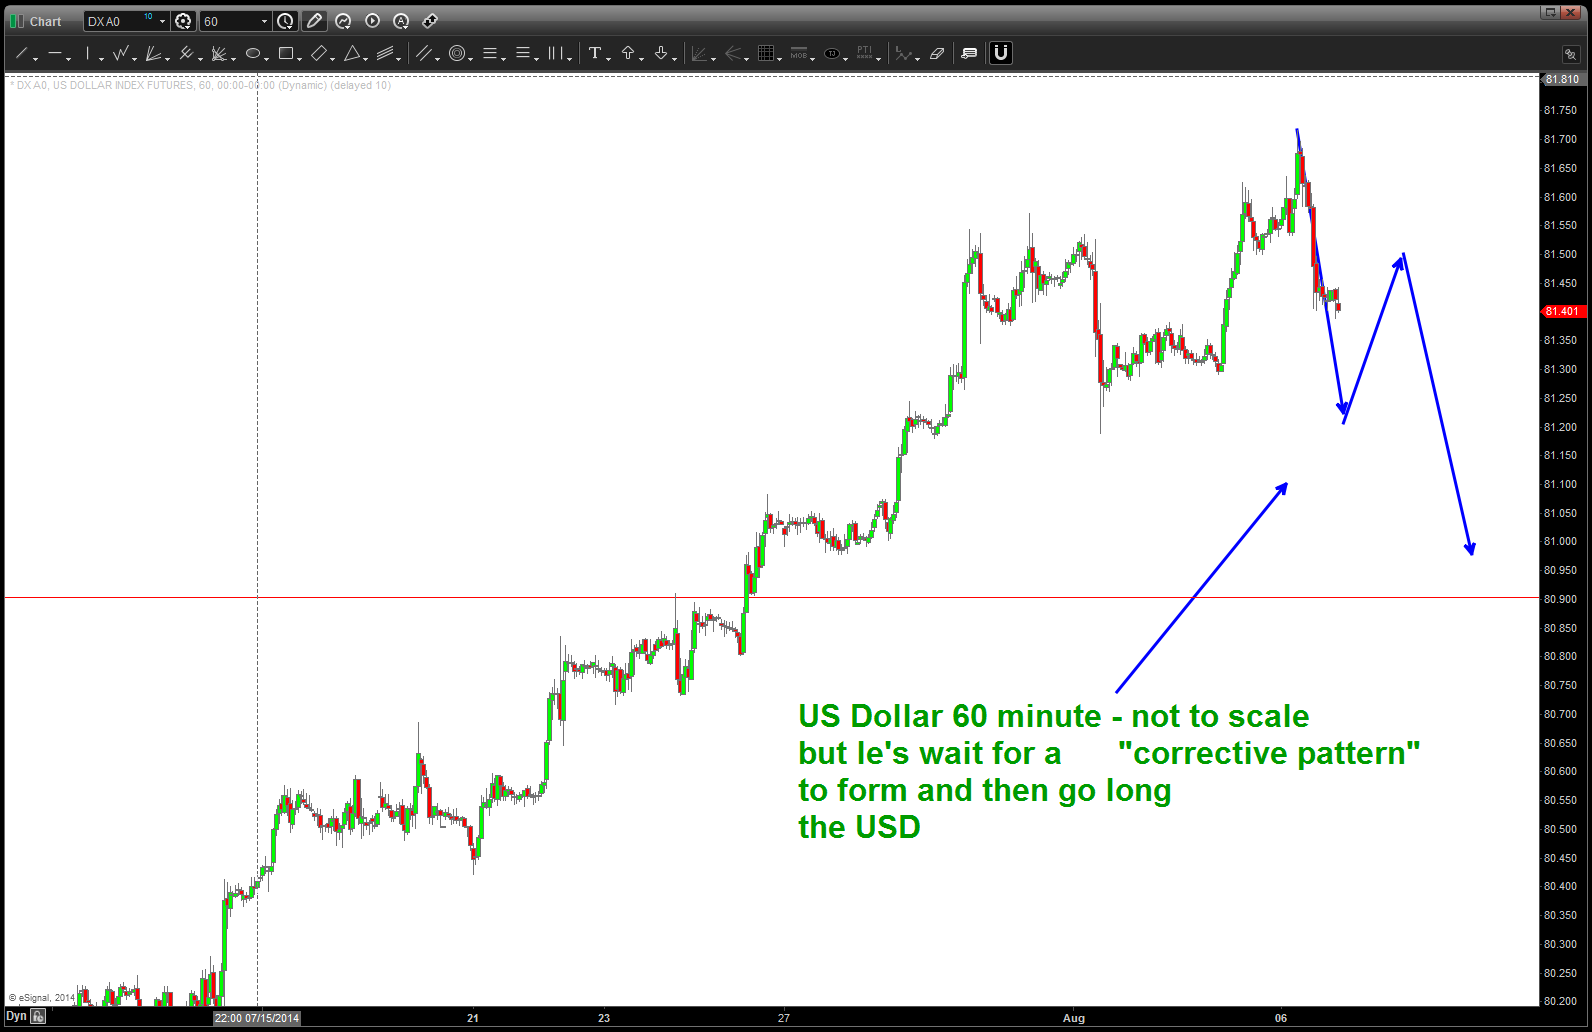
the post below is from February 13, 2014 and I believe it’s important to rehash the most recent moves in the US Dollar. Believe this move has room to go, however, we need to patiently wait for a corrective pattern to form.
this move in the dollar is real so try to get long in the most risk adverse manner possible. as you can see from the post below as the 79 level was repeatedly getting tested I did, admittedly, start to question my strong dollar scenario. that was surely one ugly level for a while but I do think the dollar will strengthen into the low 90’s target that we have been calling for.
take your time and go thru the post below …some AMAZING geometry. Also, remember, ALL of my charts are REAL TIME w/ no backward look .. they are as I saw it.
Bart

February 13, 2014

used GOOGLE to look for a picture of Gorillas Juggling dynamite – this is the best I could find
Early in my career I had the wonderful opportunity to get training from Joe Di Napoli (www.fibnodes.com) Highly recommend learning some of his techniques but, most importantly, his understanding of the market structure and the players in the game. One of his favorite sayings is we must realize that “you are entering into a world where the market is truly a caged gorilla juggling dynamite and – the dynamite is lit!”
Additionally, if you have been reading this blog you’ll realize it’s focused 1) 100% on PATTERNS and 2) it’s unique value is tying PATTERNS into the circle of life (fixed income, equities, commodities, FX). W/in the context of the circle, the gorilla is the Foreign Currency Market. According to the Bank for International Settlements – the preliminary global results from the 2013 Triennial Central Bank Survey of Foreign Exchange and OTC Derivatives Markets Activity show that trading in foreign exchange markets averaged $5.3 trillion per day in April 2013.
The Dollar Index is somewhat important as it represents a basket of 9 currencies – the Euro representing a vast majority of it at 58%.
For all intensive purposes – it’s been “stuck” in a 4 cent range but PATTERNS suggest we are “prepping” for a big move … so, in order to get a “feel” for where we MIGHT be let’s go back to the “beginning” at 71 ish and work thru to present…
PATTERN at after the 71 low
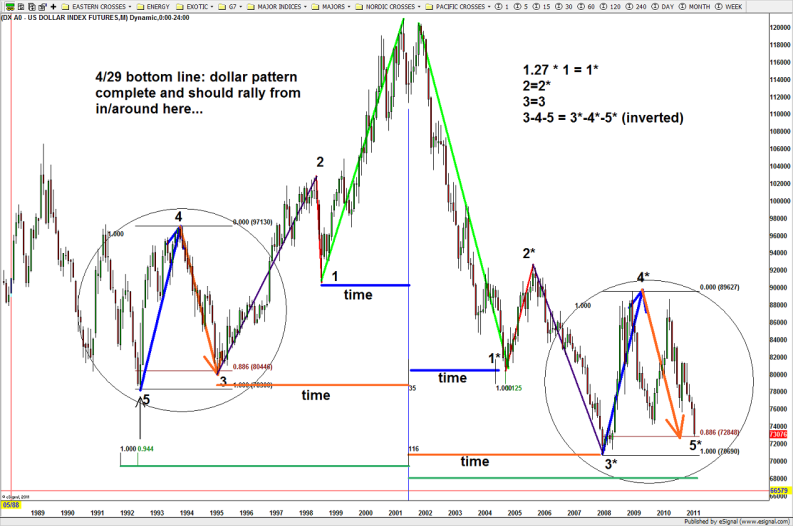
more detailed look at the mirror image foldback present in the US Dollar
CLIFF NOTES: the BULLISH thesis is that after the 5 waves down from 121, a 3 wave (at a minimum) corrective pattern should ensue (A-B-C) and therefore the bounce has farther to travel. Additionally, it could mark a MAJOR low and we are starting back up for 5 waves. The BULLISH consensus for the US DOLLAR is that this move UP is not complete. Please see this chart below … and, notice the EXACT move up from the PATTERN shown above at the “2 or B” level.
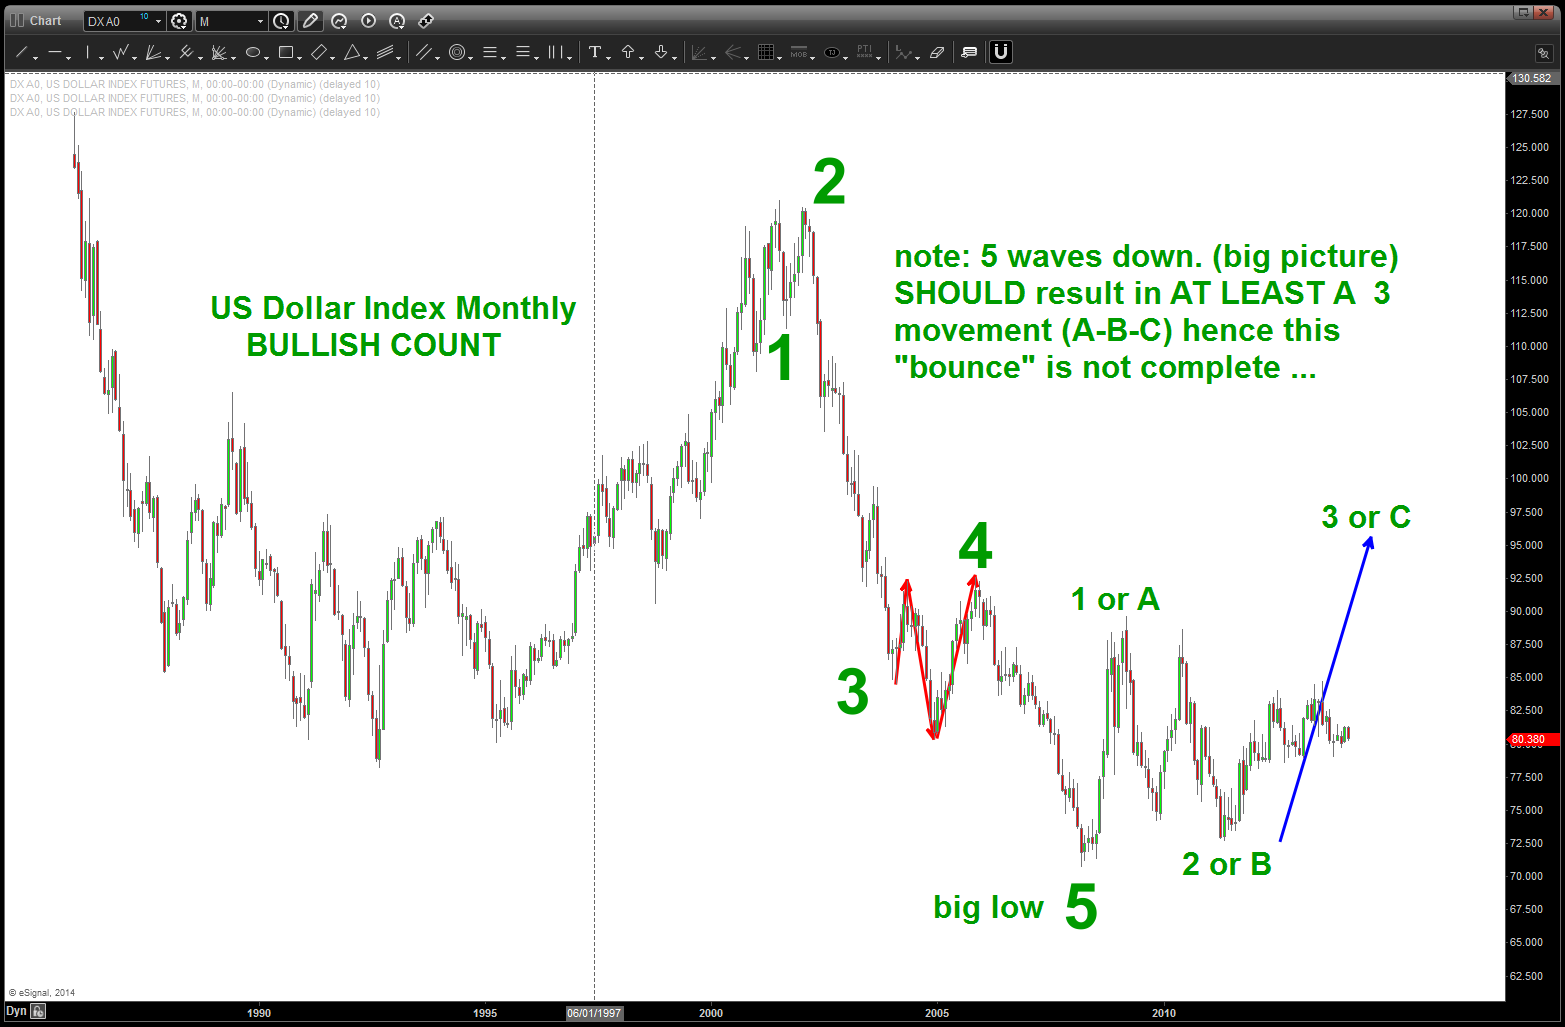
note a clear 5 waves down should lead, big picture, to a 3 wave move up (at a minimum)
so where are we now? Without showing an “elaborate” count, we can see by the chart below that we smacked right into a “big picture” .618 price projection that had it’s genesis from the 71 price low.
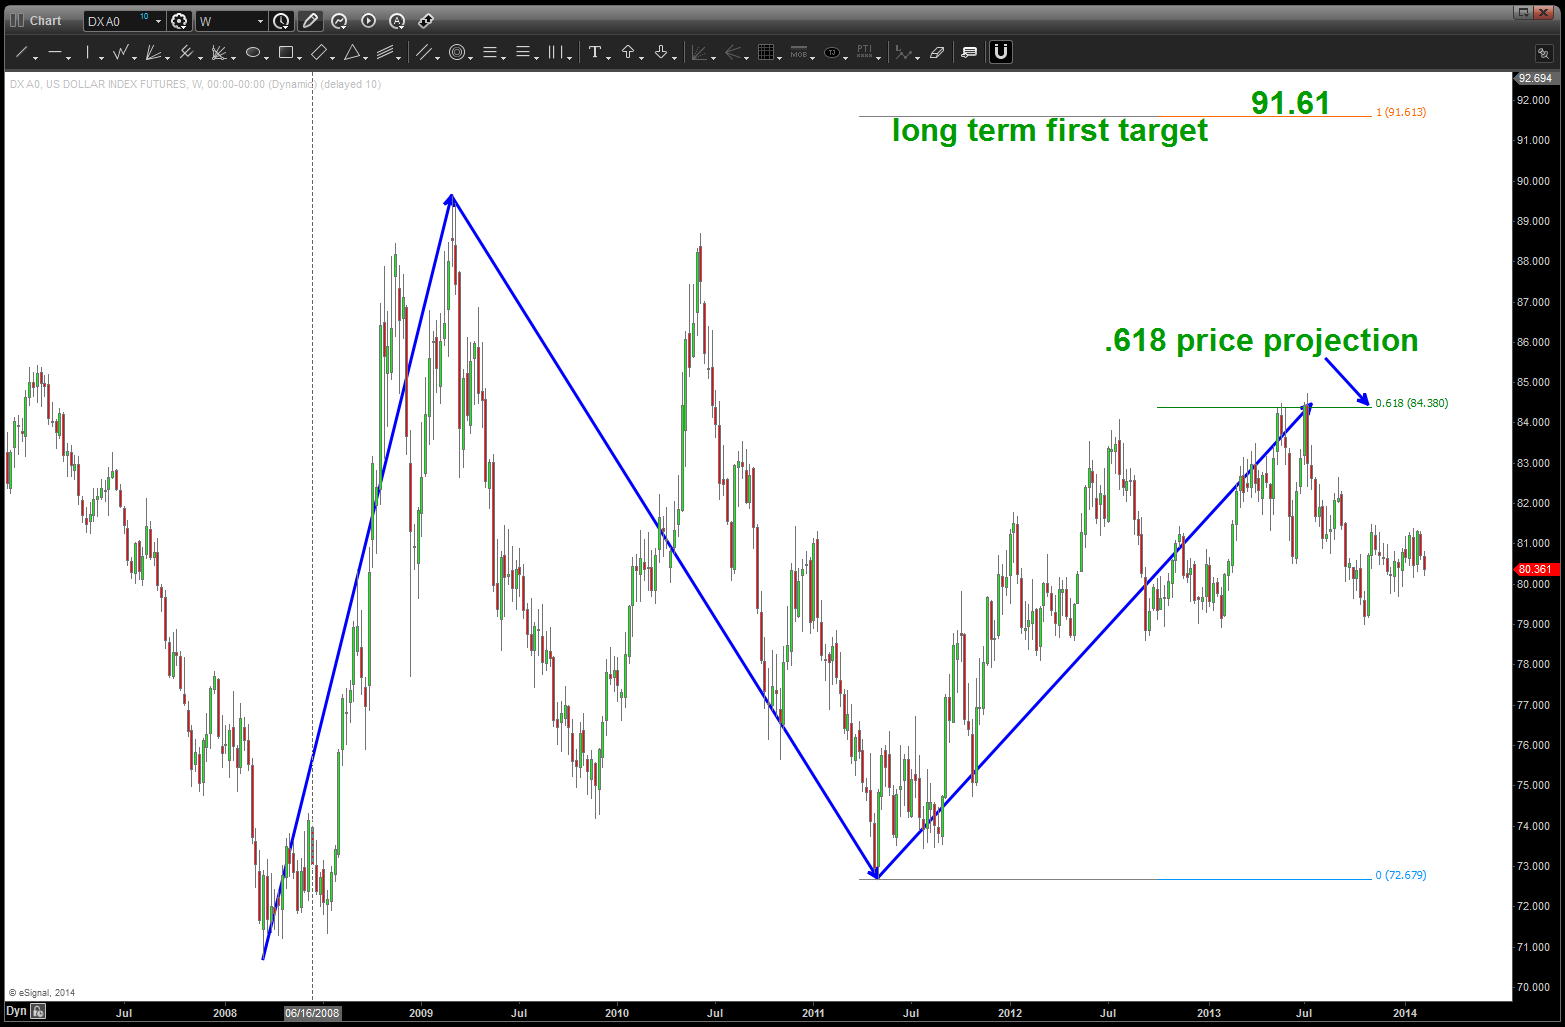
.618 price projection on the US Dollar causing the resistance
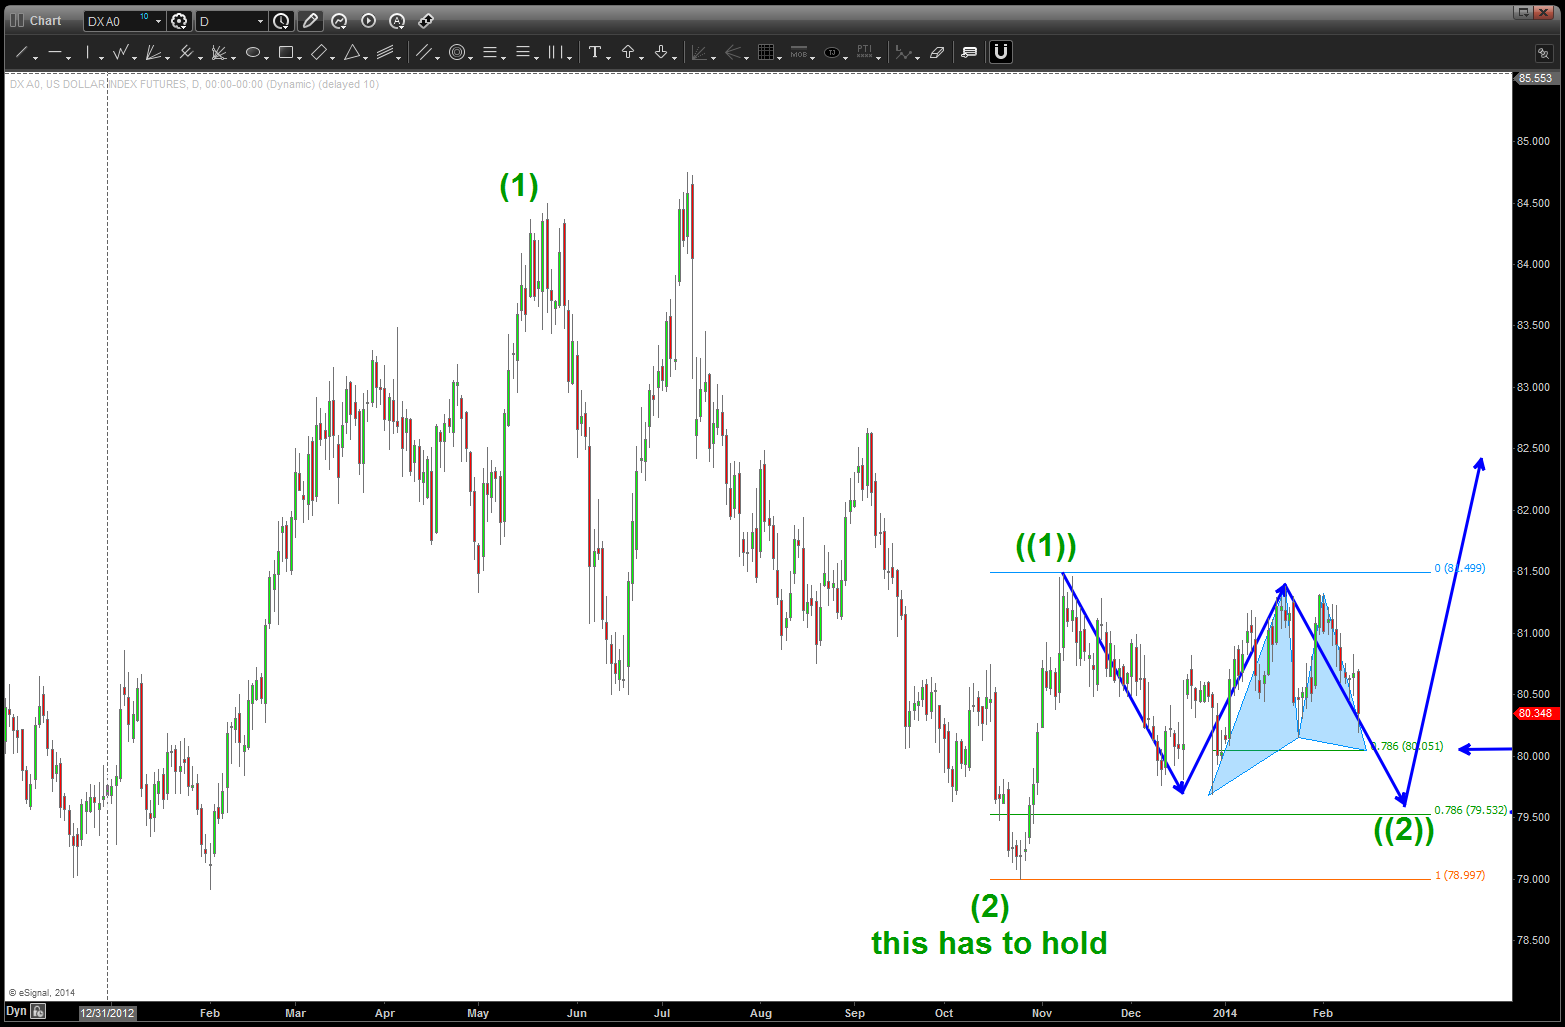
here’s the possible bullish count from the “2 or B” low that shows a POTENTIAL 3rd wave underway. IF the count is correct, then the 79 level has to hold and is very crucial as it suggest that the 3rd wave should begin …soon and UP we go.
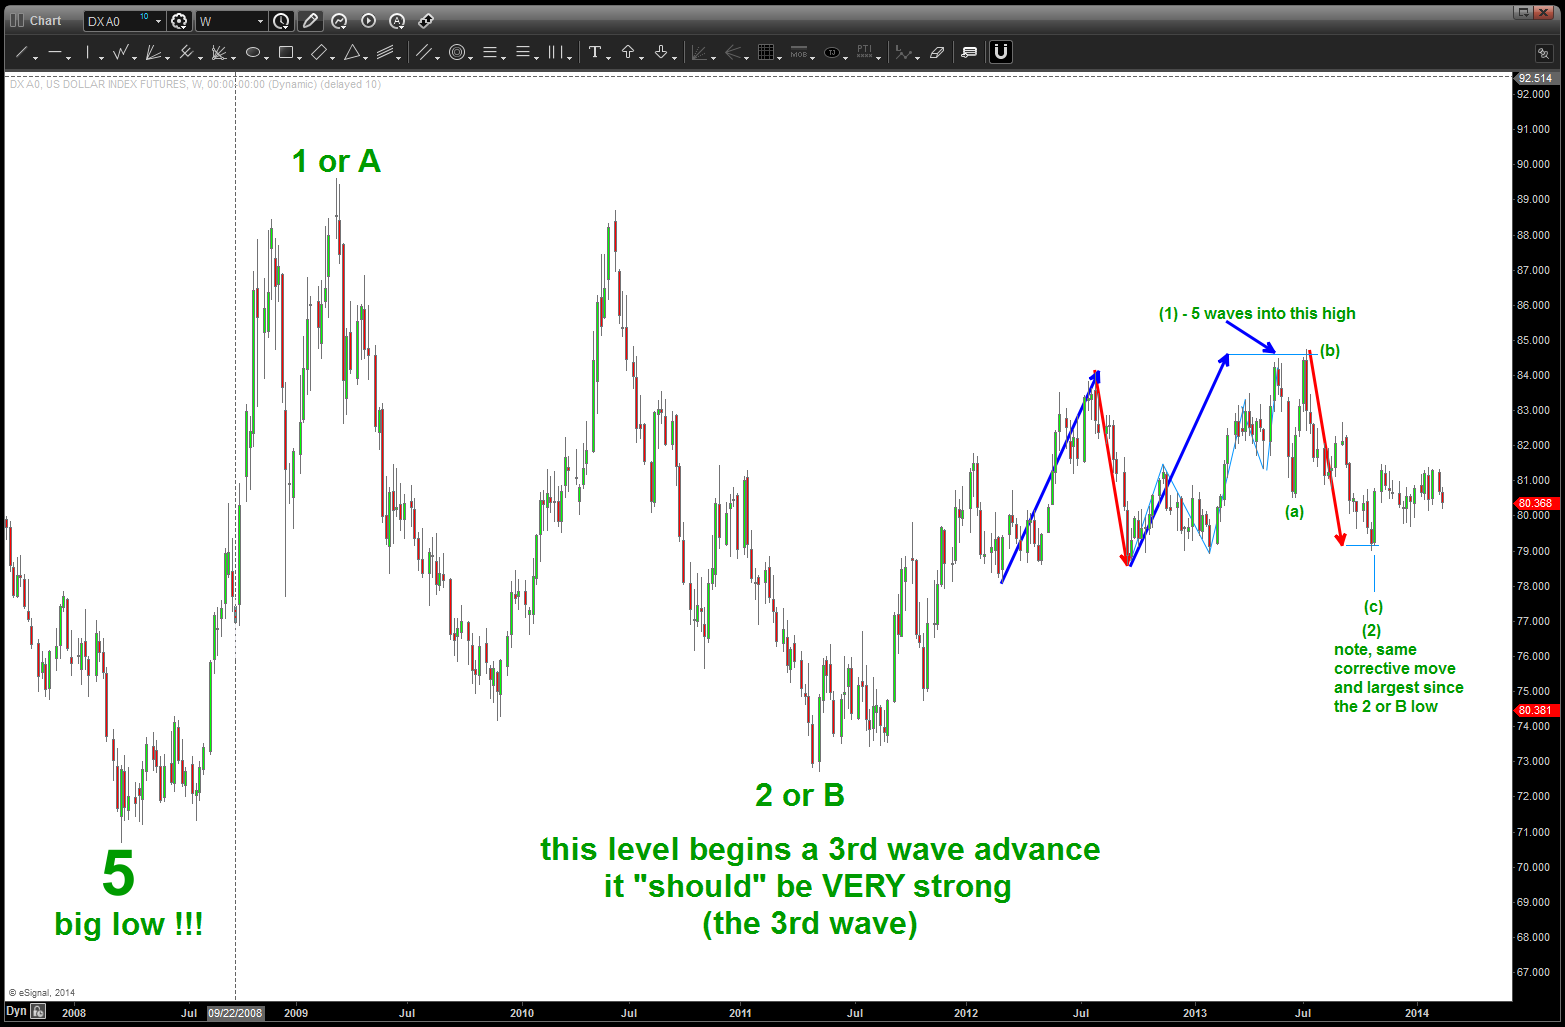
potential count showing a bull move
now, we need to drill down one more time frame – that of the 240 minute chart to see what we have going on. YES, we have a BULLISH PATTERN on the US Dollar at 80.05-80.08. In order for this entire thesis to be correct, then I believe this pattern needs to hold for the strength in the US Dollar to begin…
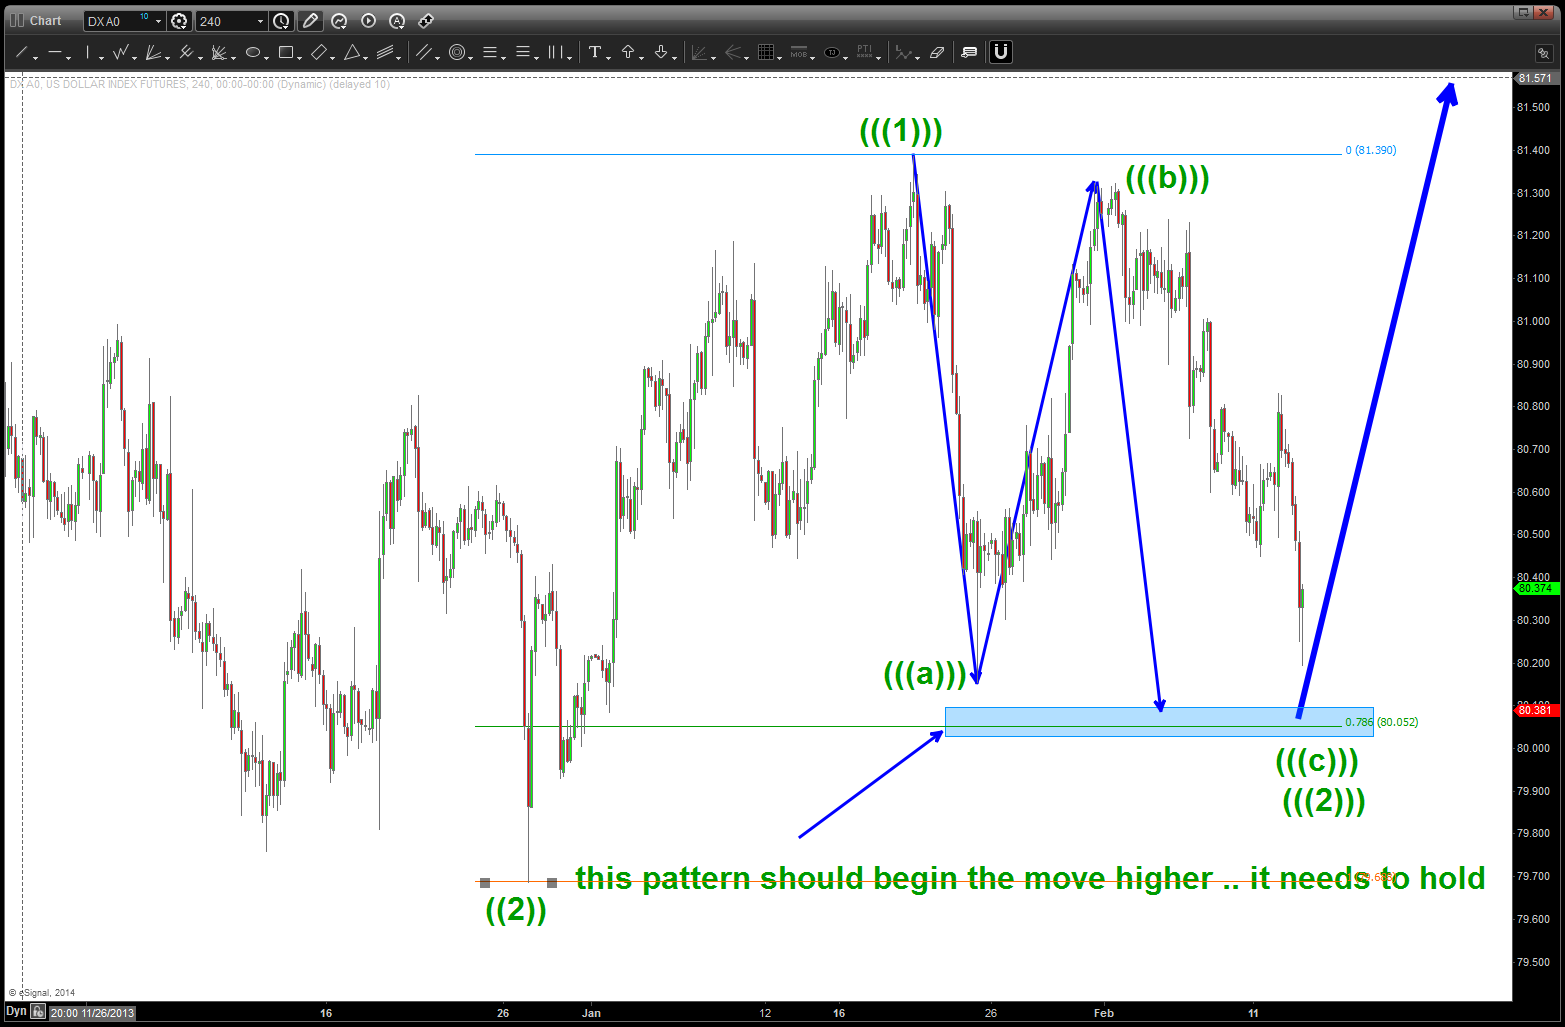
BULLISH BUY PATTERN PRESENT]
the last BULLISH PATTERN present …
PATTERNS fail …they are an EDGE and over time they have been statistically proven to give us an edge. But, what if this pattern does fail? Take a close look at the following two charts … I have not shown this before, but we need to take into account the 5 wave move down from 121 and the .618 price projection — they are starting to form a huge B wave triangle. The 5 wave move into the low is a BIG BIG A and then current structure is forming a BEARISH TRIANGLE w/ the ‘c’ portion just completing (due to the exact nature of the .618 price projection) and ‘d’ and ‘e’ to come …also note the purple trend lines. One forms a head and shoulders and the other is showing the support for the US Dollar since the ‘b’ wave low …
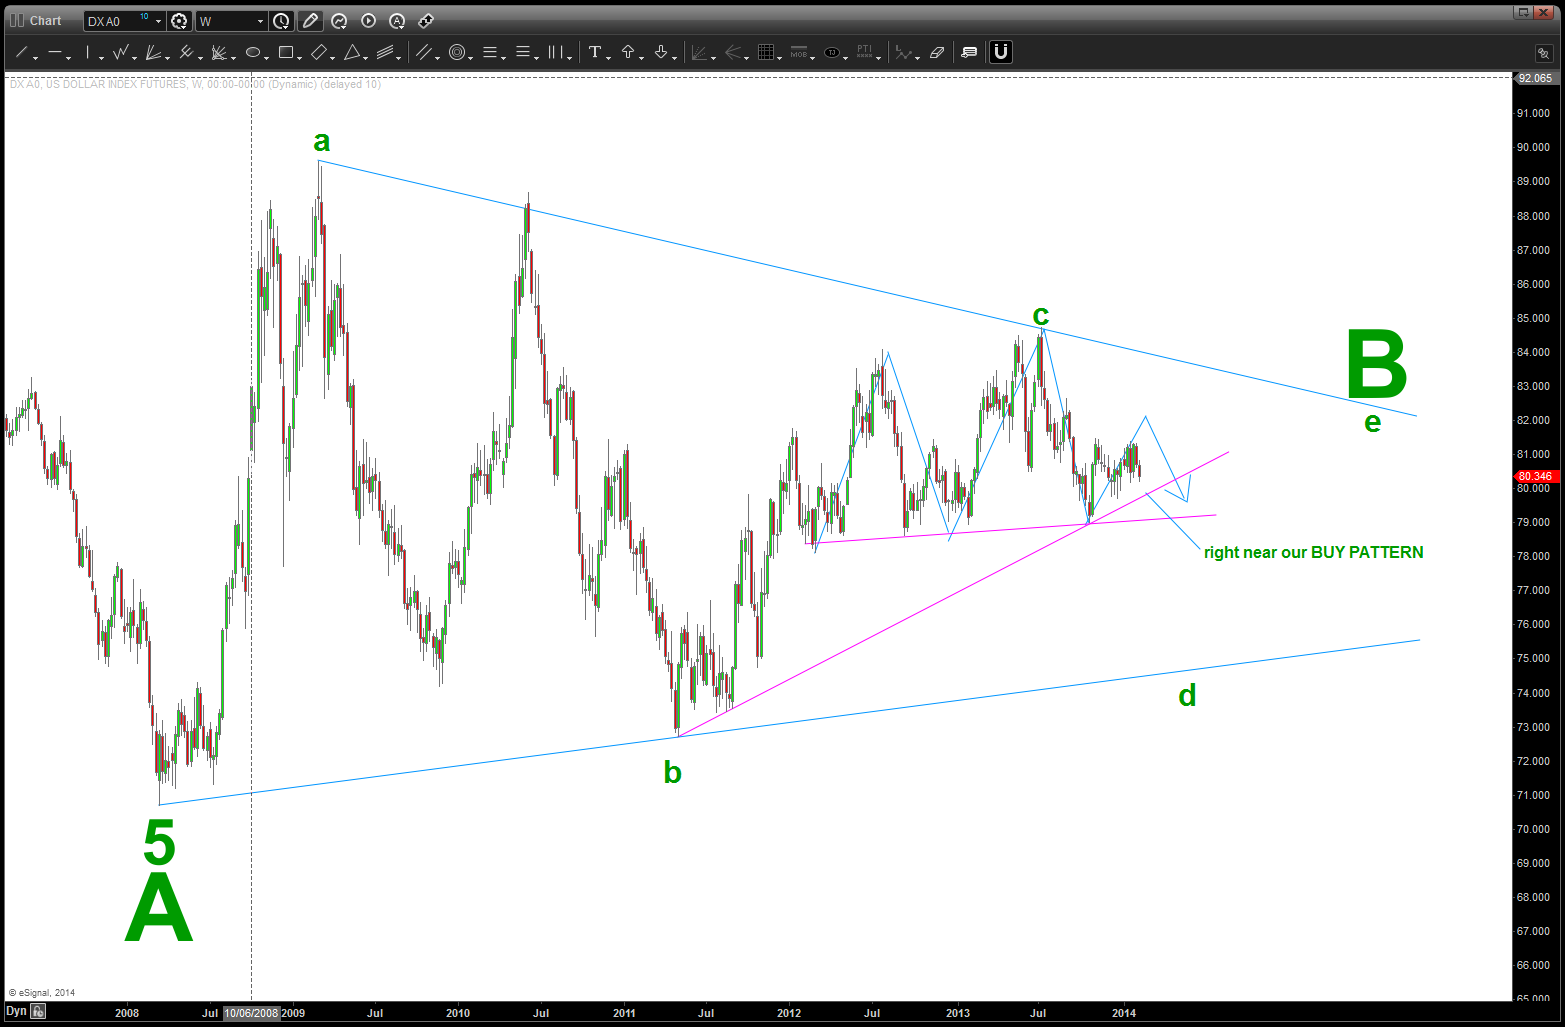
do we have a multi year bearish triangle forming?
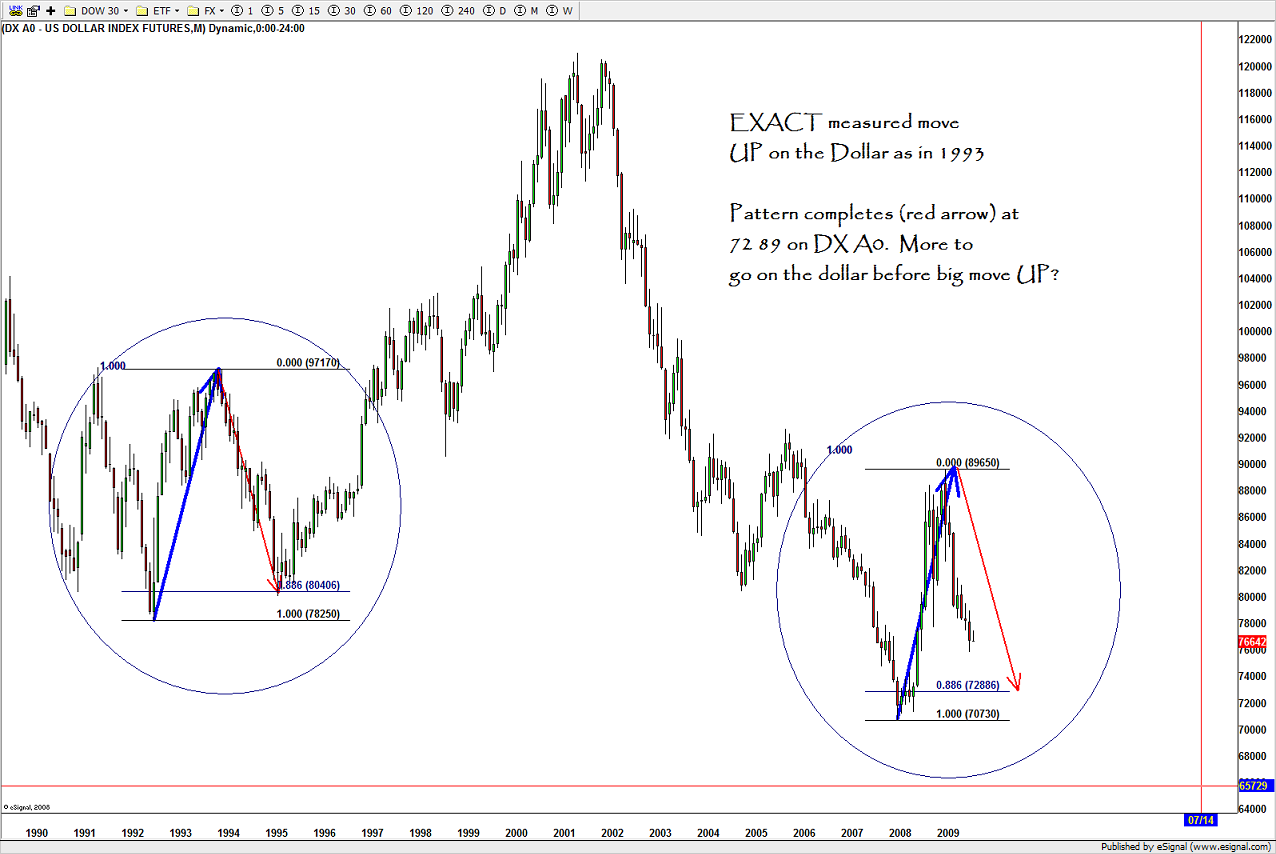
here’s one last thing to consider …. take note of the measured move UP move from the past and what happened after it completed … a bearish omen?
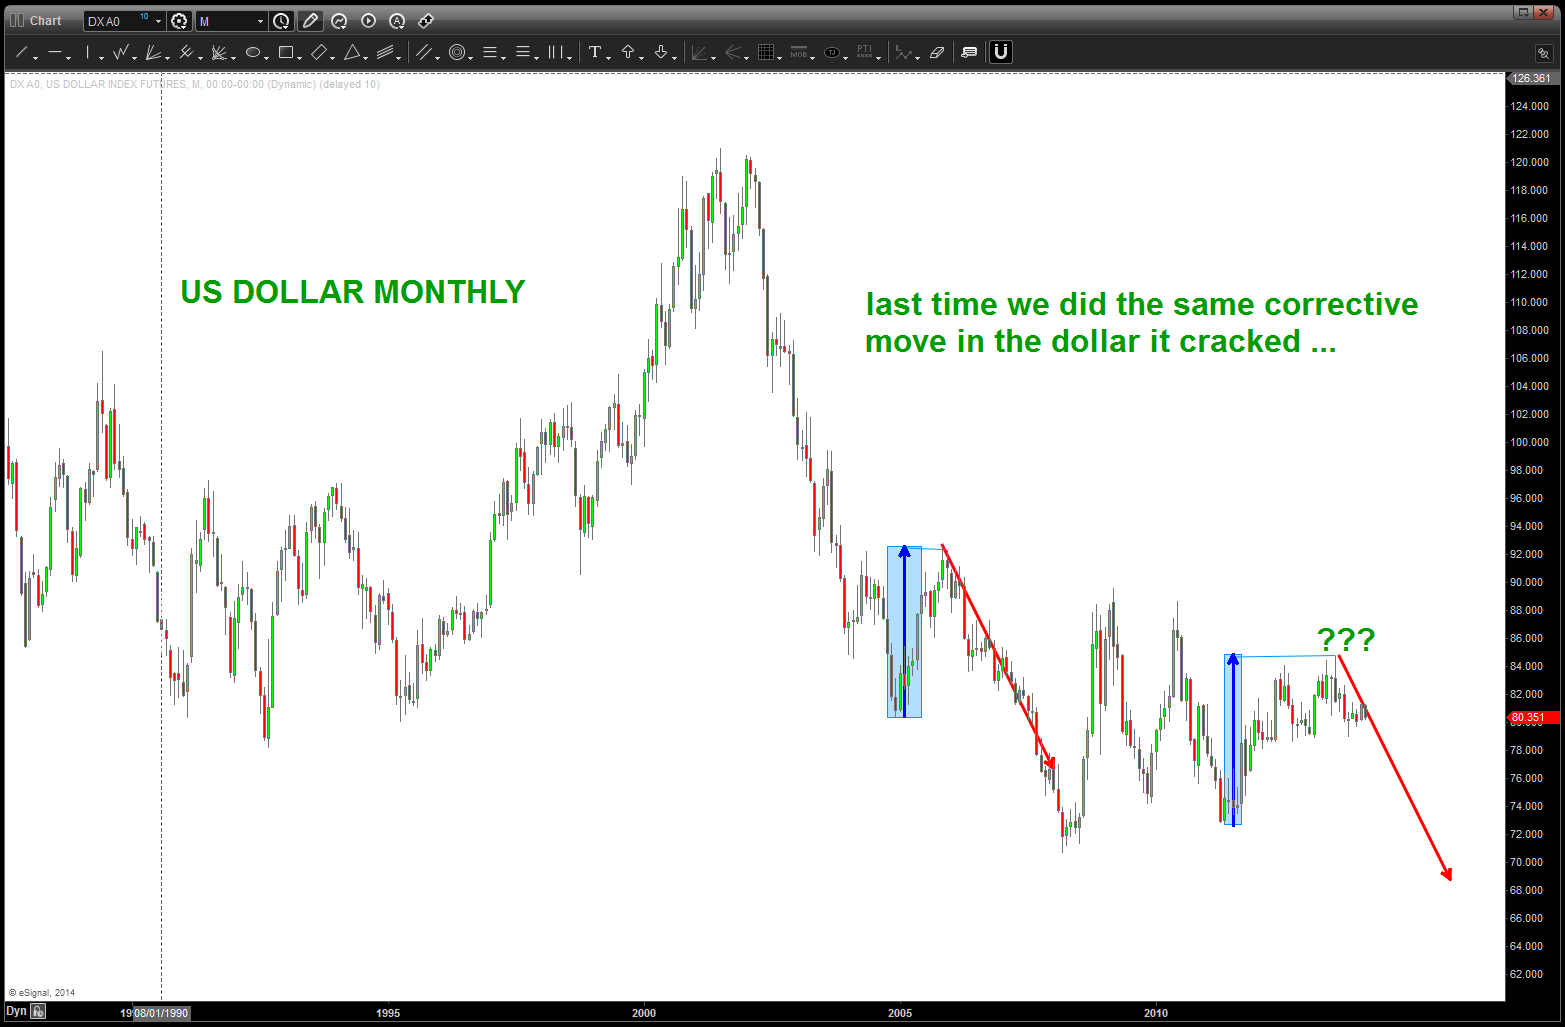
a measure move omen ?
CLIFF NOTES:
- w/ the deflationary forces present, the dollar SHOULD strengthen. A well formed count supports that and a PATTERN very very close also holds that thesis as correct and positive. The first is the once completing at 80.05 on a shorter time frame and then 79.53 on the daily. They need to hold – w/ the 79.53 as the major pattern if the bullish thesis is correct. Remember, w/ our rules we could go all the way down to 79 again so, for all intensive purposes the 79 level is the line in the sand. We have two symmetrical BUY patterns present …
- HOWEVER, if we lose the 79.53 level THEN it will open up some serious selling. PATTERNS will then shift to the B wave triangle thesis …
- Last, we have MAJOR patterns complete across the indices and they are “acting” like the double tops that formed in 2000 and 2007. We have the Dow Jones Transports finishing a pattern from the late 1800’s, we have a potential generational low in interest rates complete and PATTERNS suggest one more wave lower in the commodities …
It’s all coming together and one of the circle of life gorilla’s is going to drop their stick of dynamite and big old explosion is going to occur …
Last call .. shots of XLE being served at the bar! (update 08/05/2014)
Posted on August 5, 2014 Leave a Comment
Update – I want to share this post w/ you again. Why? Well, in looking at the XLE tonight I haven’t seen any bearish (long term) divergence appear. So, what does that tell me? XLE has the potential to go up to our targets mentioned below to produce the bearish divergence. And, as we have discussed, the Energy sector leads at the top and, well, I don’t think it’s done, yet.
Monitor/Watch XLE closely … while it is being sold off, the old high in/around 90 should provide support.
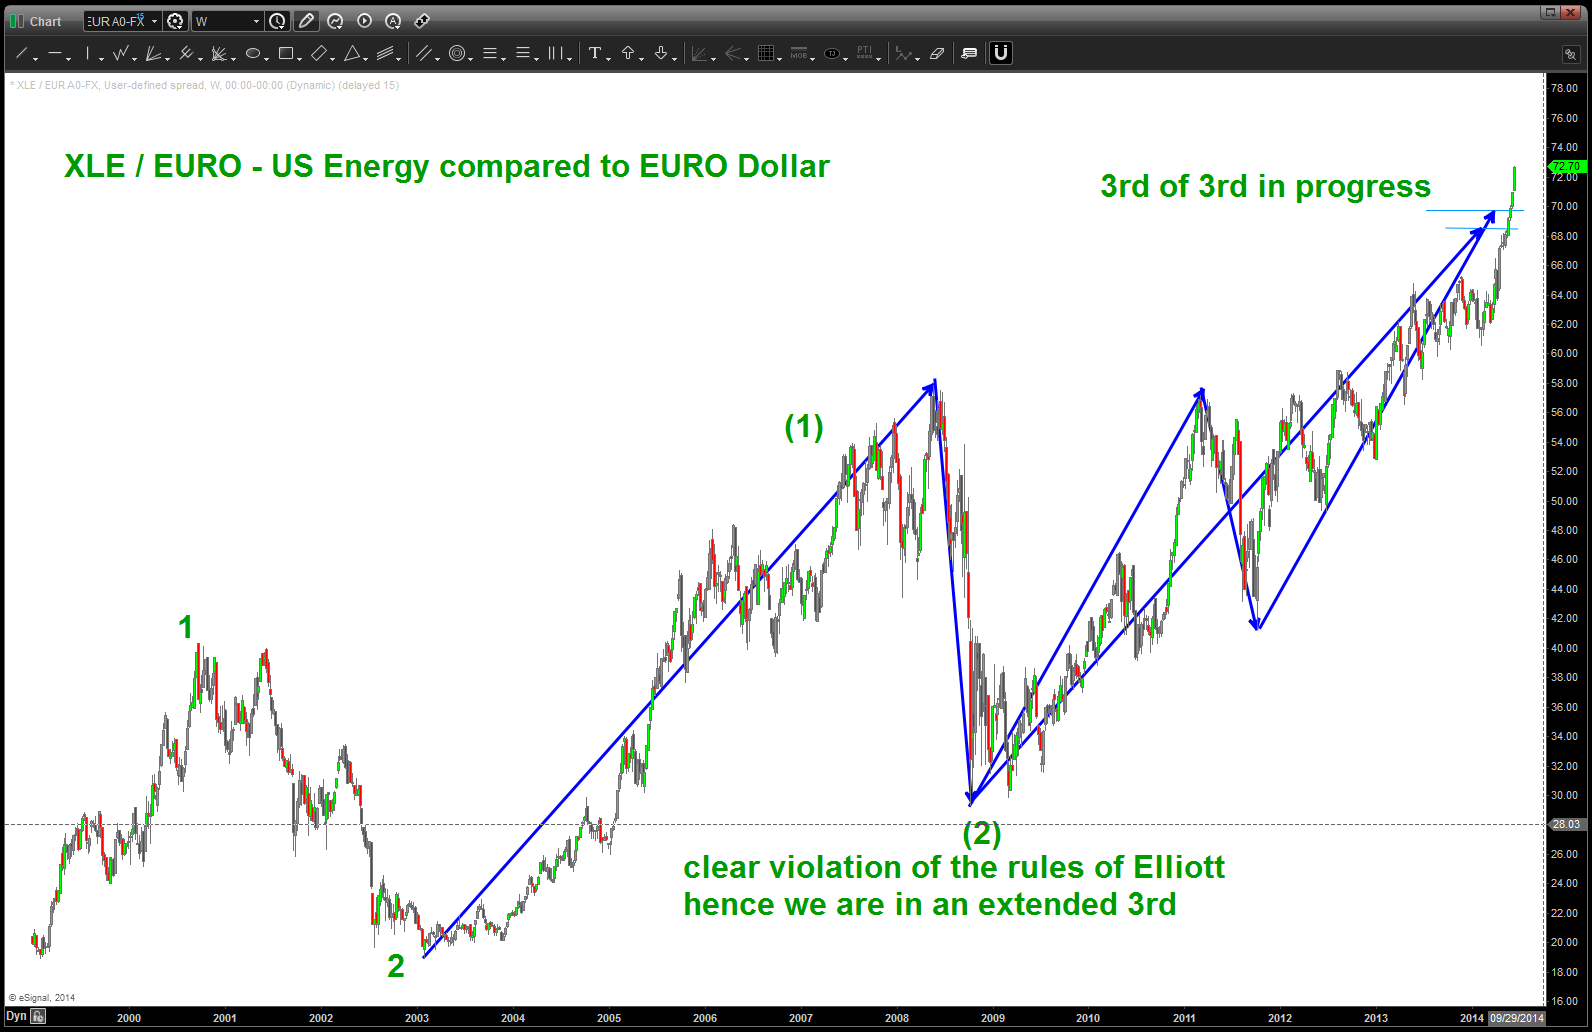
One last, remember, we are looking at signs/patterns that confirm the institutional flow of funds. that is the key w/ ratio analysis. Let me know if you have any questions.
Also, the below was posted in/around mid-June. IT IS NOT REAL TIME ….but a look at the before and after.
BART
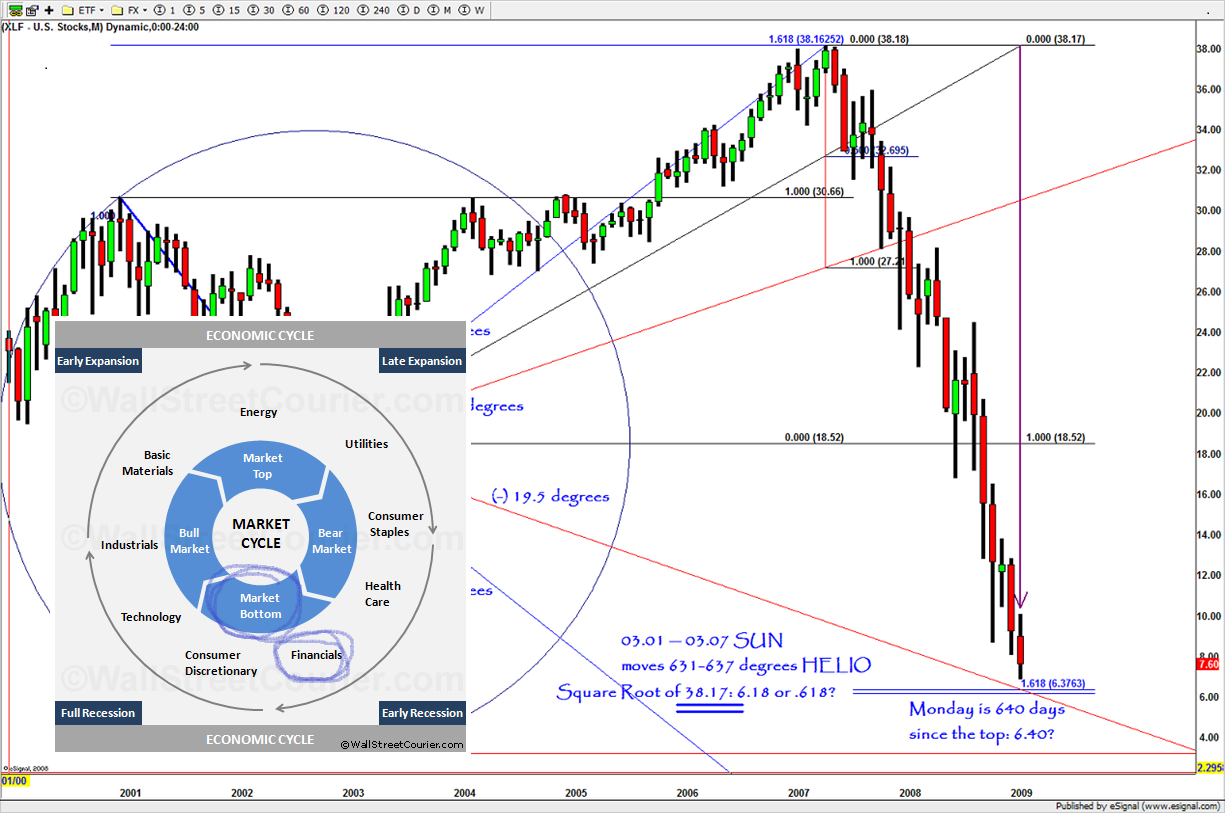
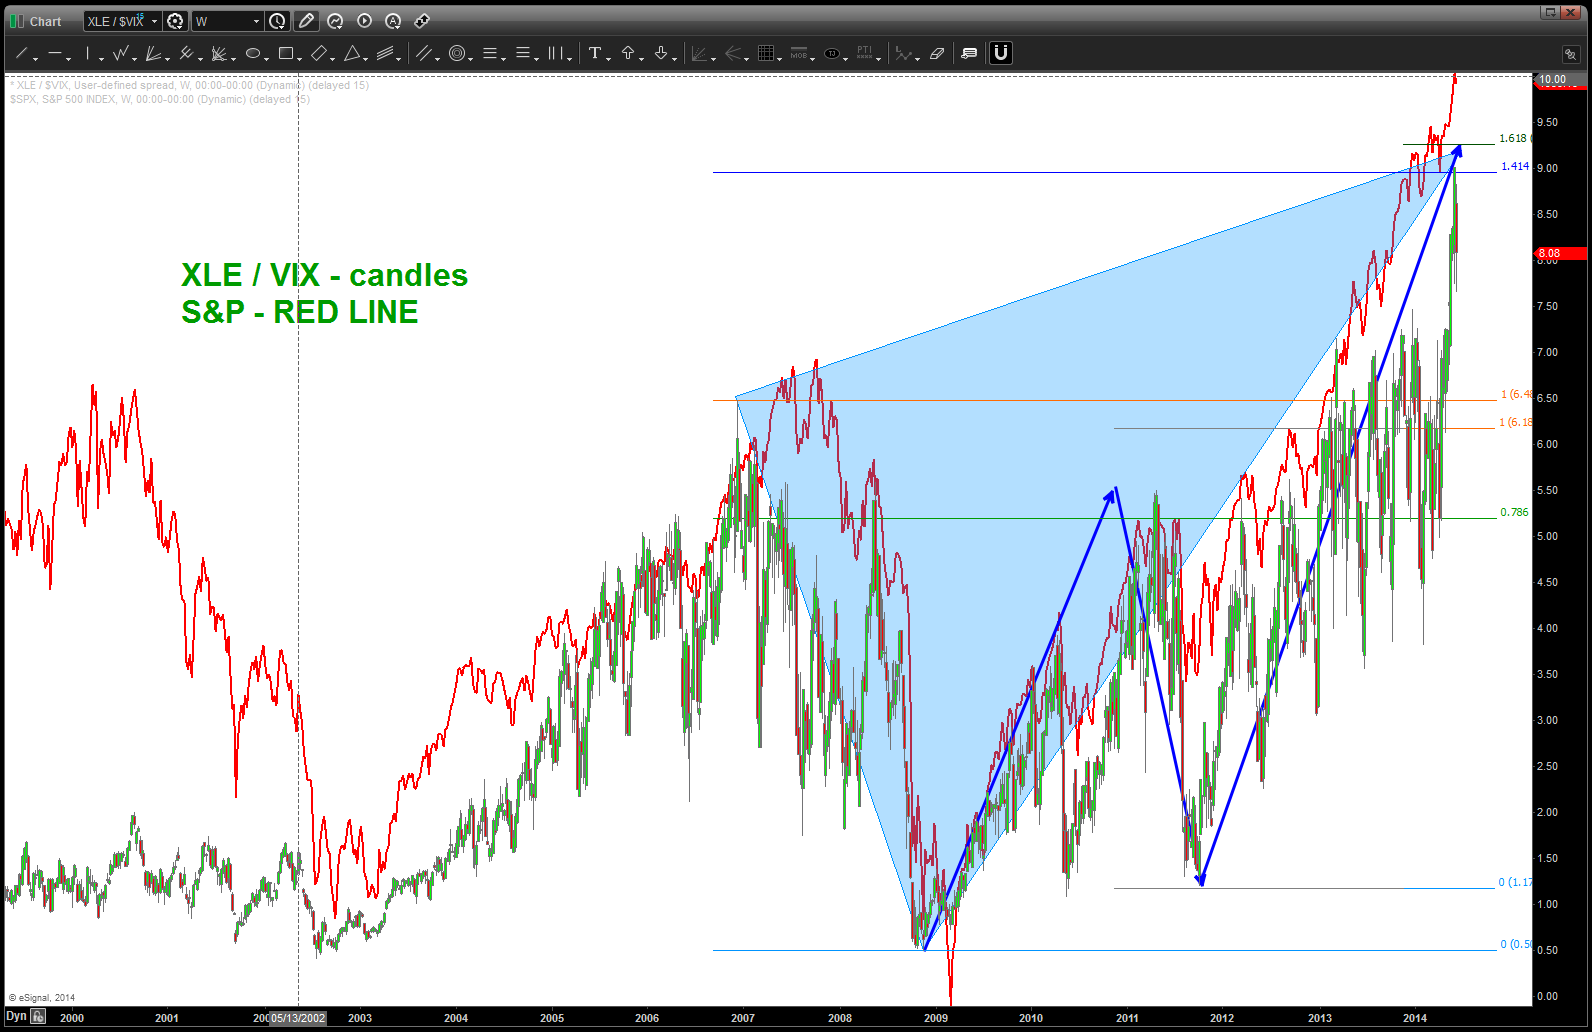
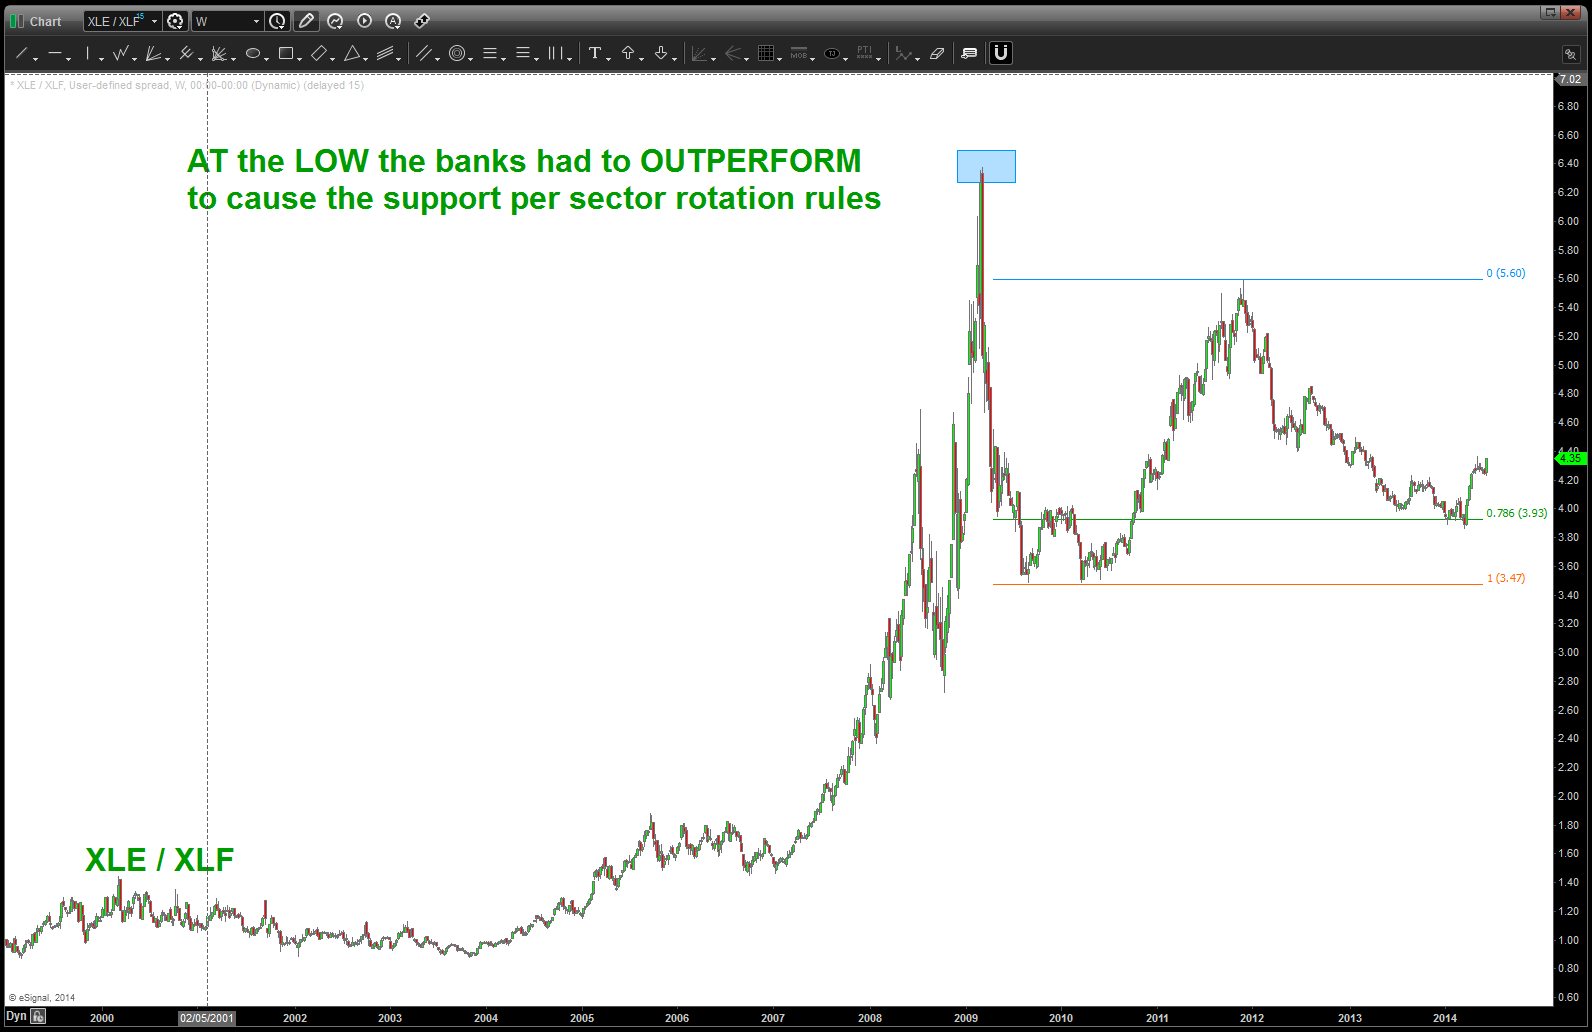
CLIFF NOTES: a picture does paint a thousand words. So there are some pictures below. I’ve included the chaos that was 2009 just to demonstrate that, guess what, at the lows in 2009 a BUY appeared on the XLF (Financials) and guess what … when I was Chief Technician for the When 2 Trade Group we put out a piece to BUY THE XLF. Did anyone in there right mind want to do that …? Of course not. Same reason why NOBODY in their right mind wants to sell out and miss any of the last couple percentages of this run.
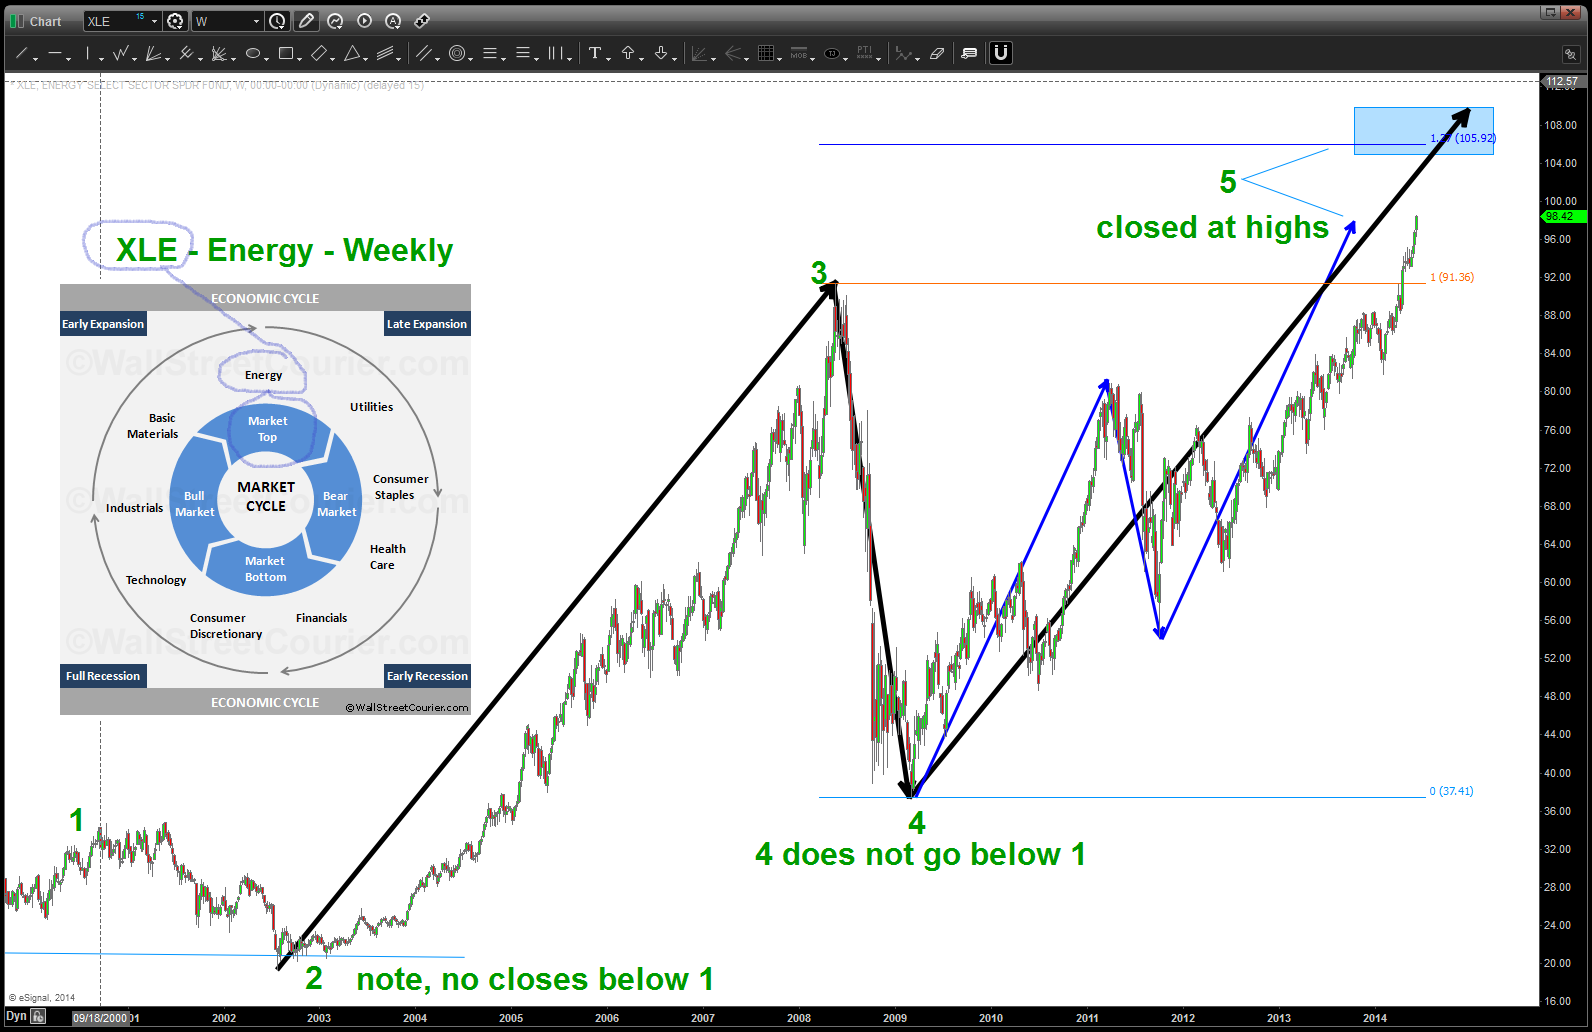
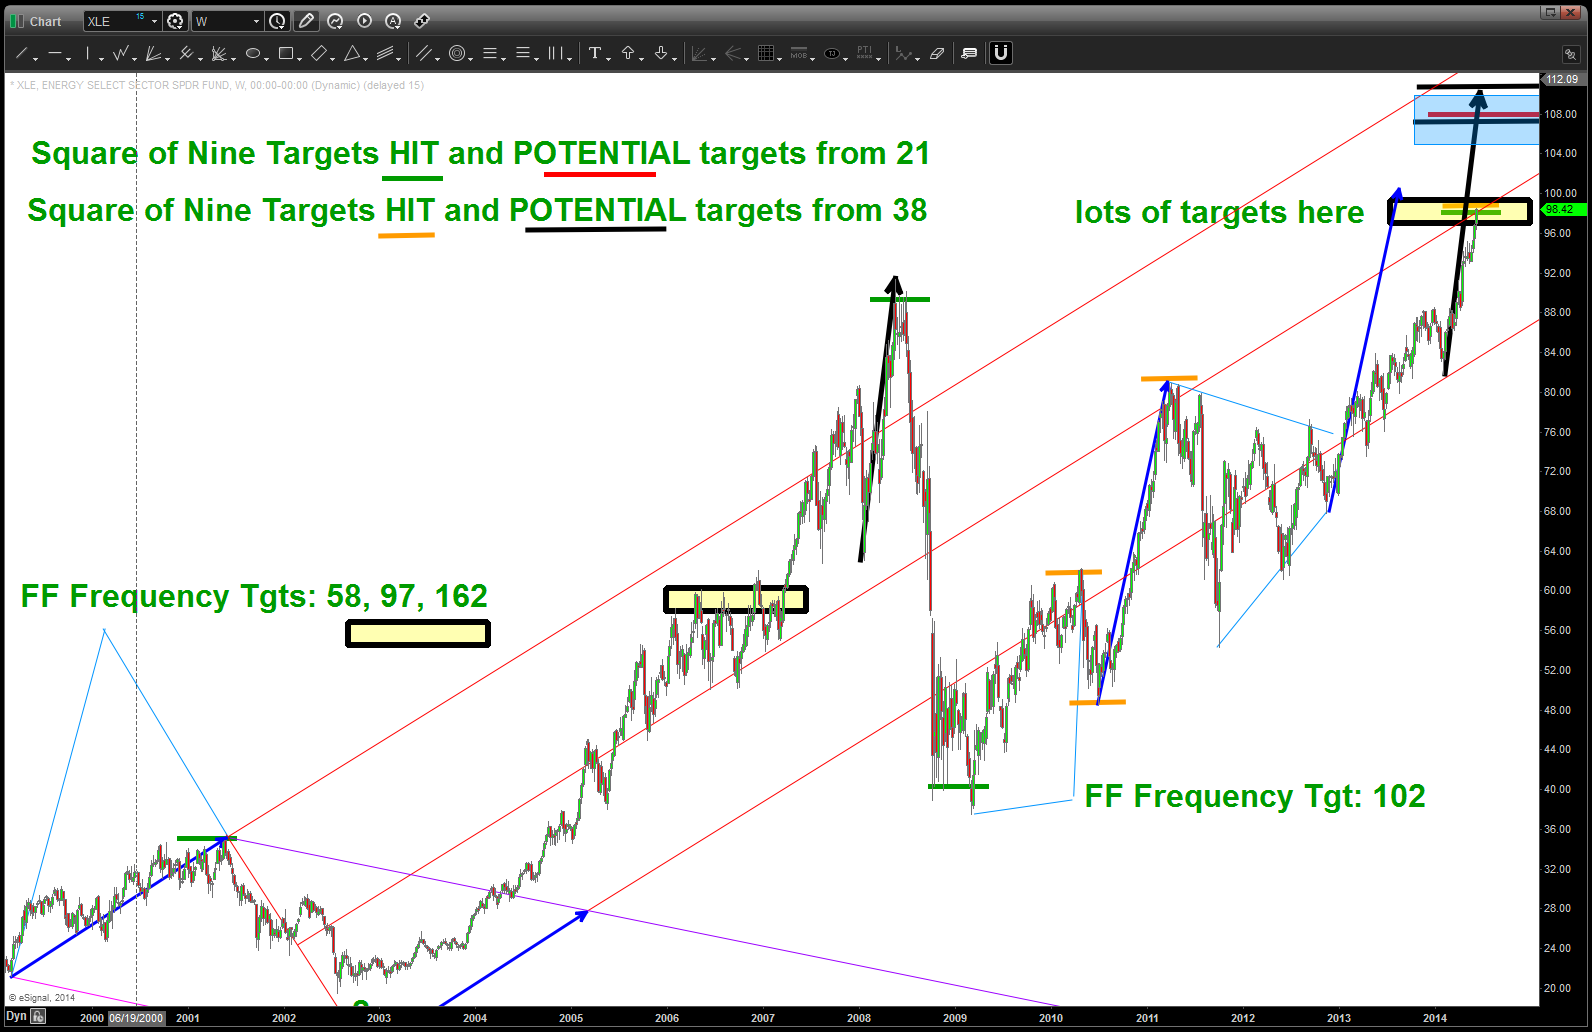
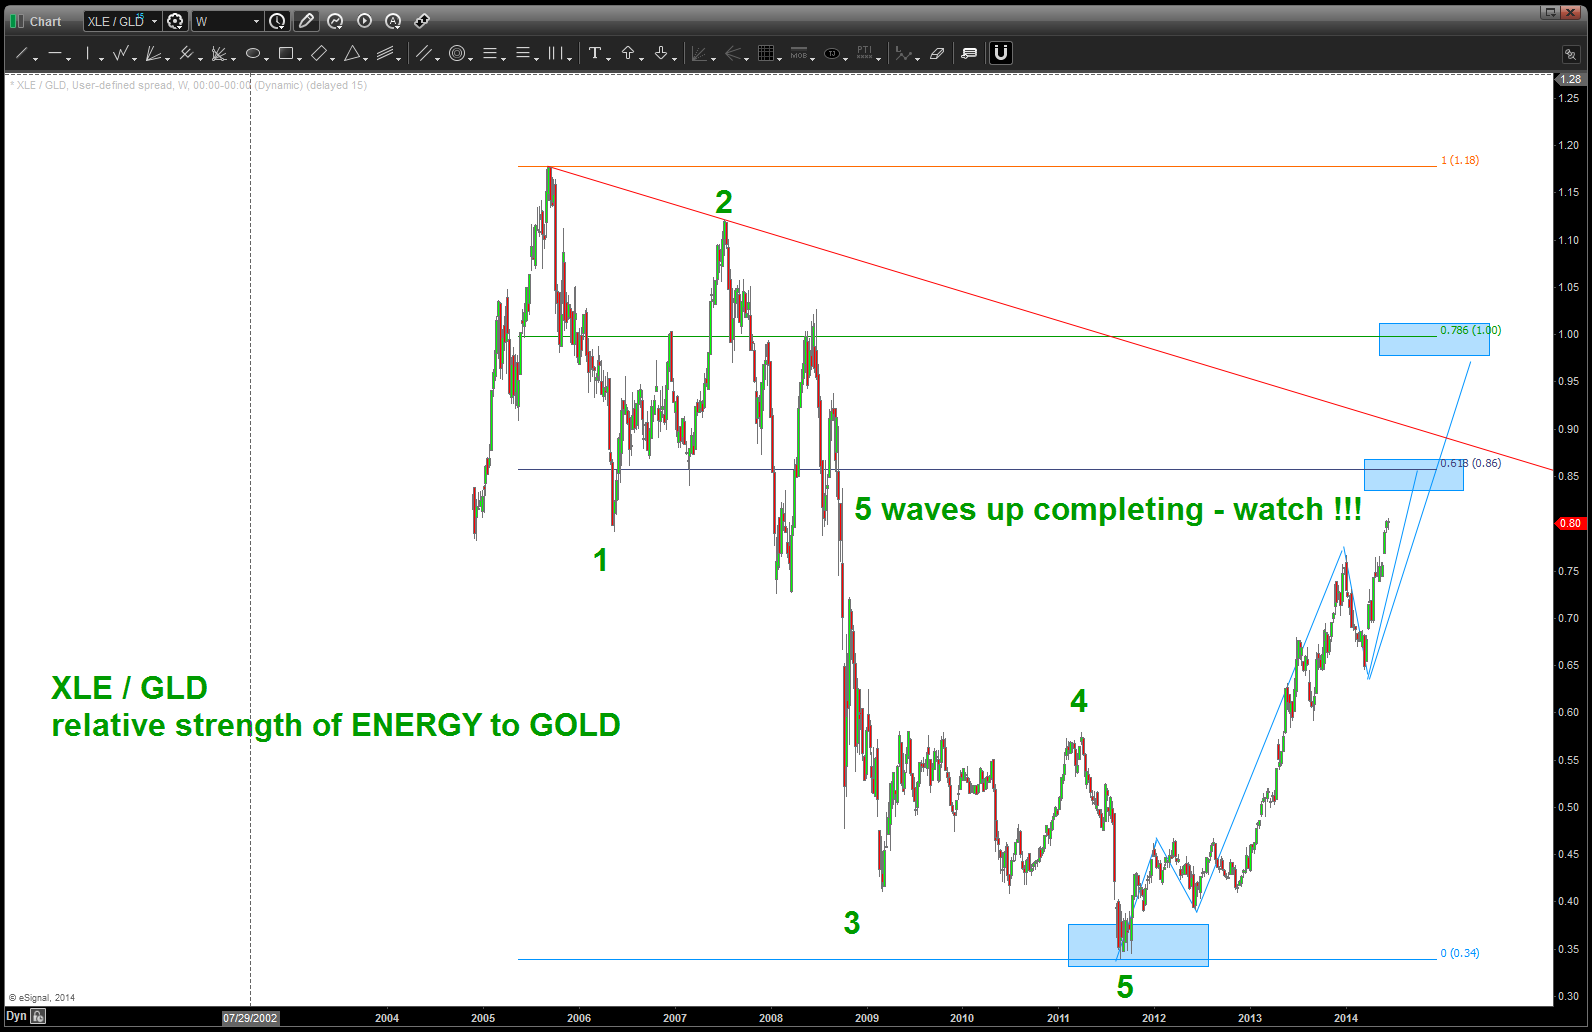
CLIFF NOTES 2: if you look at the count below, do realize that 2 does go below 1 a couple times BUT NEVER CLOSES BELOW. Folks, that’s good enough for me. Then we roll thru wave 3 not being the shortest and 4 not going below the end of 1 and all RULES are satisfied for this count. What’s that tell us? A good case can be made that we are in the 5th wave for the XLE. And, w/ the sentiment at RECORD HIGHS and the IRAQ situation and the blah blah this puppy has the potential to explode like a shake and bake handshake!

CLIFF NOTES 3: our minor target is hit in/around 97-98 and closed at the “high range” of the weekly candle. That usually denoted strength so we can “assume” the higher target in/around 105-110’s is in play. As far as patterns go … that one is a very nice LONG TERM pattern. If/when XLE does top it will signify the circle of life w/ regard to sector rotation is complete. WATCH THIS TARGET AREA.
CLIFF NOTES 4: go back and look at my “Swing Low, Sweet Chariot” post a couple weeks ago. Swing lows need to be broken before any bull should throw in the towel.
Enjoy the weekend and Happy Fathers Day out there to any fathers out there.
Bart
Here’s the XLF Recommendation. NOTE THE DATE! 😉
W2TG Tech Rating Chg XLF SB030309
Here’s the PATTERN and the picture as it appeared on March 03, 2009. Note, the CLOSE was 6.18. (.618 for any of those Fibonacci challenged)
XLF and the importance of sector rotation.
here is the picture now, note where XLE (Energy) sits in the sector rotation model:
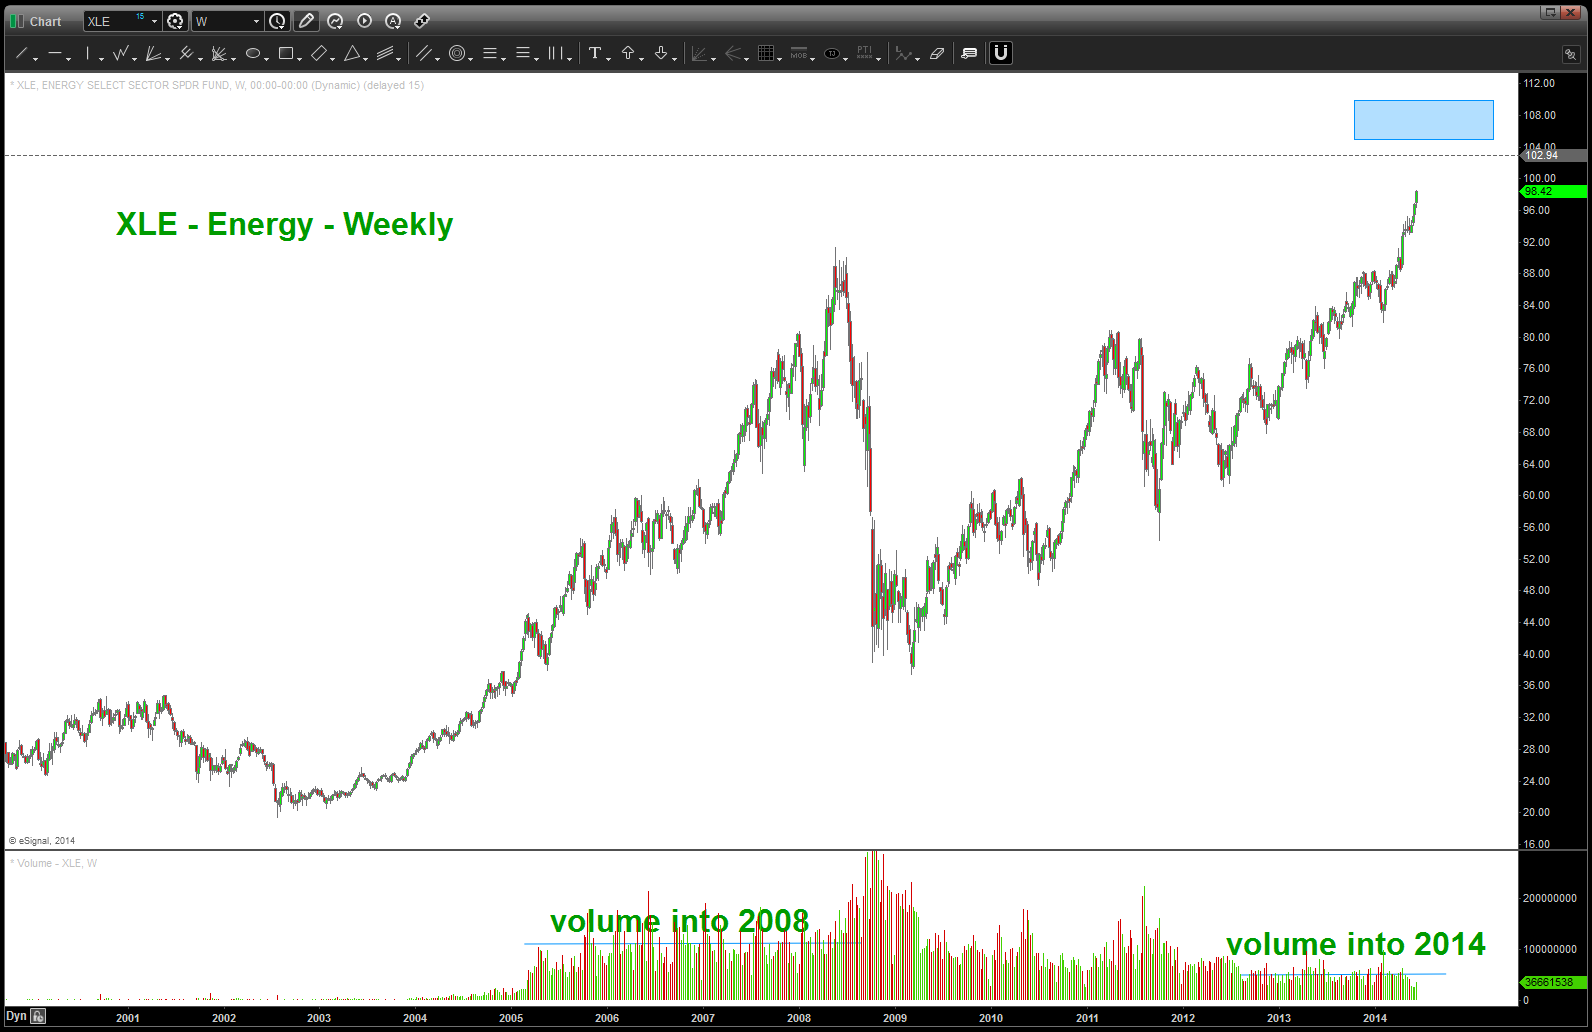
some more chart work on XLE, key here is notice the volume below is significantly lower than the march into the highs in 07-08.
here is our good old RSI ..a work horse in any technicians tool kit. NOTE – and this is probably our biggest “hint” of things to come – NO TOP IN THE XLE HAS BEEN MADE SINCE IT’S INCEPTION W/OUT THE PRESENCE OF BEARISH DIVERGENCE. Does that mean one of our targets can’t get hit and it falls like a stone. NO. But the PROBABILITY is in our favor that the XLE will hit a target, back off and drive the RSI off it’s highs THEN price will go up and seek a new high and the RSI will fail to make a higher high and THEN we can look for major inflections. Also note – in 2008 it took 8 weeks for the XLE to top and finally crack. In today’s day and age of texting, twitter, digital addiction can you sit on a position and get chopped up for 2 months waiting? Probably not …
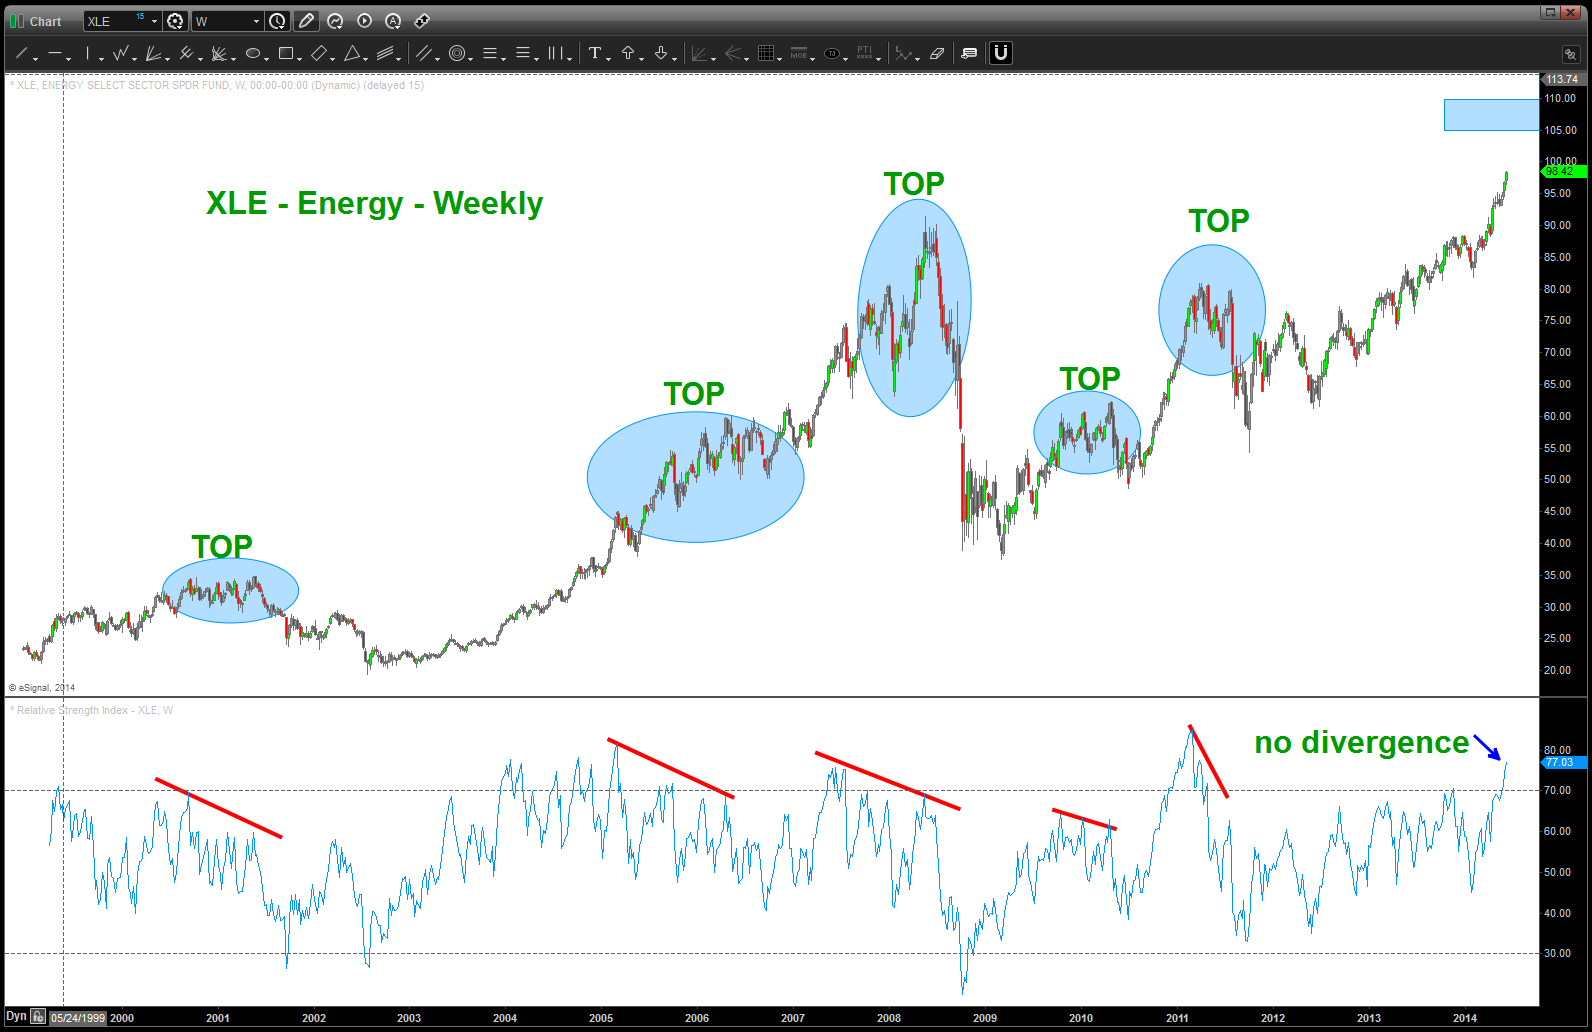
RSI on XLE – note divergence is usually present at inflection points
BE PATIENT … full disclosure I have been waiting over a YEAR to short the EURO. Just my style and I know once I jump into the cage w/ the gorilla’s juggling dynamite the die is cast, so to speak.
My former business partner and friend told me his grandfather offered sage advice …
“in this game, you need to just SEE and FEEL that there is money in the corner and you just go and pick it up.”
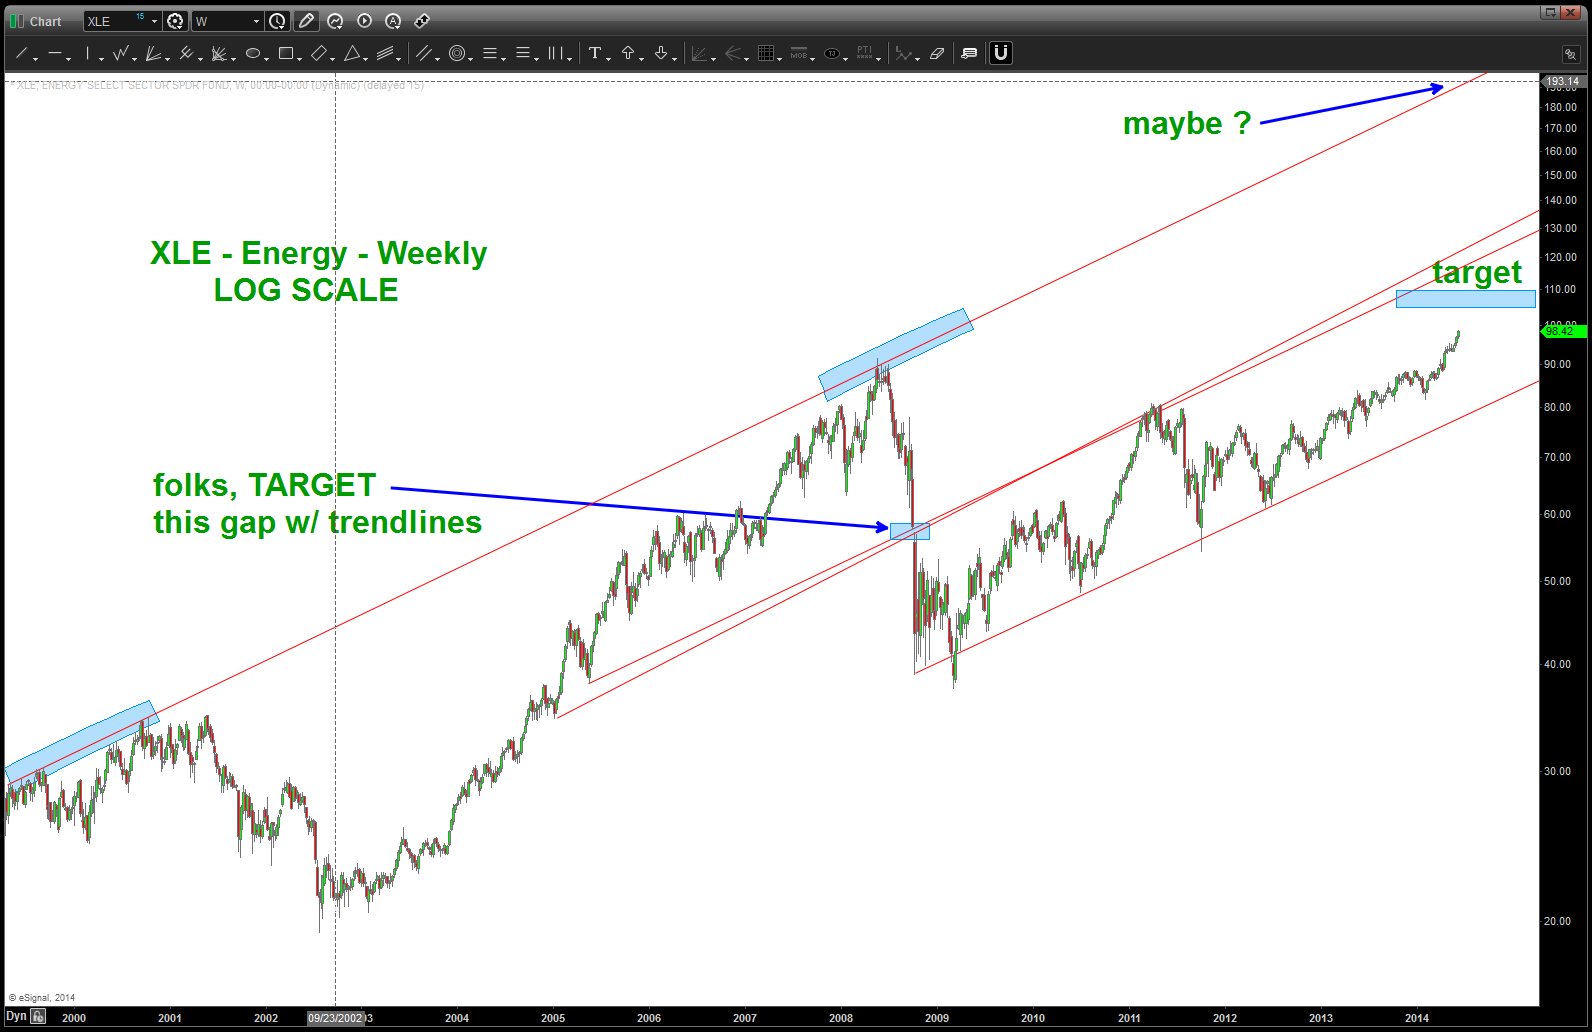
XLE LOG SCALE
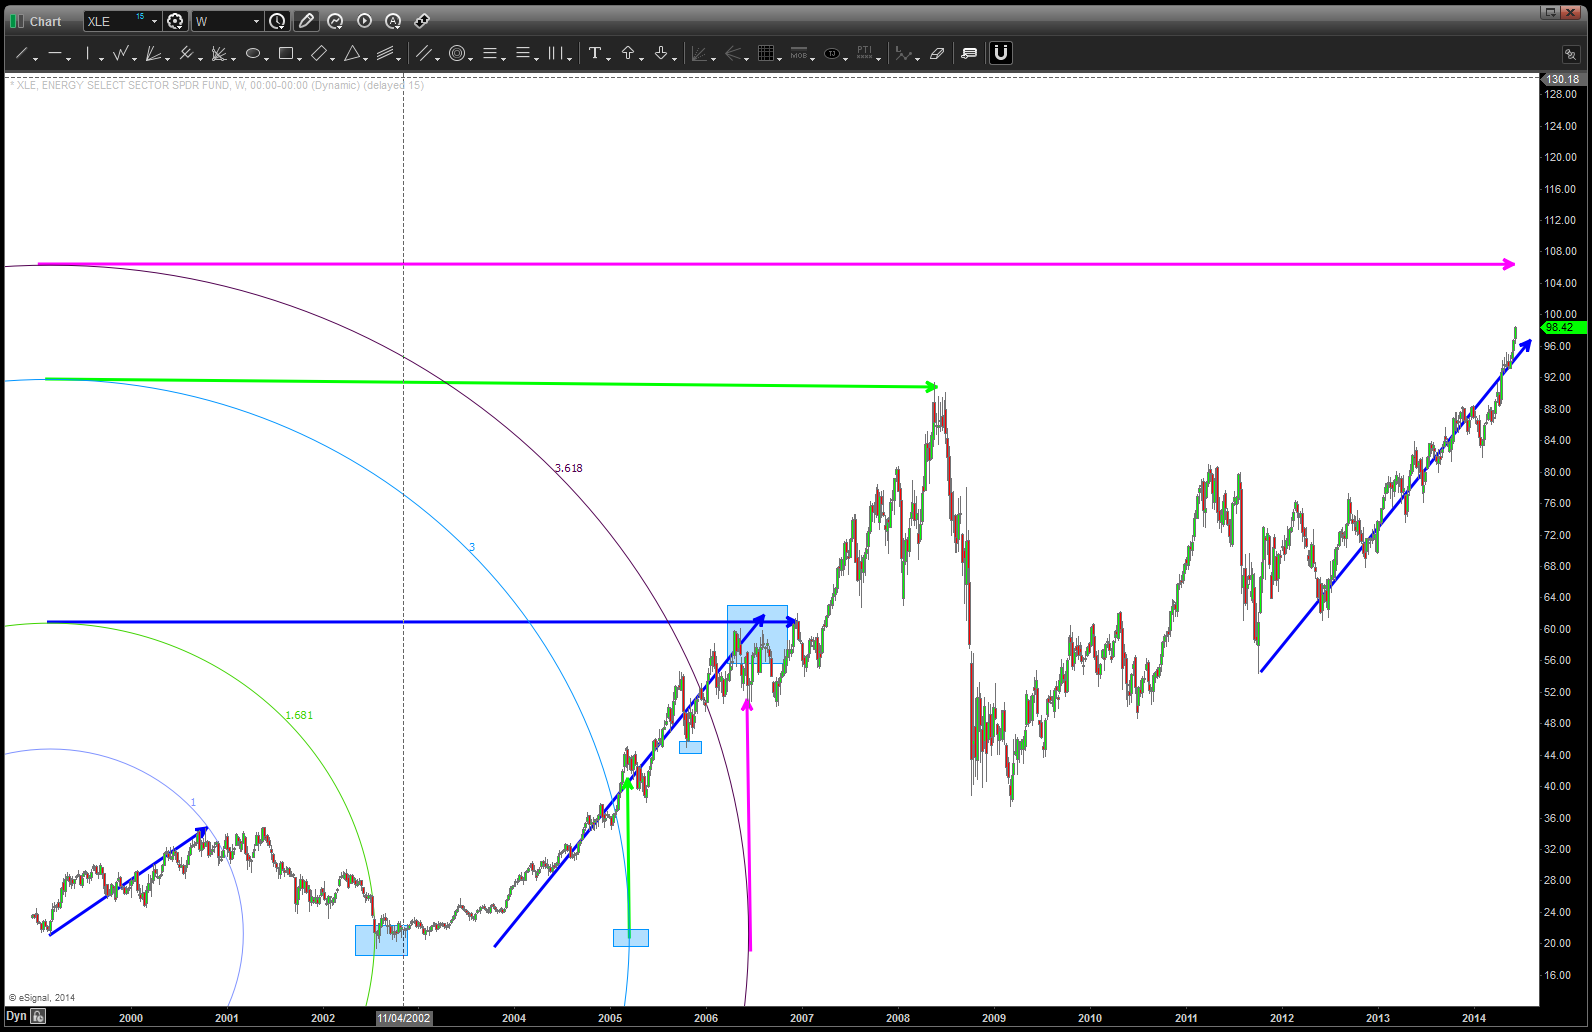
Here is a “quick look” at the trend lines and rhythm of this security. Note, the key to the entire thing is the first impulse move UP from the low. Use that to set the geometry.
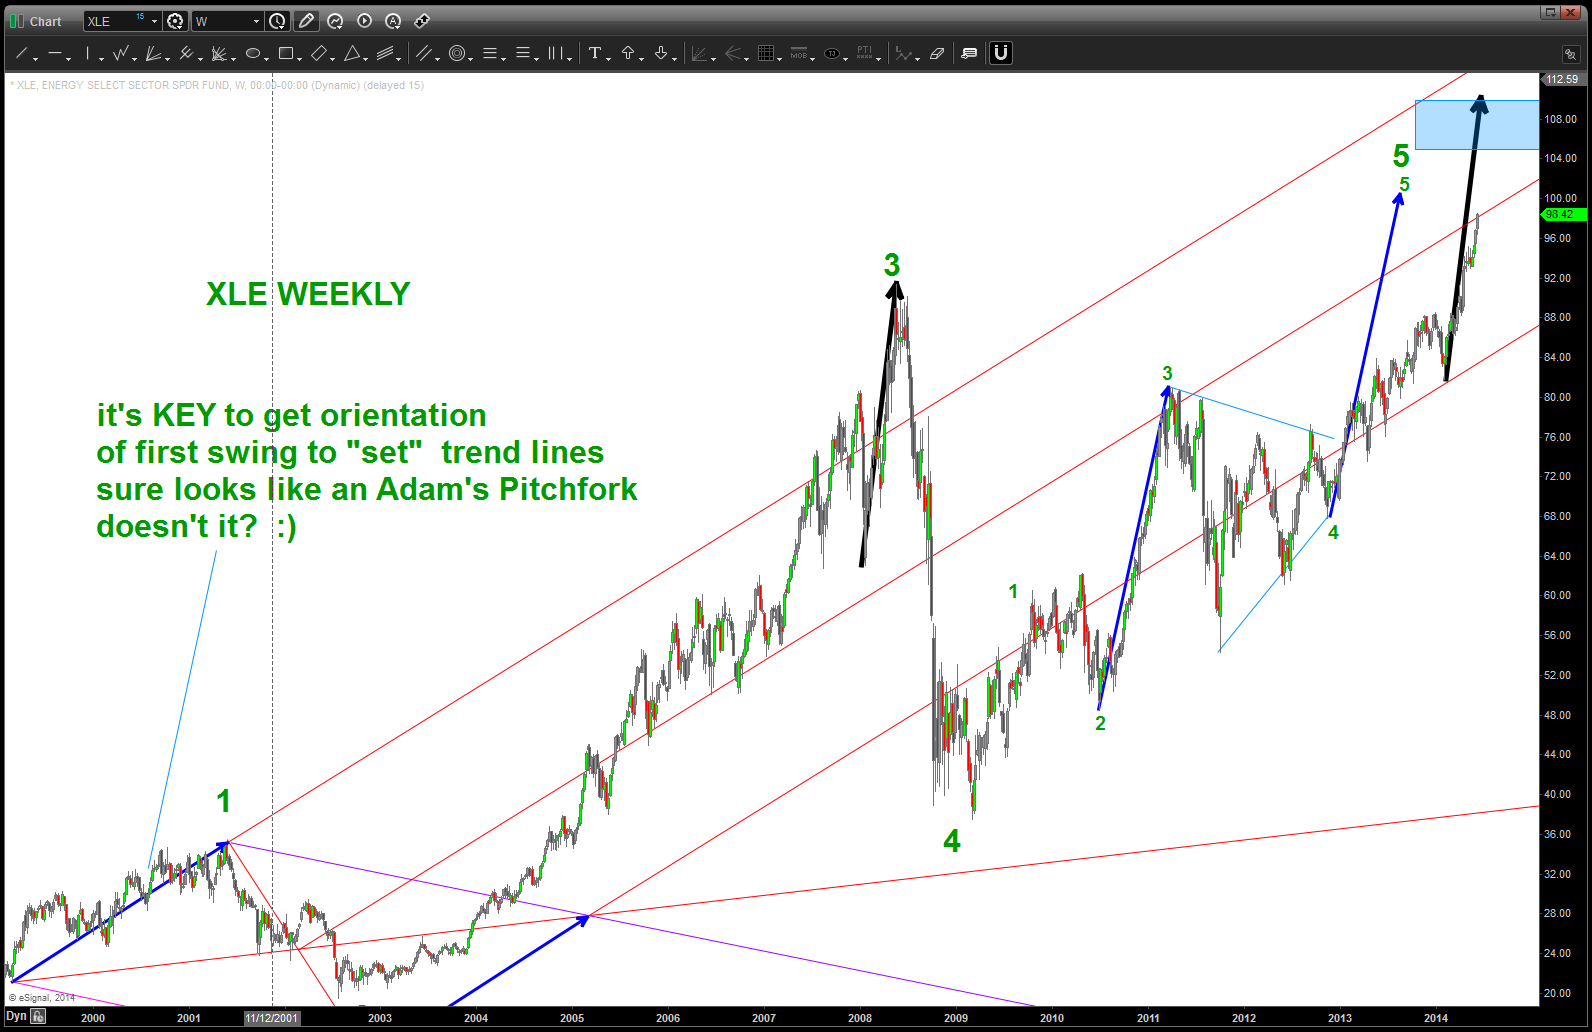
XLE GEOMETRICAL trend lines
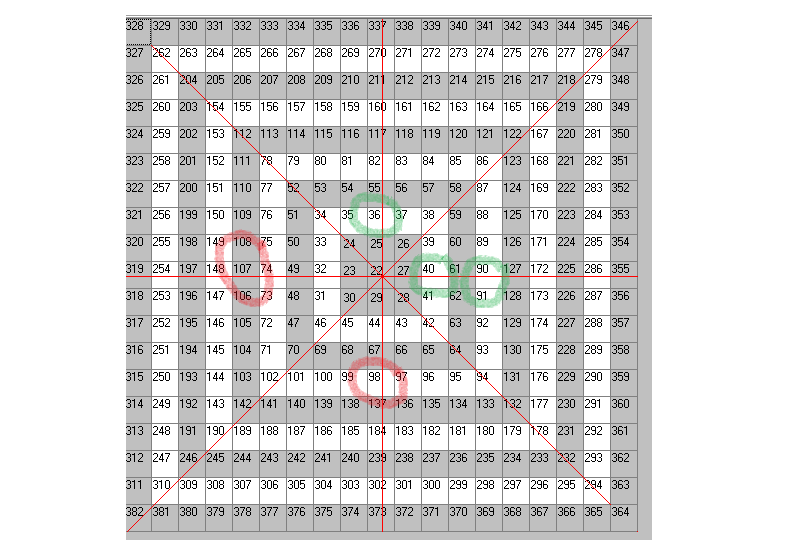
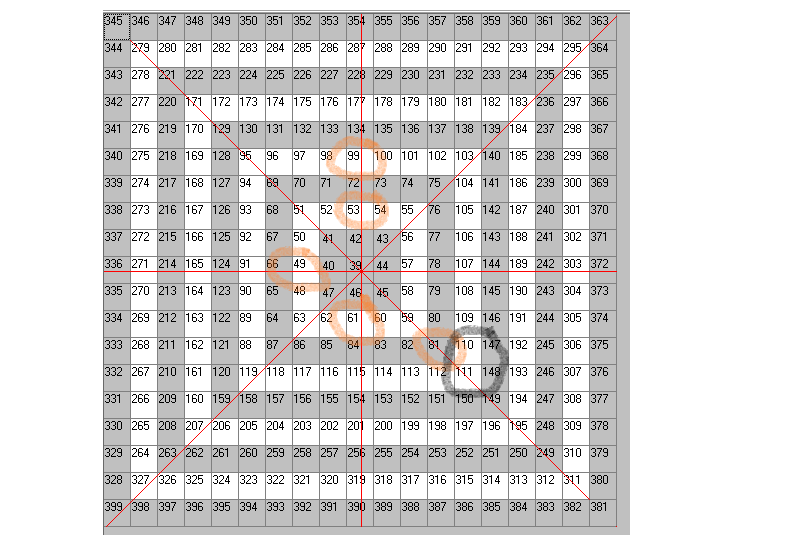
here are some more targets being generated … note the placement of the LOWS in the CENTER of the square.
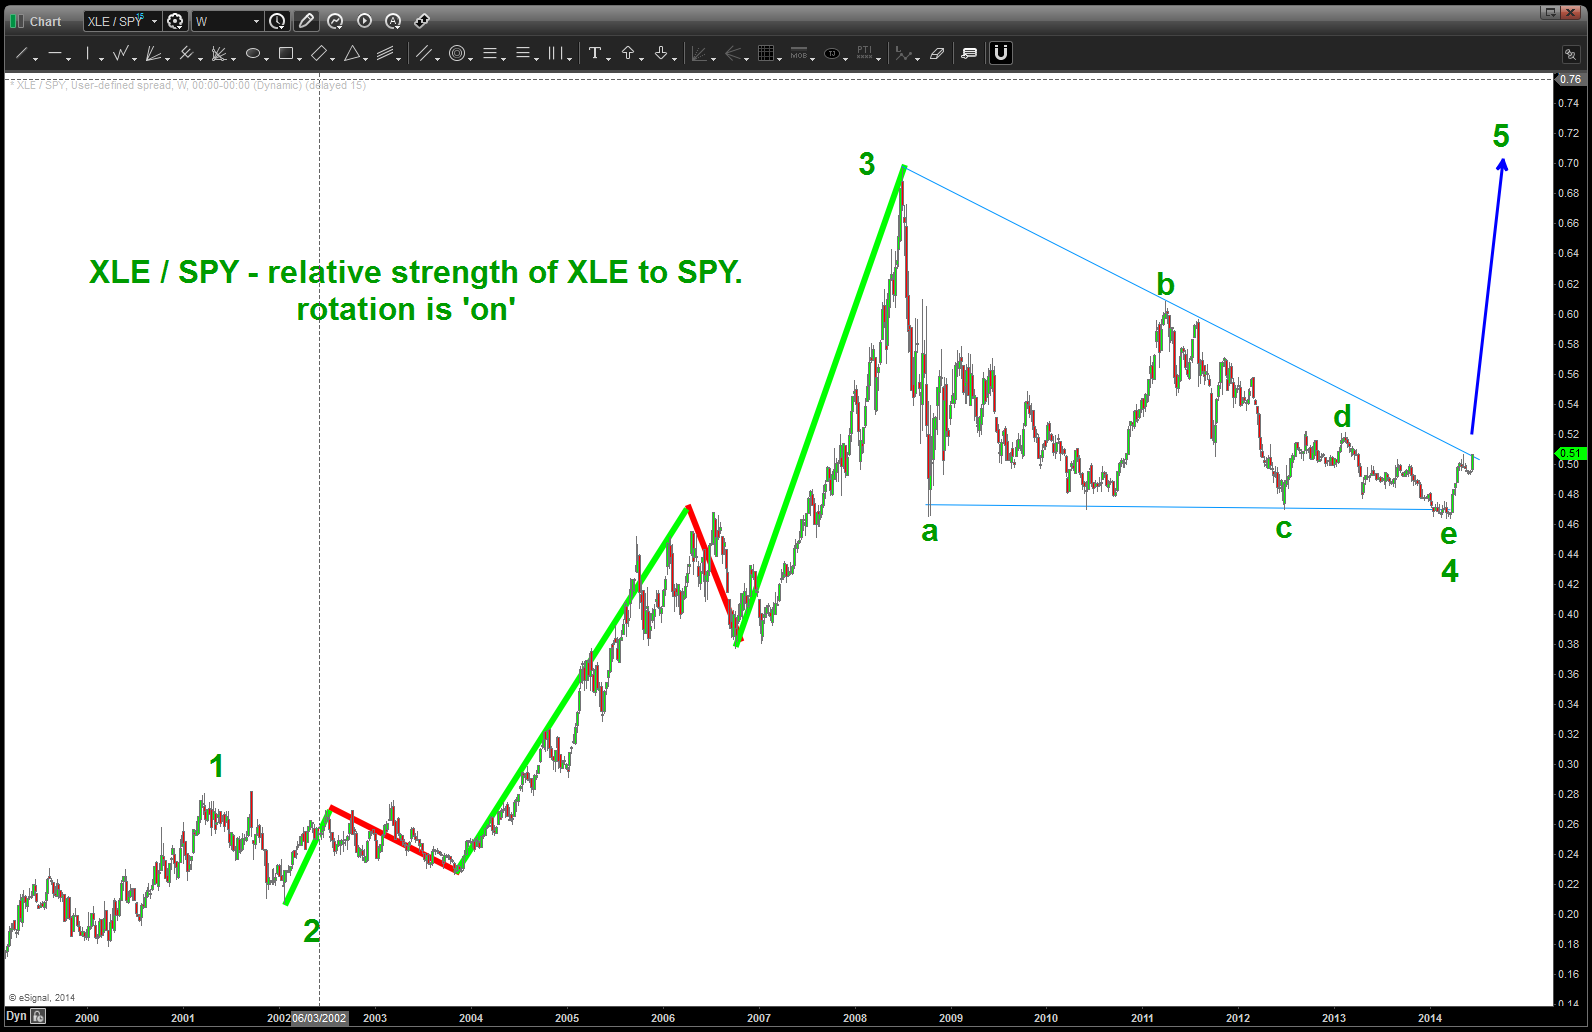
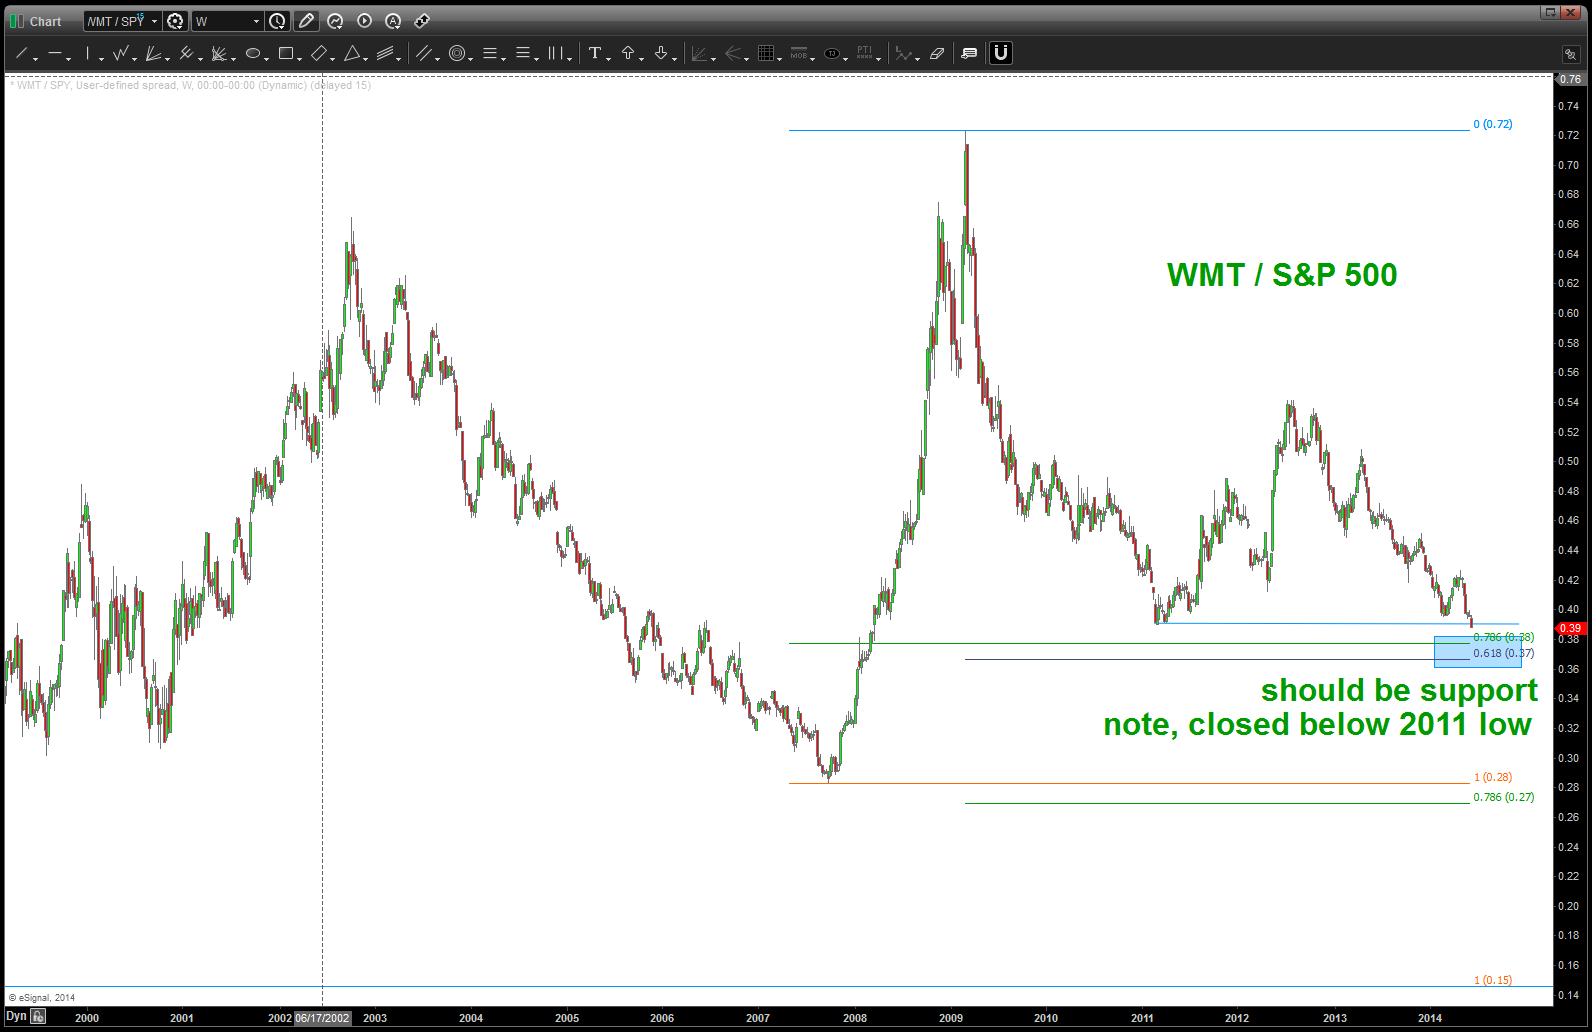
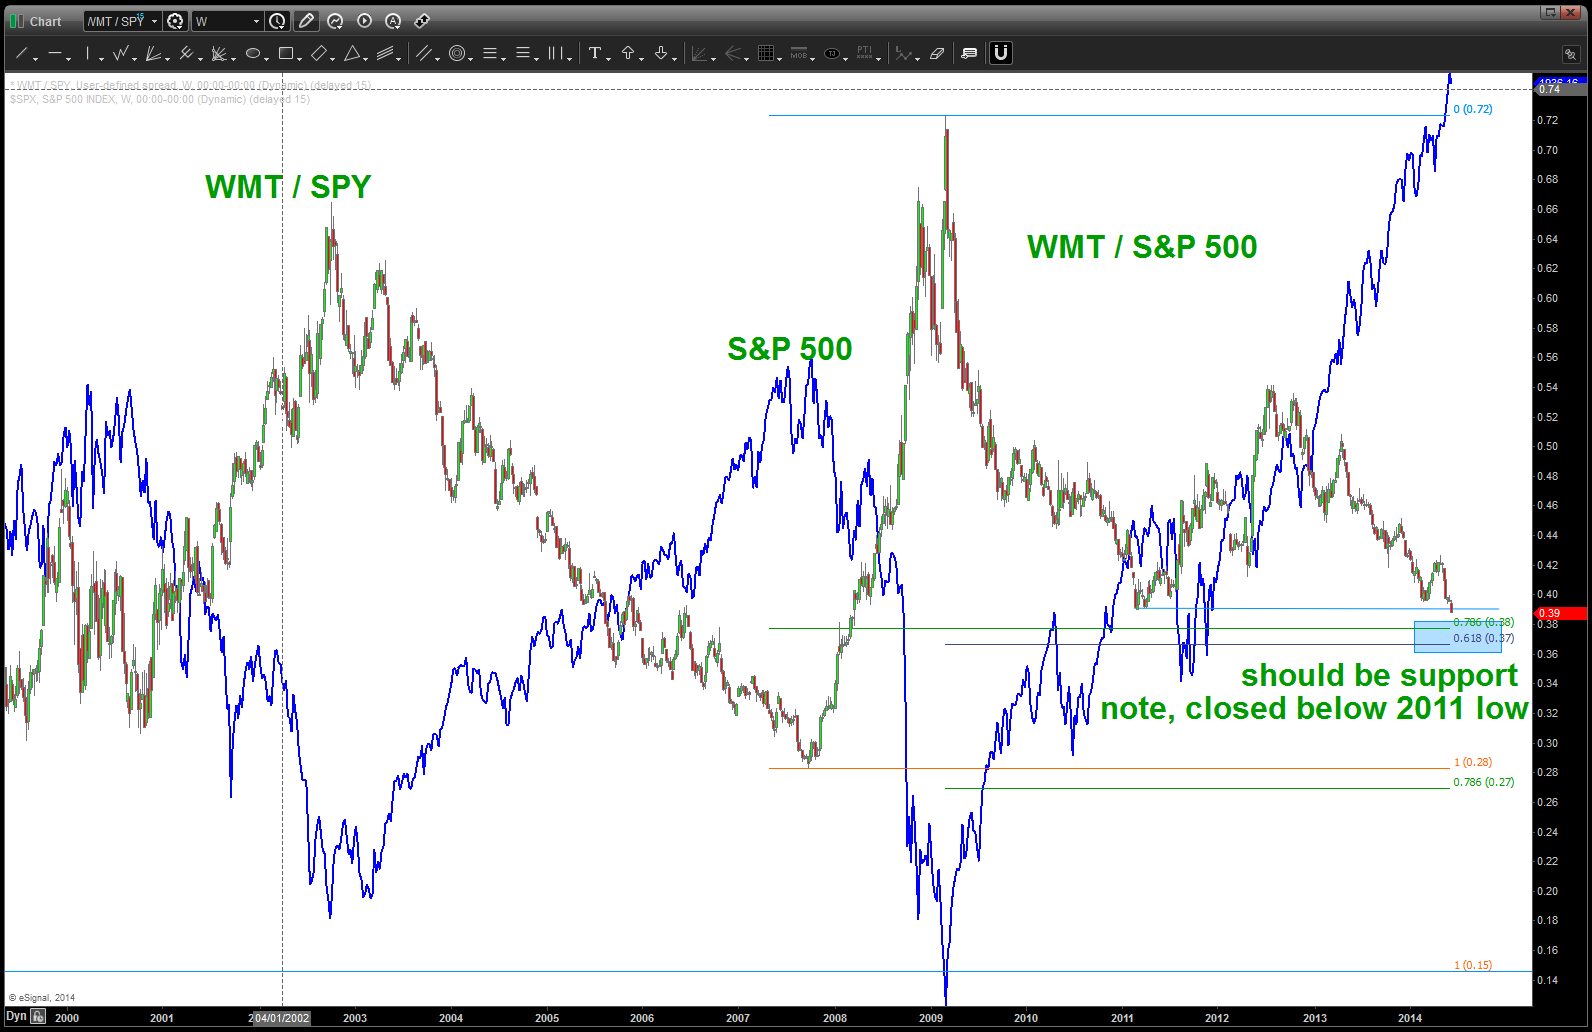
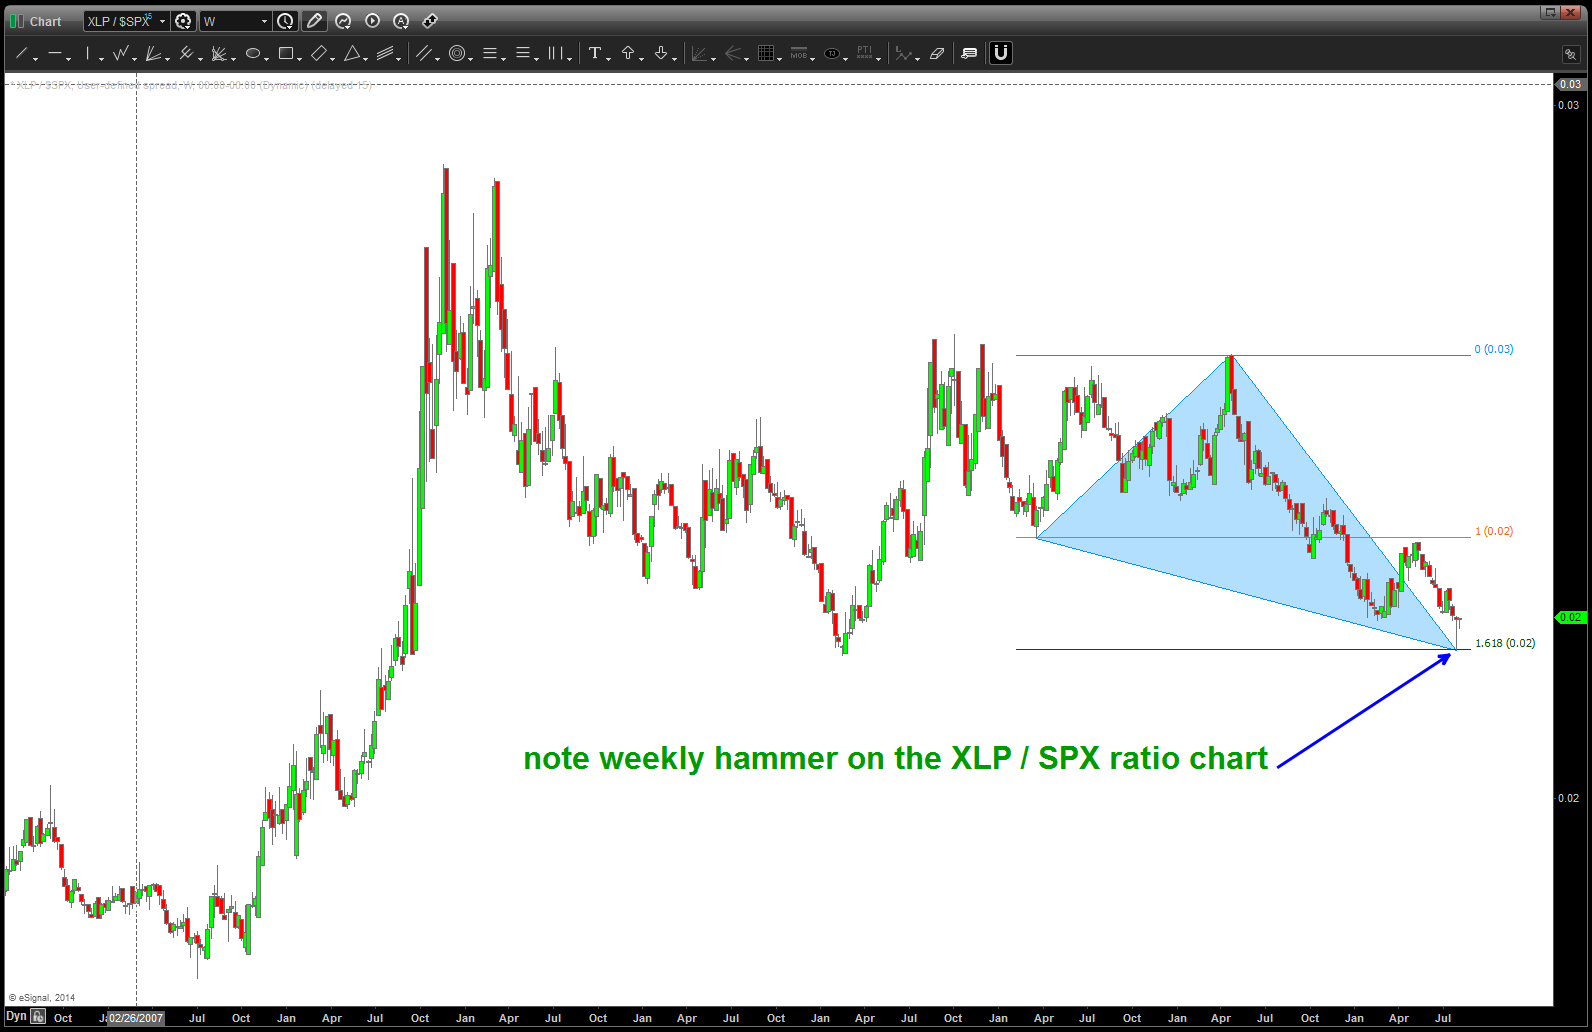
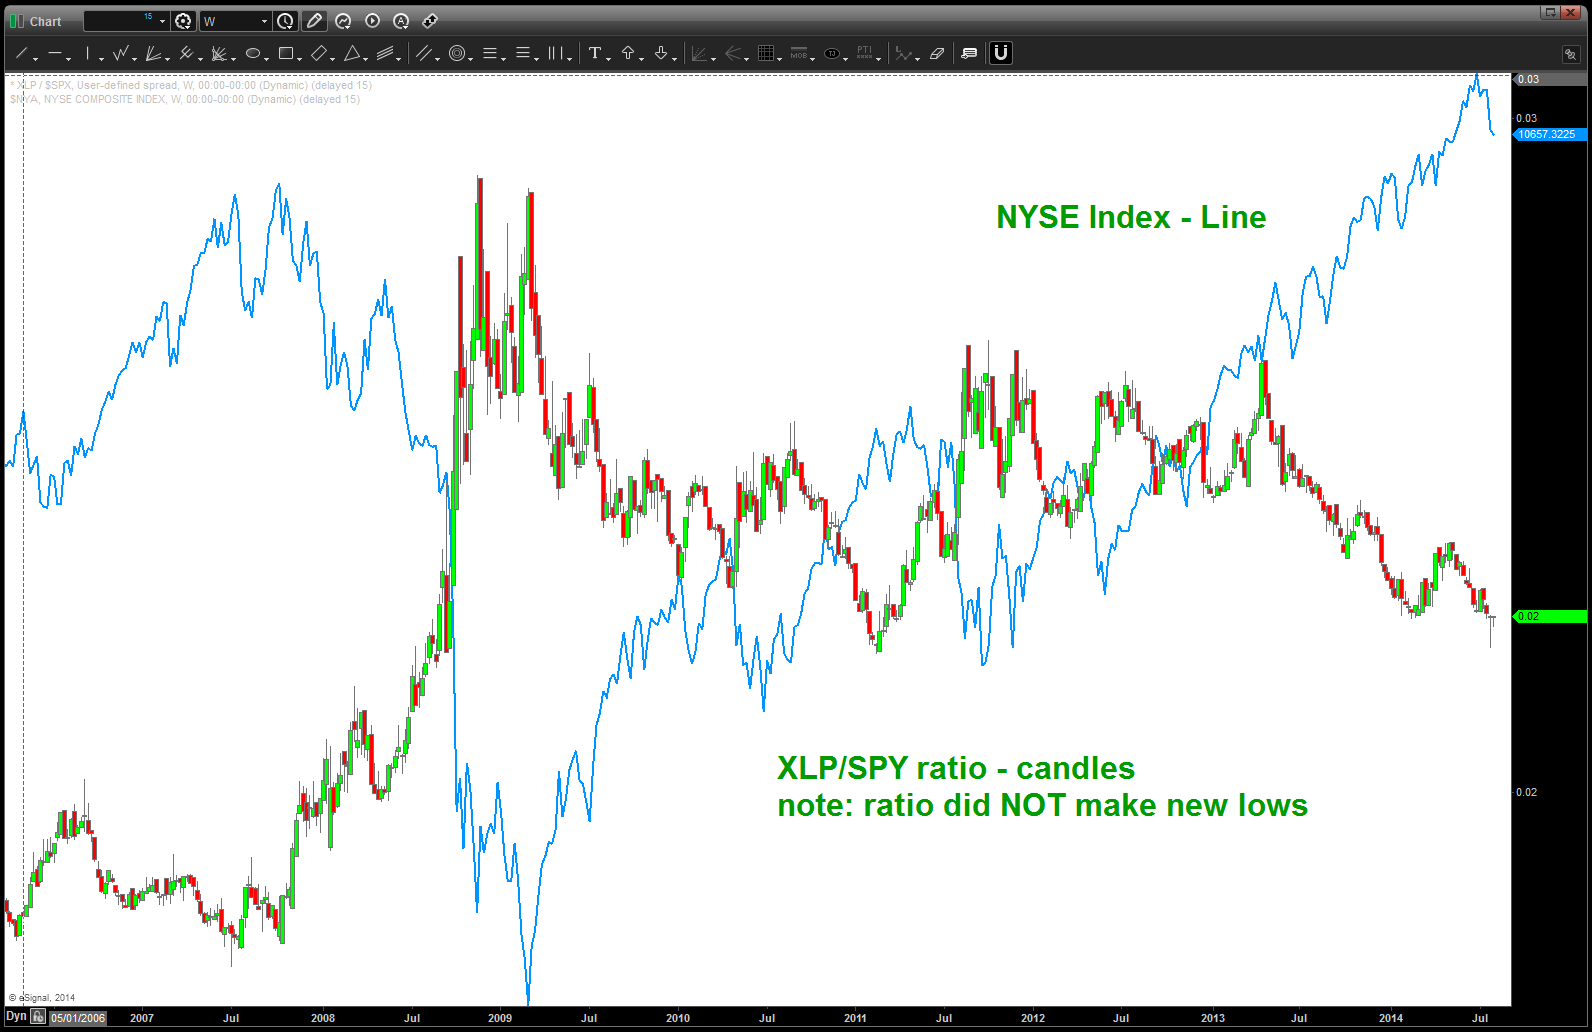
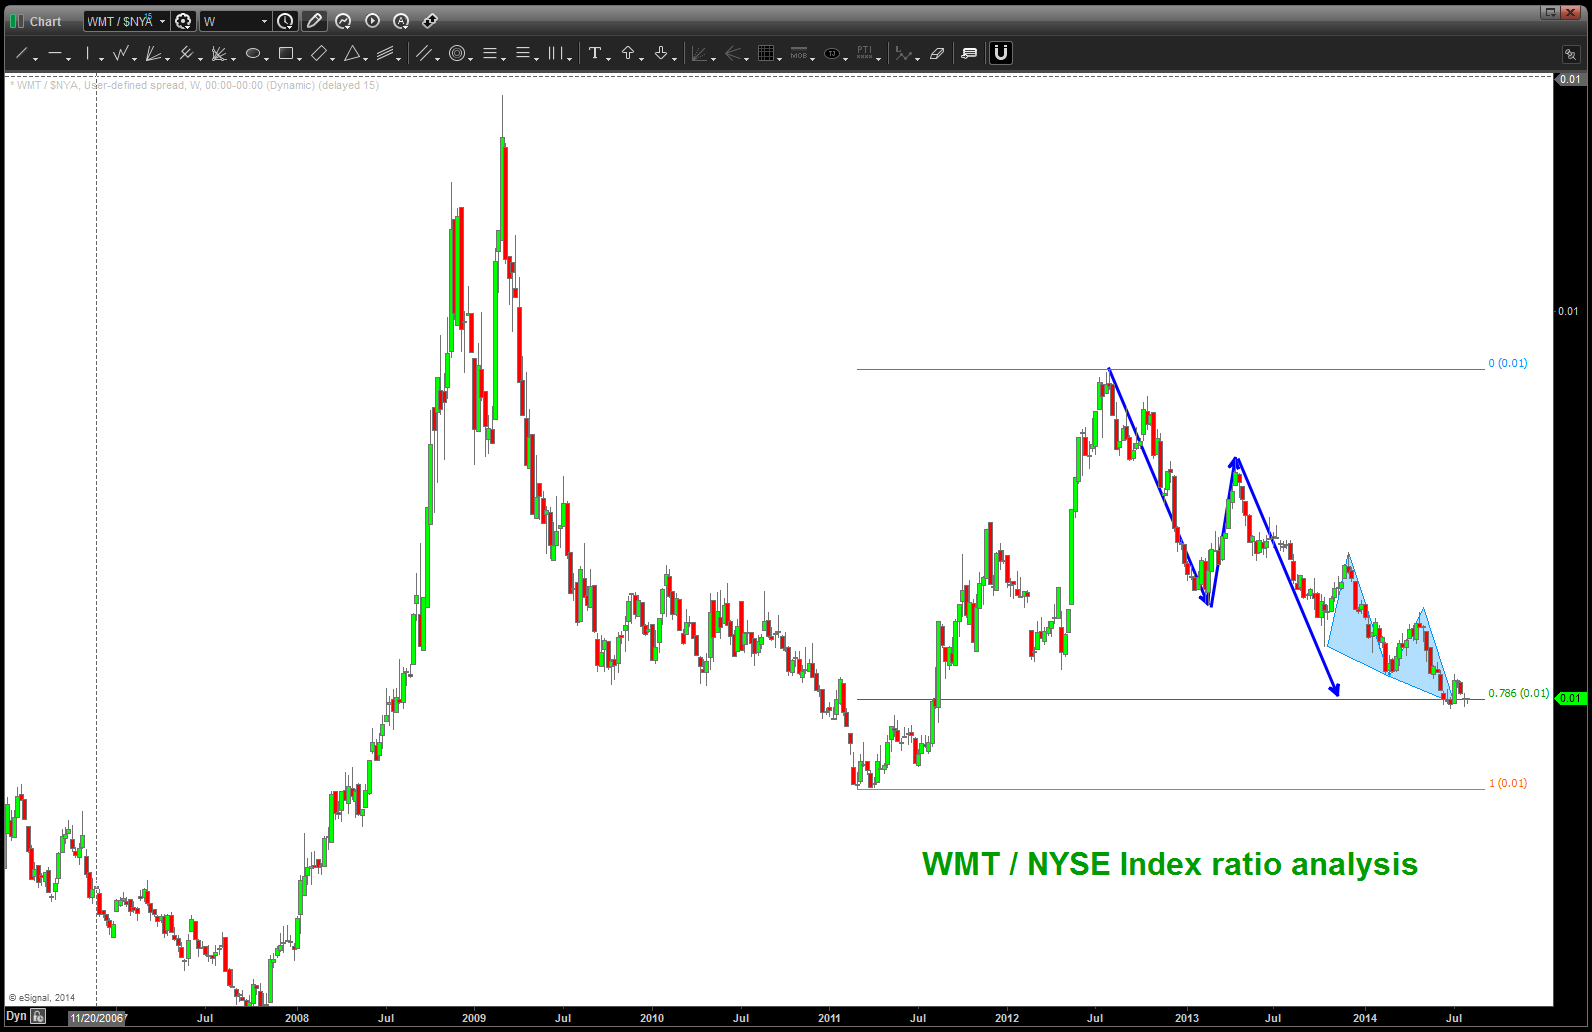
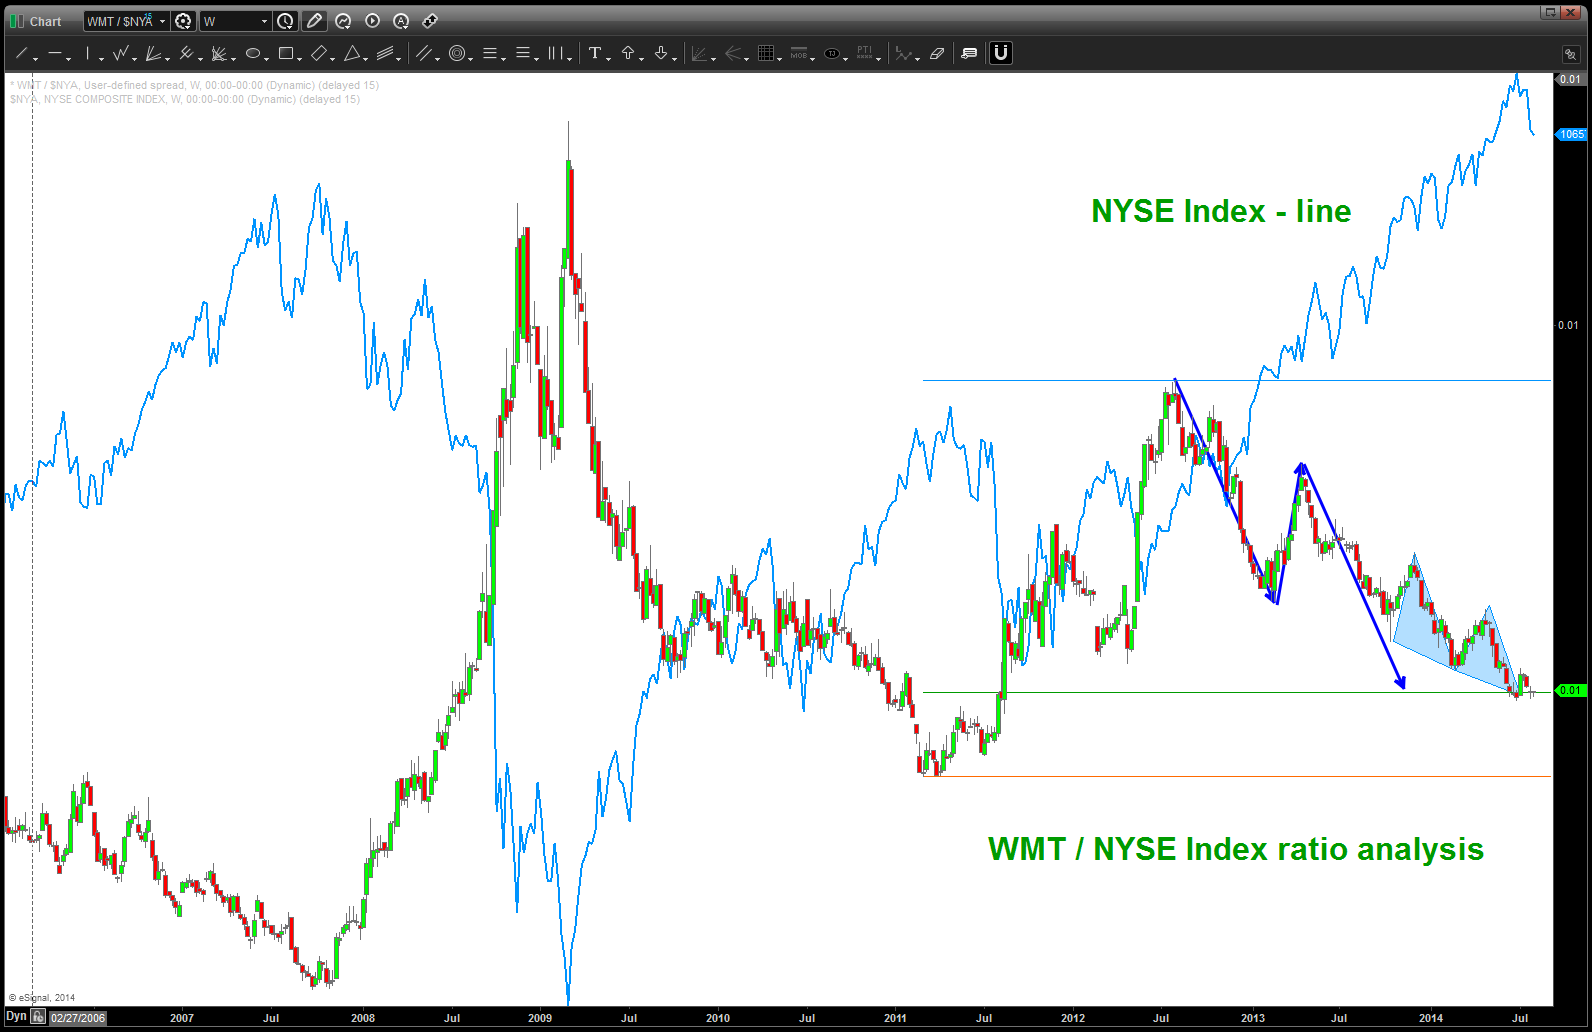
Ratio patterns holding …
Posted on August 5, 2014 Leave a Comment
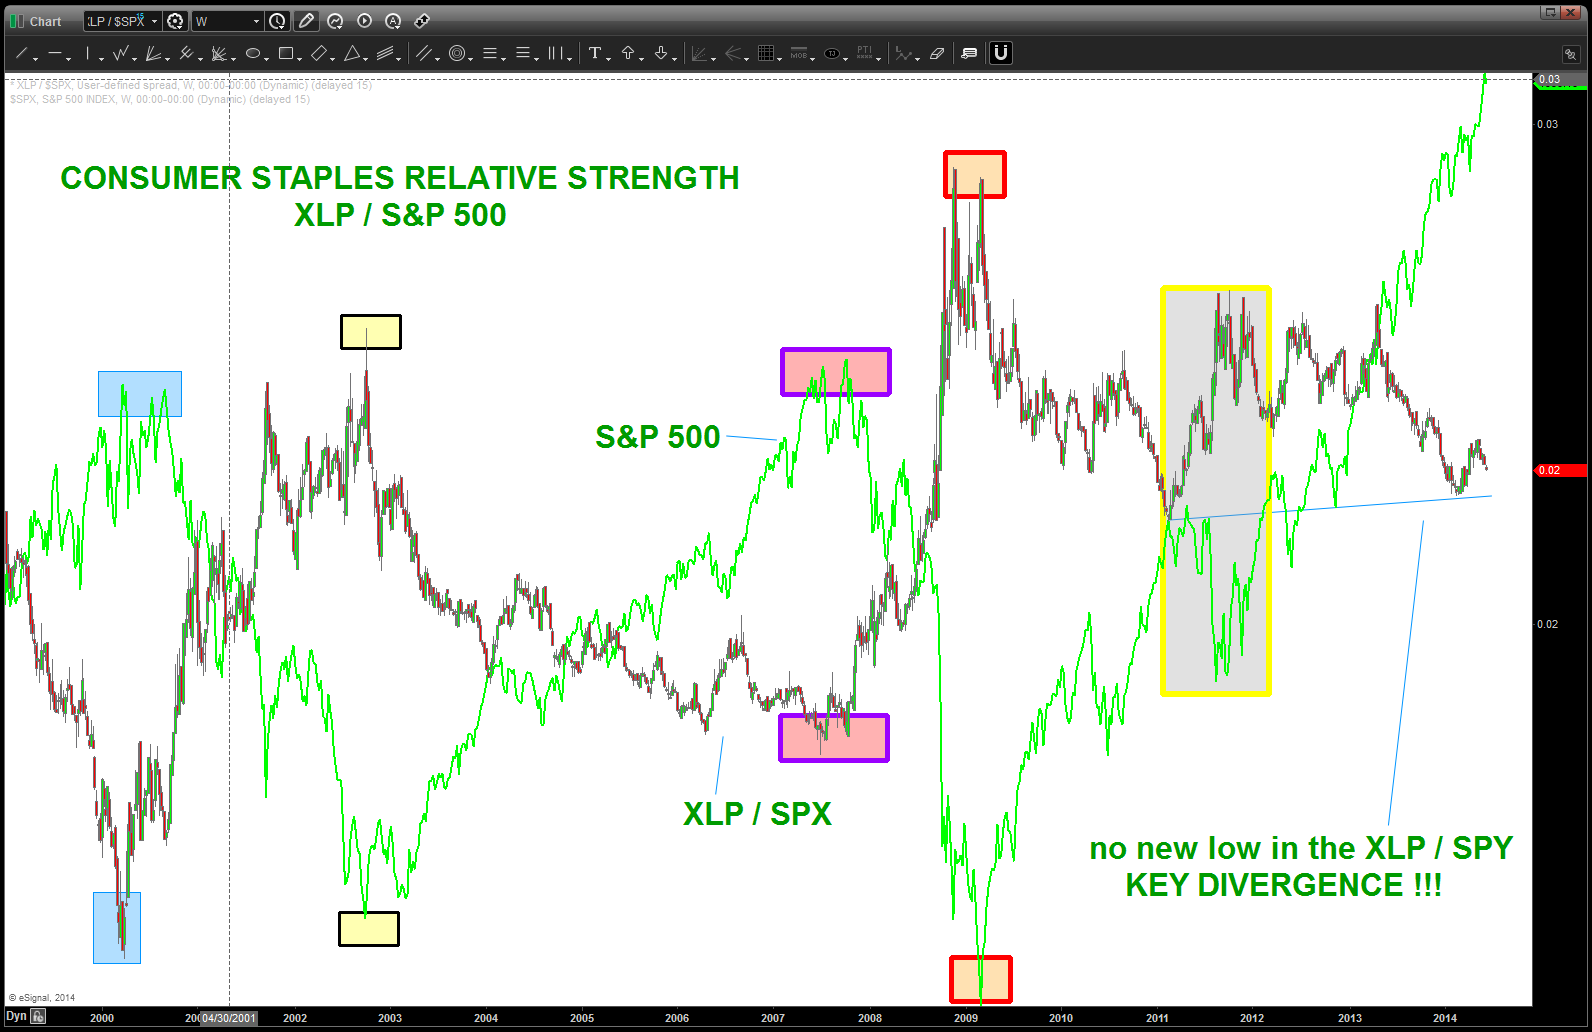
CLIFF NOTES: we’ve shown the sector rotation being shown by ratio analysis before. we’ve also shown how every major inflection (up and down) has been due to the ratio’s bottoming or topping. we’ve also shown how patterns have failed to hold and have confirmed the move higher in stocks the past few months …well, for now they are holding support. I ask that you go back and revisit my swing low post – it’s all about the swing low in the next couple days. go here: https://bartscharts.com/2014/03/16/swing-low-sweet-chariot/
POUND parabolic DOWN … look for a BUY
Posted on August 3, 2014 Leave a Comment
CLIFF NOTES: in the past posts we have shown parabolic arcs UP and now, w/in the context of the intra-day world we have a culminating/parabolic move DOWN into the .786 and/or the .866 region. (hint hint – the POUND likes the .886) When we reach this parabolic structure to the downside it’s “usually” the limit of the downside…expecting a 3 leg correction from levels shown in the blue box.
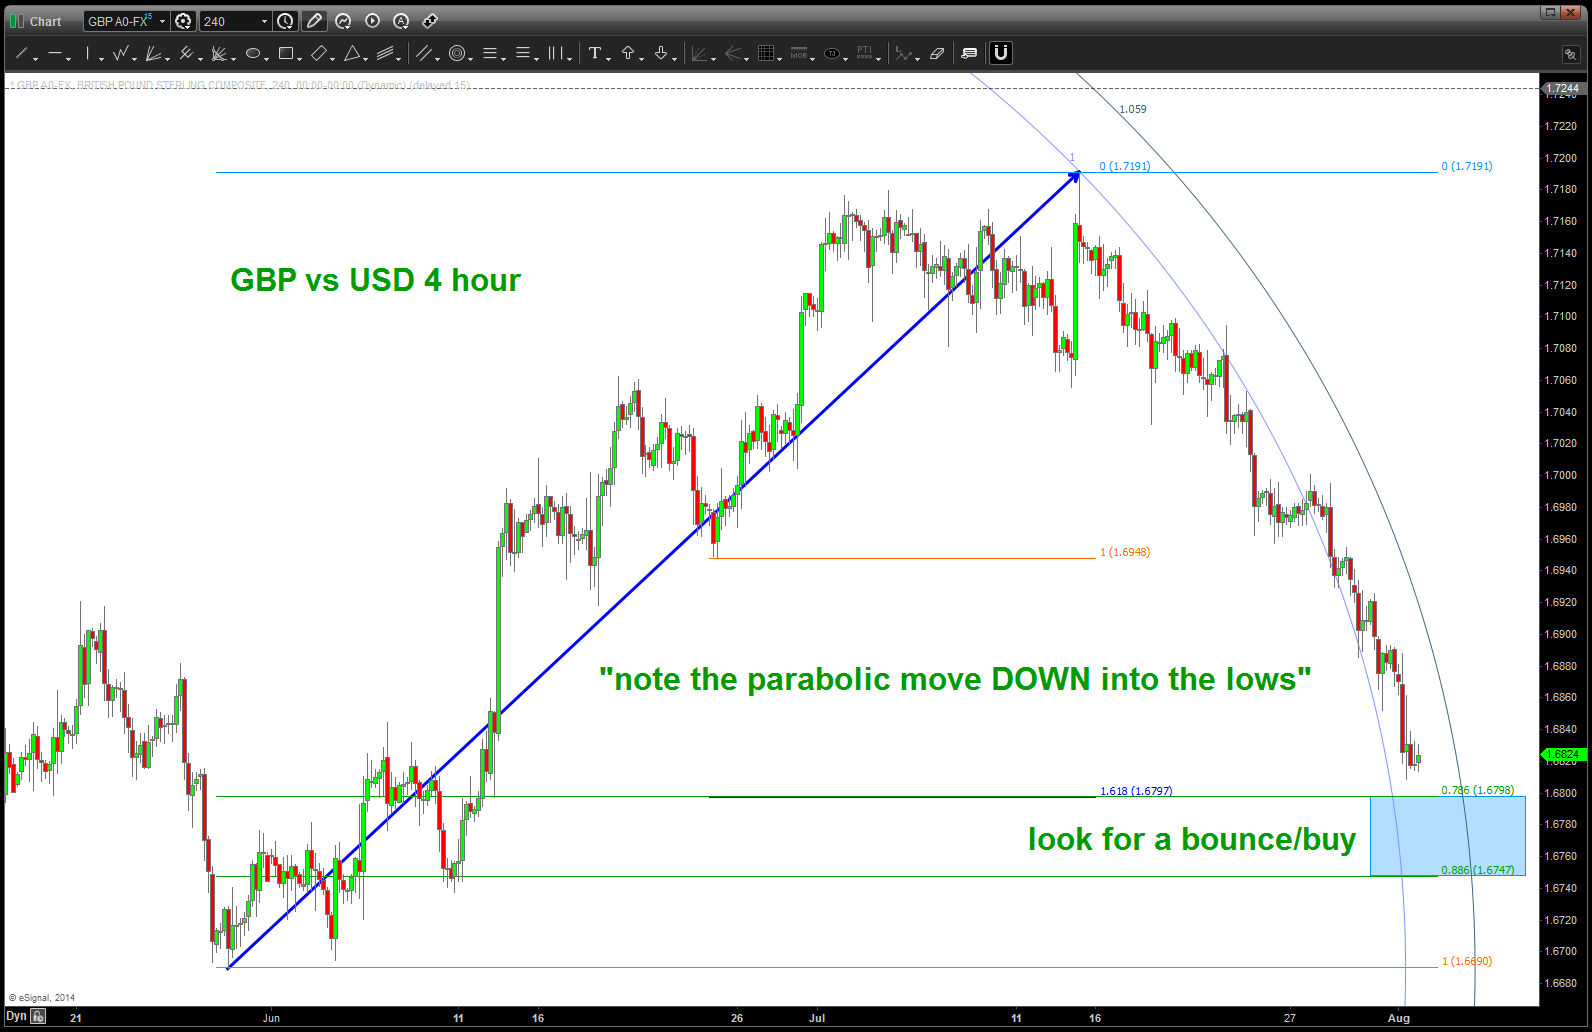
POUND acceleration down has hit the “terminal” point so expect a bounce
also, not that it matters, I do find it interesting that 710 hours ago we were in/around the top area at the 1.7180’s …(hint hint: 710/656 hours are moon cycles)
NAT GAS set up
Posted on August 2, 2014 Leave a Comment

NAT GAS set up – watch for the retracement levels shown
