USD vs JPY redux
folks, I’ll say it once, I’ll say it again … PATTERNS PATTERNS PATTERNS. Check out this post on the JPY and then compare everything that has happened … they help you manage risk and therefore they work:
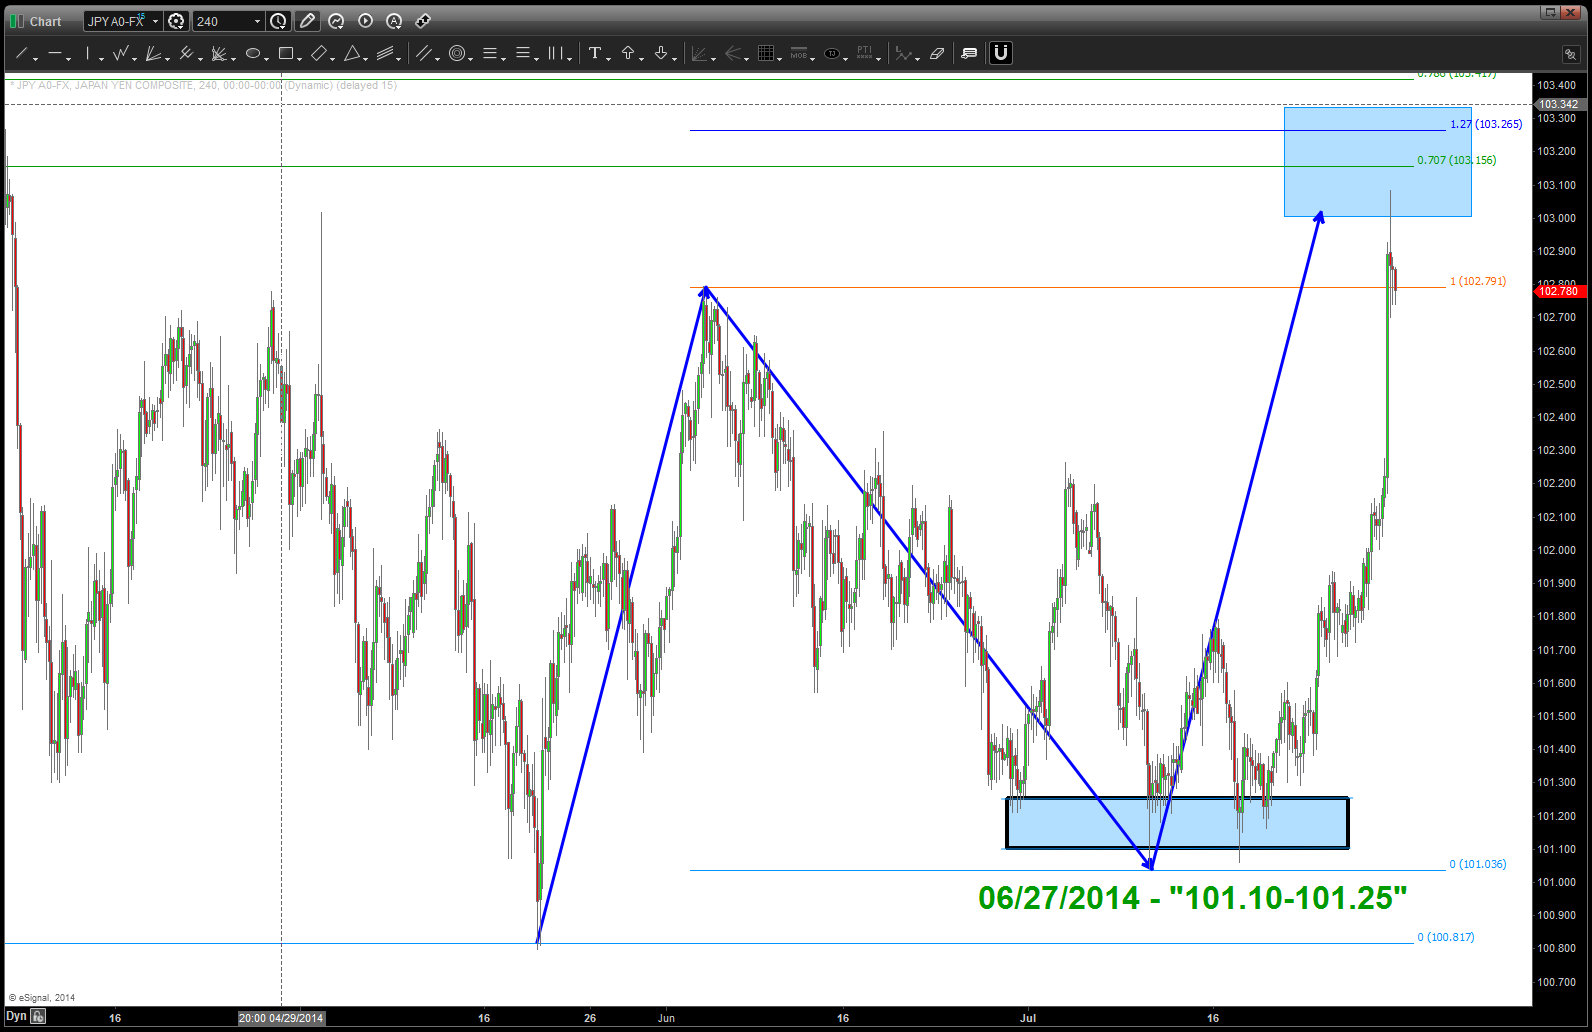
so, where are we now? let’s take a peak. first chart is actually showing another pattern complete and the BUY USD vs JPY that we posted on June 27, 2014. Highlighted areas are the ones to watch.
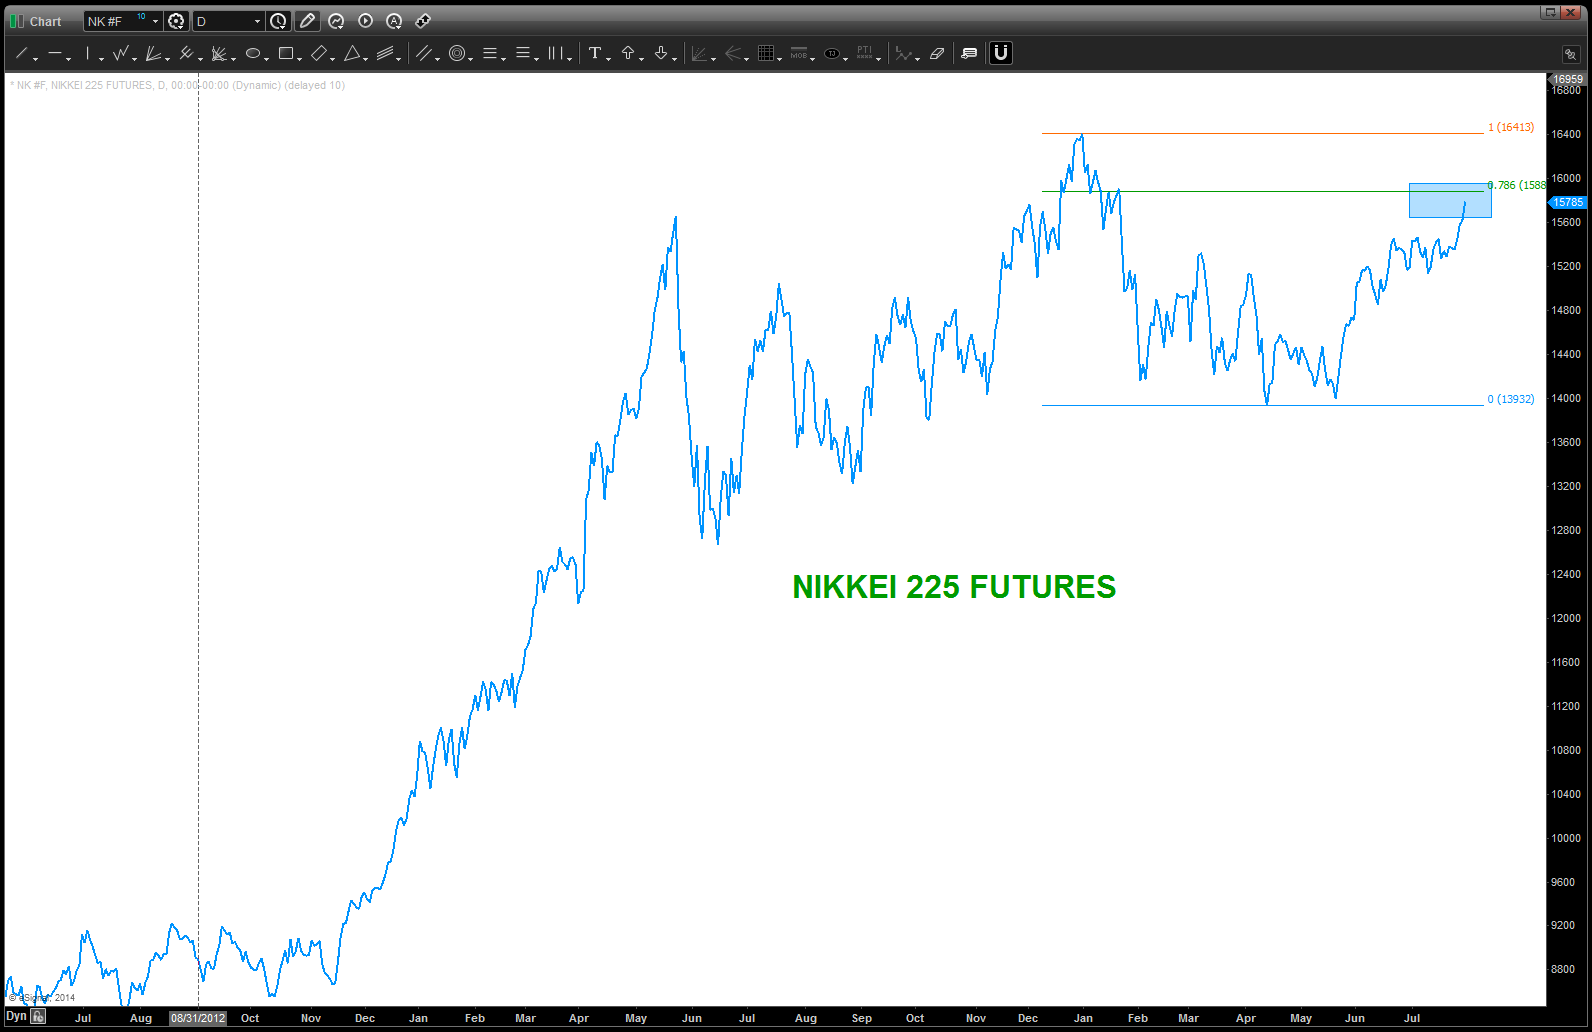
now, take a peak and we have completed (or a little higher) another pattern on the IMPORTANT USD vs JPY YEN cross. also, note the the N225 futures are up at the .786.
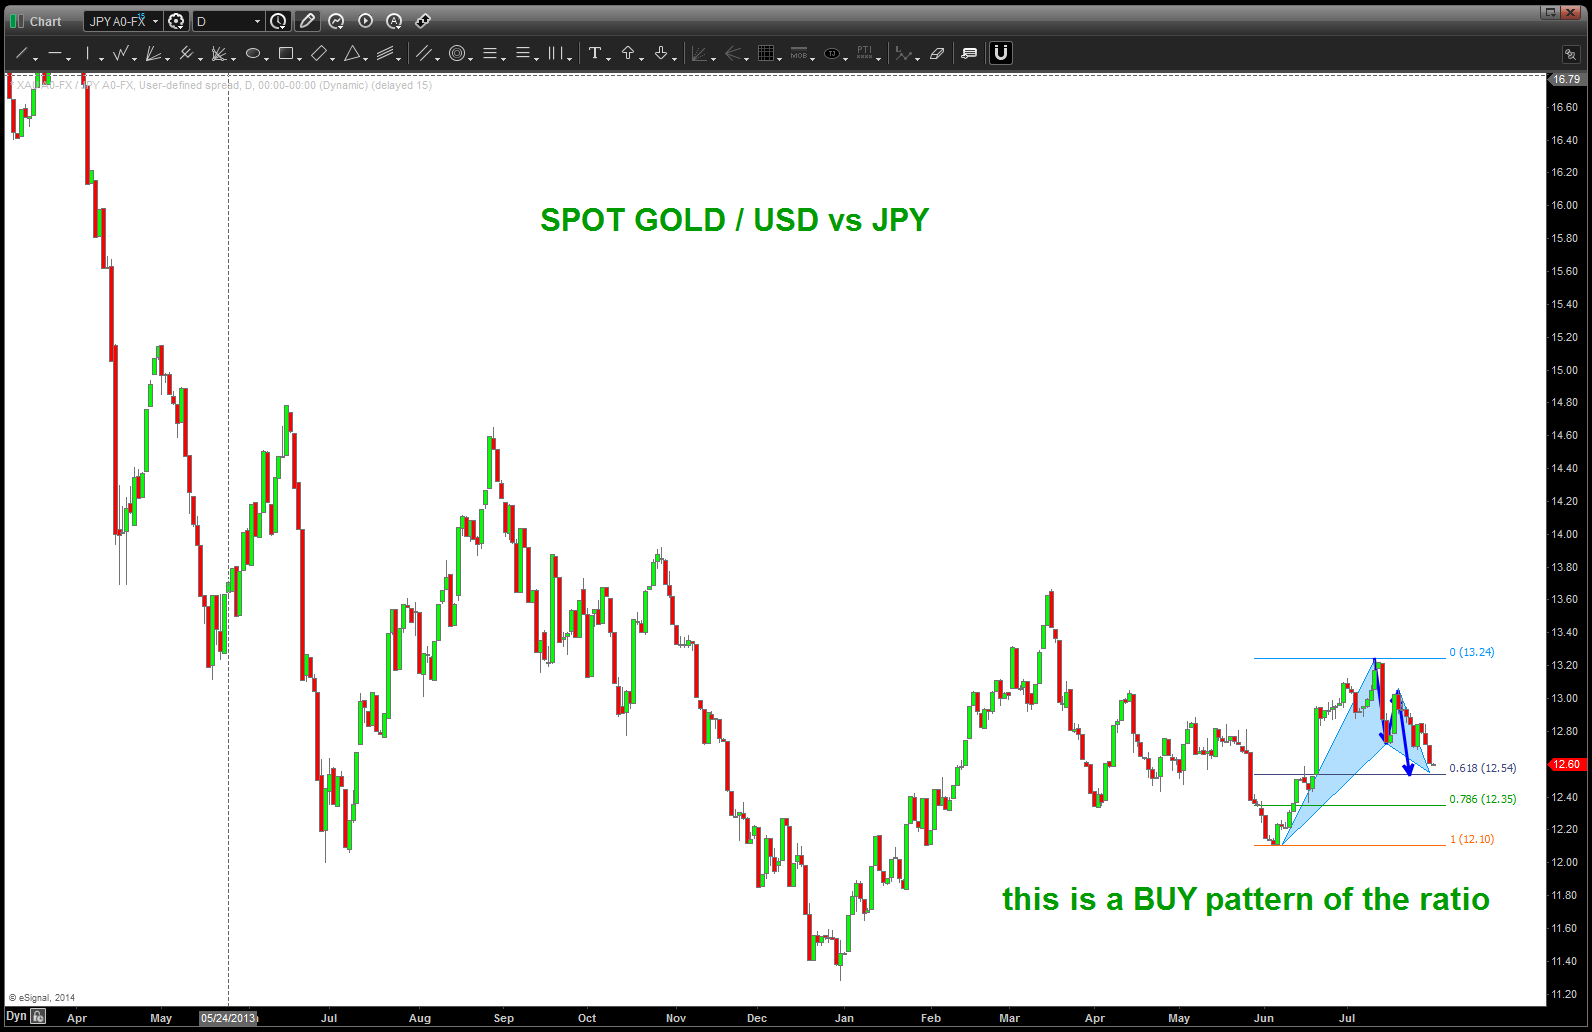
now time to go to the relative strength chart (GOLD / USD vs JPY).
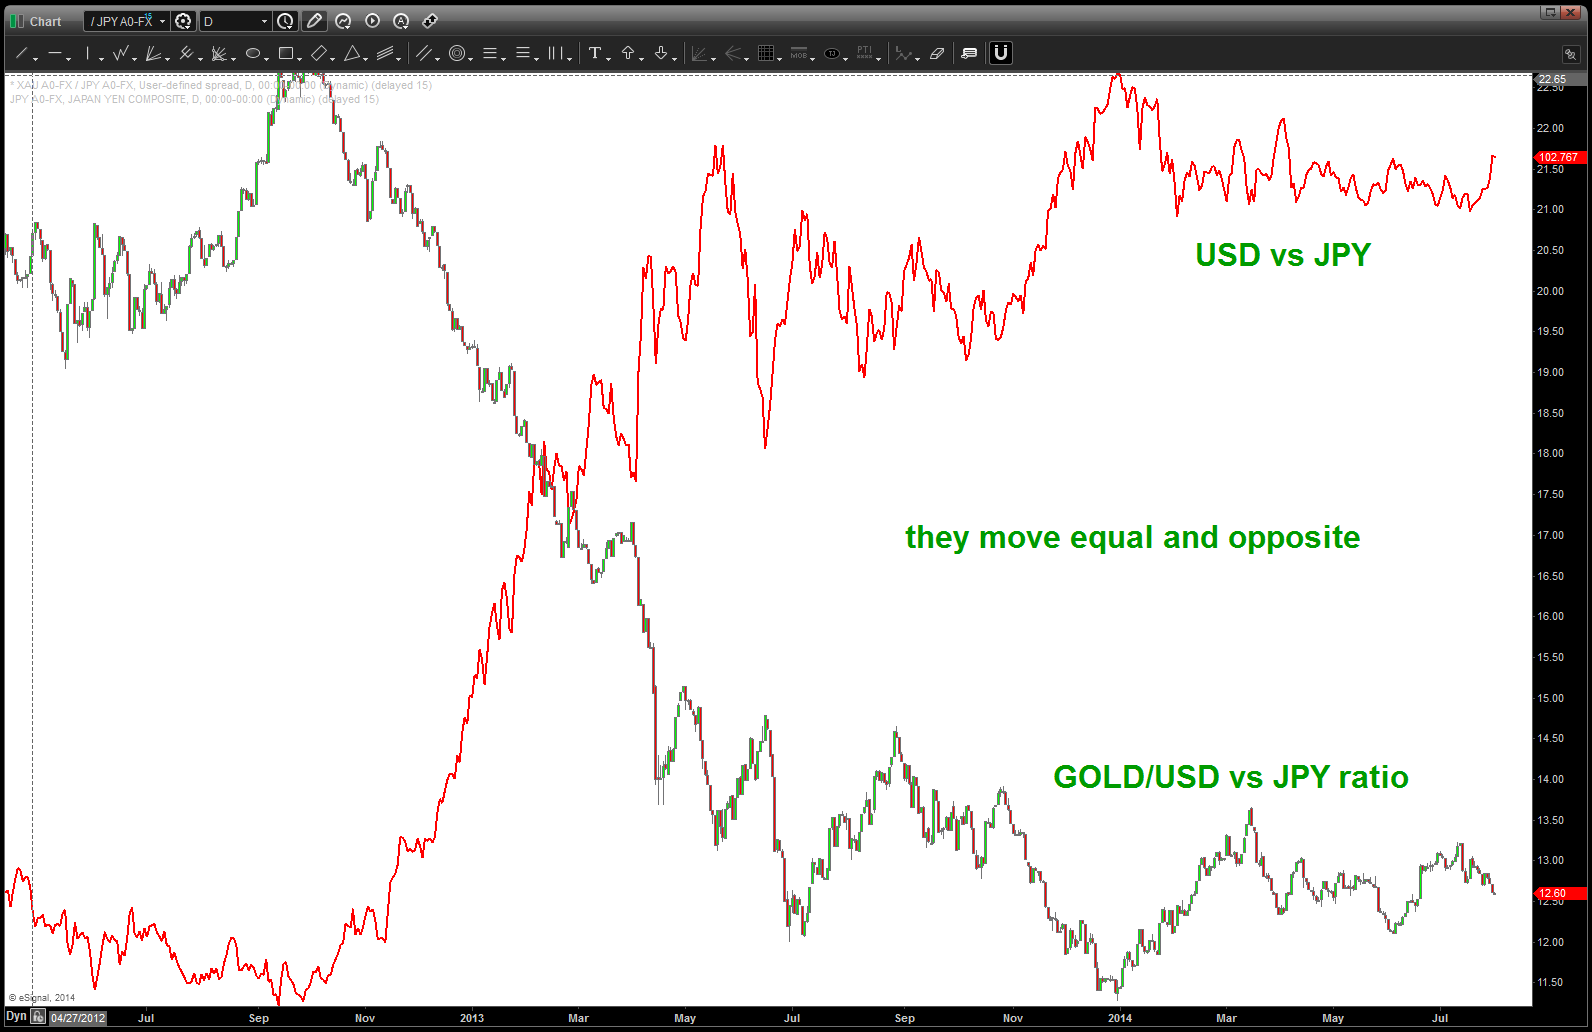
GOLD/USD vs JPY with USD vs JPY overlaid (red line) NOTE HOW THEY ARE EQUAL AND OPPOSITE!
what does a BUY pattern mean w/ this ratio? take note – the equal and opposite inflection occurs w/ regards to the USD vs JPY cross. So, our thesis is IF the BUY of the ratio holds THEN the SELL $$$ vs JPY patterns that are completing/have completed will cause the YEN to strengthen for another corrective leg. Additionally, this will foreshadow weakness in the N225.
see how that works …? Patiently wait for PATTERNS to form, work them into intermarket and ratio analysis and then pull the trigger when you feel like jumping into a 5 TRILLION dollar a day market w/ gorilla’s juggling dynamite from your simple and humble home office listening to Pink Floyd ….
Let’s complete the YEN circle of life ….
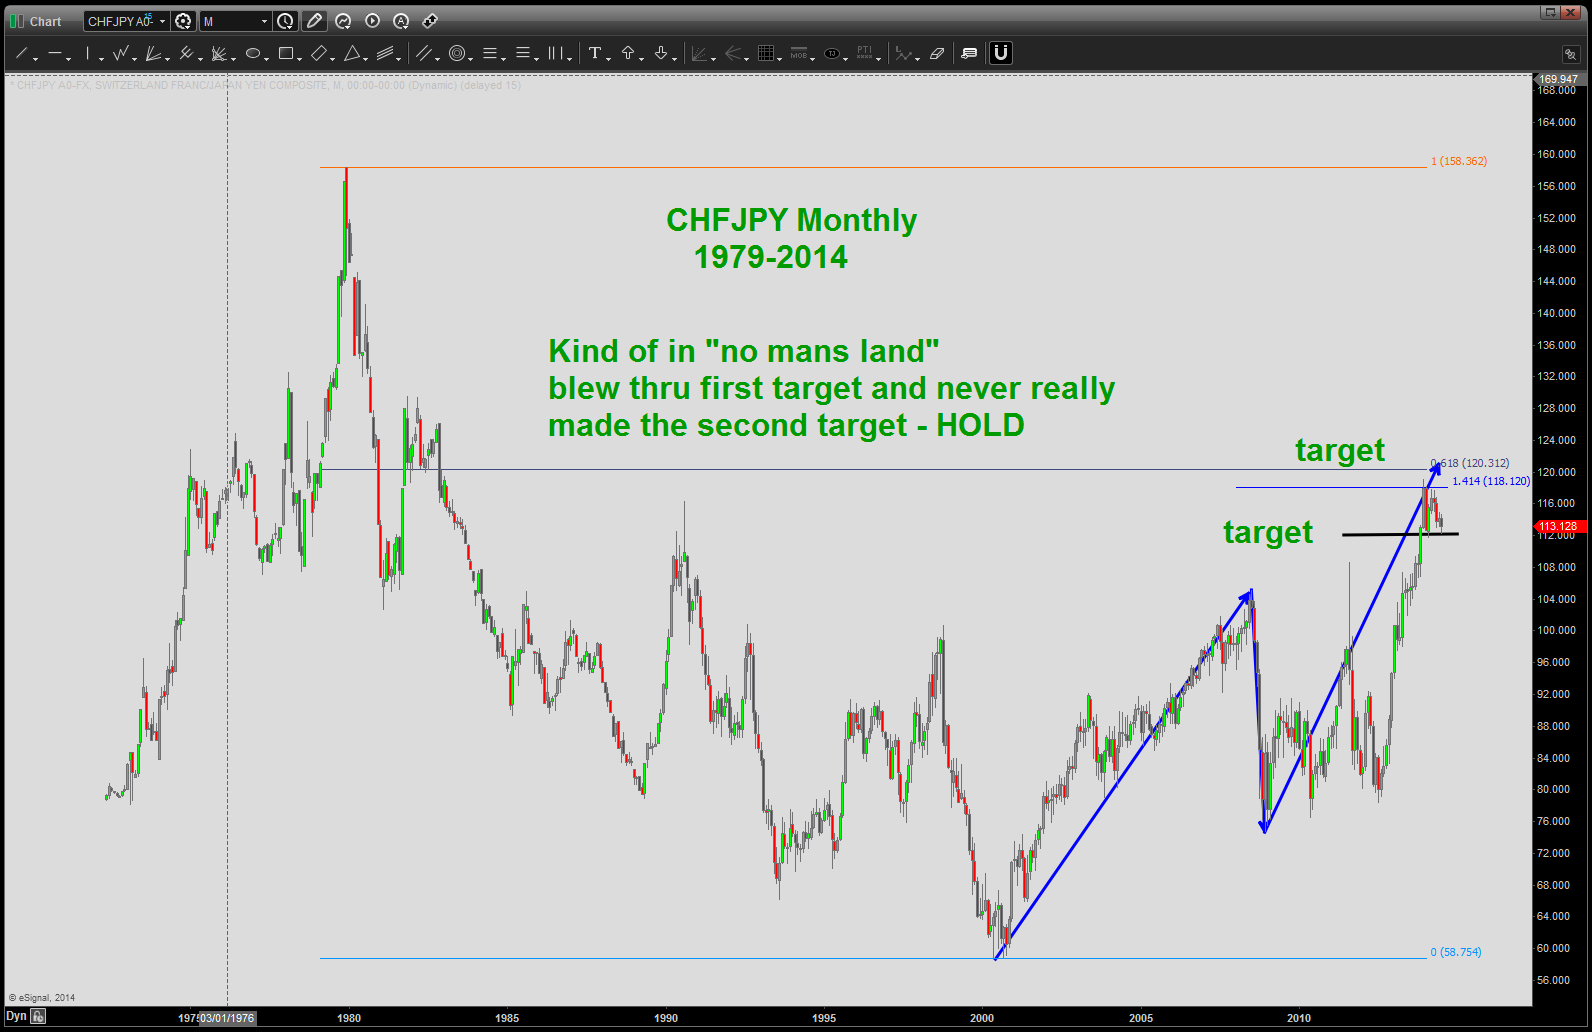
CHF vs JPY Monthly
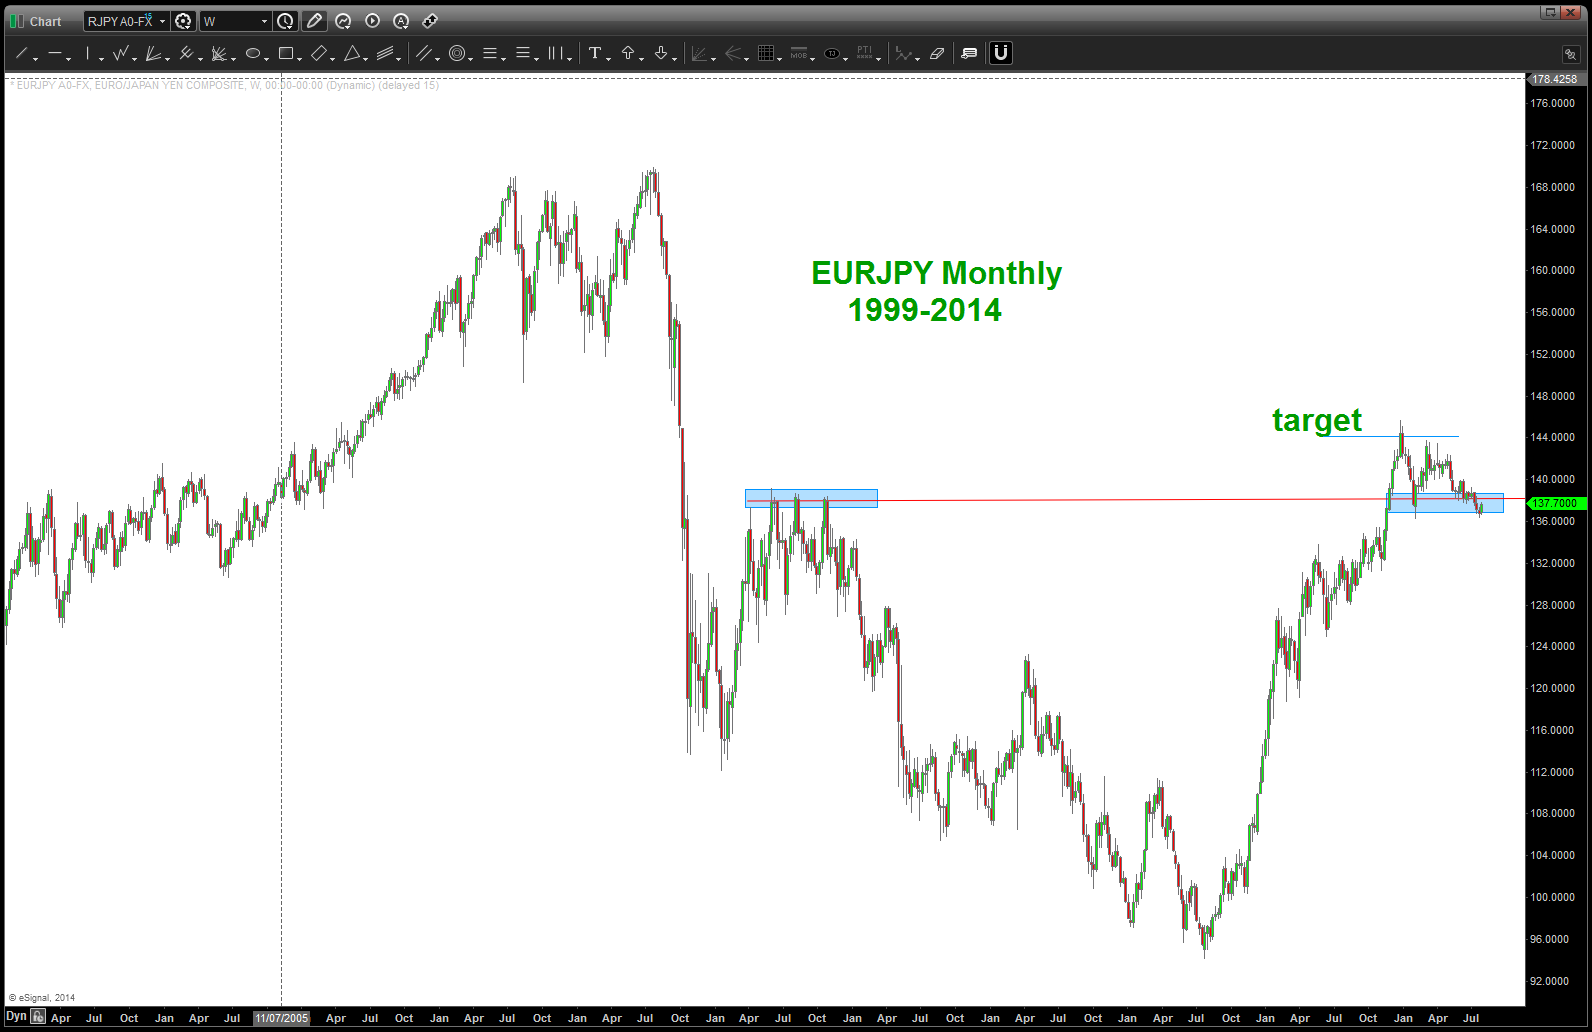
EURJPY Monthly
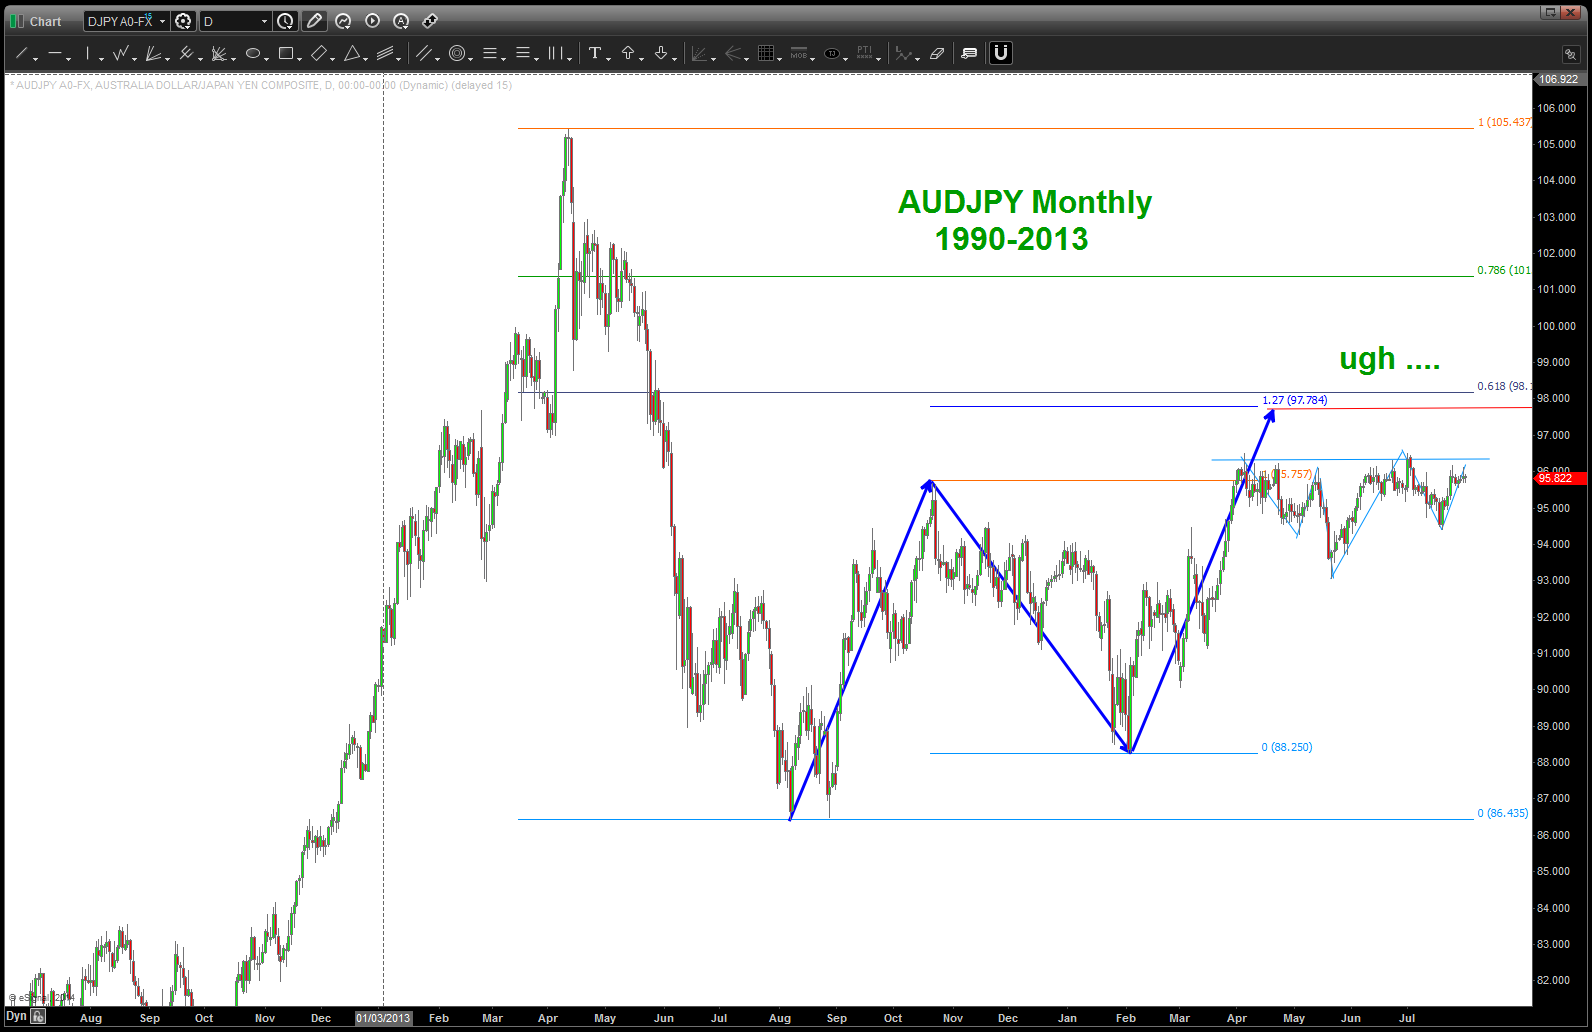
AUDJPY Monthly .. UGH
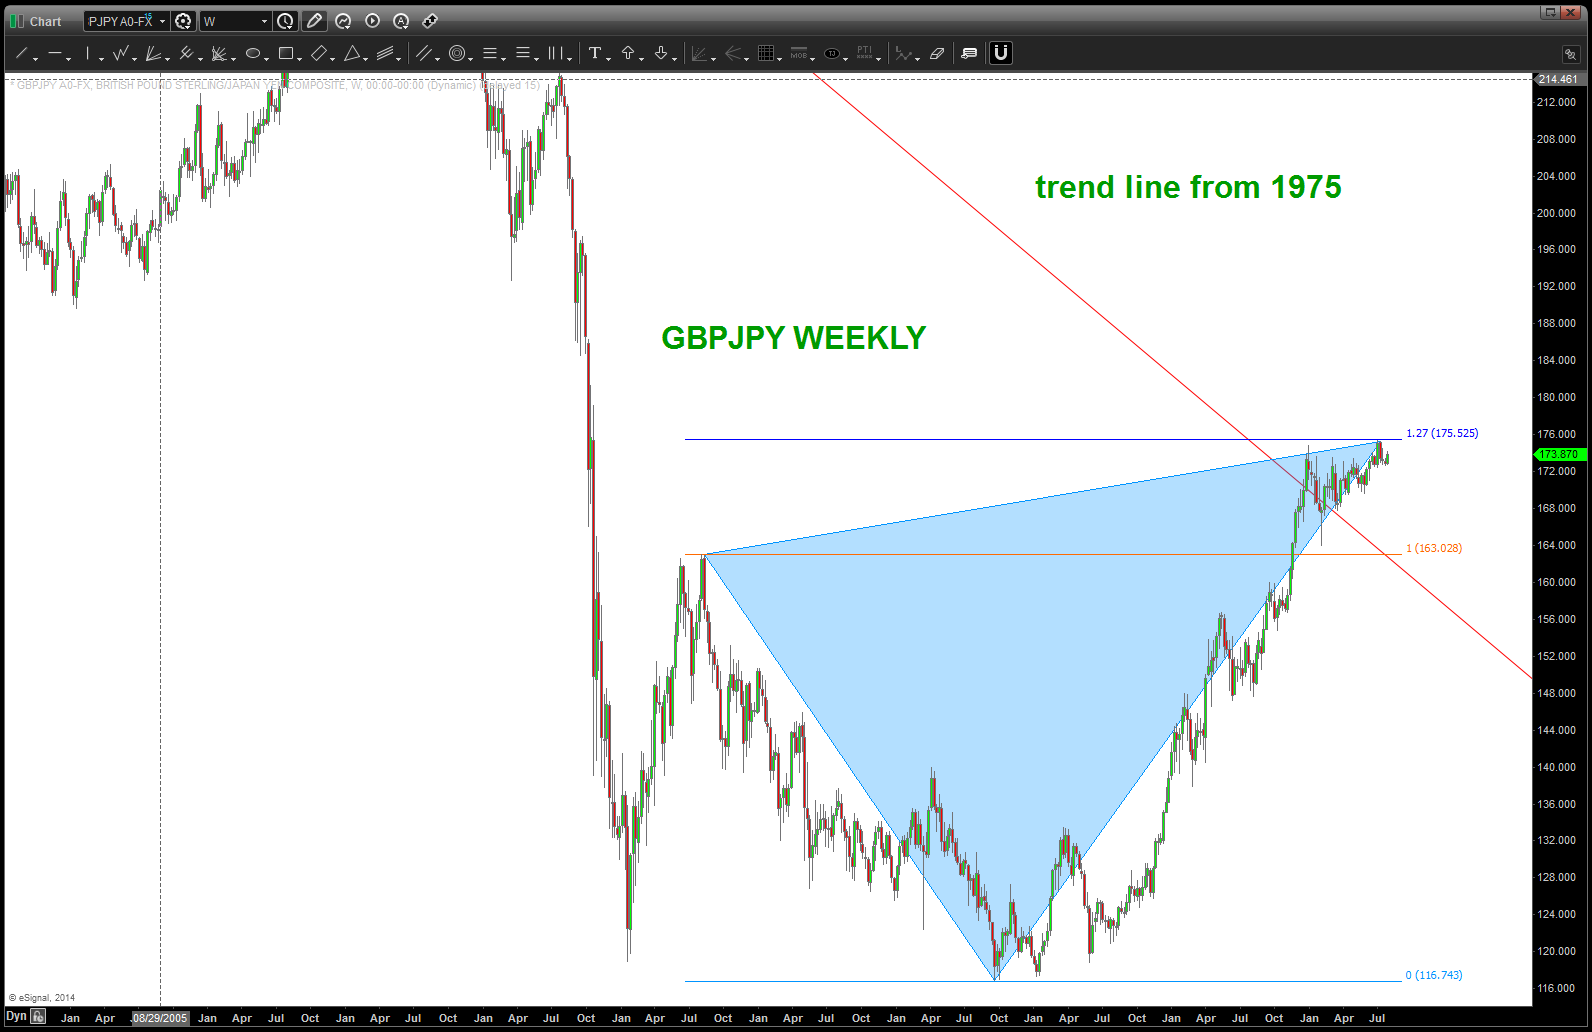
GBPJPY weekly
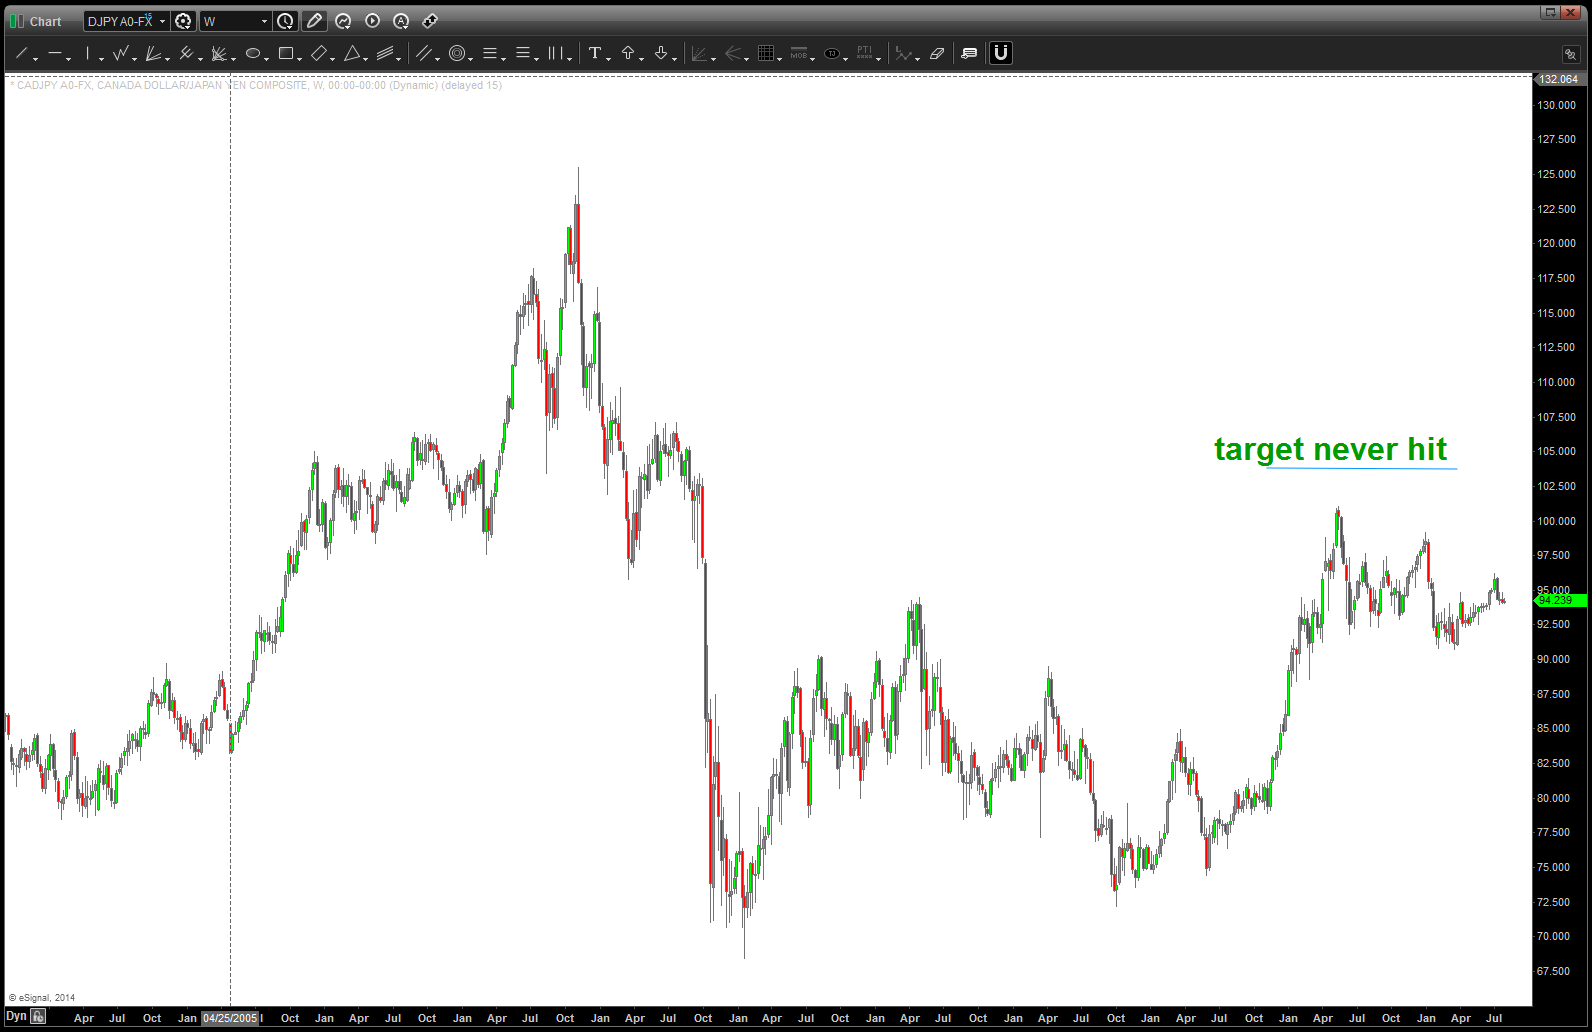
CADJPY Weekly
here’s the ETF for Japan … EWJ
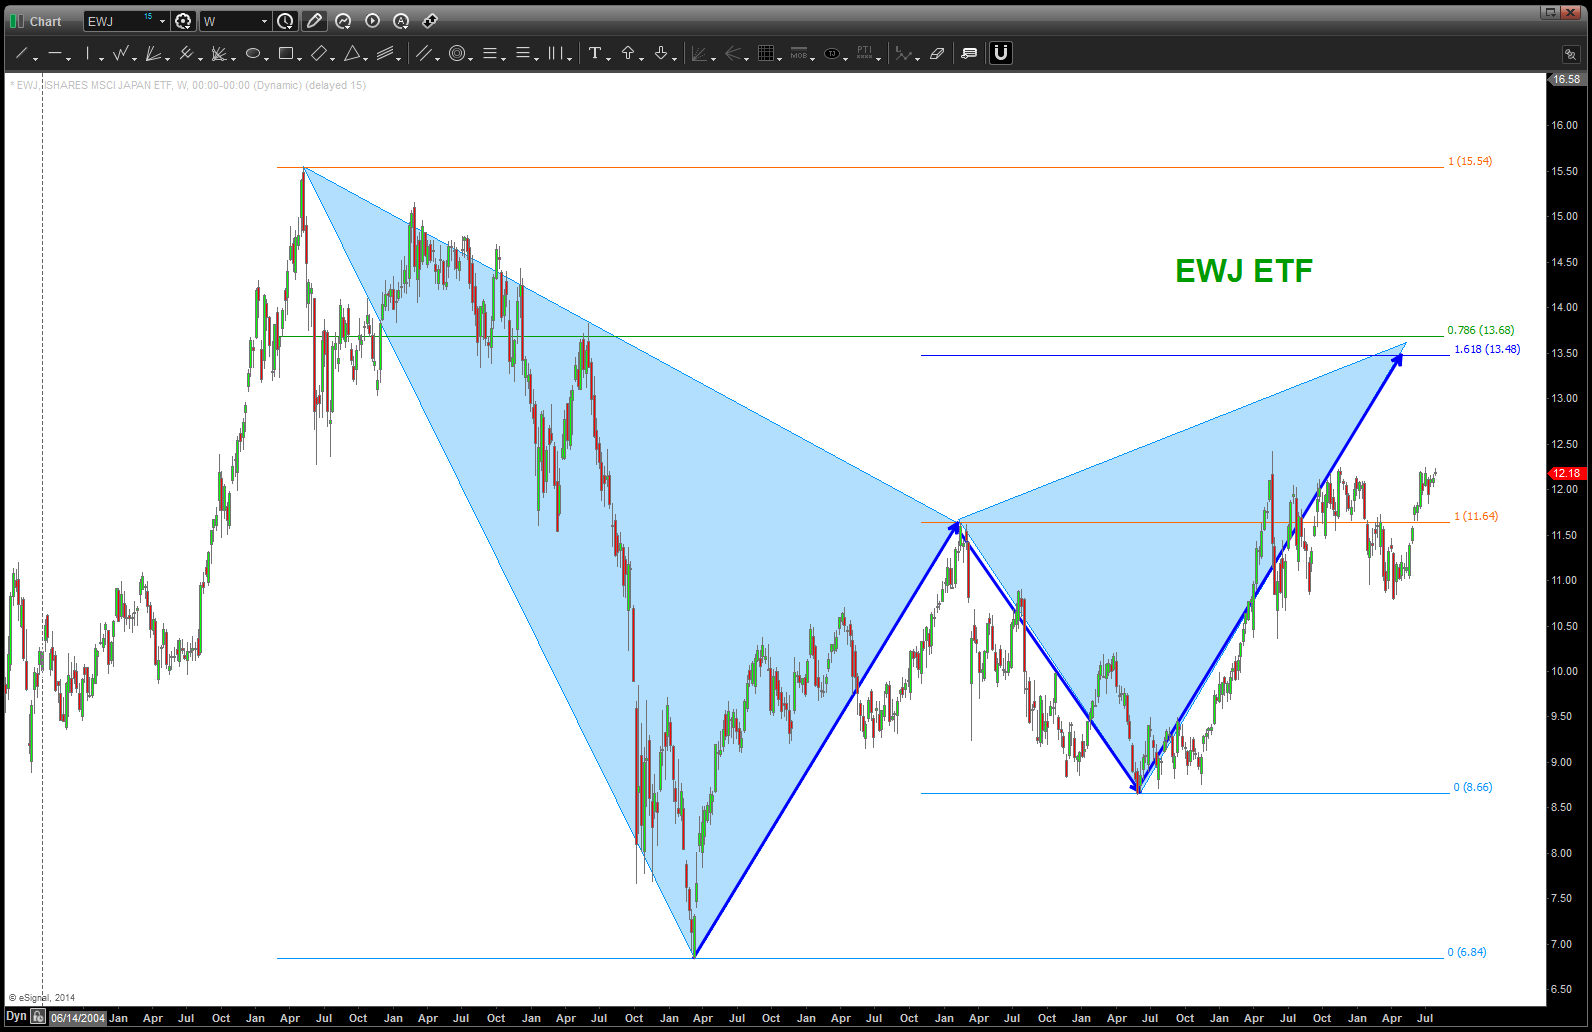
EWJ ETF
