relative strength of GOLD vs the USDJPY importance
a line in the sand was drawn at 75 in the USD vs JPY when the BOJ, after the horrible tsunami, said – enough is enough this is where the buck stops! the rest is history and a big KABOOM occurred. everyone and the brother can see the coiling occurring w/in this very important currency pair and, quite frankly, everyone and their brother is EXPECTING it to resolve to the upside. here is the case for that ..
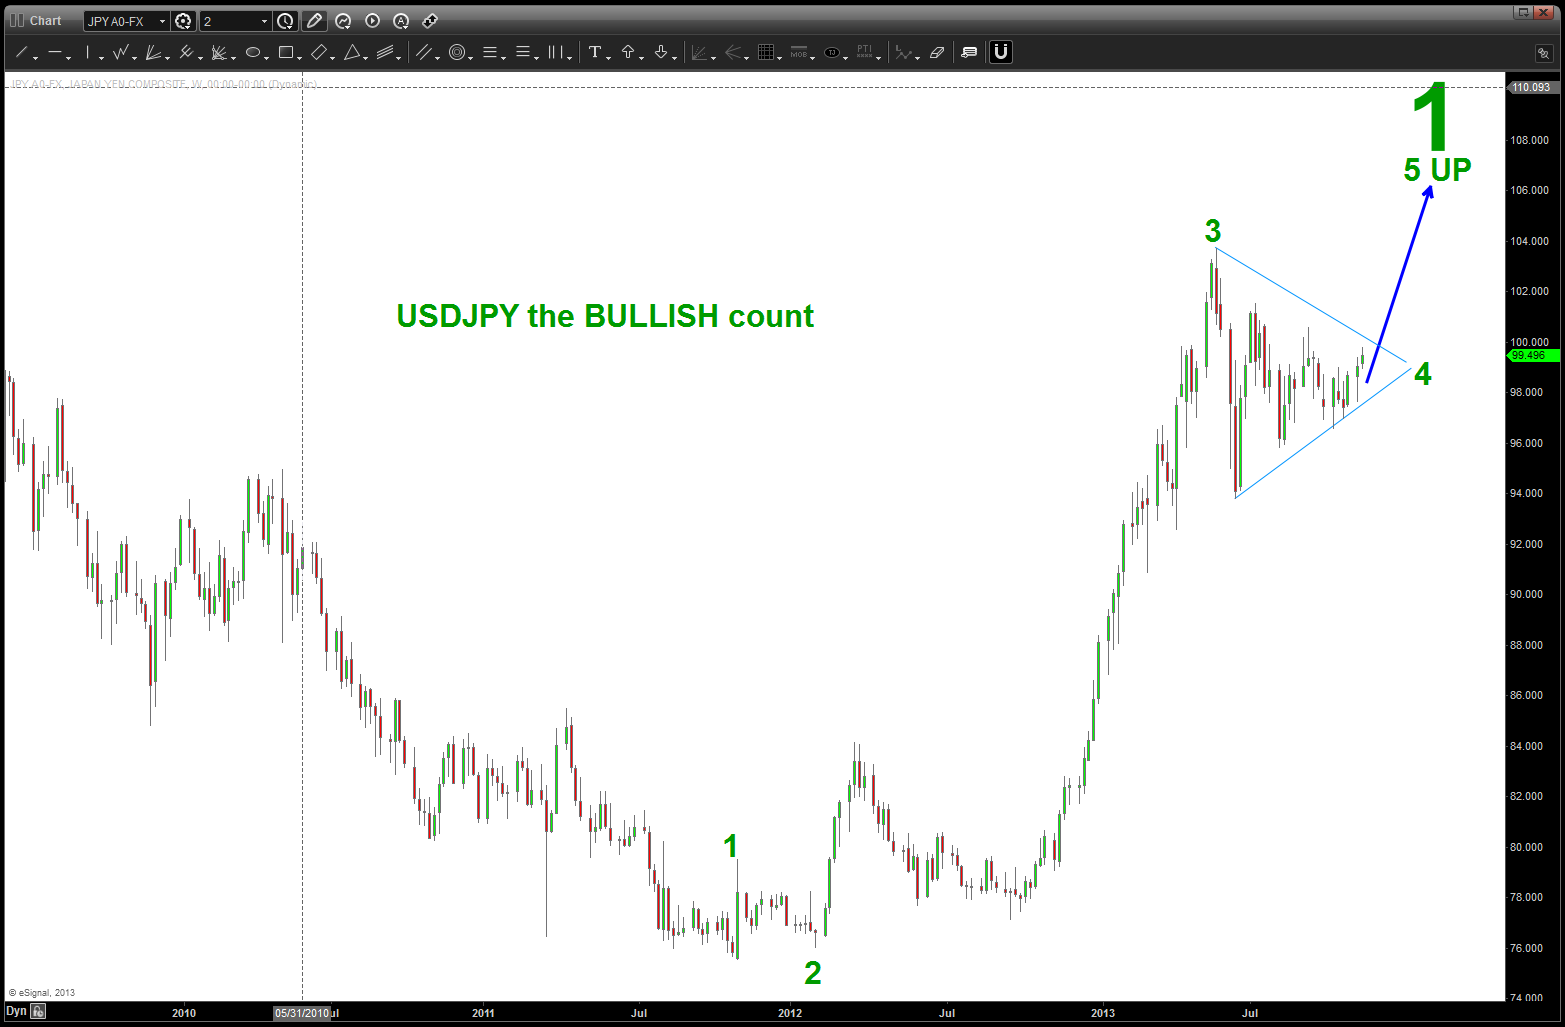
BULLISH POTENTIAL
now, here is where it gets interesting … is there any possibility of this moving DOWN? A couple weeks ago, I didn’t think so and here’s the post:
https://bartscharts.com/2013/10/10/japanese-yen-advance/
if you look at that post, we nailed the low and the pair has moved up from the levels indicated.
now it gets interesting, a lot of BEARISH PATTERNS have been completing on the equities side of the house and IF this is marking an important top/pause in the run from 2009, THEN the Nikkei 225 shouldn’t keep going straight up – one would think. So, being very focused on the FX markets I decided to look at the JPY vs a lot of the pairs from around the world
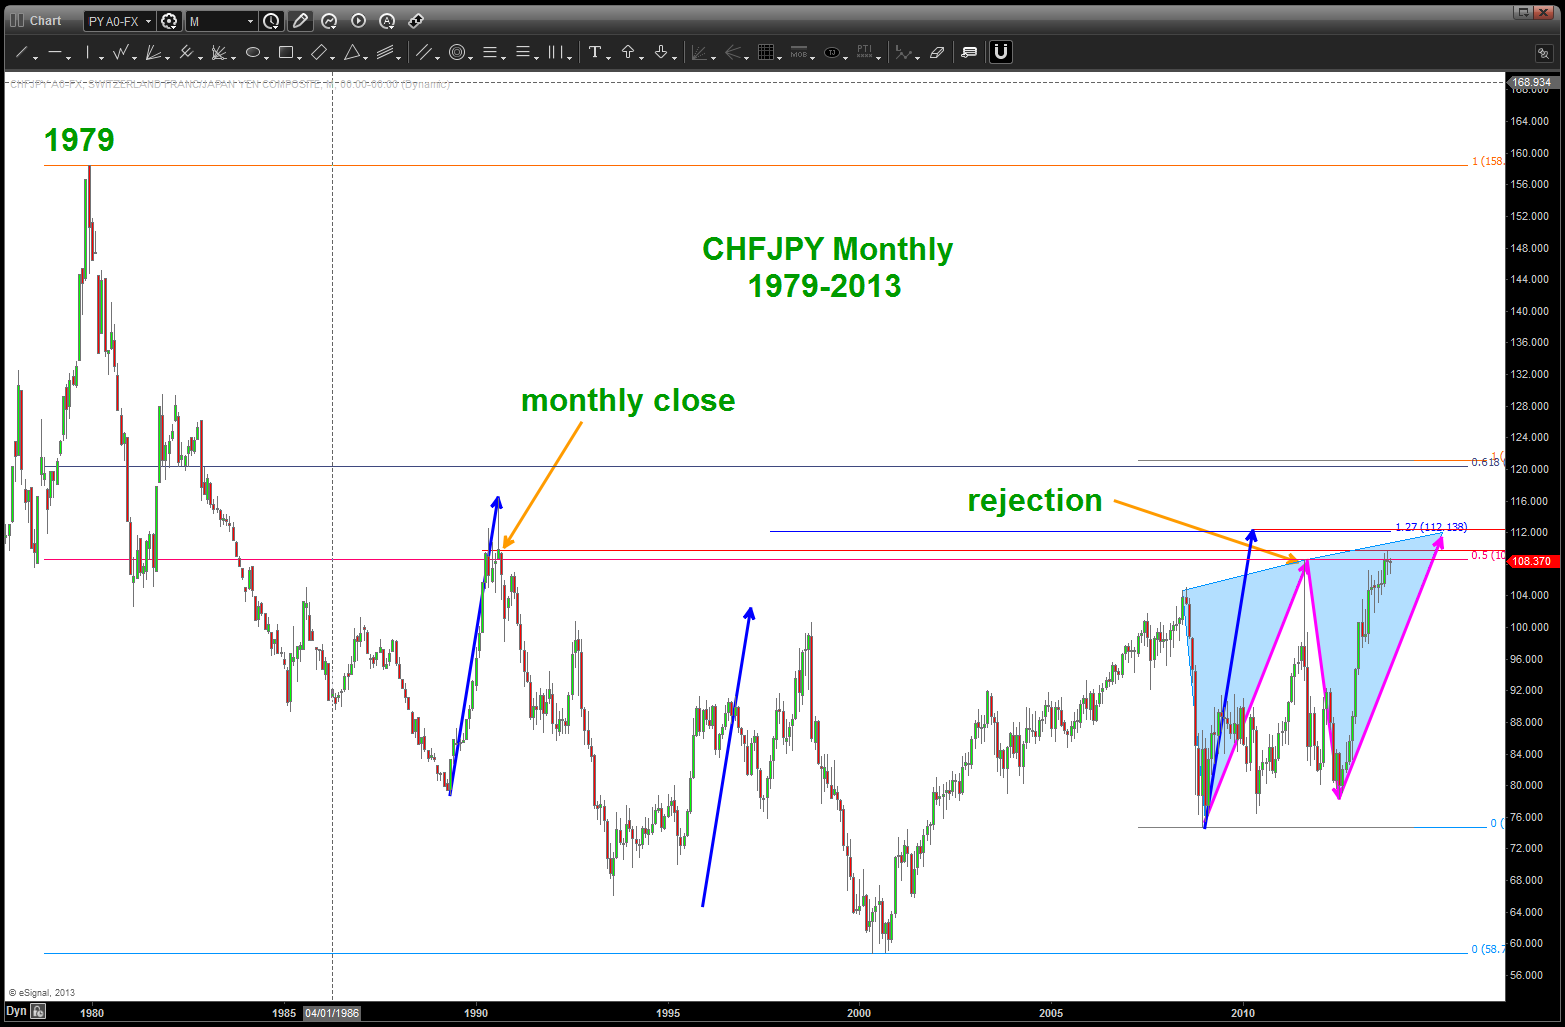
 CHFJPY: stopping exactly where it got smashed a couple years ago and in 1999. (JPY strength) / this is the most fascinating chart IMHO.
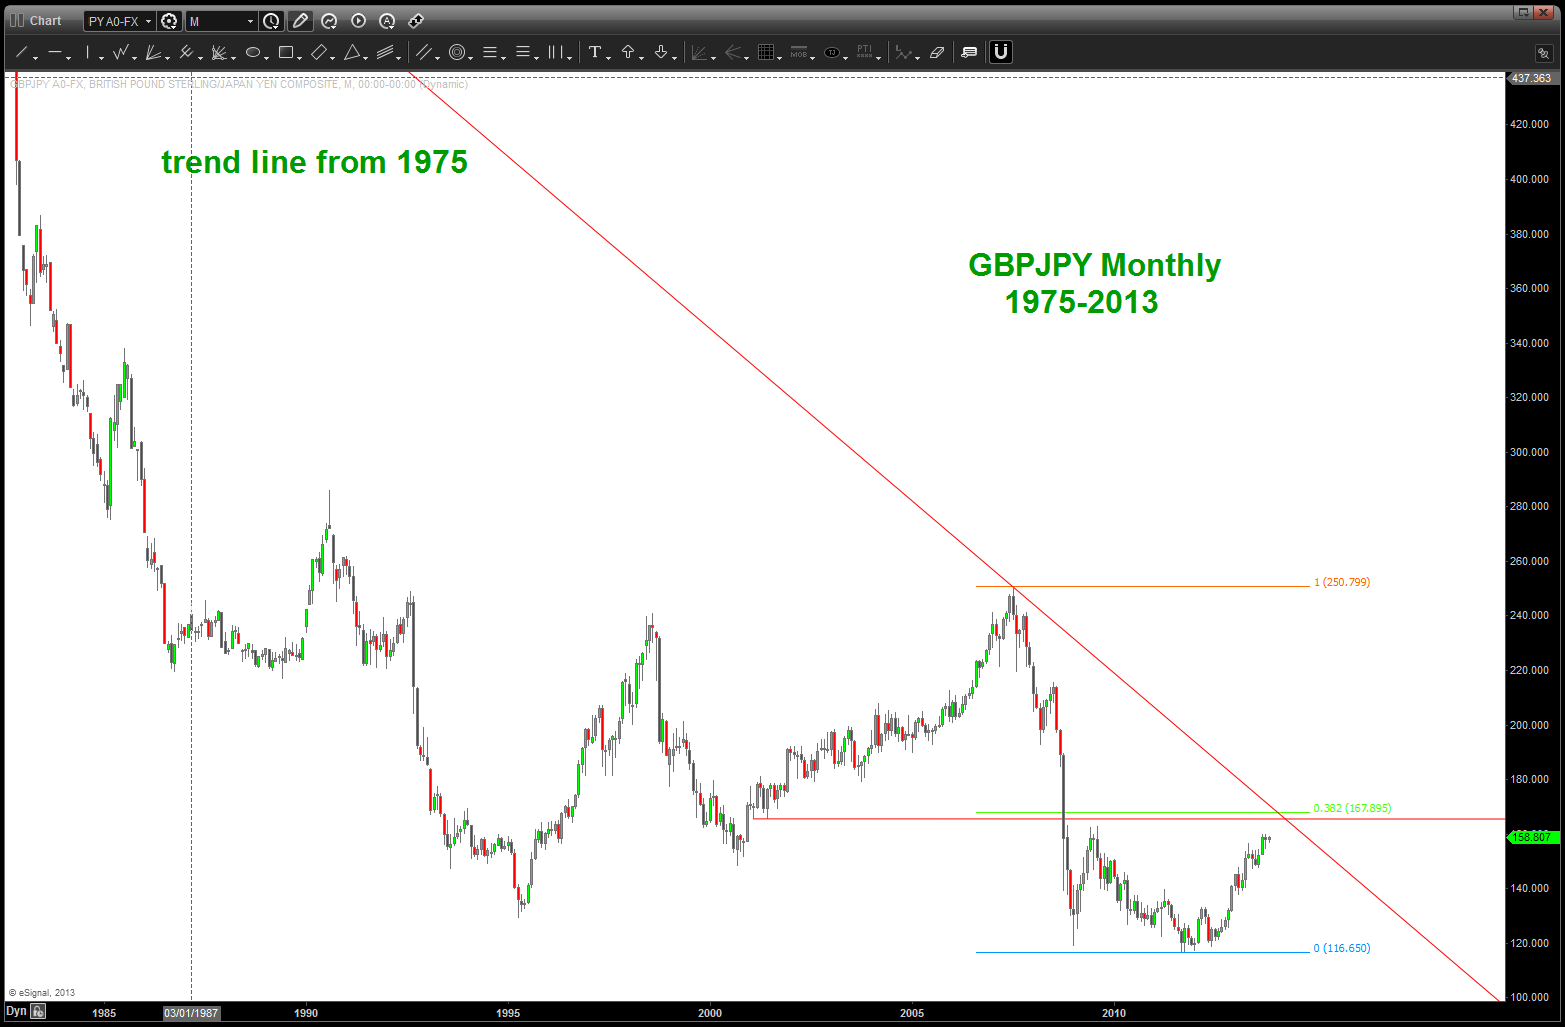
GBPJPY: little higher and then major resistance. (JPY strength)
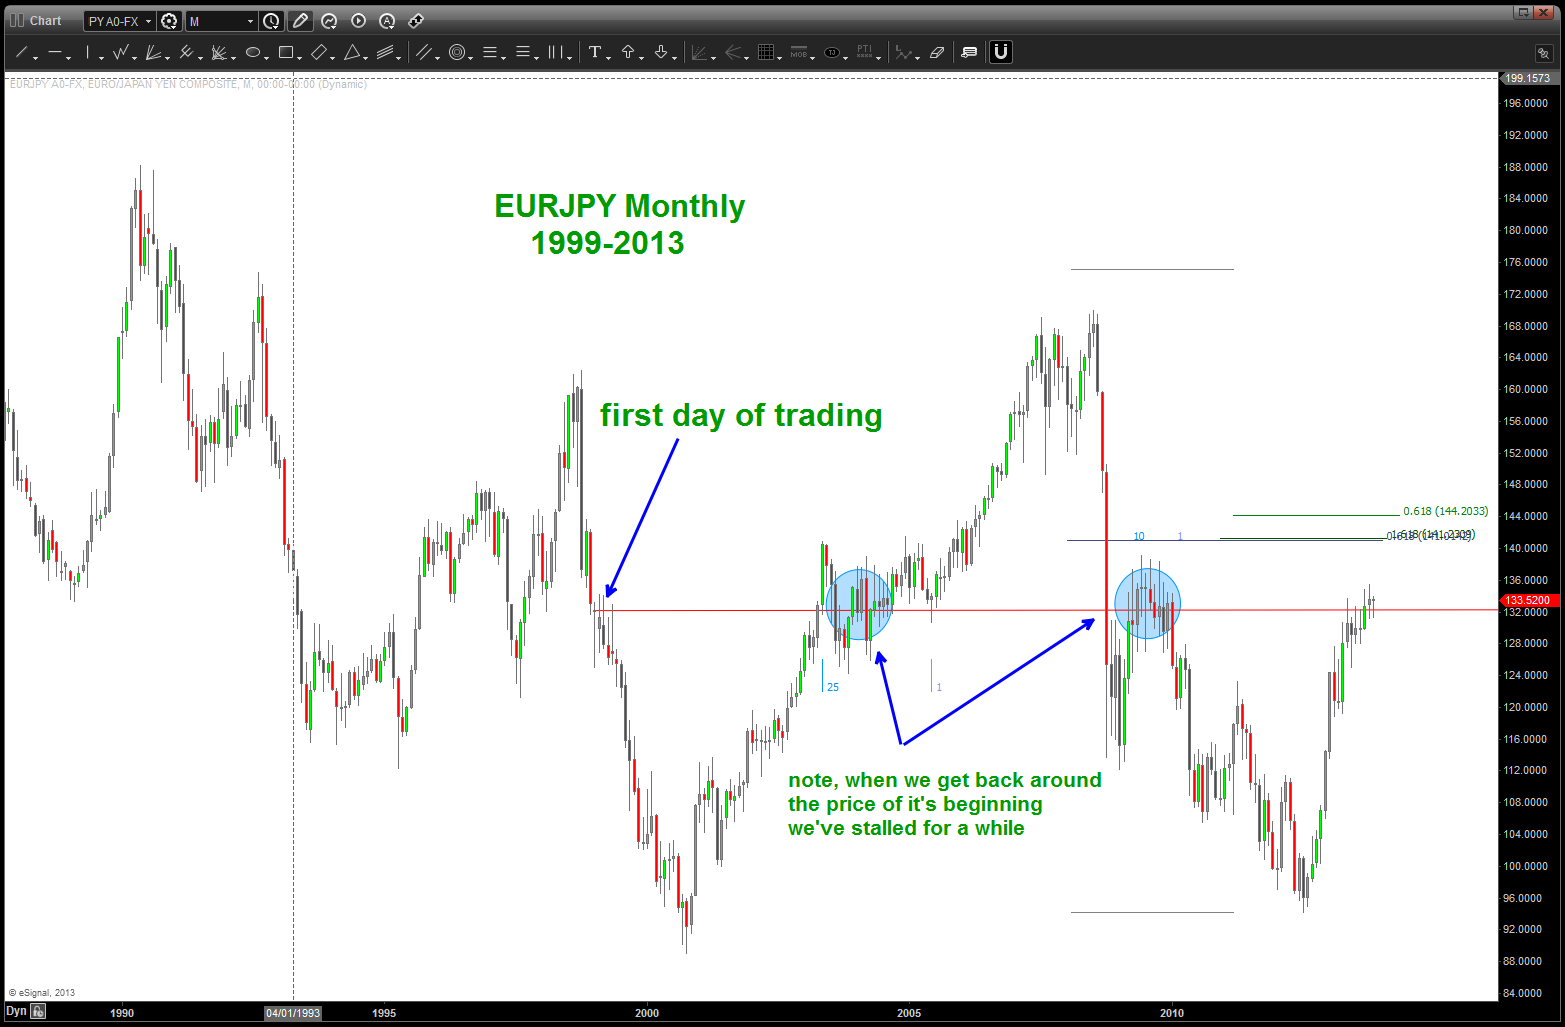
EURJPY: tough call, but higher and we have major resistance (EUR strength? Seriously? perhaps if the EURO smashes down, the JPY will strengthen?)
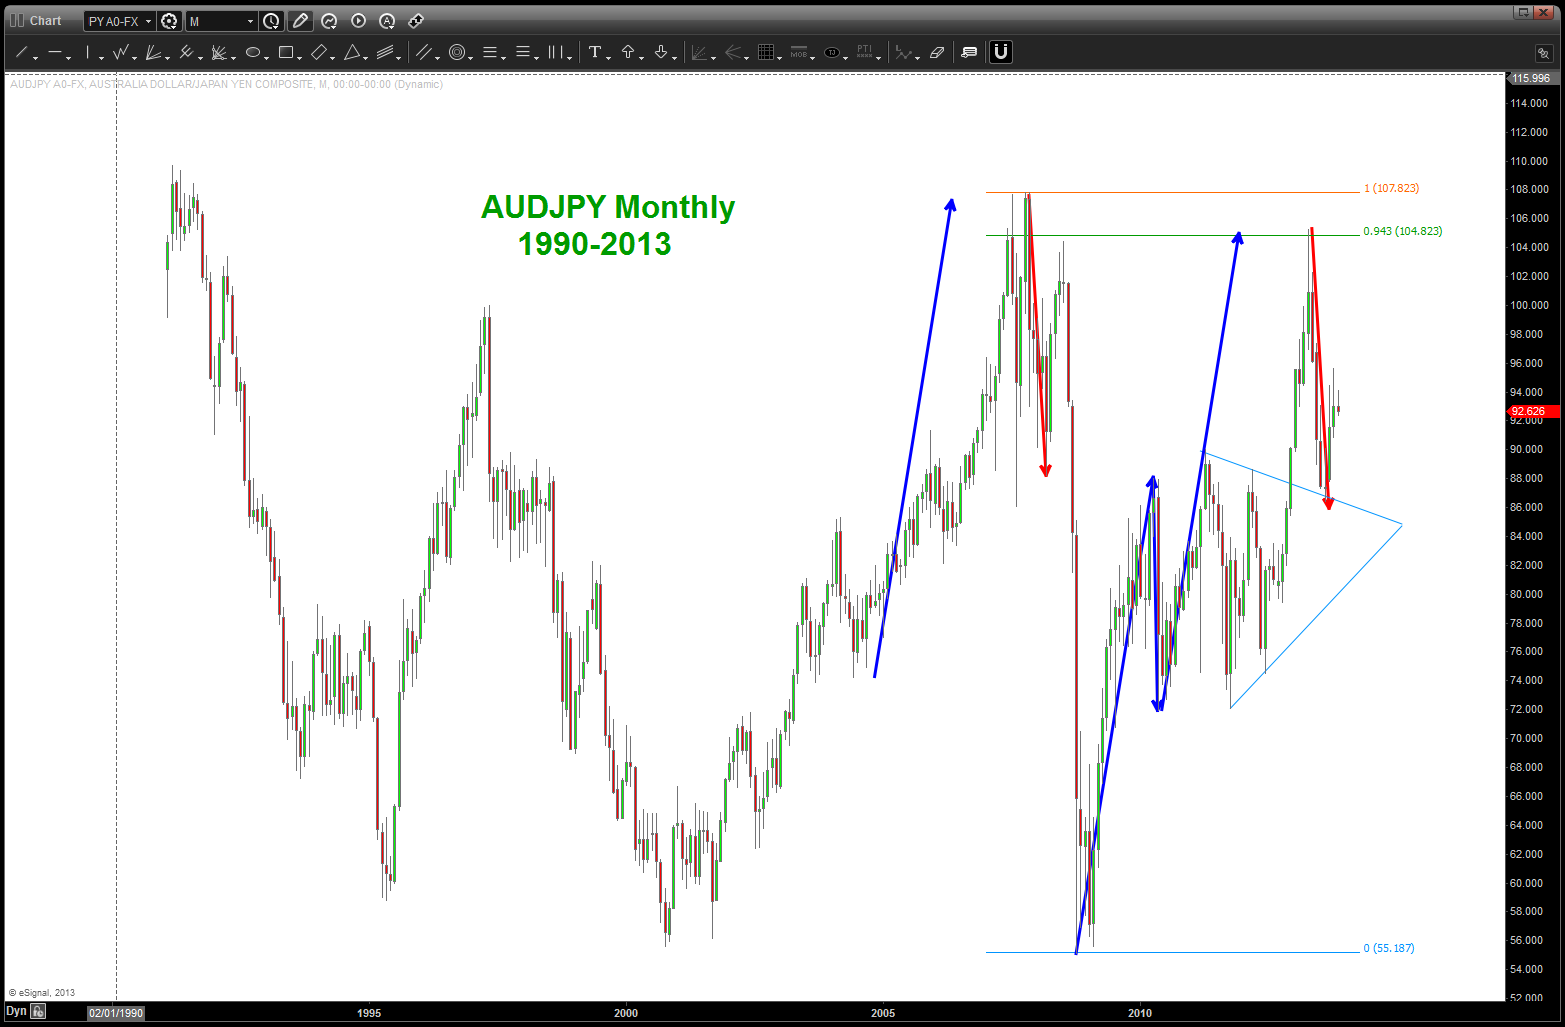
AUDJPY: major sell signal HIT and AUD is weak against the JPY (JPY strength)
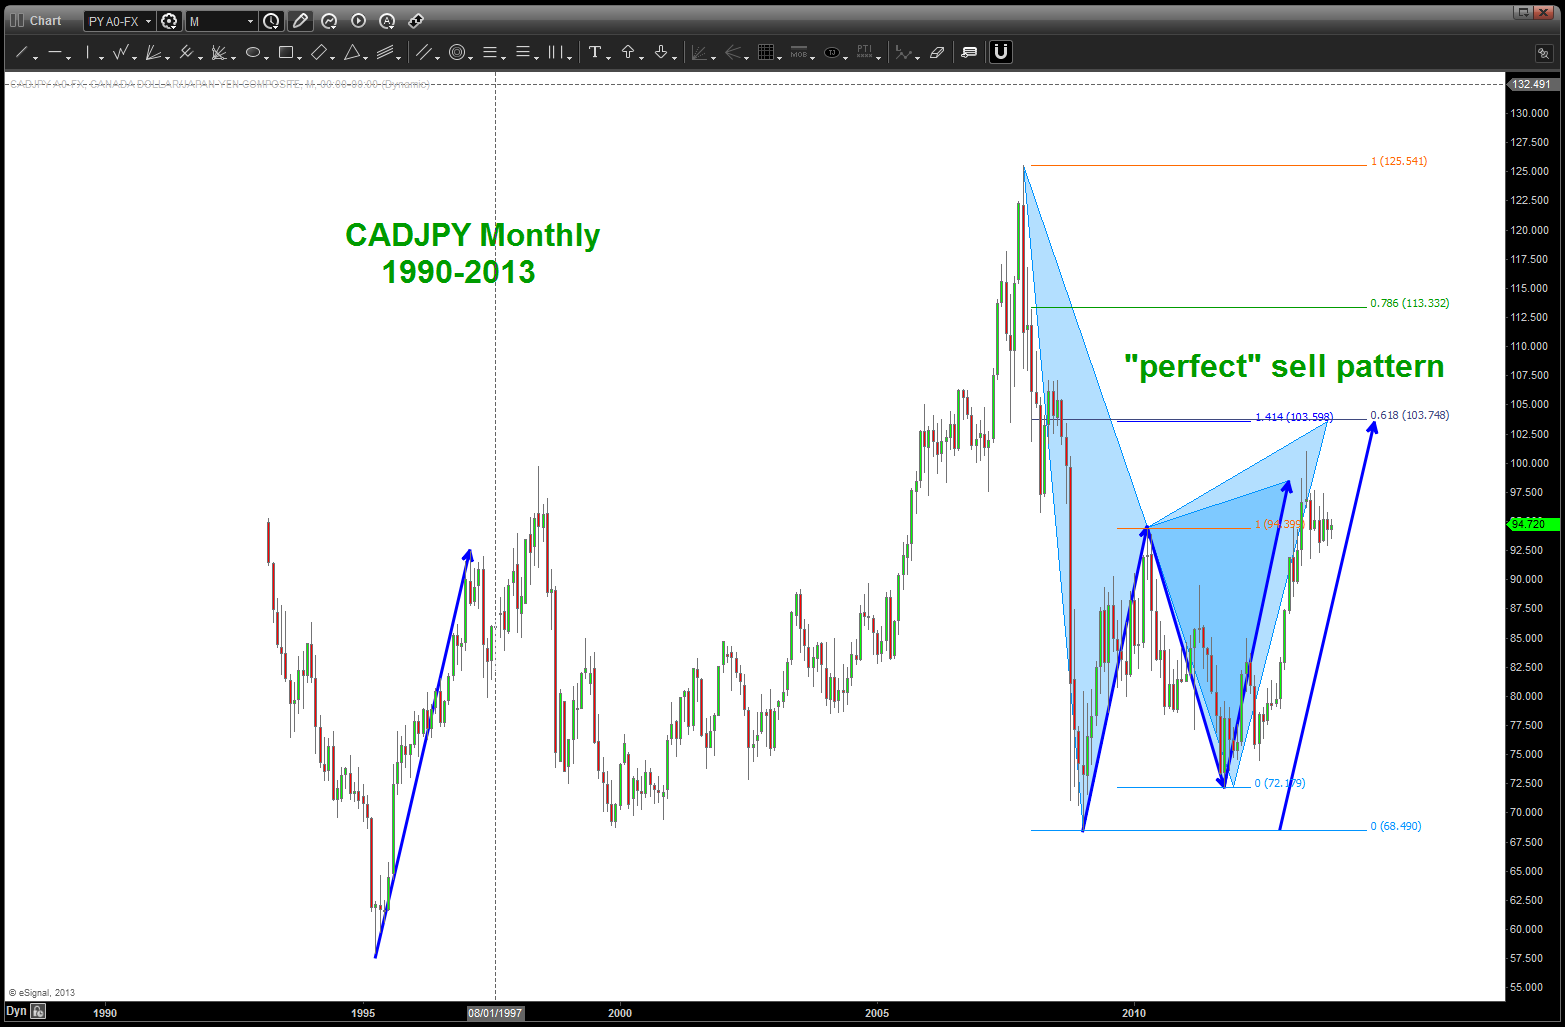
CADJPY: major sell pattern HIT and if it holds we’ll get a move low. Another target is higher also..( but JPY strength)
These 5 pairs do not show the coil and they are showing some JPY strength afoot? (Cue Wayne’s World – “something is afoot at the circle K”
What to do … well, let’s go back to our ratio’s. in this case let’s do a ratio analysis of SPOT GOLD / USD vs JPY. Well, look at that …
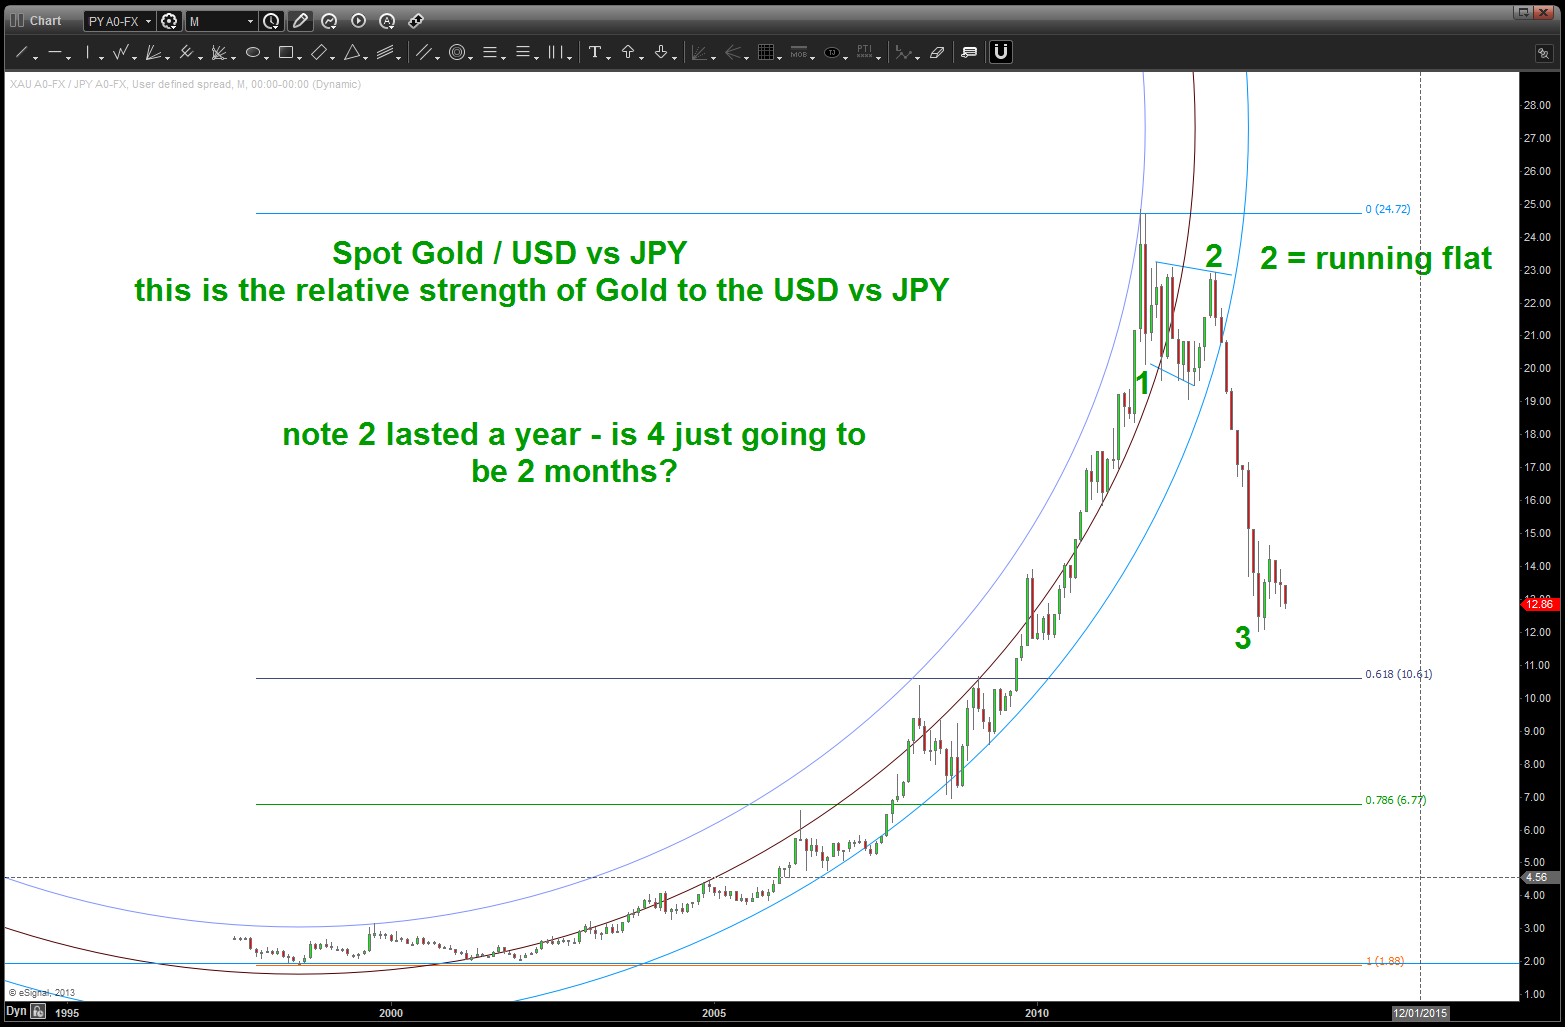
Relative Strength of Spot Gold vs USDJPY
another parabolic run that is ending badly … but here’s what REALLY makes me go “hmmmm.” It’s not a stretch to say we are in a very powerful wave 3 down right now in this relative strength chart … but notice how long the wave 2 took to correct! A pretty long time before things got interesting. one of the things we are taught in the CMT is form/proportion and balance. I would just think that wave 4 would take a little more TIME. So what do we do – go to a time frame lower:
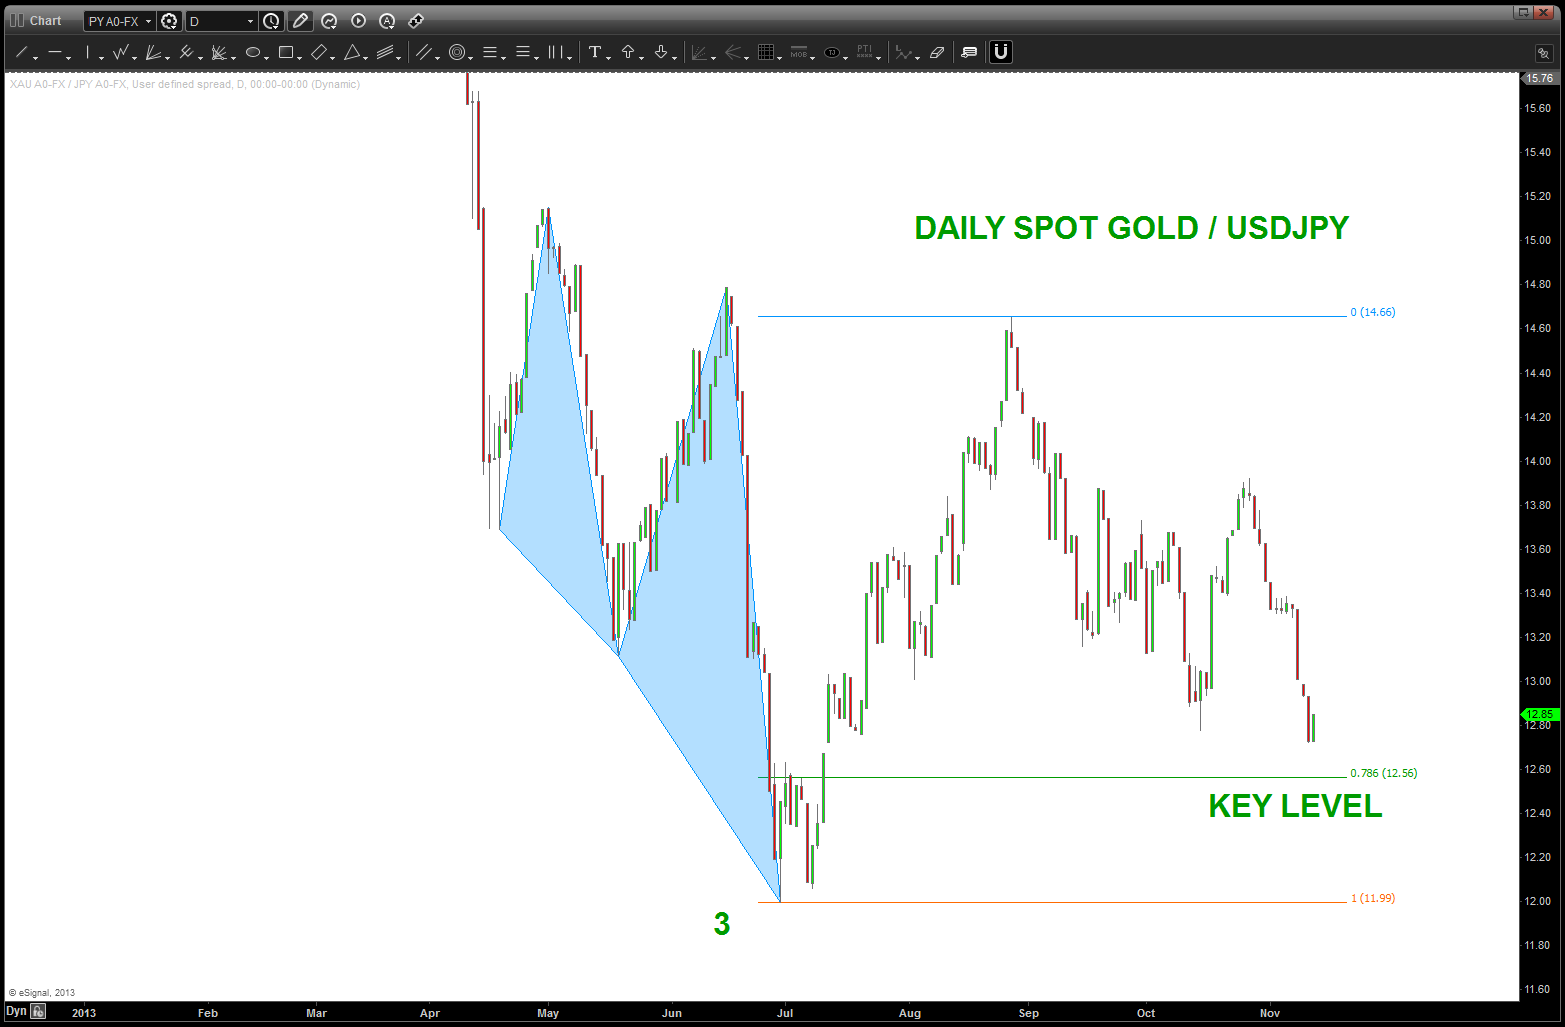
spot gold vs USDJPY relative strength
so, if we can get to the lower level at 12.56 on the ratio we’ll get a good a idea of where we are…my thesis is that if 1) this level holds and bounces it will cause the YEN to strengthen and if we lose this level to the downside it will cause the YEN to weaken and the triangle of USDJPY will resolve UP. Here’s why this is so important:
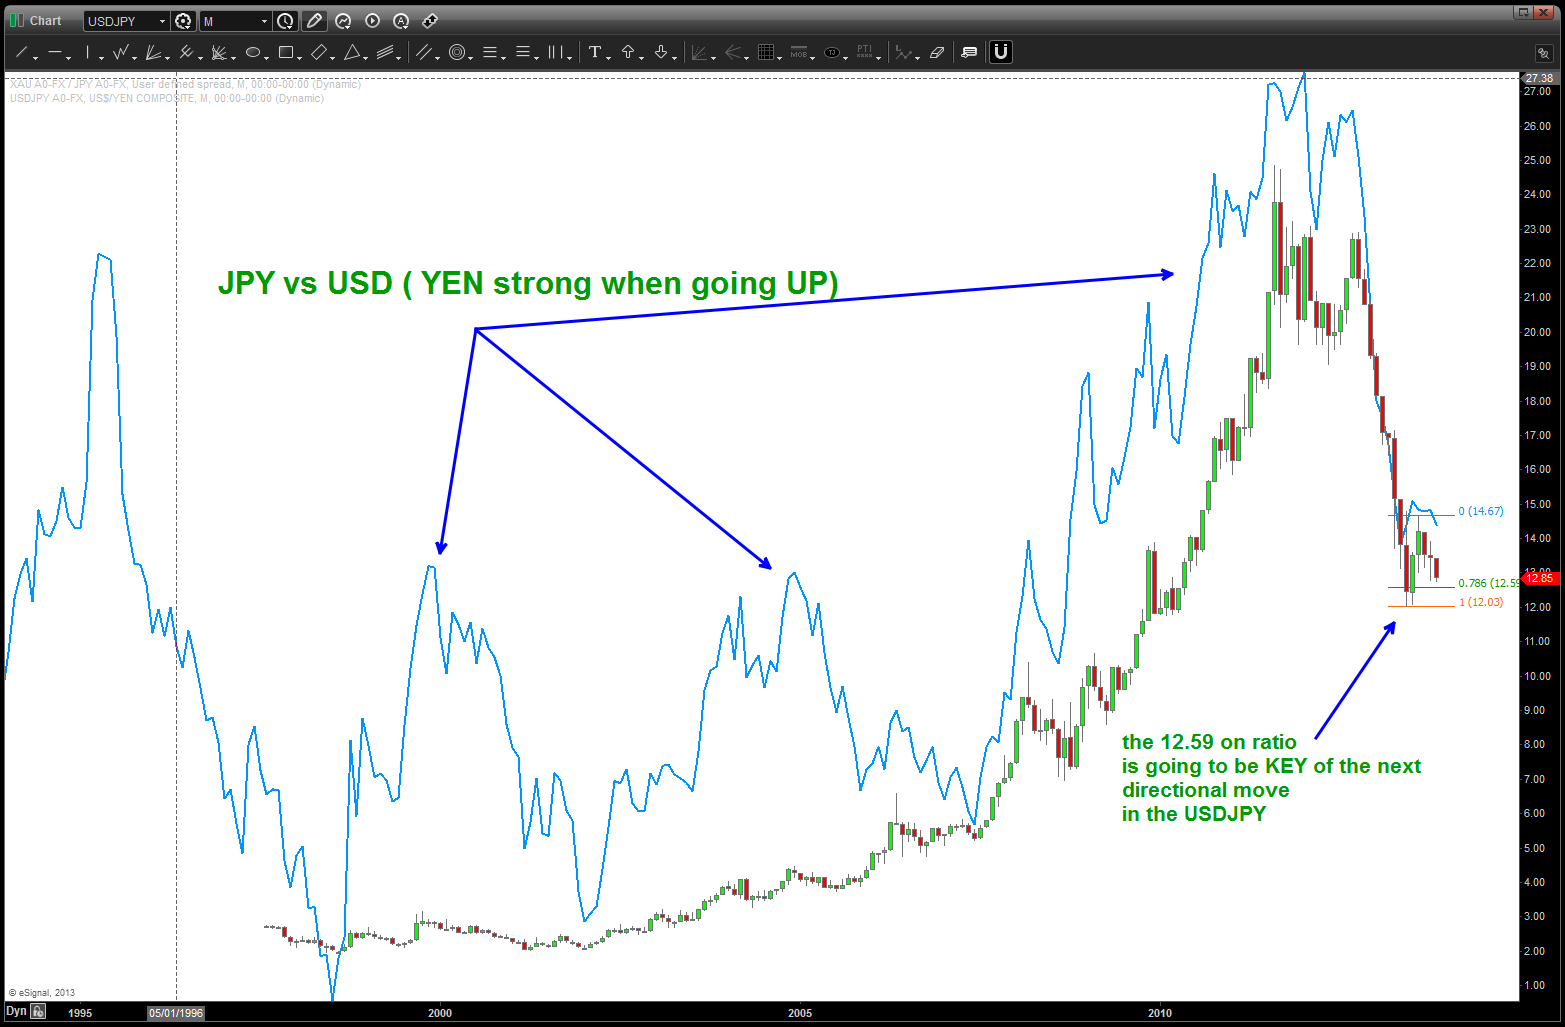 the line is the JPY vs USD. the JPY is “strong” when the blue line is going up and it’s weak when the blue line is going down. note the TIMING of the inflection points in the ratio.
SUMMARY: yes, we are at a critical level in the USDJPY contraction …if we keep any eye on the Ratio of SPOT GOLD / USDJPY we might be able to get a “peak” at the directional movement of the coil …
Last, here’s the BEAR count of the USDJPY:
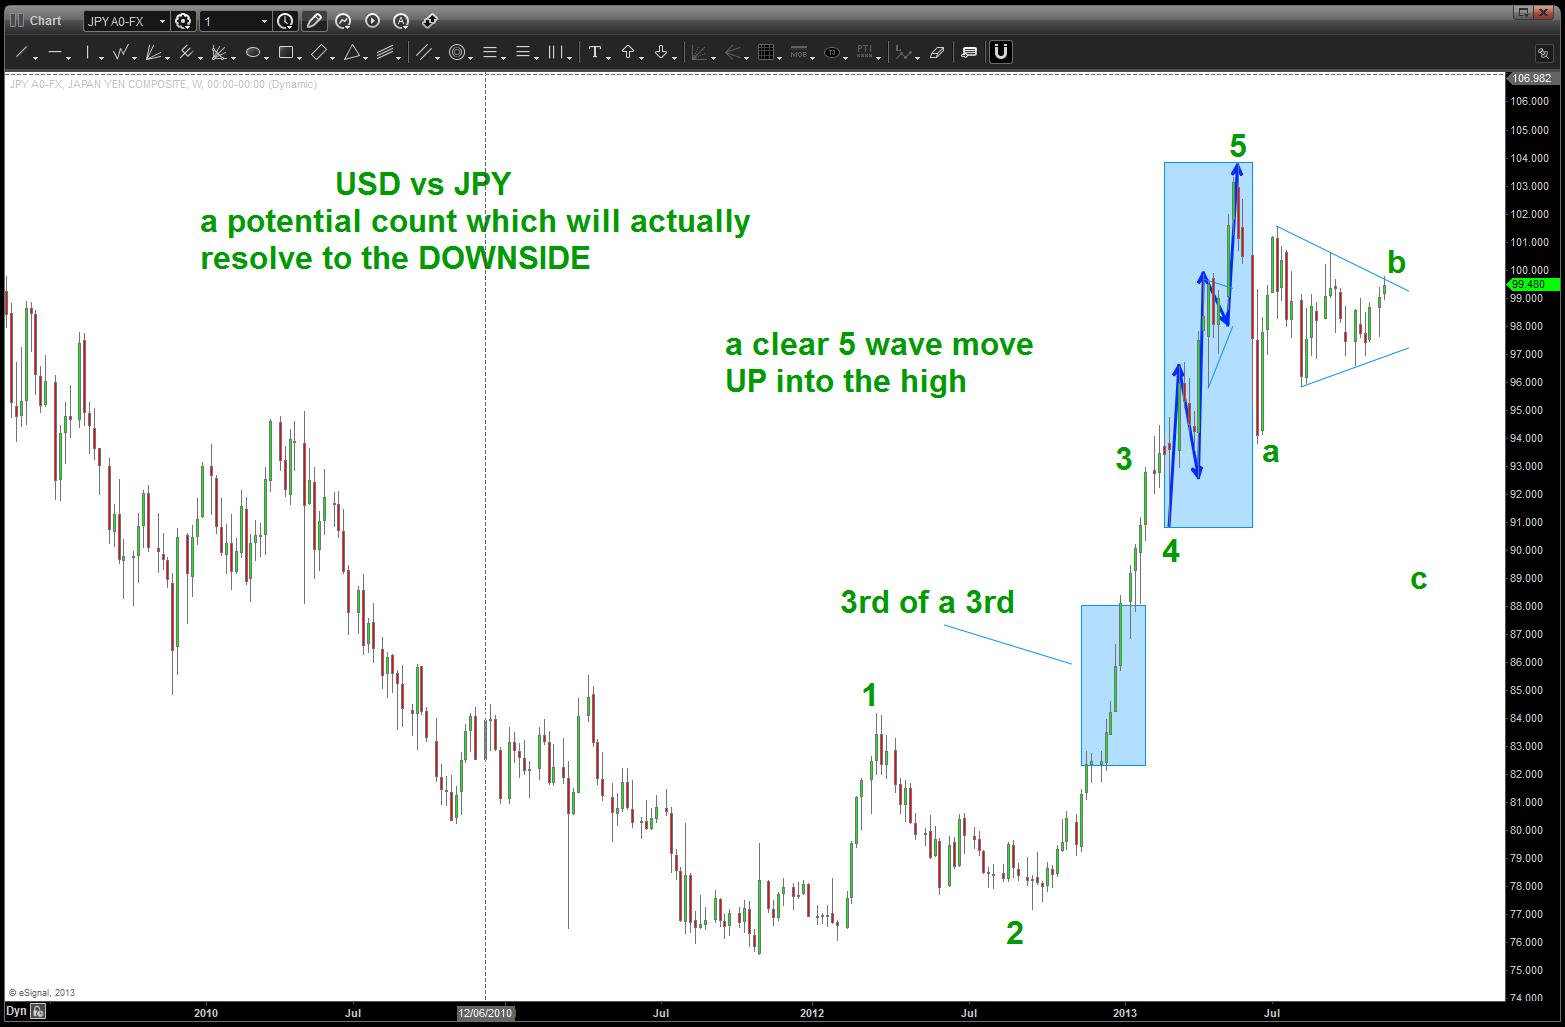
a bearish interpretation ….perhaps?
the issue here is the 4th wave .. with such a powerful move i would expect more consolidation. But look at the wave labeled 1 – the 4th in that move was a quick “bump in the road” and the 4th before the top at 104 is kind of a mirror image. perhaps forcing it, but is something to consider.
the last thing to consider is the CLEAR 5 WAVE MOVEMENT INTO the 104 zone. 1,2,3 triangle 4, 5 … quite frankly, why isn’t this count a possibility? especially if our ratio finds support and goes up some more to relieve the beating it has taken ..
just saying ….stay tuned.

“Good Golly Miss Molly” can hear momma call. Its so much easier to eat doughnuts and watch those stocks rise.
Rock on Bart
no idea what that means Bret. let me know dude and great work on your charts!
Excellent work,really impressive didn’t know what to say except good golly. This is the best presentation on currencies I ever seen. I like that you also threw in a ratio of Gold. Once again I’ve never seen currencies presented so well.
When I was in the Navy Krispy Kreme donuts were delivered by the truck load while we were in port. I bought DNKN and regret not buying KKD too. Anyway my reason for buying the stock wasn’t technical.
Rock on Bart
Bret, thanks and I really appreciate it. Currencies rule the world and are the biggest and most liquid market out there at, estimates, 3 trillion/day. the YEN and it’s cross rates are really really important right now. Bottom line – is Japan out of the deflationary thump of 20 years? guess we’ll soon find out … keep the chart work coming!
Pingback: USD vs JPY redux | Bart's Charts