Dow Jones Transports and the Major Seventh …
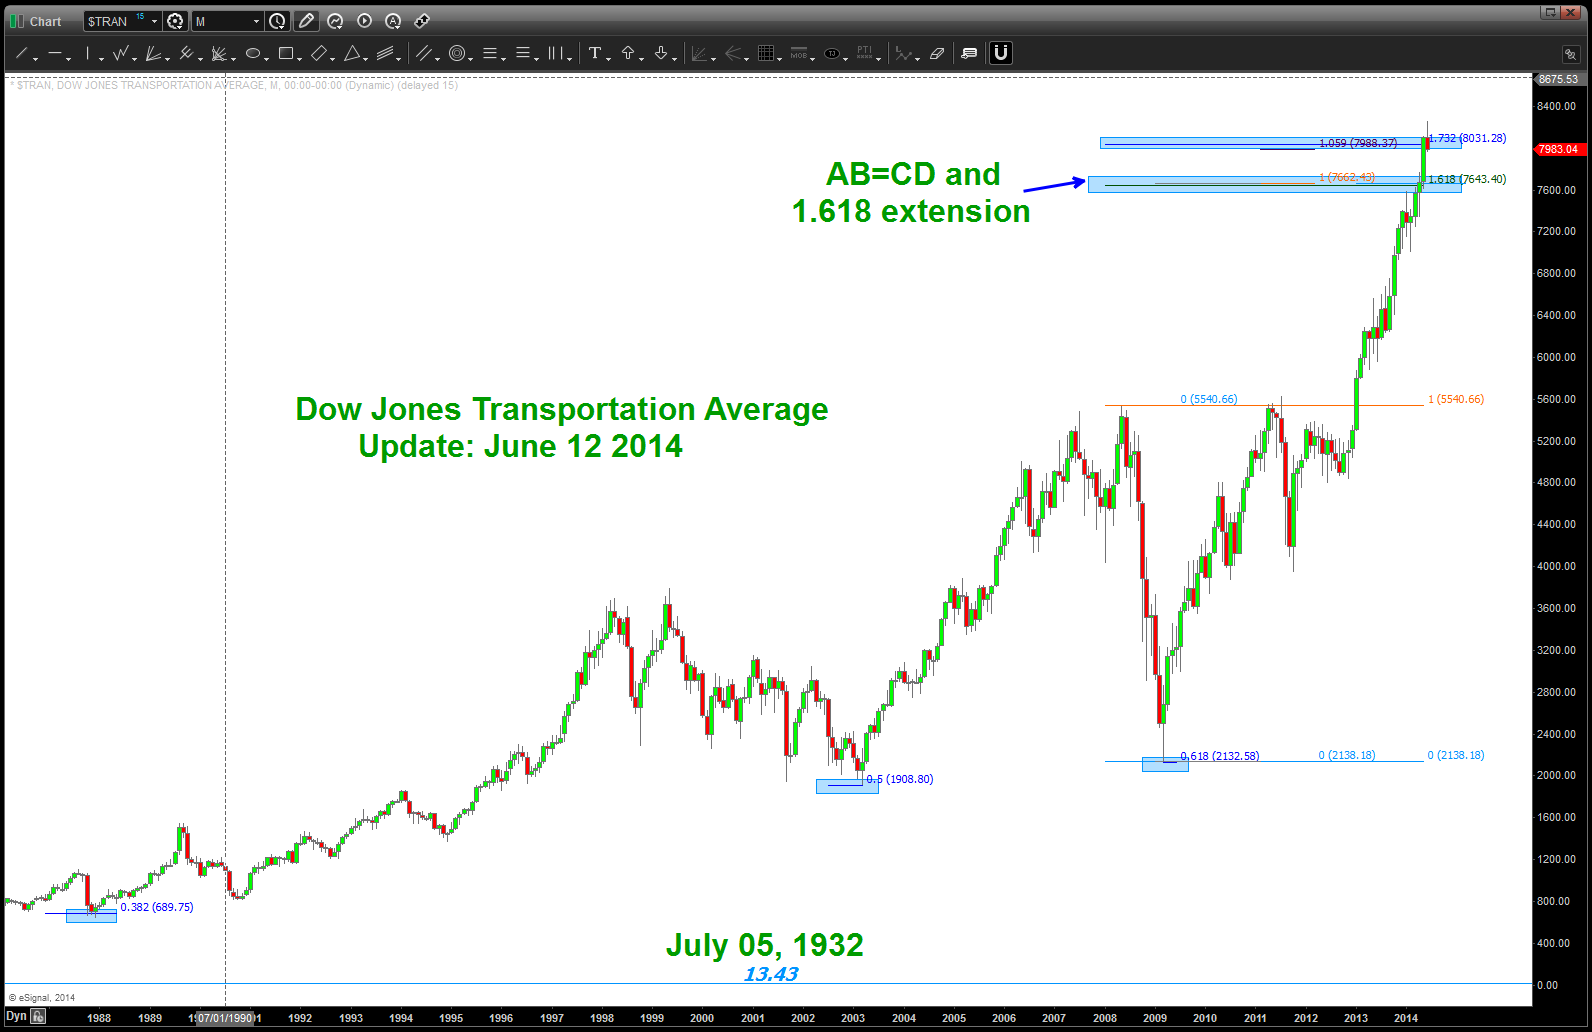
CLIFF NOTES: more than likely, you saw my long term transports post a couple months ago and as this target got attacked I was truly looking for a “little” resistance. I mean, come on, it was the ALL TIME LOW to the “old” ALL TIME HIGH and we have a 1.618 extension RIGHT ON TOP OF THE LEVEL. As patterns go .. this was a doozie. However, as patterns go, it failed. Folks, it didn’t even put up a fight …
so, I hit “erase all” on the chart and, quite frankly, left it alone. the joy of patterns and charting …
I went back to it tonight and I still think we have a pattern forming so I went back and said “self, what did it do the last time we surged past an old high and into a new high? Well, guess what? It surged thru the 1.618 extension in 2007-2008 an stopped on the 1.8877 extension! TILT … 1.8877? Well, that is exactly a major seventh ration in the equal octave scale of music. So .. perhaps it did that again? Please see below …we smacked into the minor and, quite frankly, the major is still out there. However — this sure looks like a MONTHLY 3 DRIVES TO A TOP pattern.
Keep the mindset (defensive) of ‘breaking a swing low’ …until we do break a weekly or monthly swing low this puppy will still keep running but if we break 2 or more weekly swing lows … we could see this thing drop to the old highs at 5600. Stay tuned …
What a run! Hugh?
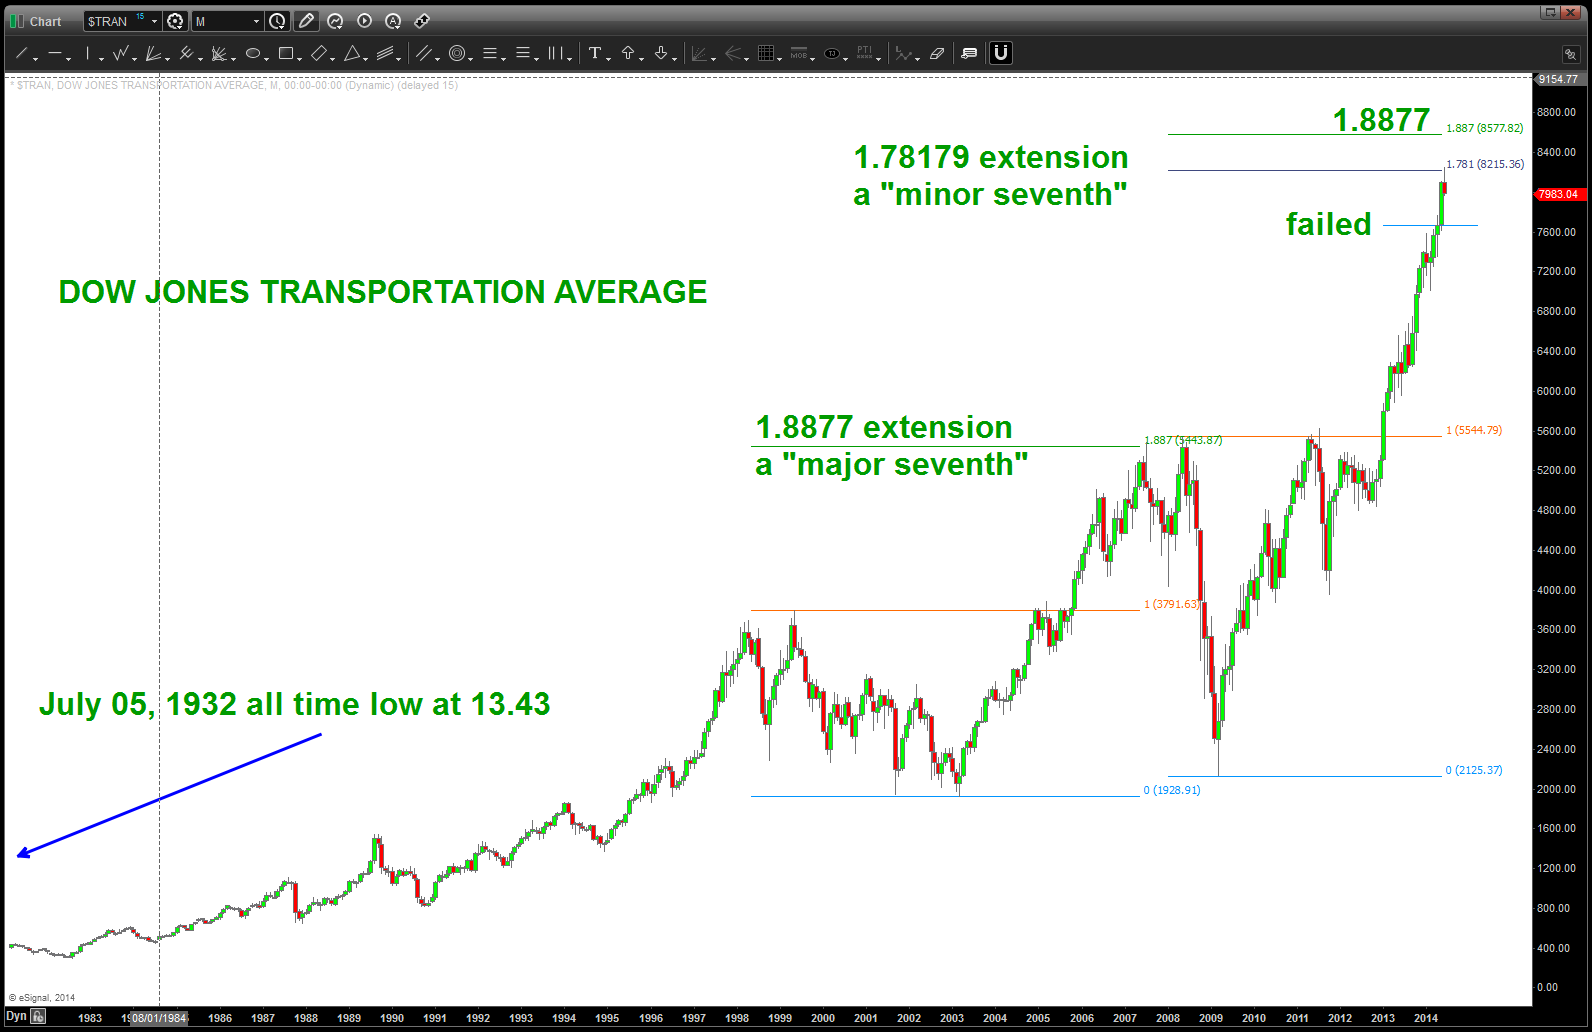
Also, please be advised that a reader corrected me on the price and time of the old time low. I did some more research and it appears the low was in the 1930’s around 30 points lower than the one in the late 1800’s. Negligible when we are up at 8000 BUT extremely important.
When you look at the Yahoo Finance Chart below – try to disregard this is the entire life cycle of the Transports – and just look at the symmetry of the 3 drives to a top pattern that is appearing.
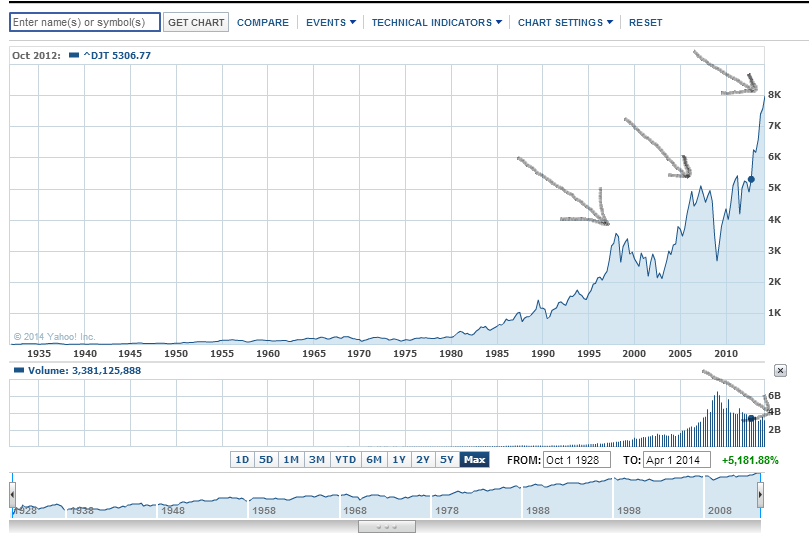
notice the decreasing volume and POTENTIAL 3 drives to a top
