Last call .. shots of XLE being served at the bar!
CLIFF NOTES: a picture does paint a thousand words. So there are some pictures below. I’ve included the chaos that was 2009 just to demonstrate that, guess what, at the lows in 2009 a BUY appeared on the XLF (Financials) and guess what … when I was Chief Technician for the When 2 Trade Group we put out a piece to BUY THE XLF. Did anyone in there right mind want to do that …? Of course not. Same reason why NOBODY in their right mind wants to sell out and miss any of the last couple percentages of this run.
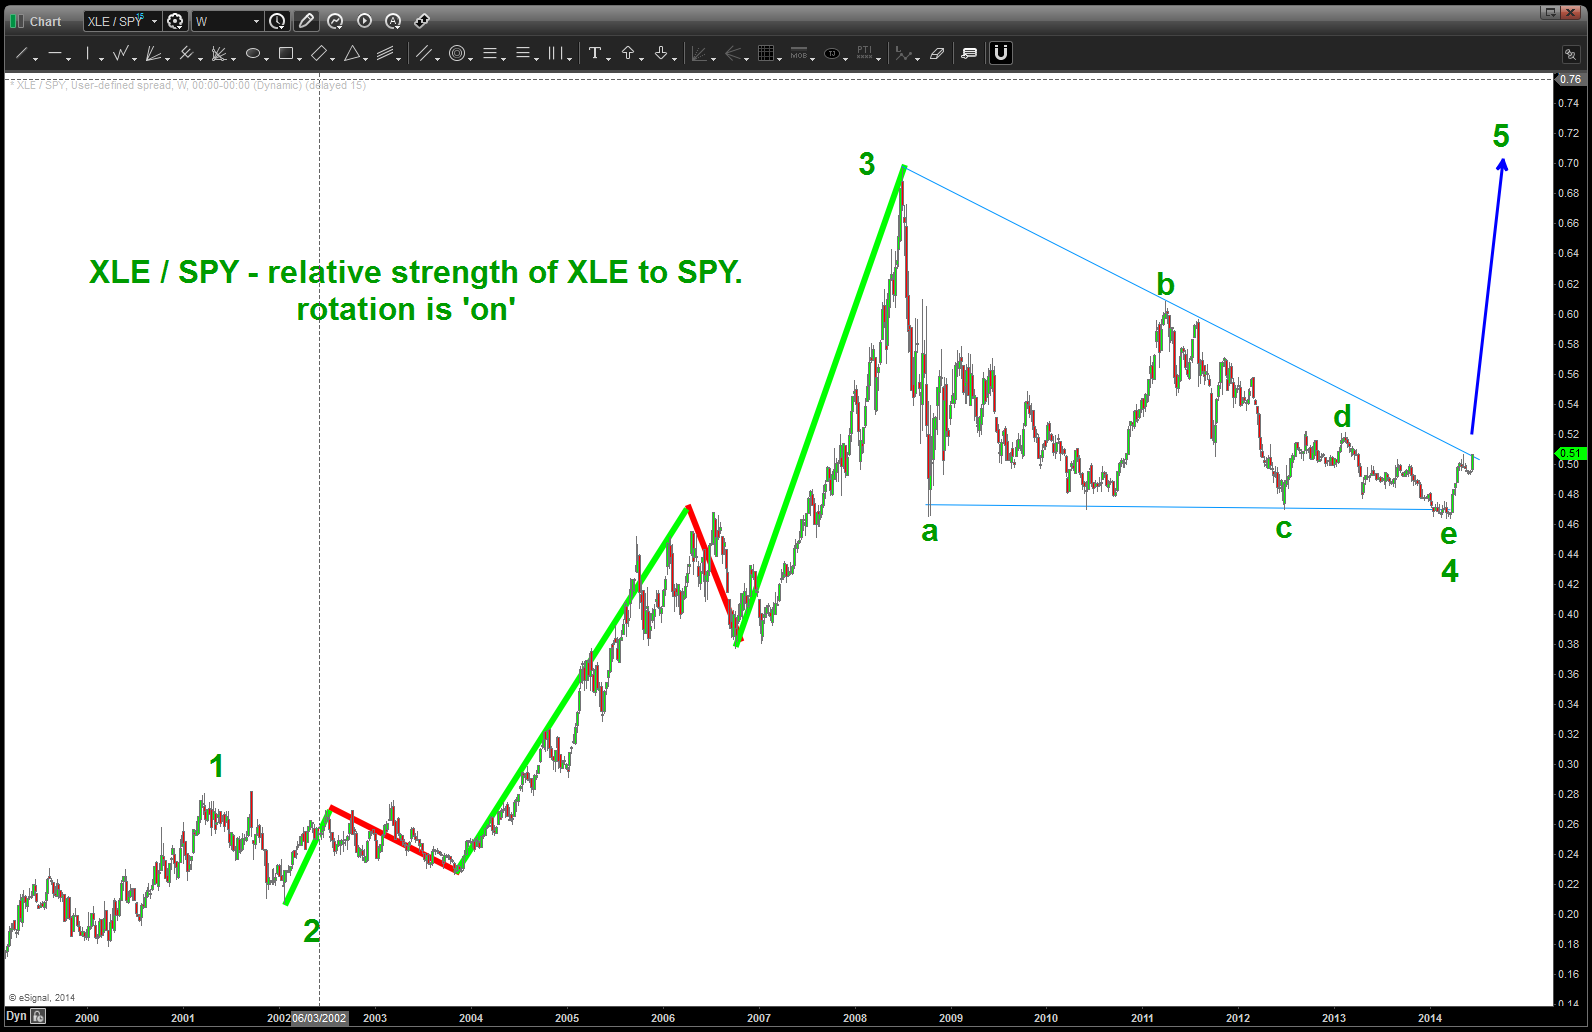
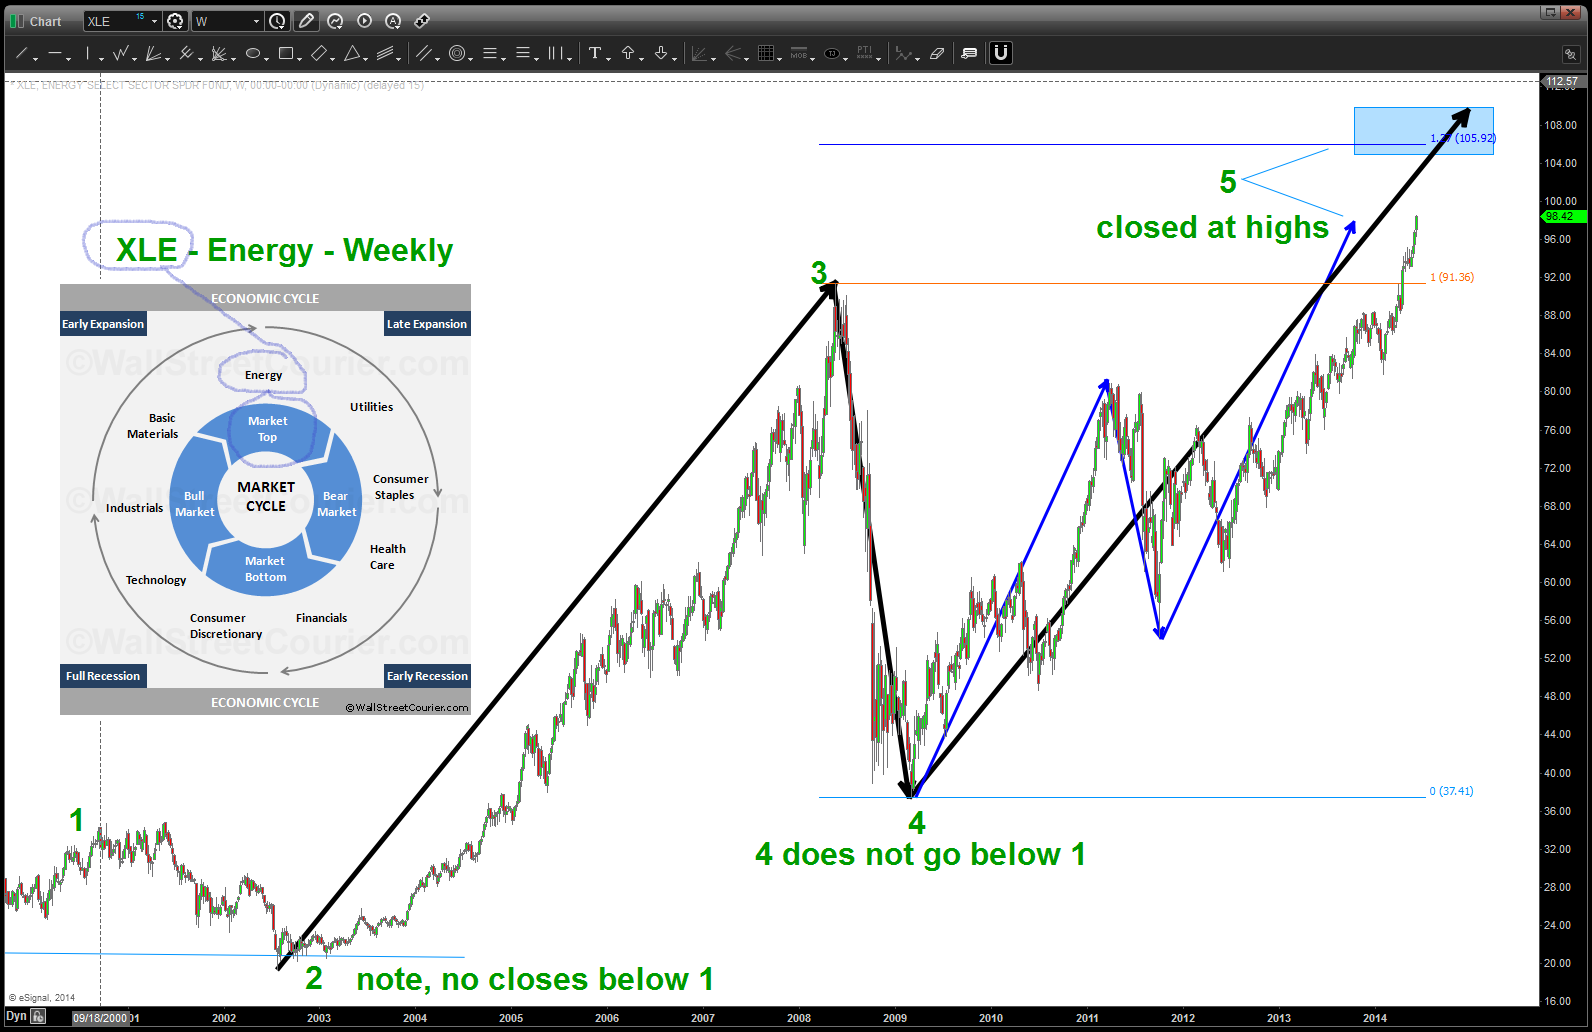
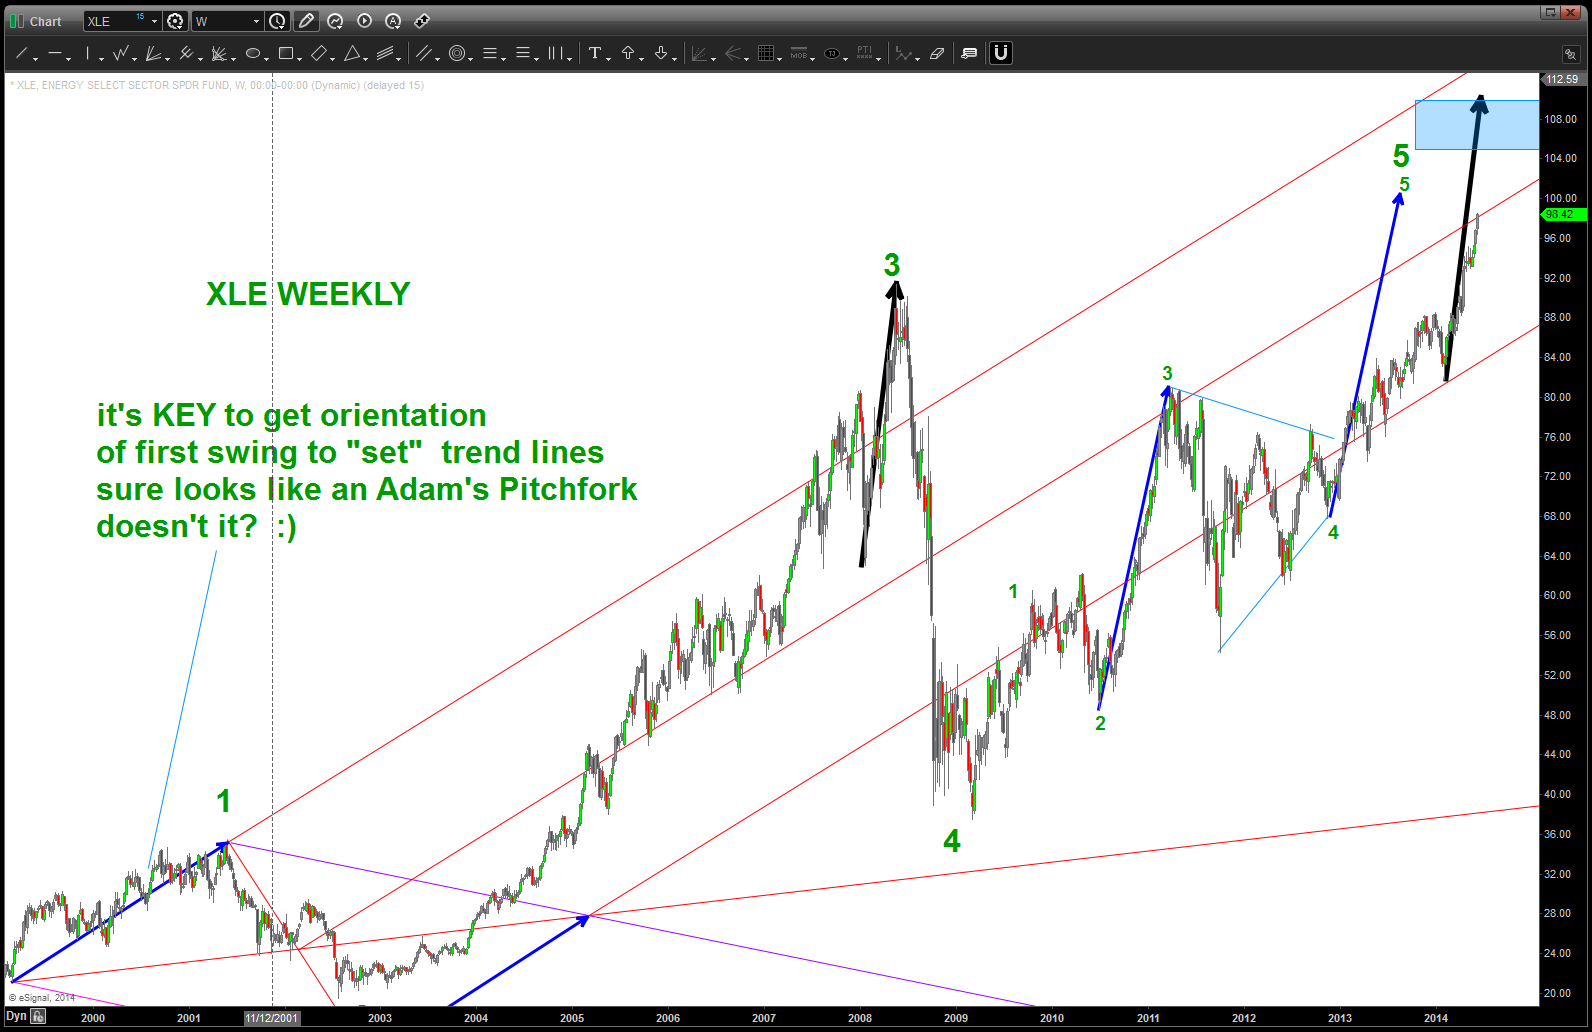
CLIFF NOTES 2: if you look at the count below, do realize that 2 does go below 1 a couple times BUT NEVER CLOSES BELOW. Folks, that’s good enough for me. Then we roll thru wave 3 not being the shortest and 4 not going below the end of 1 and all RULES are satisfied for this count. What’s that tell us? A good case can be made that we are in the 5th wave for the XLE. And, w/ the sentiment at RECORD HIGHS and the IRAQ situation and the blah blah this puppy has the potential to explode like a shake and bake handshake!

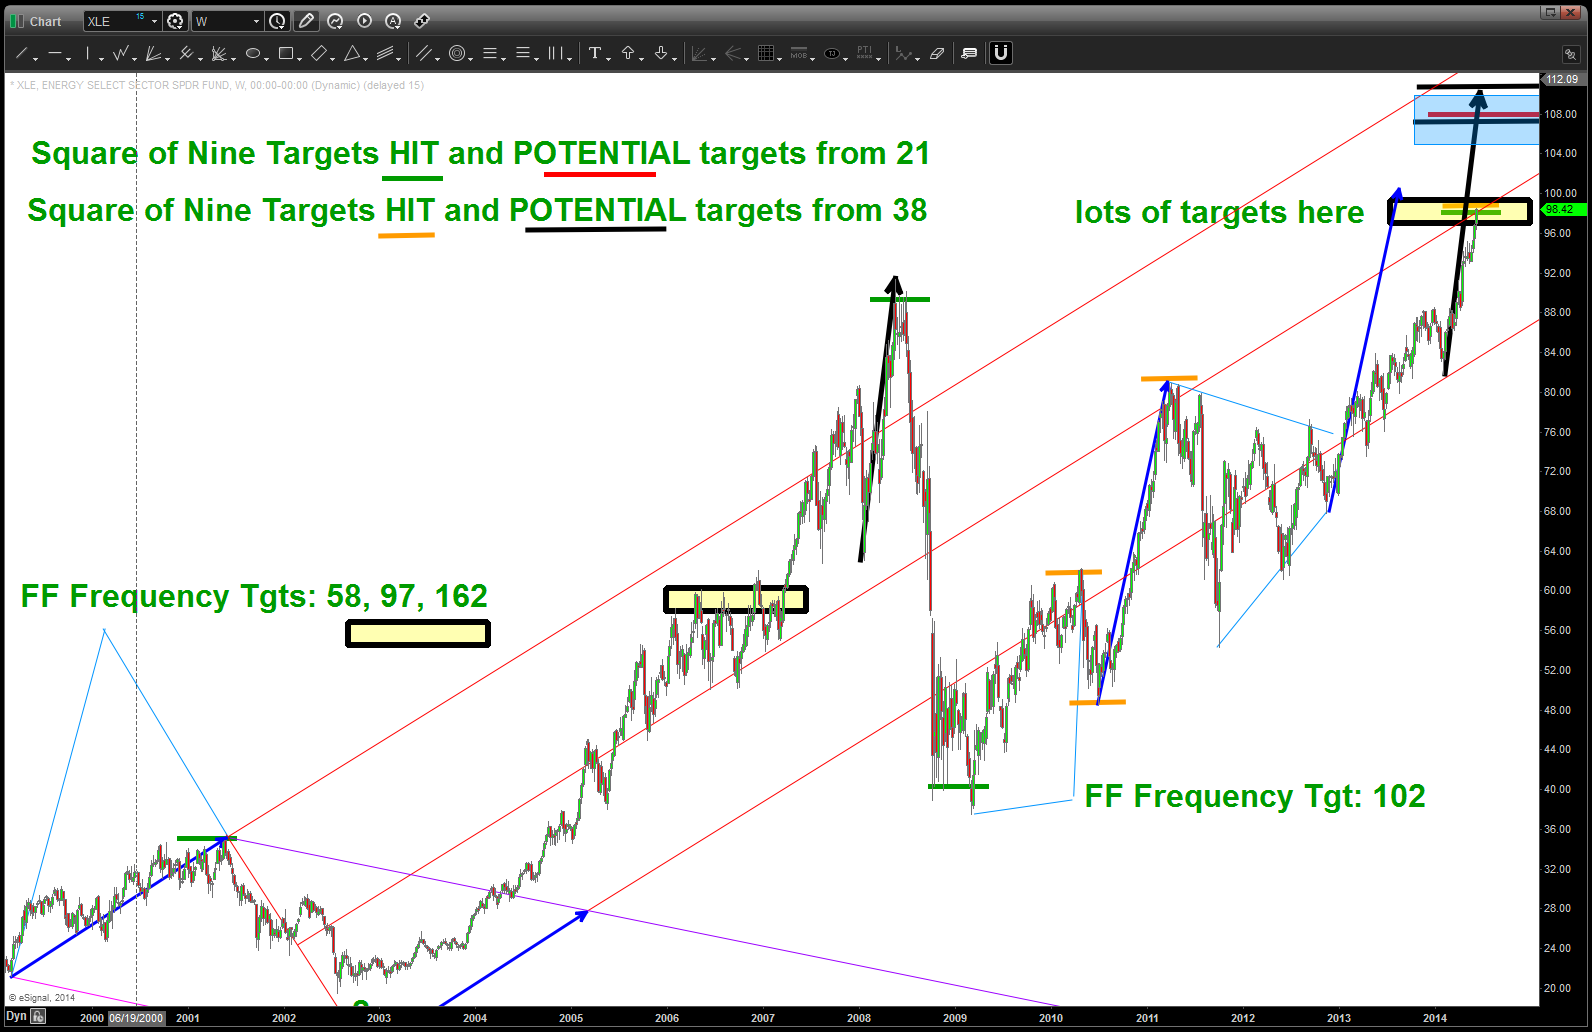
CLIFF NOTES 3: our minor target is hit in/around 97-98 and closed at the “high range” of the weekly candle. That usually denoted strength so we can “assume” the higher target in/around 105-110’s is in play. As far as patterns go … that one is a very nice LONG TERM pattern. If/when XLE does top it will signify the circle of life w/ regard to sector rotation is complete. WATCH THIS TARGET AREA.
CLIFF NOTES 4: go back and look at my “Swing Low, Sweet Chariot” post a couple weeks ago. Swing lows need to be broken before any bull should throw in the towel.
Enjoy the weekend and Happy Fathers Day out there to any fathers out there.
Bart
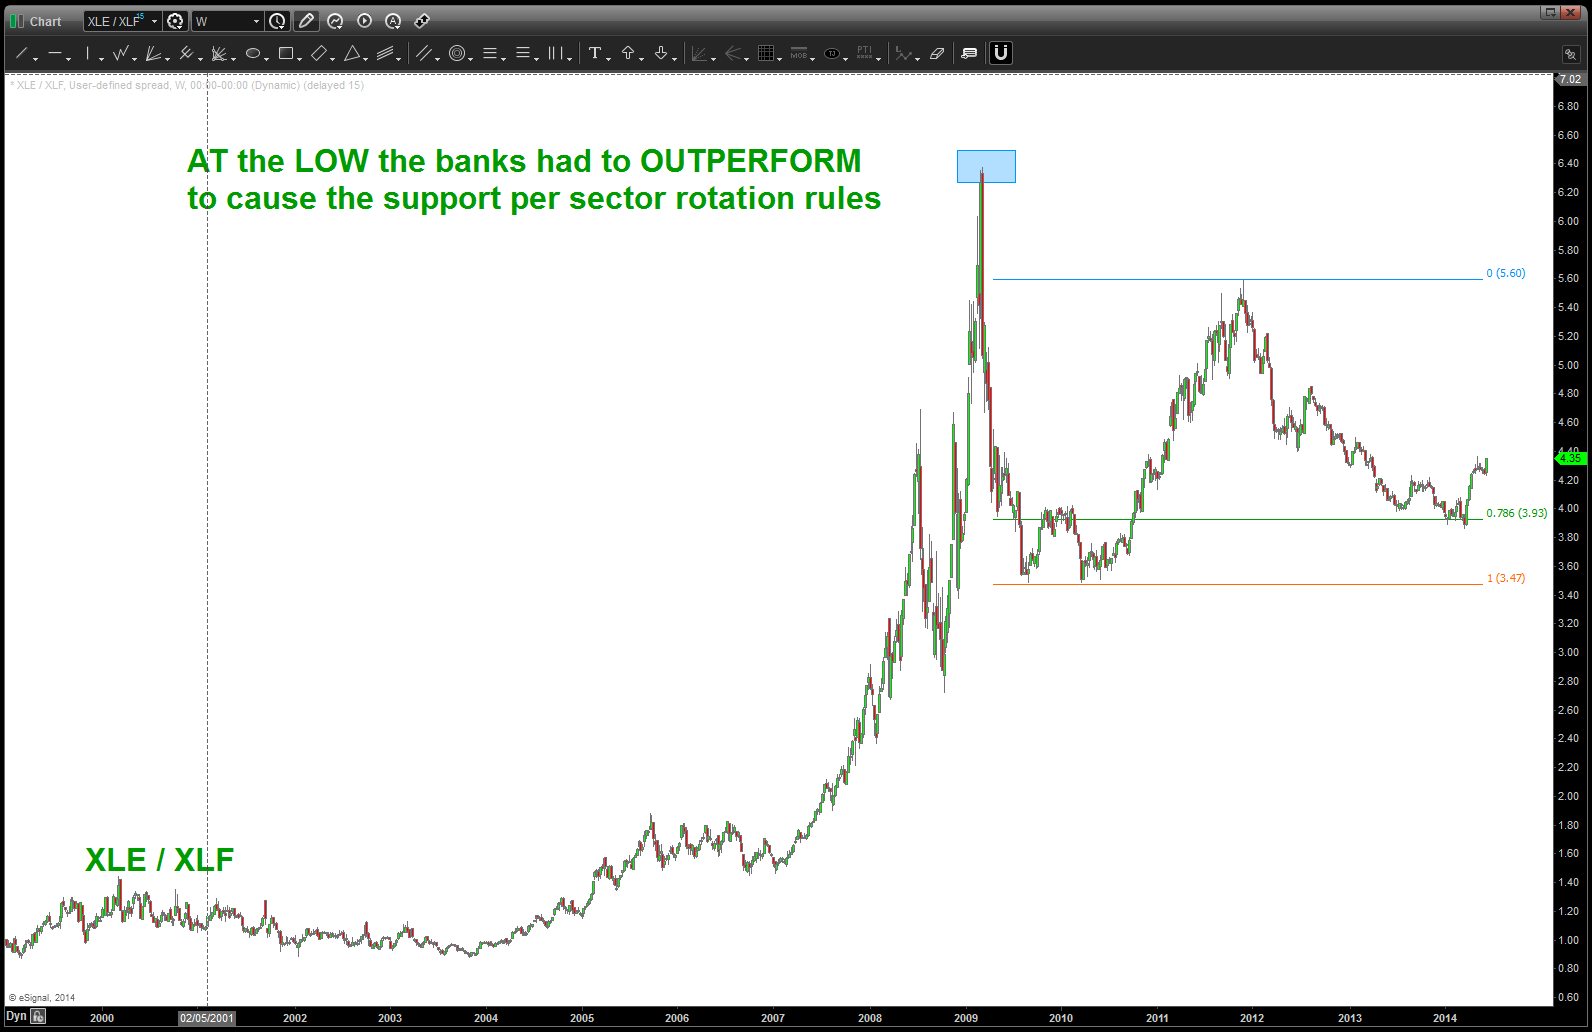
Here’s the XLF Recommendation. NOTE THE DATE! 😉
W2TG Tech Rating Chg XLF SB030309
Here’s the PATTERN and the picture as it appeared on March 03, 2009. Note, the CLOSE was 6.18. (.618 for any of those Fibonacci challenged)
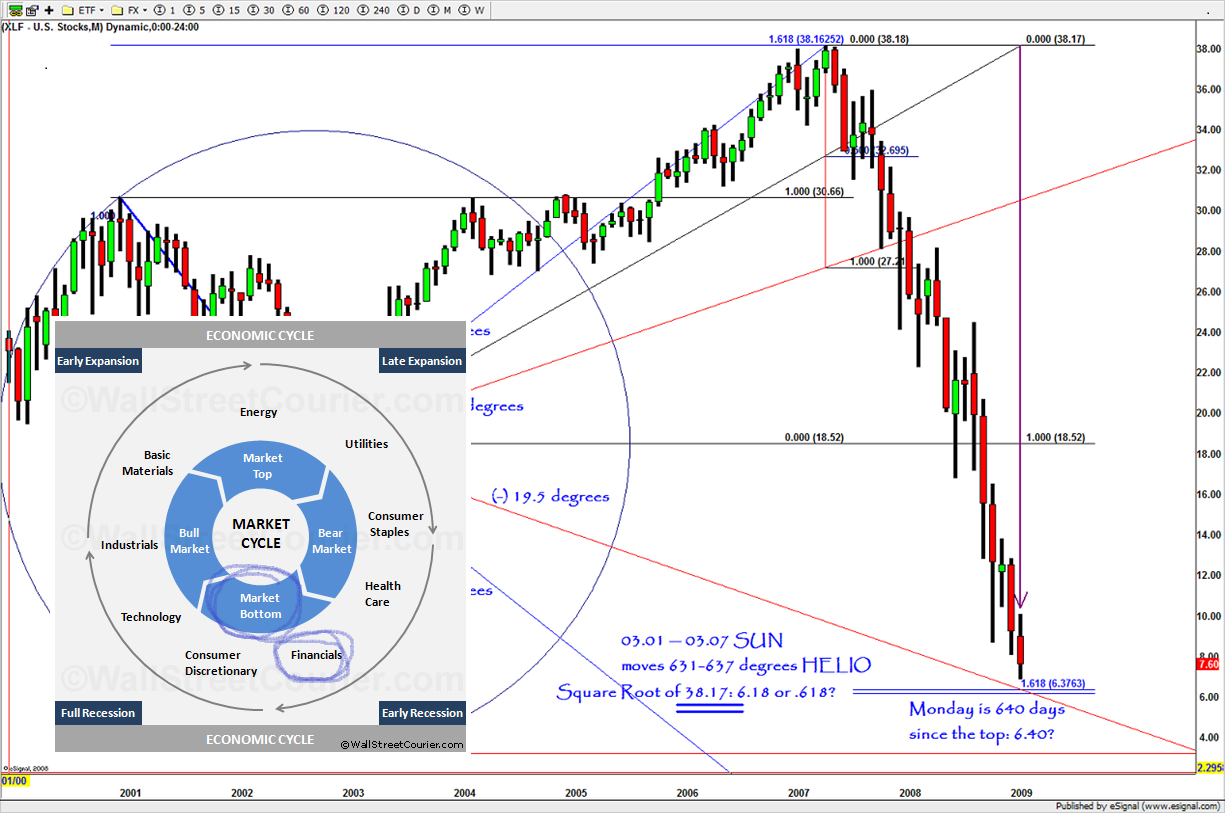
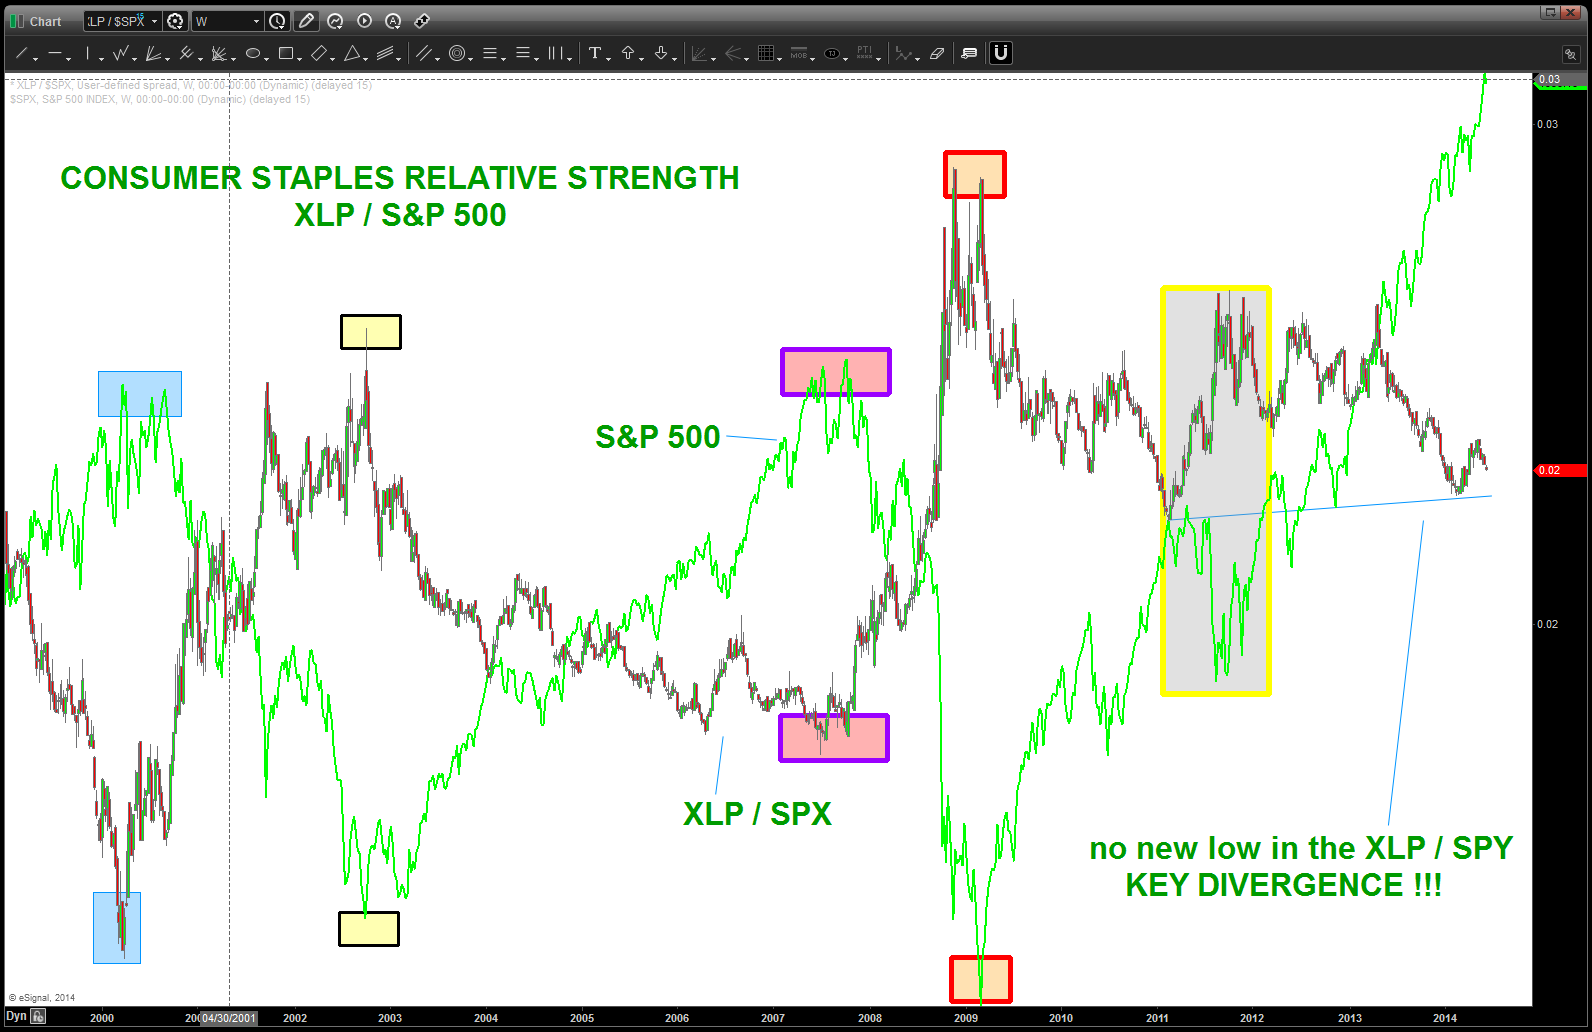
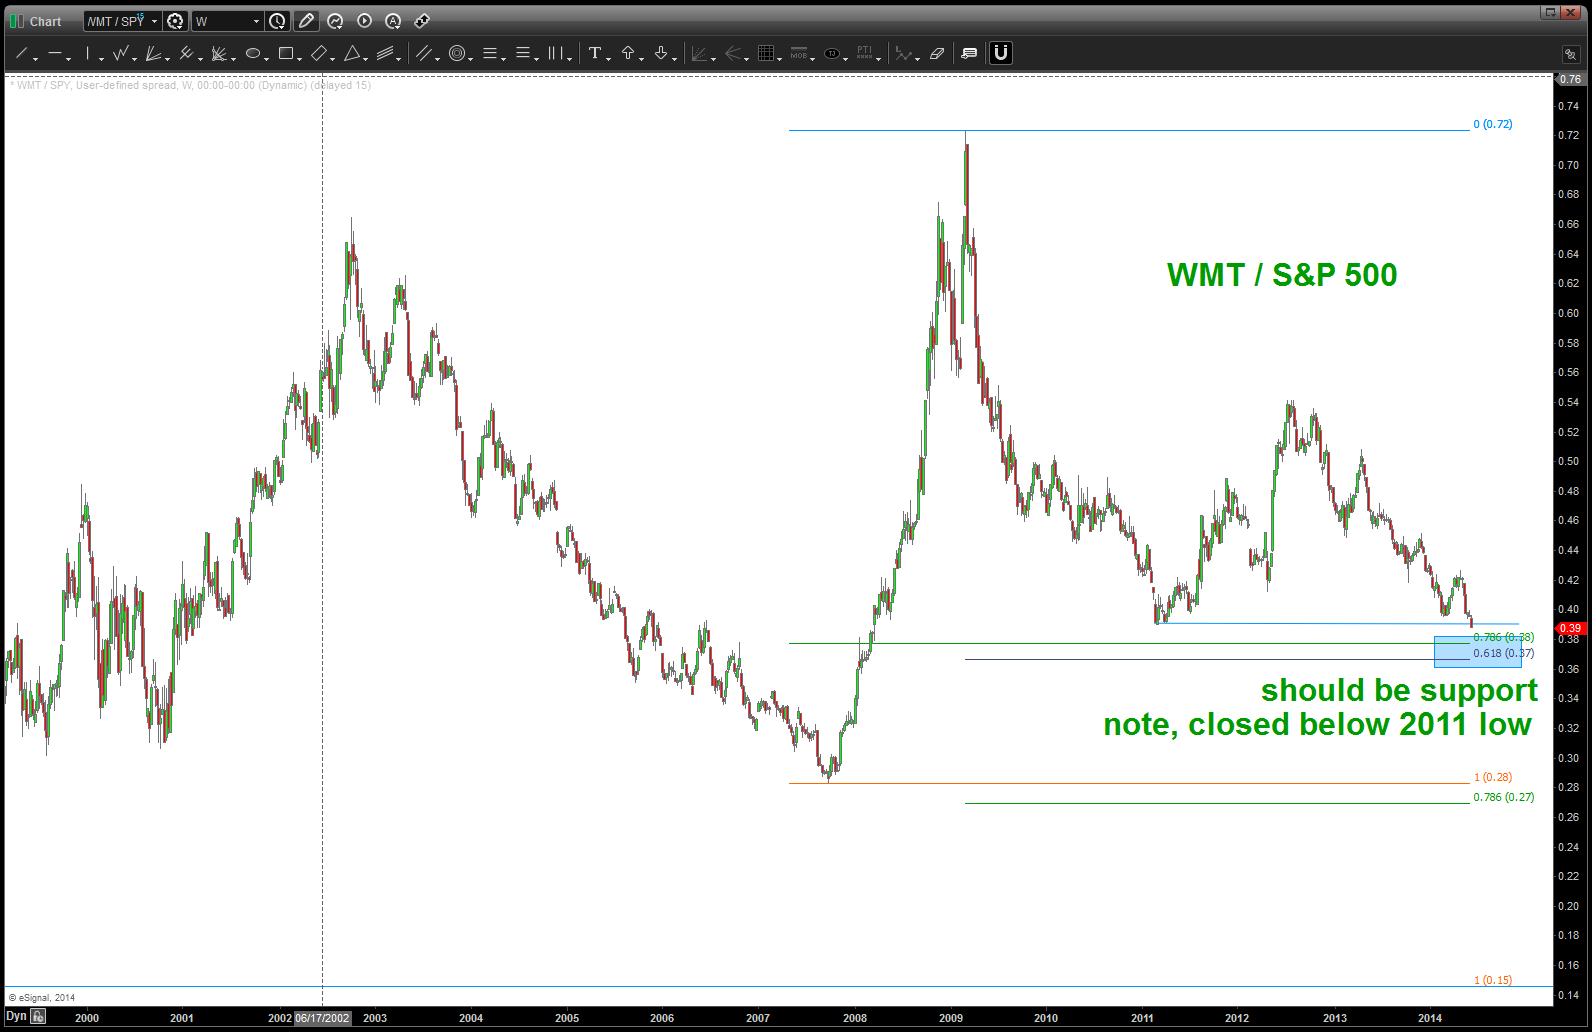
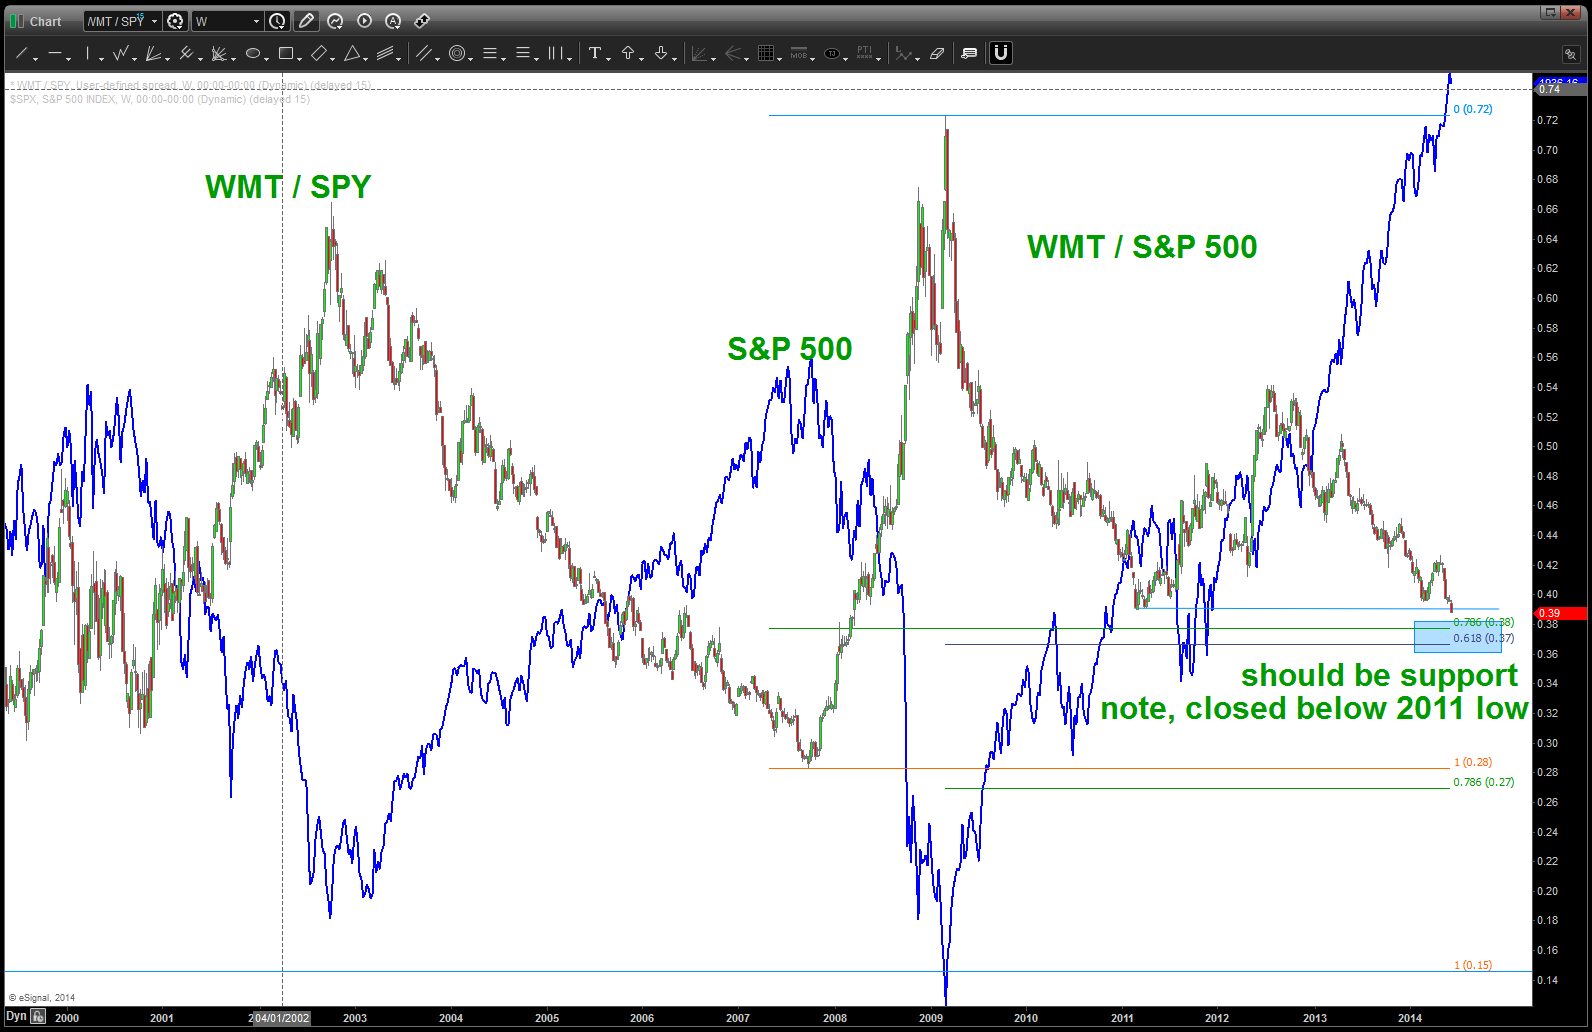
XLF and the importance of sector rotation.
here is the picture now, note where XLE (Energy) sits in the sector rotation model:
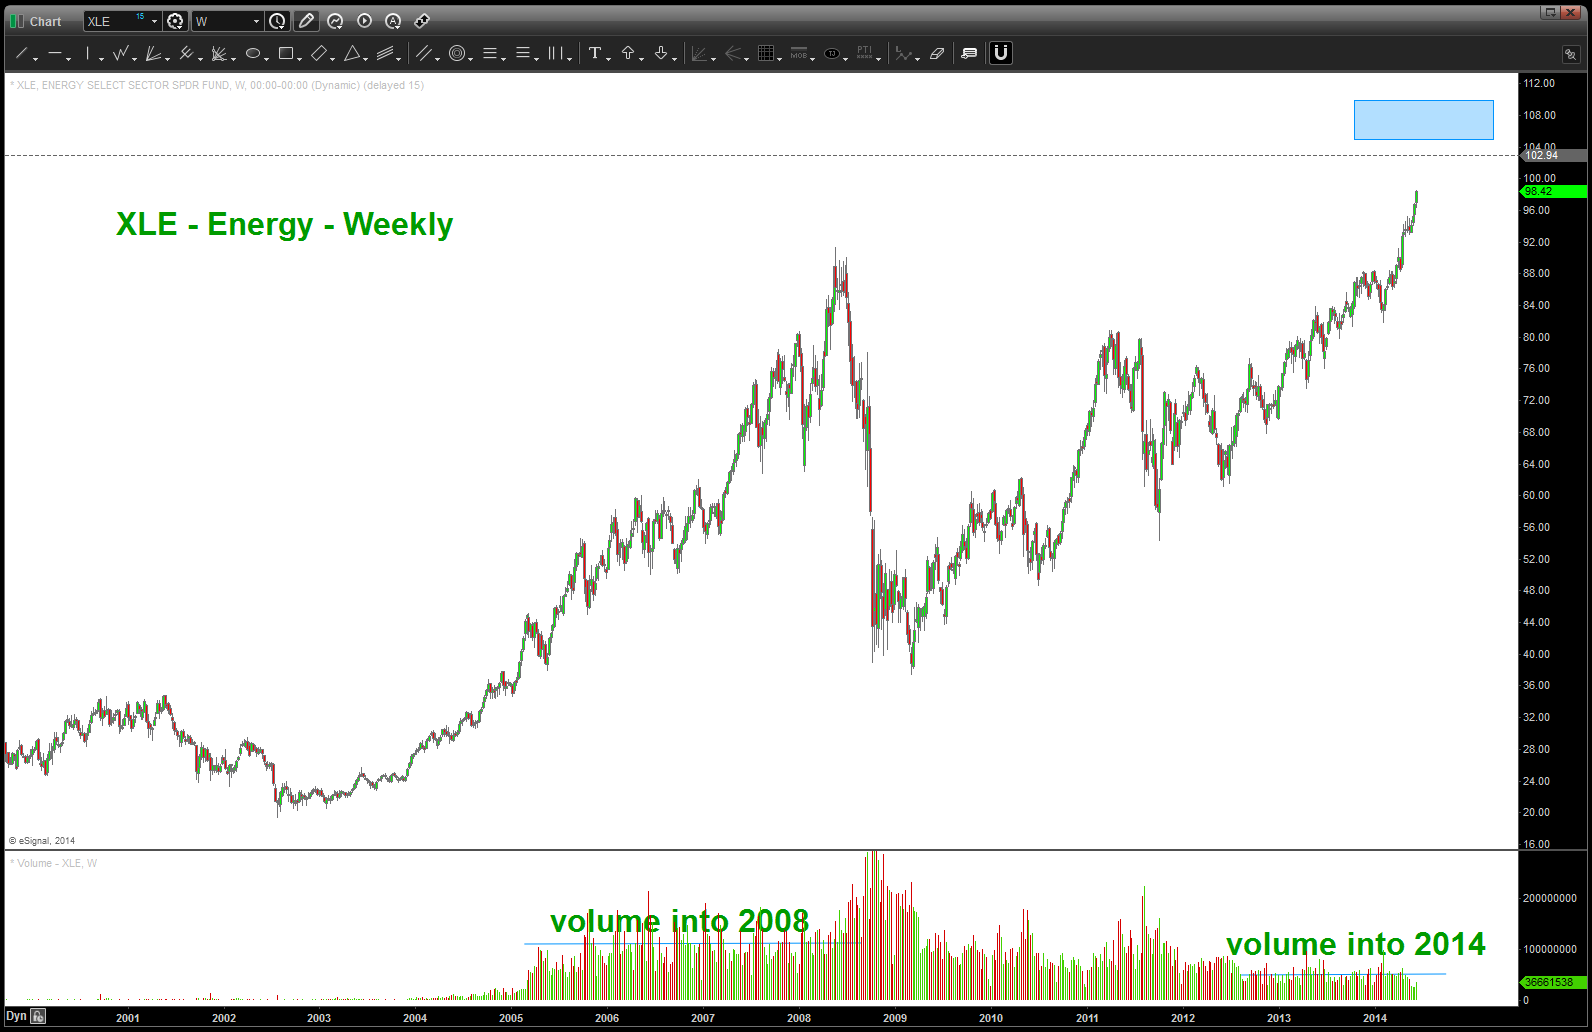
some more chart work on XLE, key here is notice the volume below is significantly lower than the march into the highs in 07-08.
here is our good old RSI ..a work horse in any technicians tool kit. NOTE – and this is probably our biggest “hint” of things to come – NO TOP IN THE XLE HAS BEEN MADE SINCE IT’S INCEPTION W/OUT THE PRESENCE OF BEARISH DIVERGENCE. Does that mean one of our targets can’t get hit and it falls like a stone. NO. But the PROBABILITY is in our favor that the XLE will hit a target, back off and drive the RSI off it’s highs THEN price will go up and seek a new high and the RSI will fail to make a higher high and THEN we can look for major inflections. Also note – in 2008 it took 8 weeks for the XLE to top and finally crack. In today’s day and age of texting, twitter, digital addiction can you sit on a position and get chopped up for 2 months waiting? Probably not …
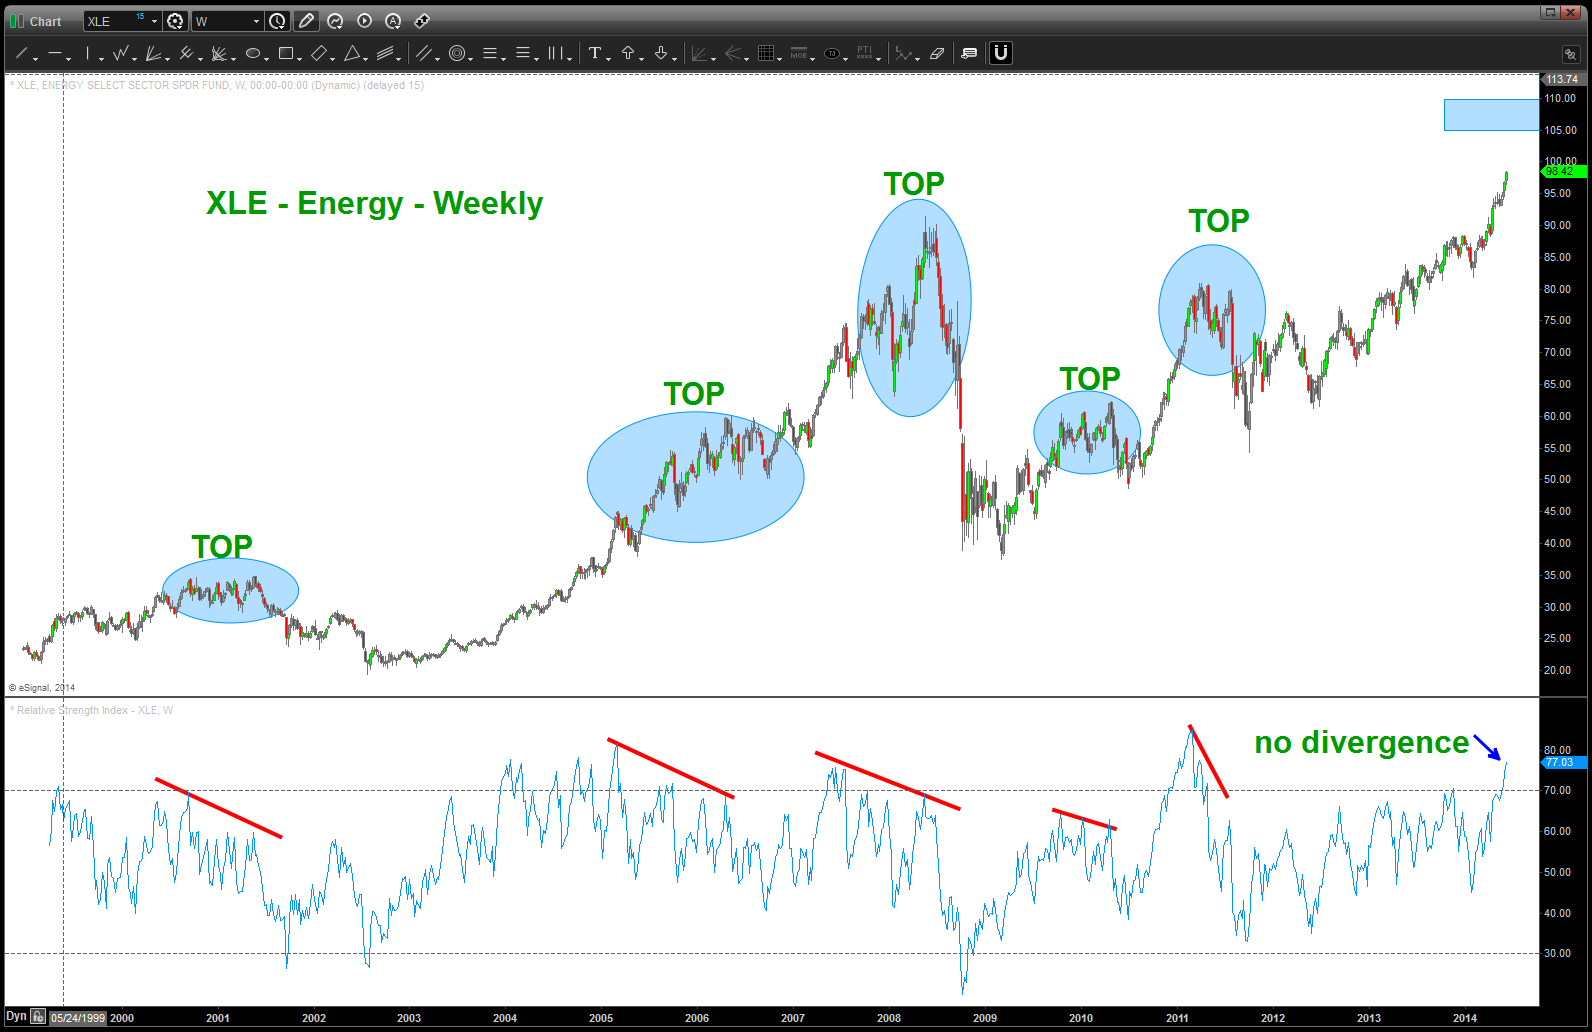
RSI on XLE – note divergence is usually present at inflection points
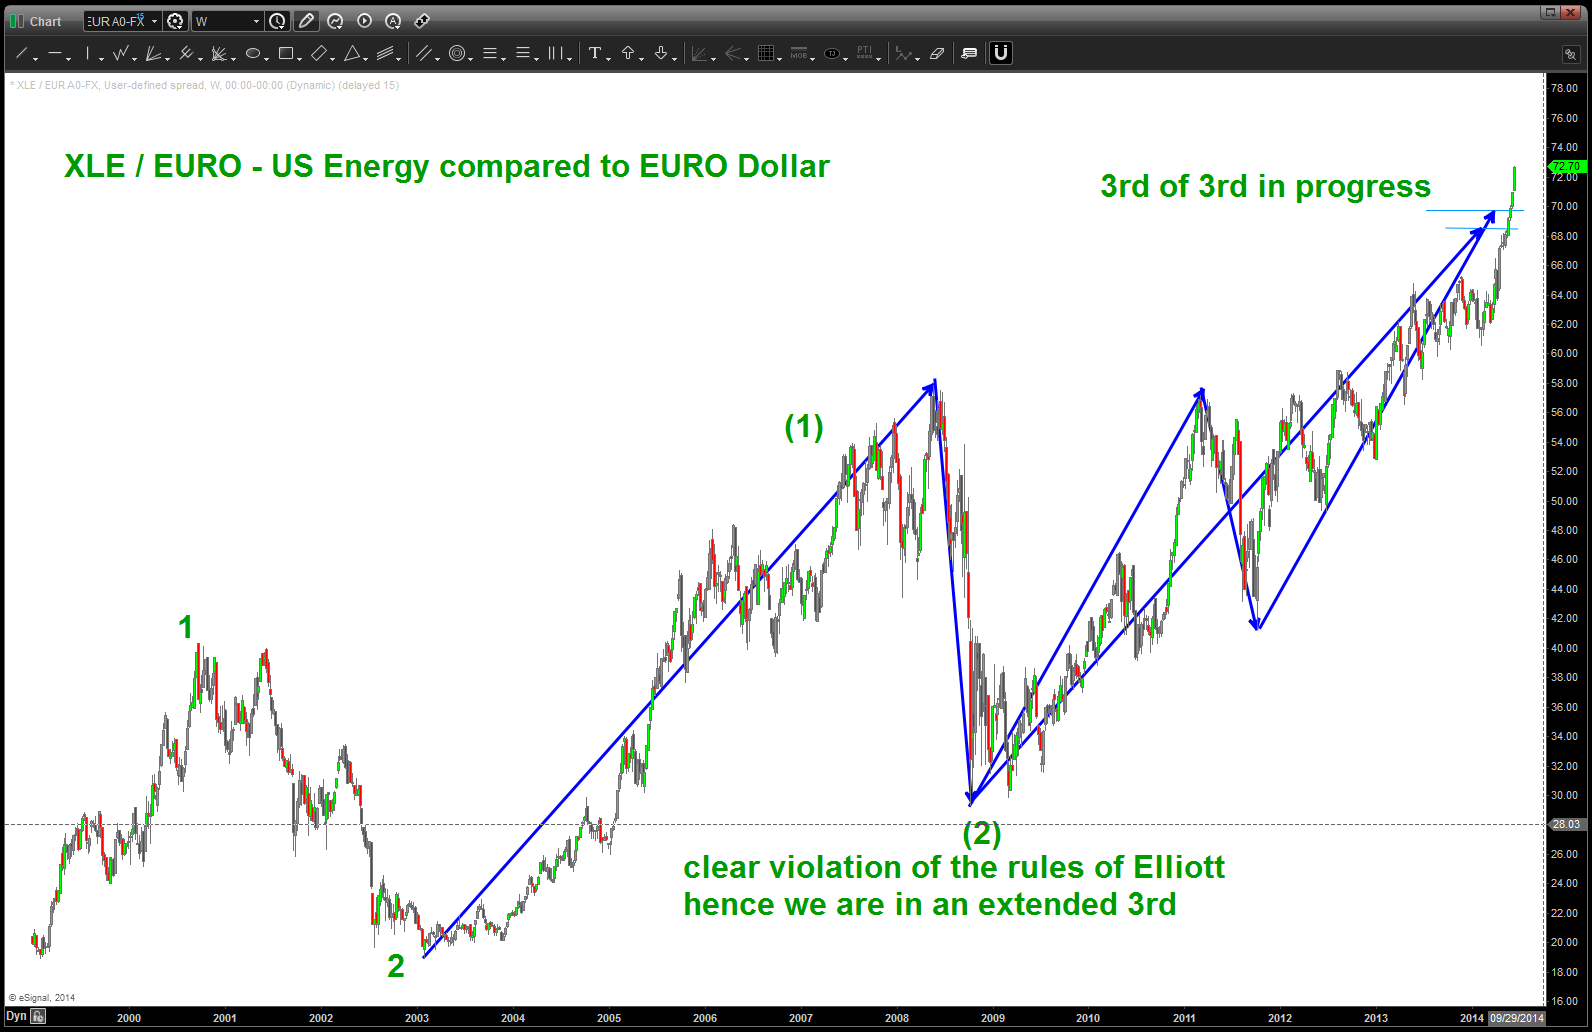
BE PATIENT … full disclosure I have been waiting over a YEAR to short the EURO. Just my style and I know once I jump into the cage w/ the gorilla’s juggling dynamite the die is cast, so to speak.
My former business partner and friend told me his grandfather offered sage advice …
“in this game, you need to just SEE and FEEL that there is money in the corner and you just go and pick it up.”
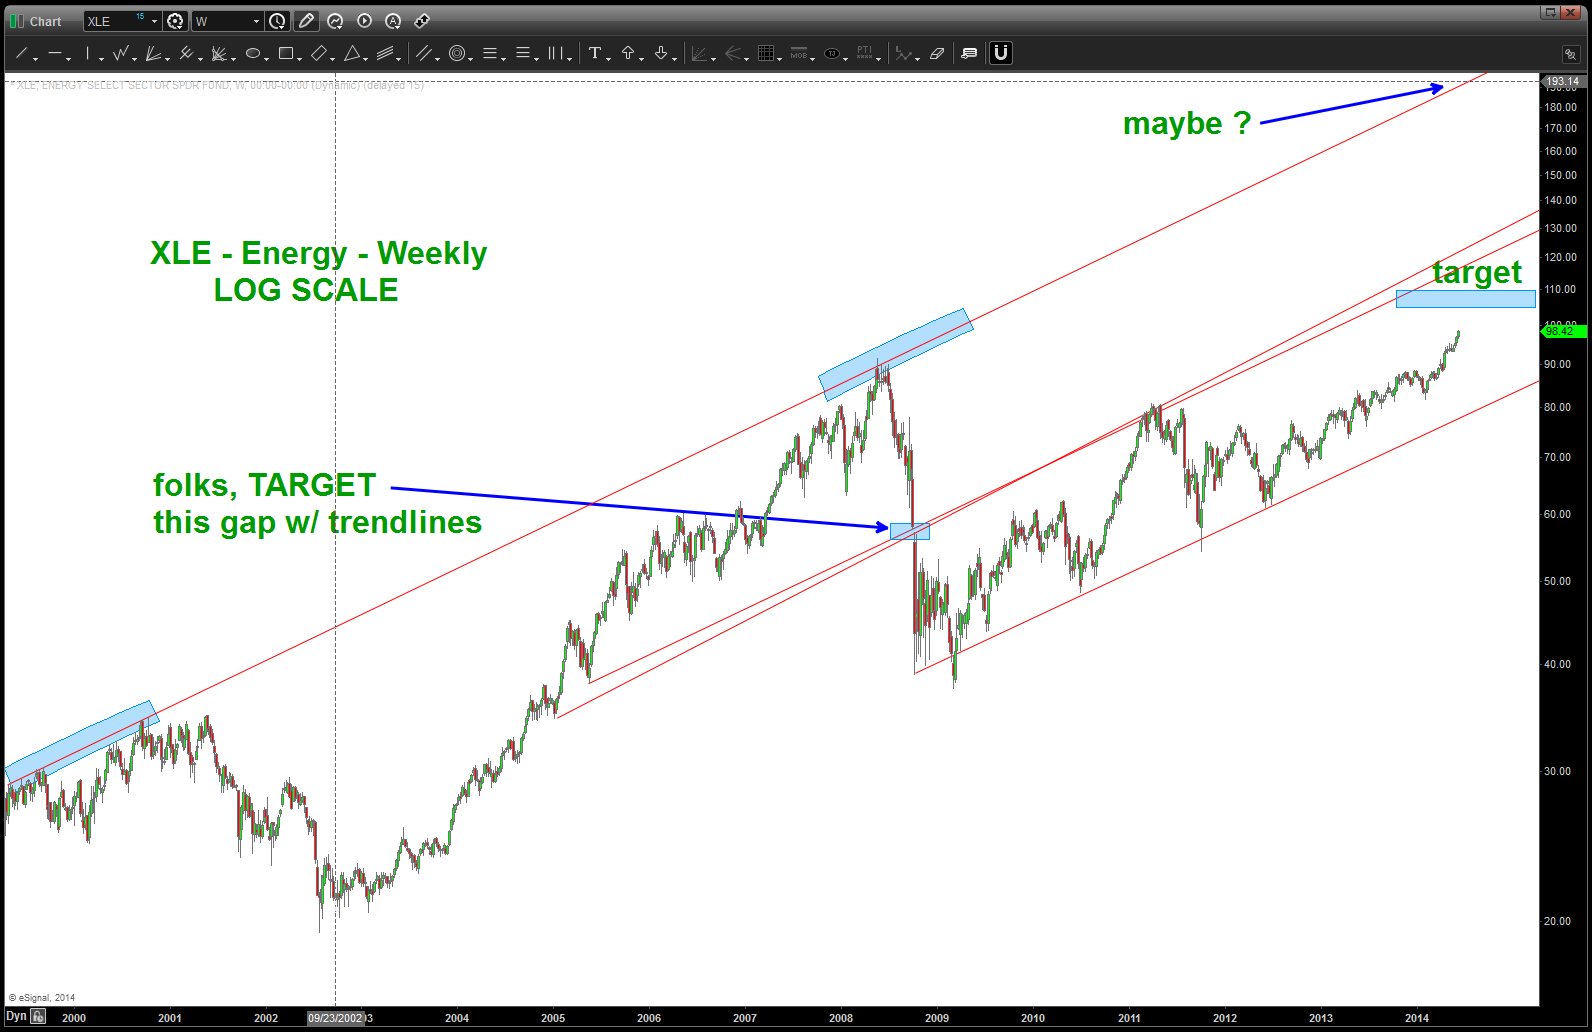
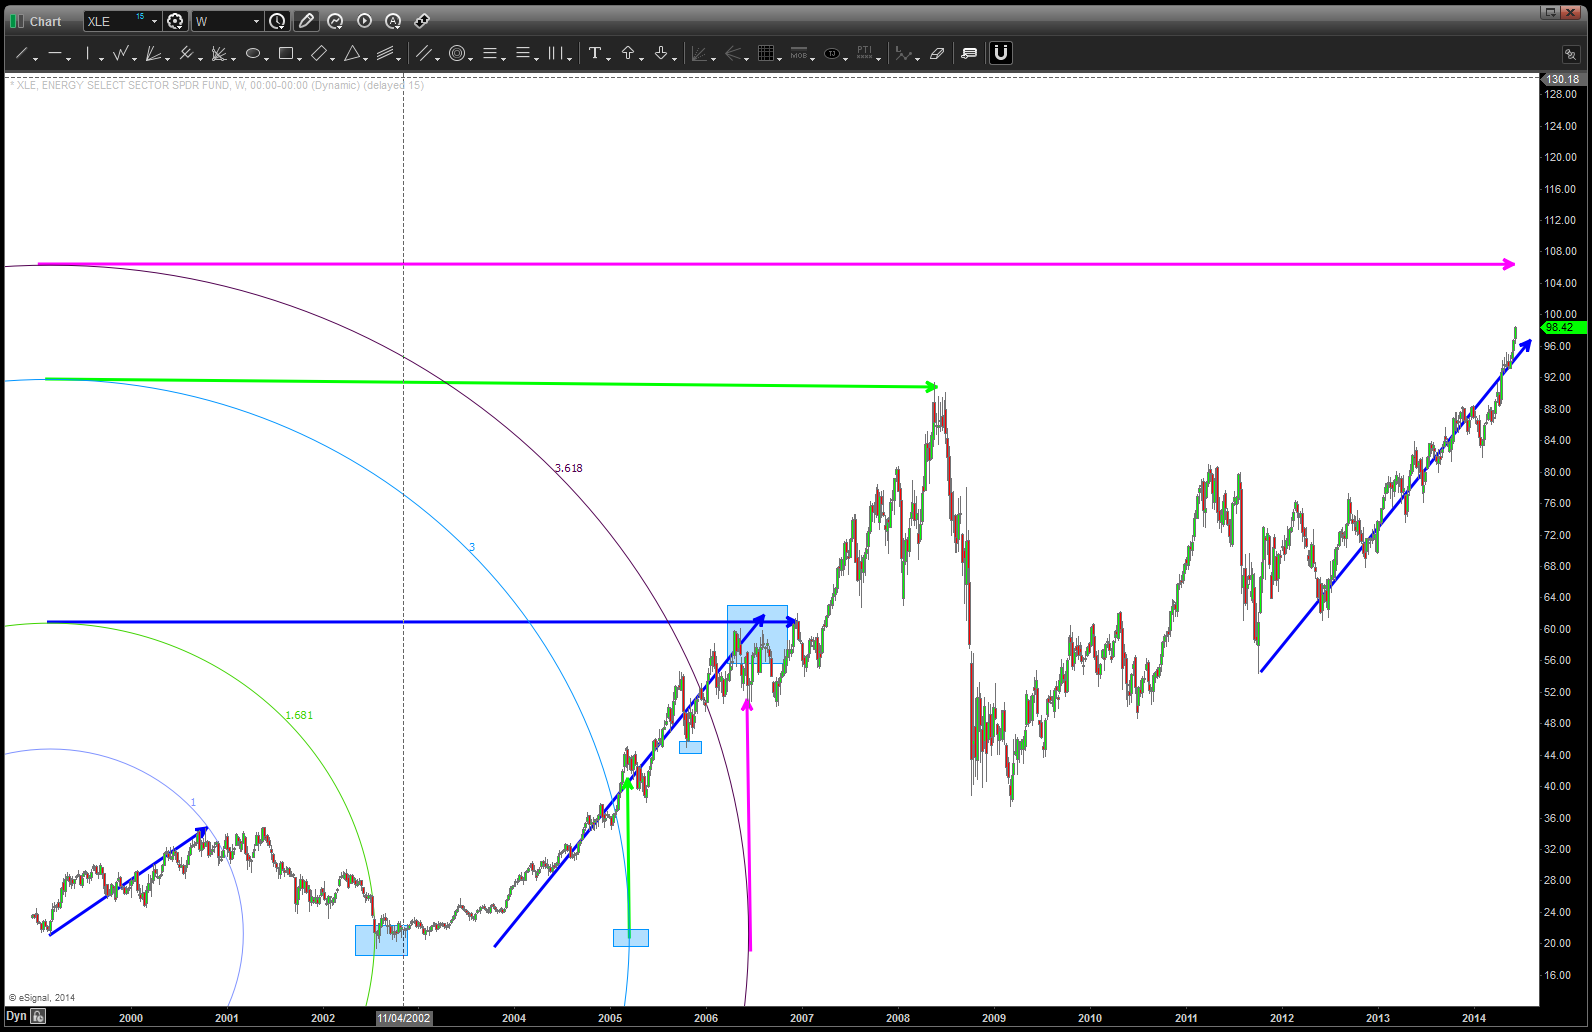
XLE LOG SCALE
Here is a “quick look” at the trend lines and rhythm of this security. Note, the key to the entire thing is the first impulse move UP from the low. Use that to set the geometry.
XLE GEOMETRICAL trend lines
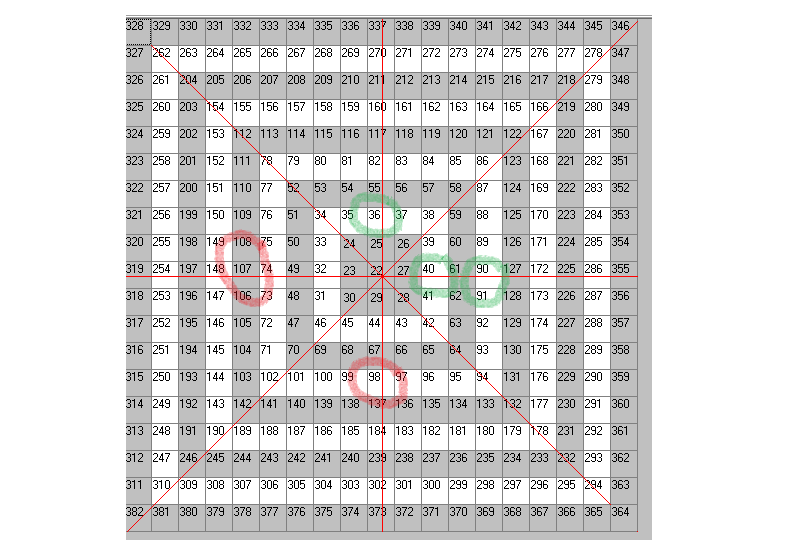
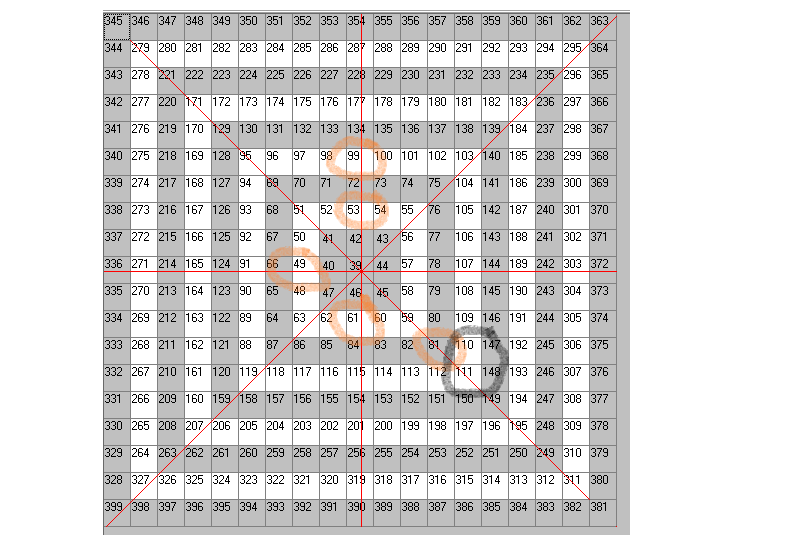
here are some more targets being generated … note the placement of the LOWS in the CENTER of the square.