Putting up a good fight …
09/02/2014: hard to believe it’s basically been 6 months since we looked at this LOG trend line from the NASDAQ but here we are again. It’s certainly giving it a good run for the money isn’t it? Well, I’m not sure which way it’s going to go but i do believe it’s “important” as some major inflections have occurred there in the past. So, we’ll see …here’s the chart:
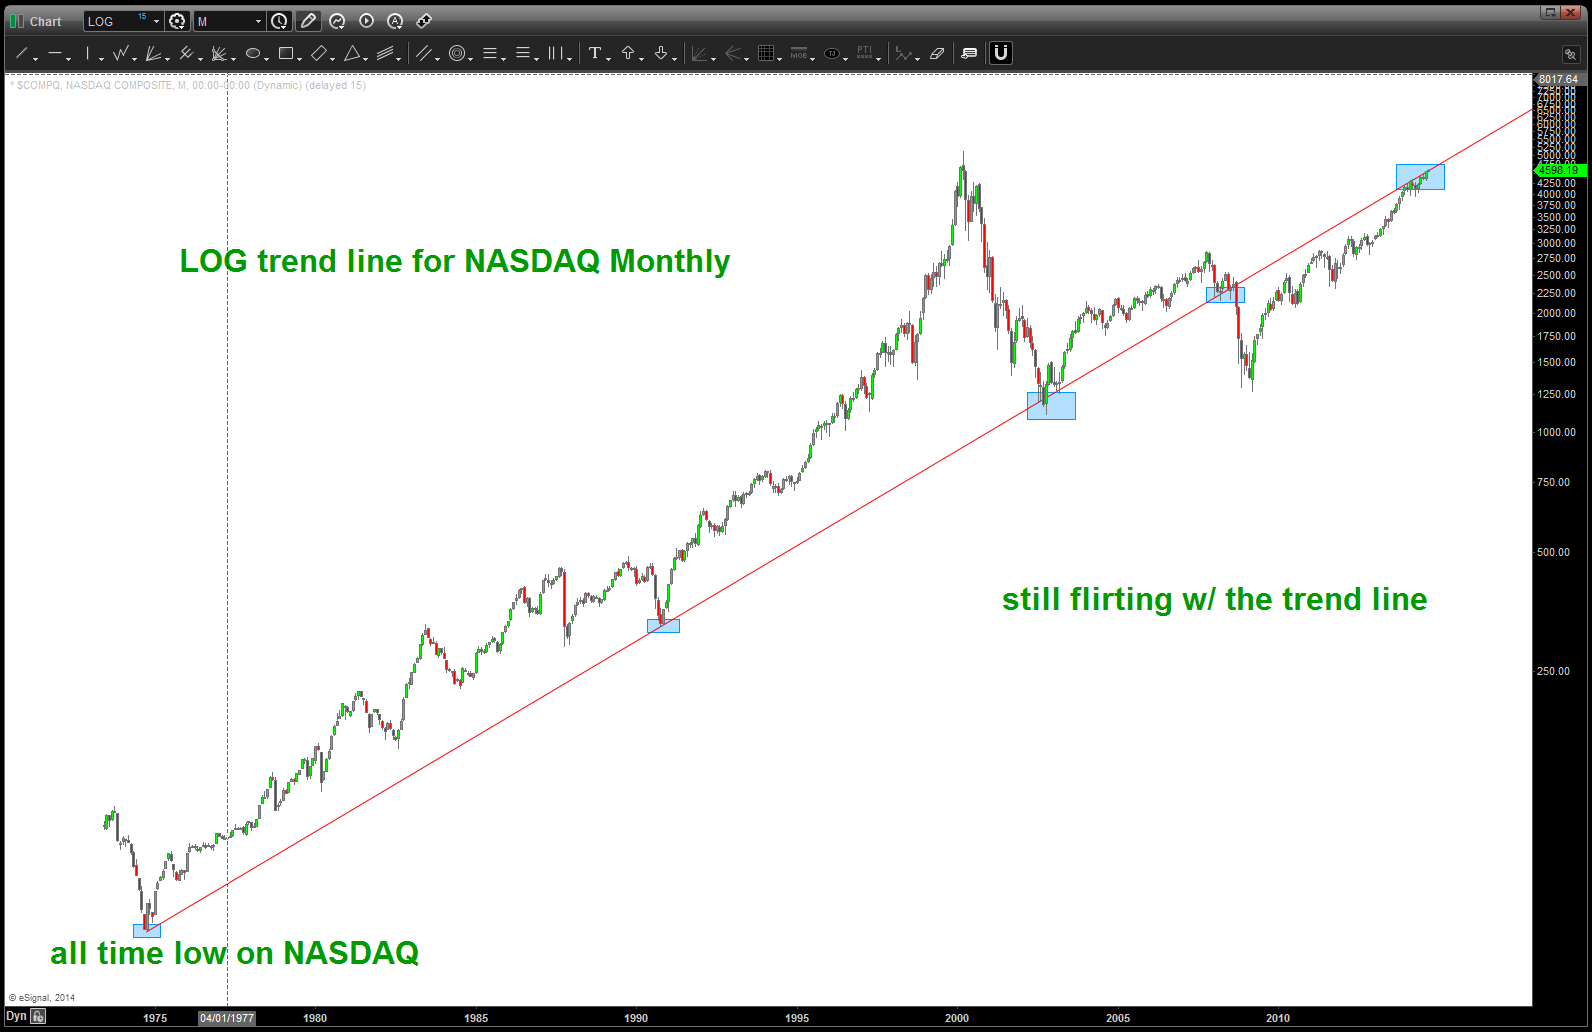
LOG trend line from the all time low on the NASDAQ
what has me most baffled … well, you know I am a pure pattern dude and, well, this level shown “should have” held the market at bay. Seriously, when you work w/ all time low and all time highs and all that stuff there is usually a little bit of resistance. Nope …not one bit. here’s the chart:
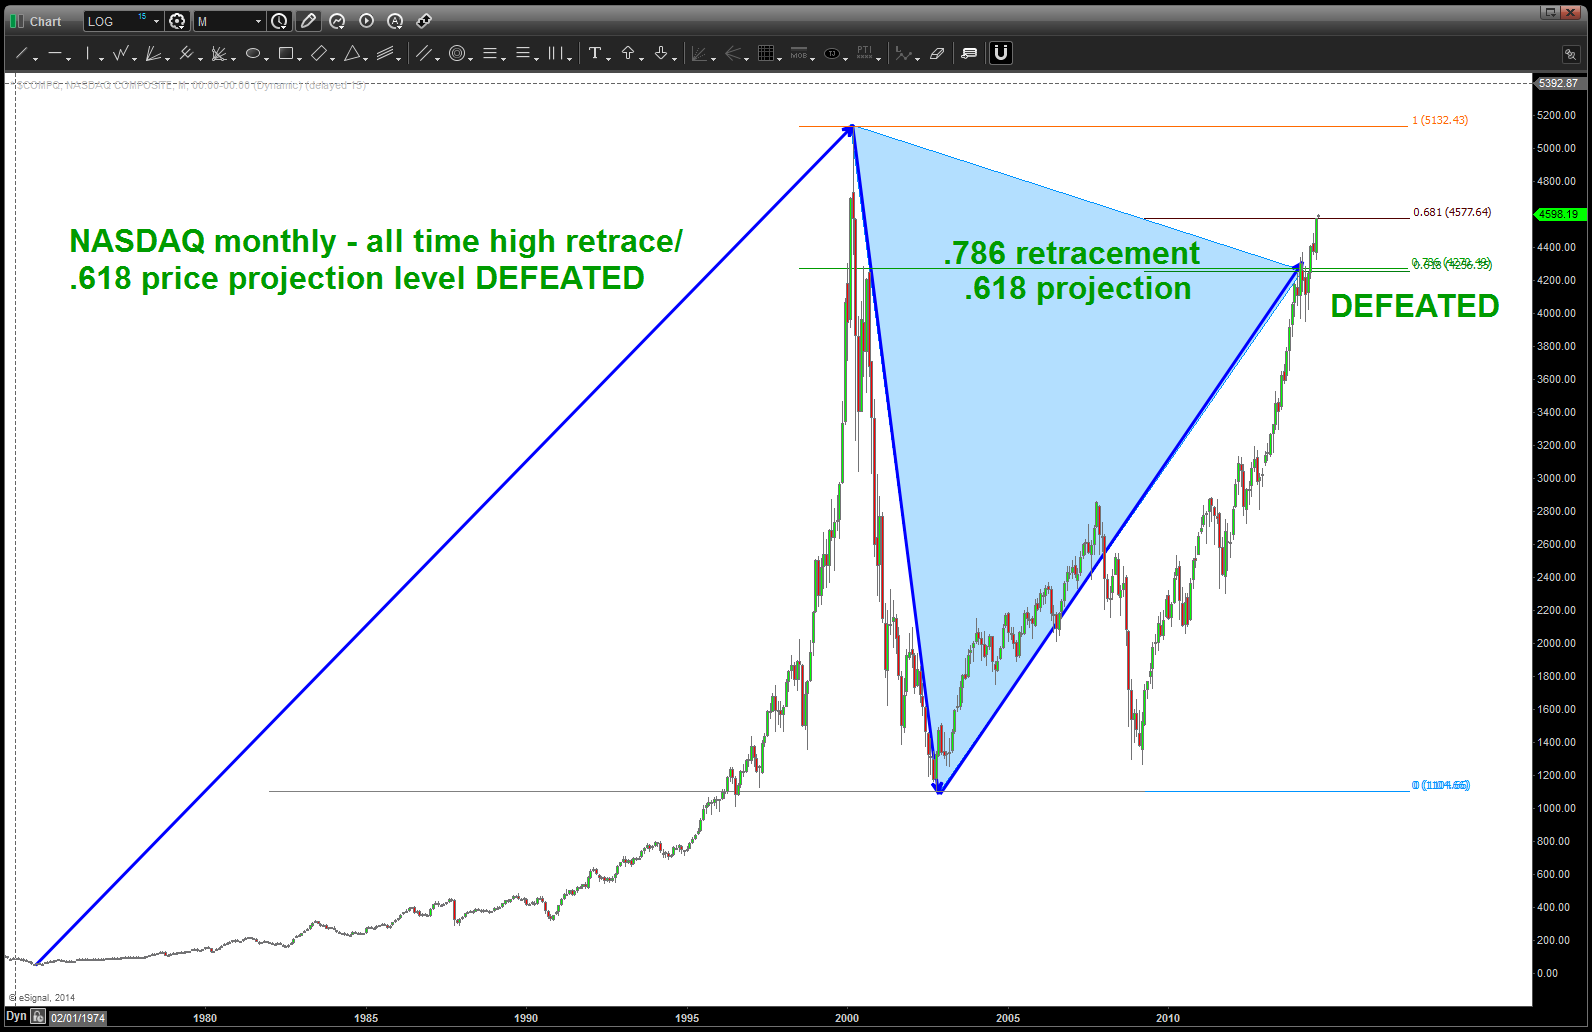
major resistance shown defeated
so, what do you do … well, here’s a daily look and I can clearly see 5 waves up … 1,2,3,4,5
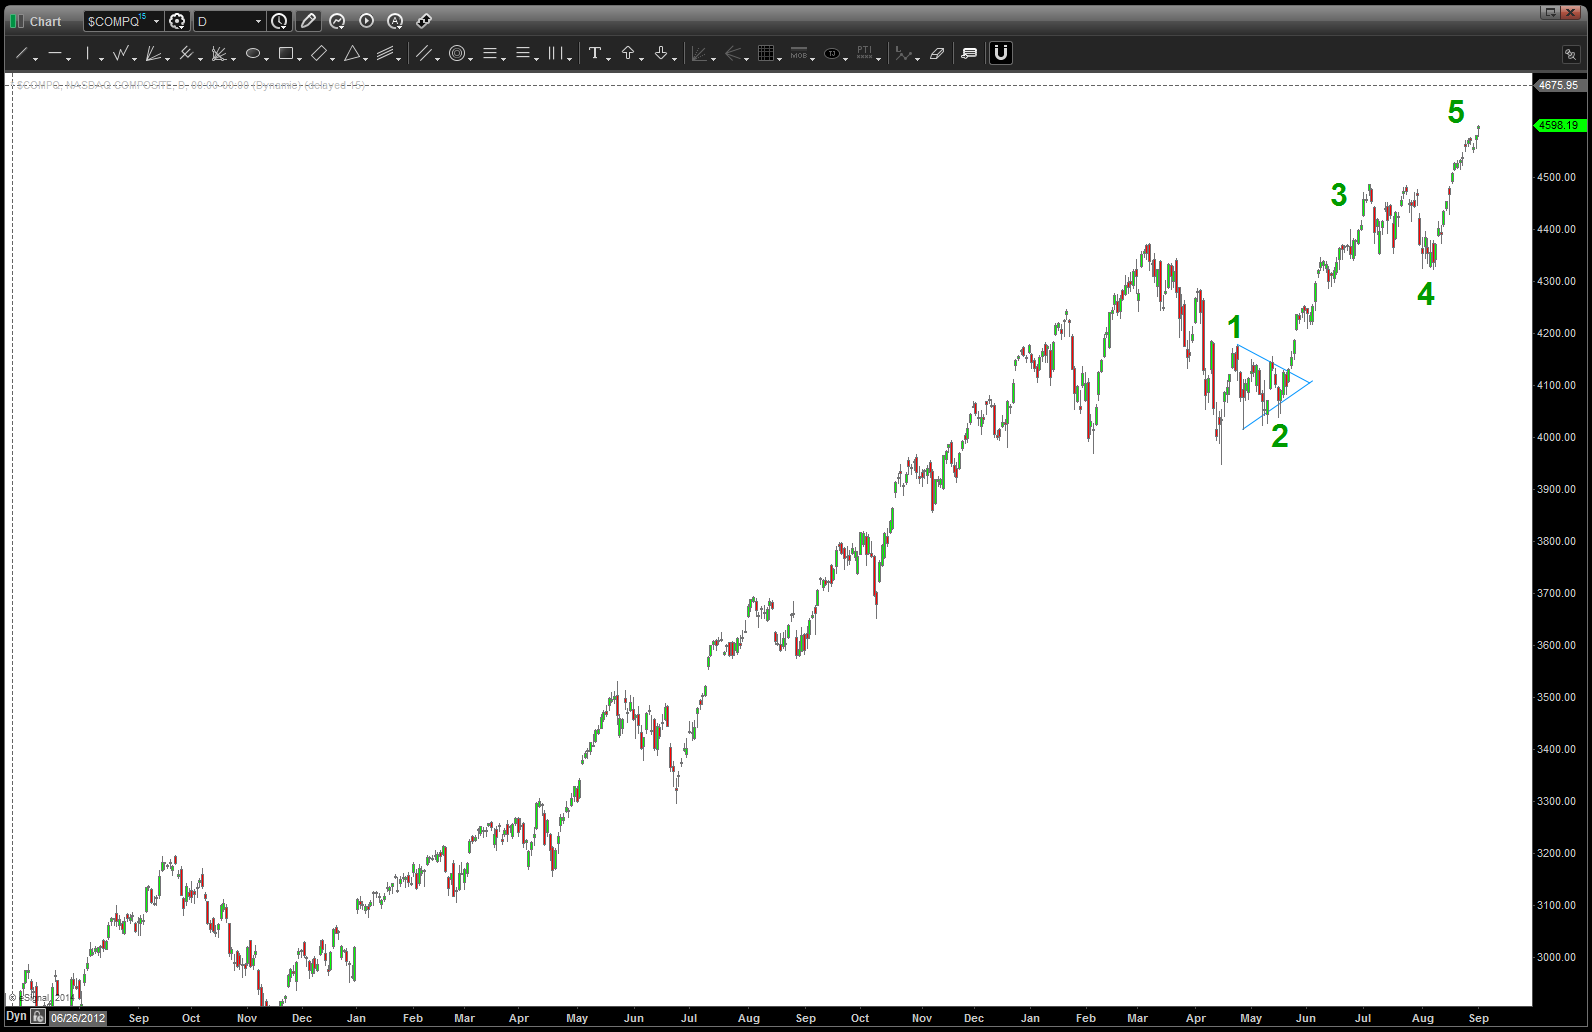
so, what’s the cynic in me say …? well, I am a PATTERN dude but I’m not stupid. Do we think that for ONE MOMENT “they” aren’t going to hold this market up for one of the largest IPO’s ever – Alibaba? BABA baby BABA ….and, don’t forget this — https://bartscharts.com/2014/08/24/palladium-at-major-resistance/
03/27/2014: CLIFF NOTES: this is major resistance on the NASDAQ
folks, it’s all about the swing low … while the NASDAQ is continuing to break down like our targets expected, it has not broken a major swing low, yet. This weekend will be very key as we “square out” in days the all time high of 5132. Additionally, note we are only 15 points from 4188 which is the calendar day count from the 10/10/2002 low. So … we have 1) targets being hit in PRICE and 2) equal TIME rally up (noted by blue triangles) and 3) butting against major trend line resistance and 4) a potential square out of price and time from major highs and lows.
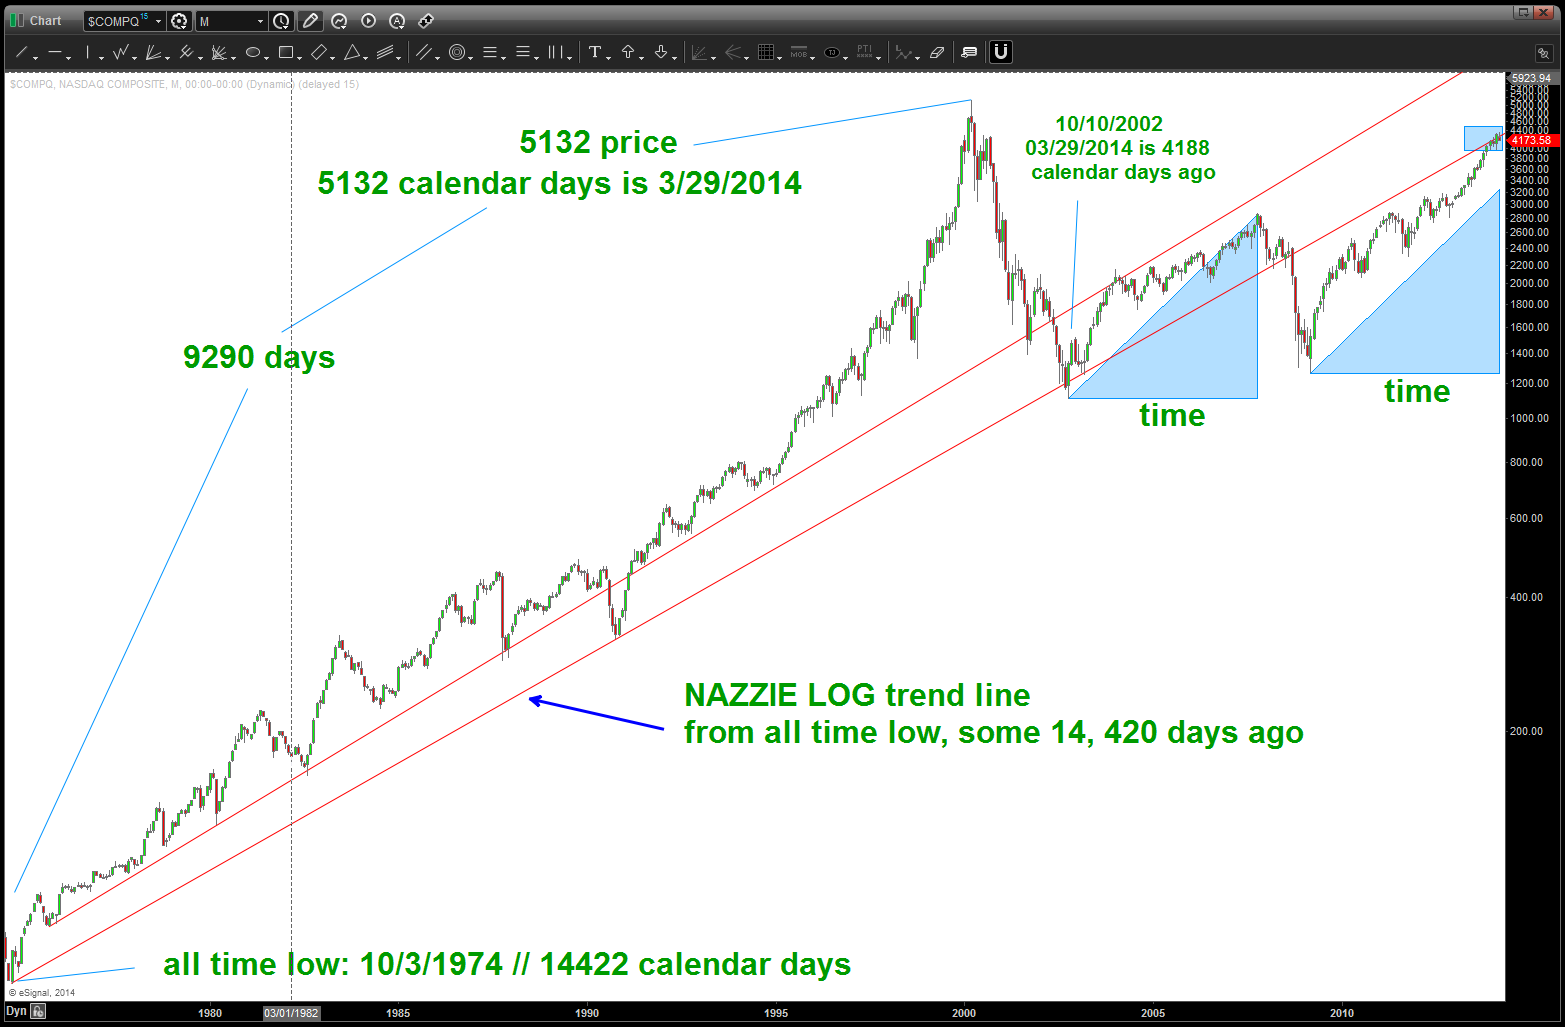
NASDAQ LOG trend line from all time low
