Palladium SELL pattern complete – AAPL to follow?
Attached is the chart of the Palladium pattern completing ….a slight modification to the wave count but our target area for Palladium has been hit and the selling has started to increase. Palladium has been the strongest.
Feel free to read below for more detail.
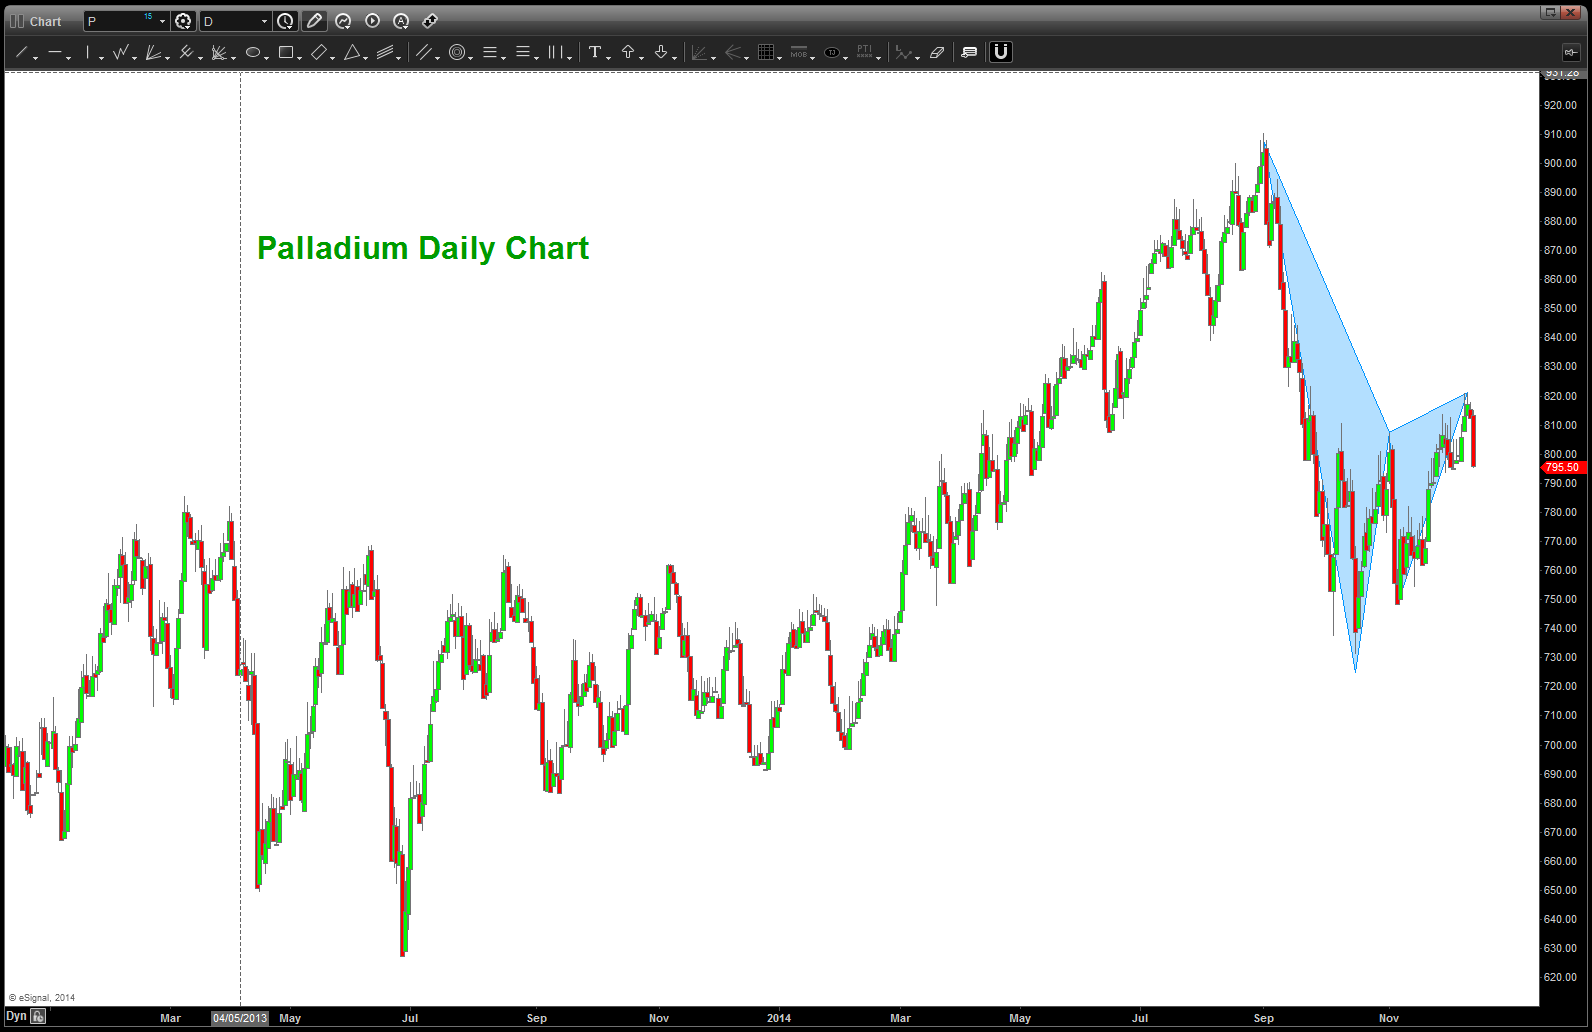

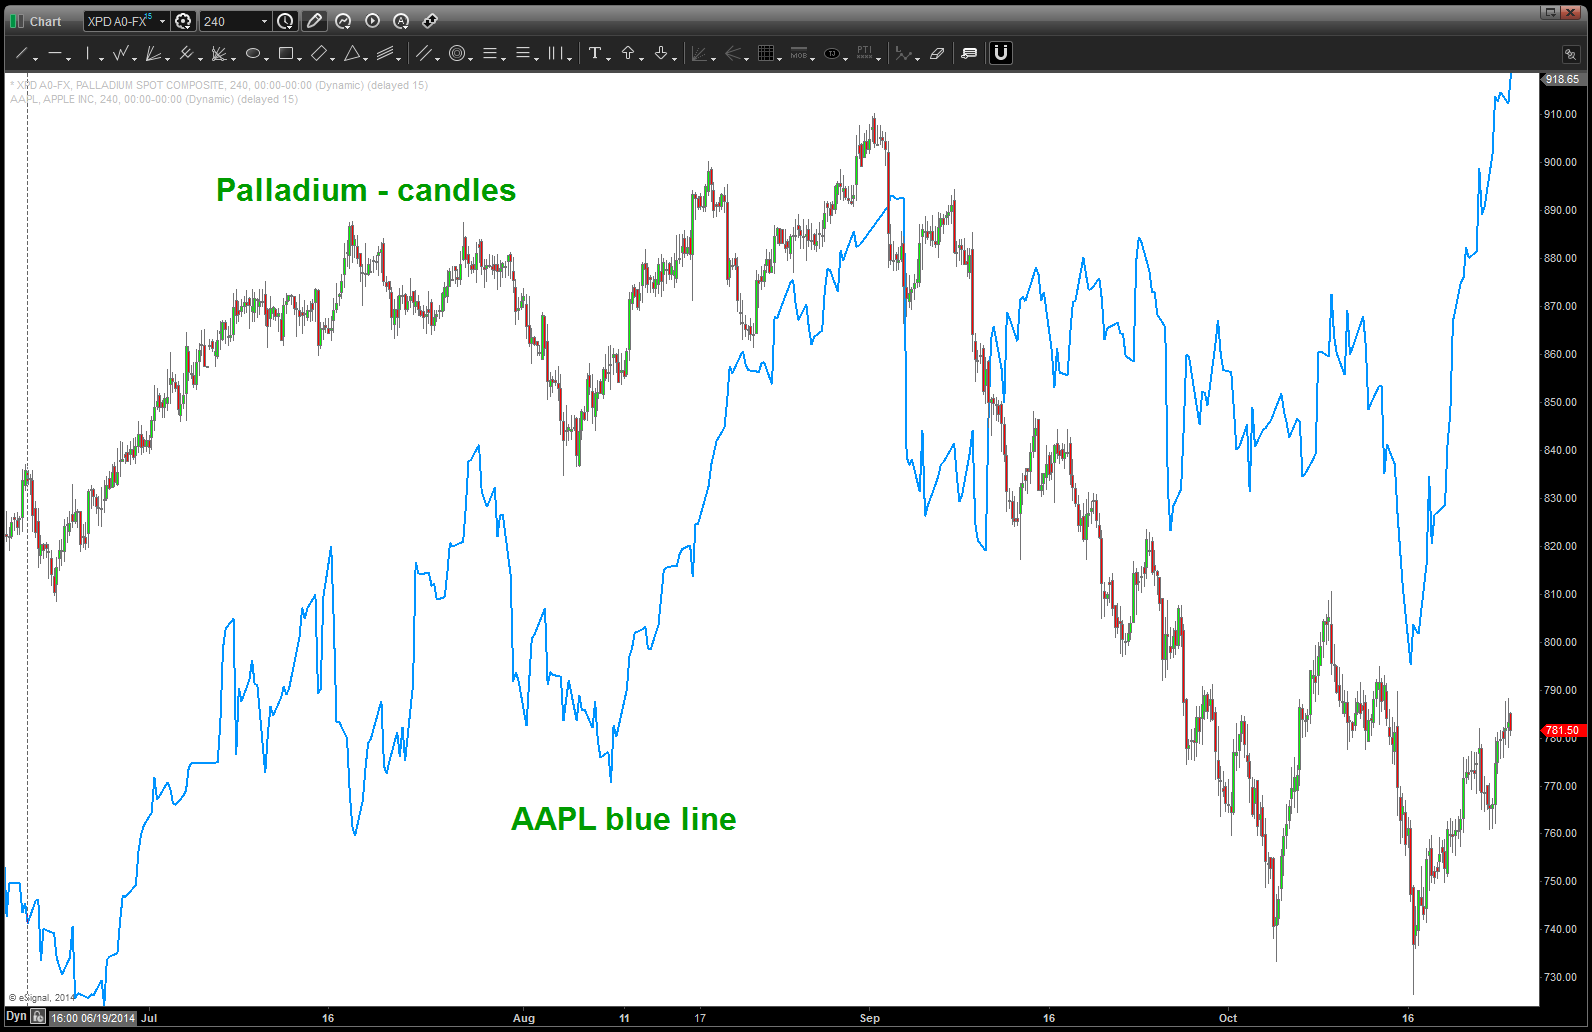
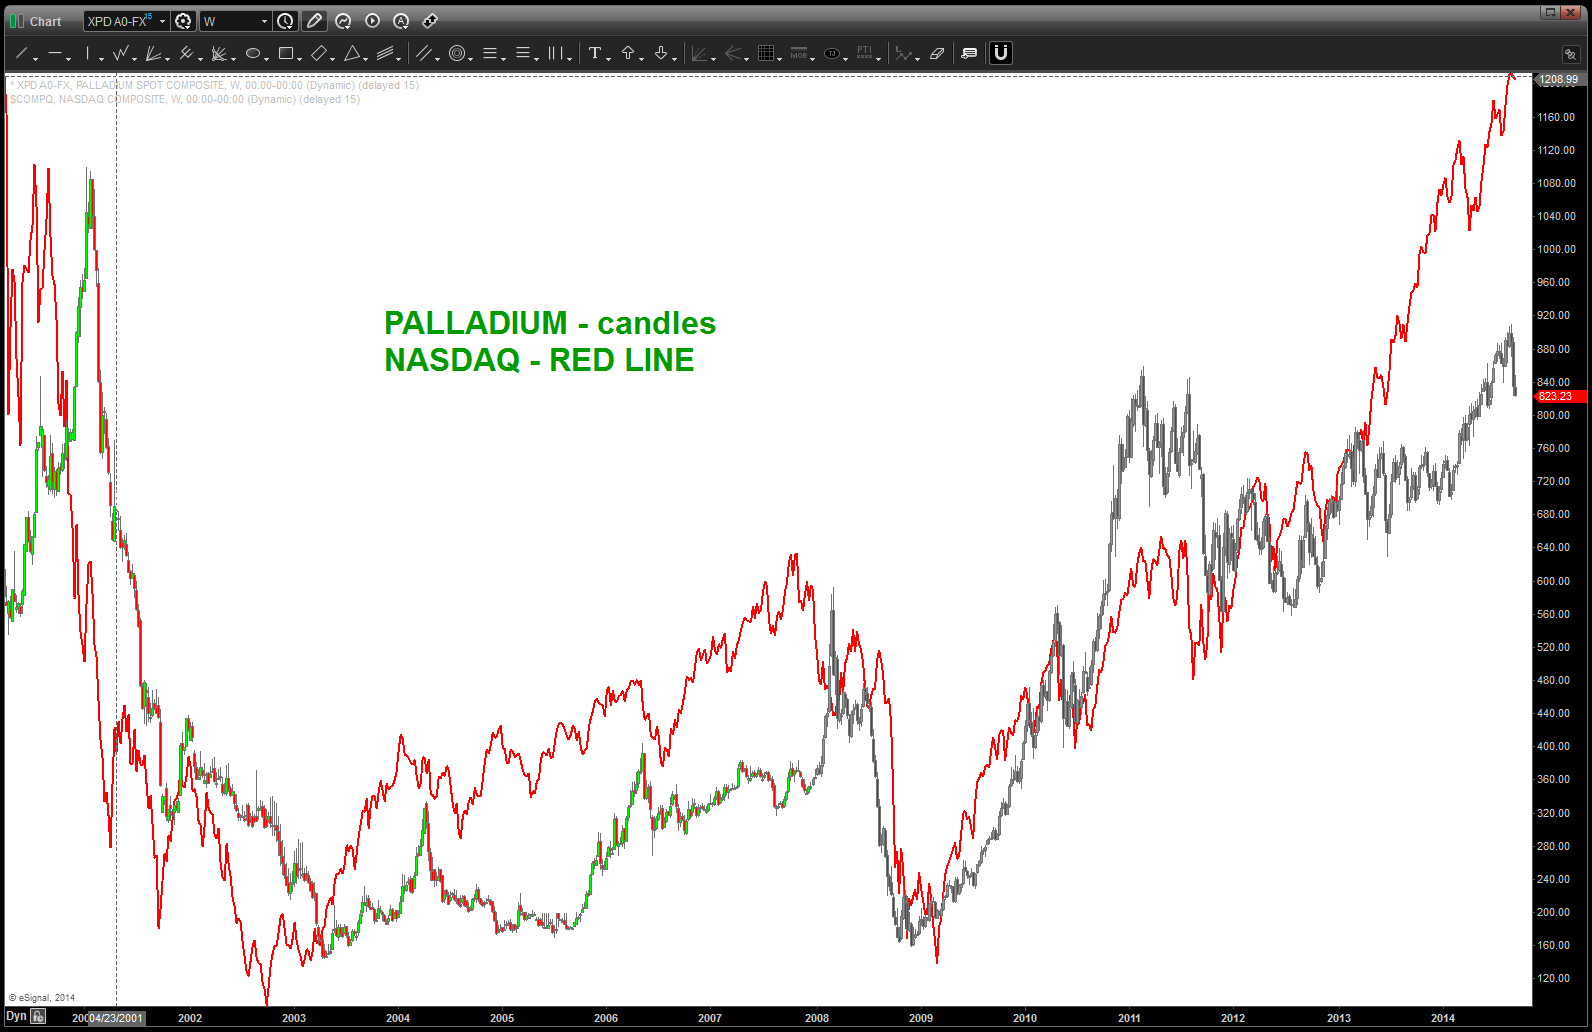
When looking at any security, I always try to look at cross market correlations (intermarket technical analysis I guess) to see if we can get correlations/confirmations. One of the more important correlations has been the price of Palladium and the AAPL stock and to another extent the NASDAQ. They are NOT perfectly correlated but they are dancing together enough (reference dancing w/ the stars) that when one inflects (up or down) the other usually follows. In this case, if you follow the charts below, you’ll see that we formed a nice pattern on Palladium that HIT and it tumbled more than 20%. Is Palladium now in a bear market — I DON’T KNOW nor DO I CARE. We’ll know something is “afoot at the circle K” based upon this next leg and what it decides to do. A count that makes sense is shown and the formation of B or 2 is where we need to just see what happens. Here’s what we can figure out …
- IF (the BIG IF) this is a wave 2 then upon completion of the FLAT or EXTENDED FLAT Palladium will start back down.
- Historically, this “should” cause pressure on AAPL.
- IF (the same BIG IF as above) Palladium continues to rip higher then AAPL will continue ….
So, just sit back and enjoy this dance…if Palladium trips and falls down the probability that it’s partner (AAPL) won’t be too far behind is a distinct possiblity.
DISCLAIMER: can’t stand that show, OBTW but my 86 year old mother enjoys it. However, I do like the last word of the show – “stars” – for obvious reasons.
9/17/2014: this correlation is pretty strong and Palladium hit our target exactly and has been being liquidated heavily in the past month. Keep an eye on either 1) Palladium finding support to build momentum for a move higher in NASDAQ OR 2) drag the NASDAQ down w/ it. Let’s face it … ain’t NO WAY anything was going to get in the way of the Allibaba IPO. It’s going to be a crazy market as we see what happens w/ Scotland, we have a triple witch expiration, a reweighing and the largest IPO in history .. not to mention it’s been a FED week.
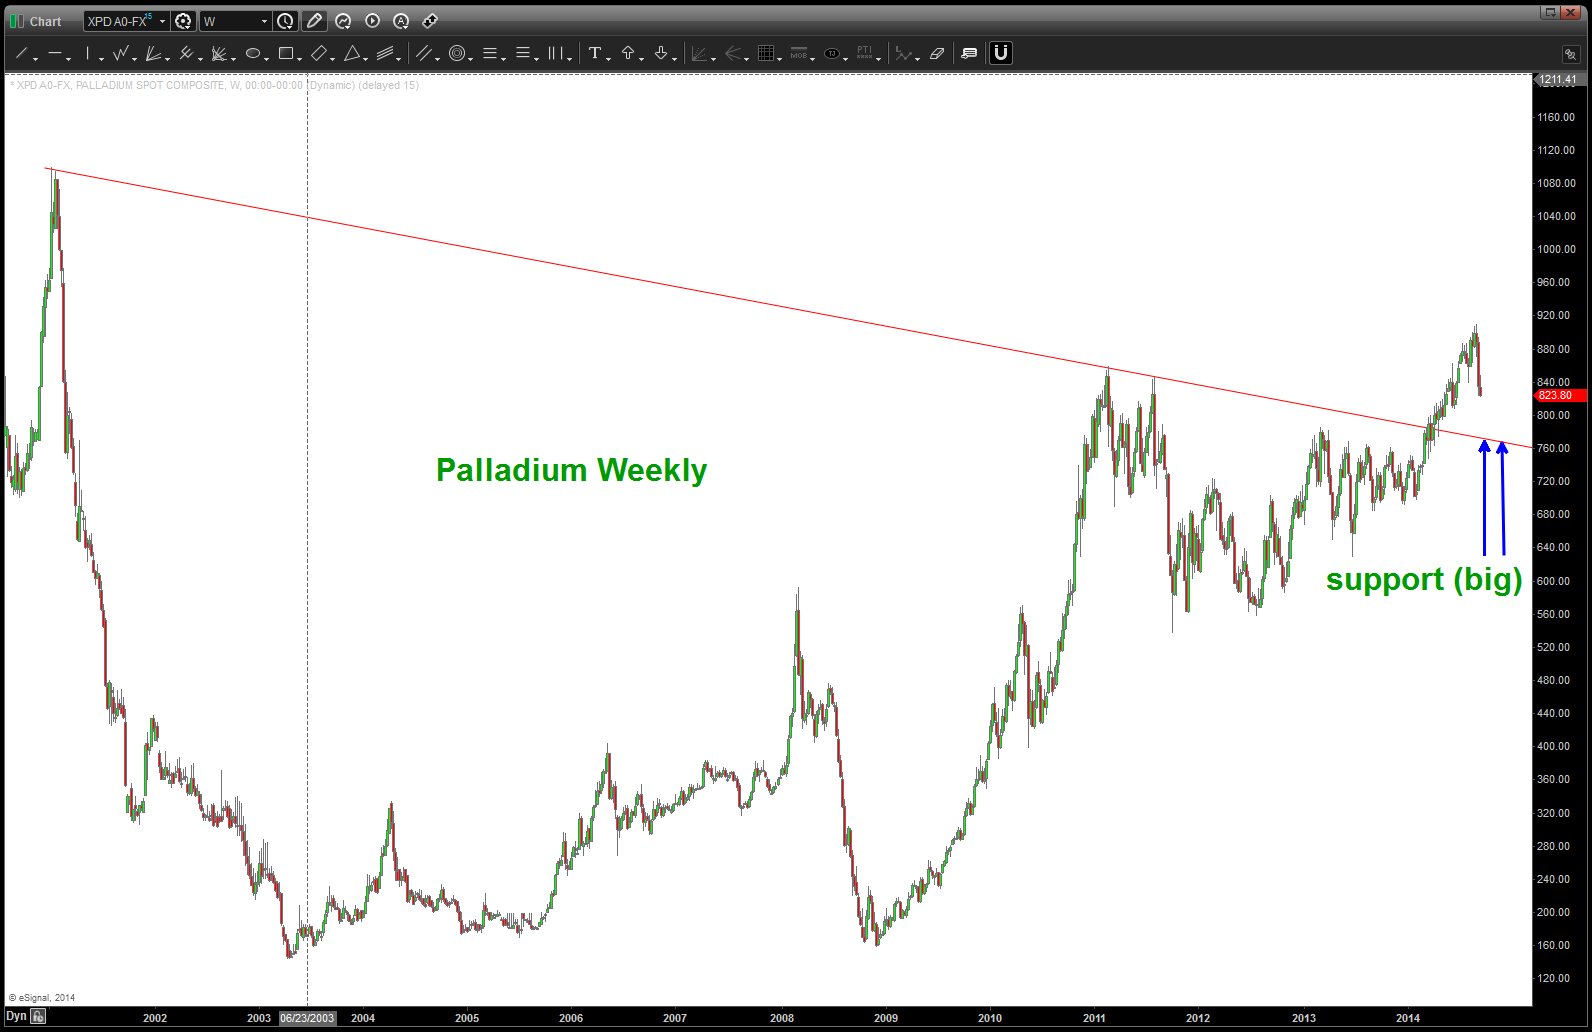
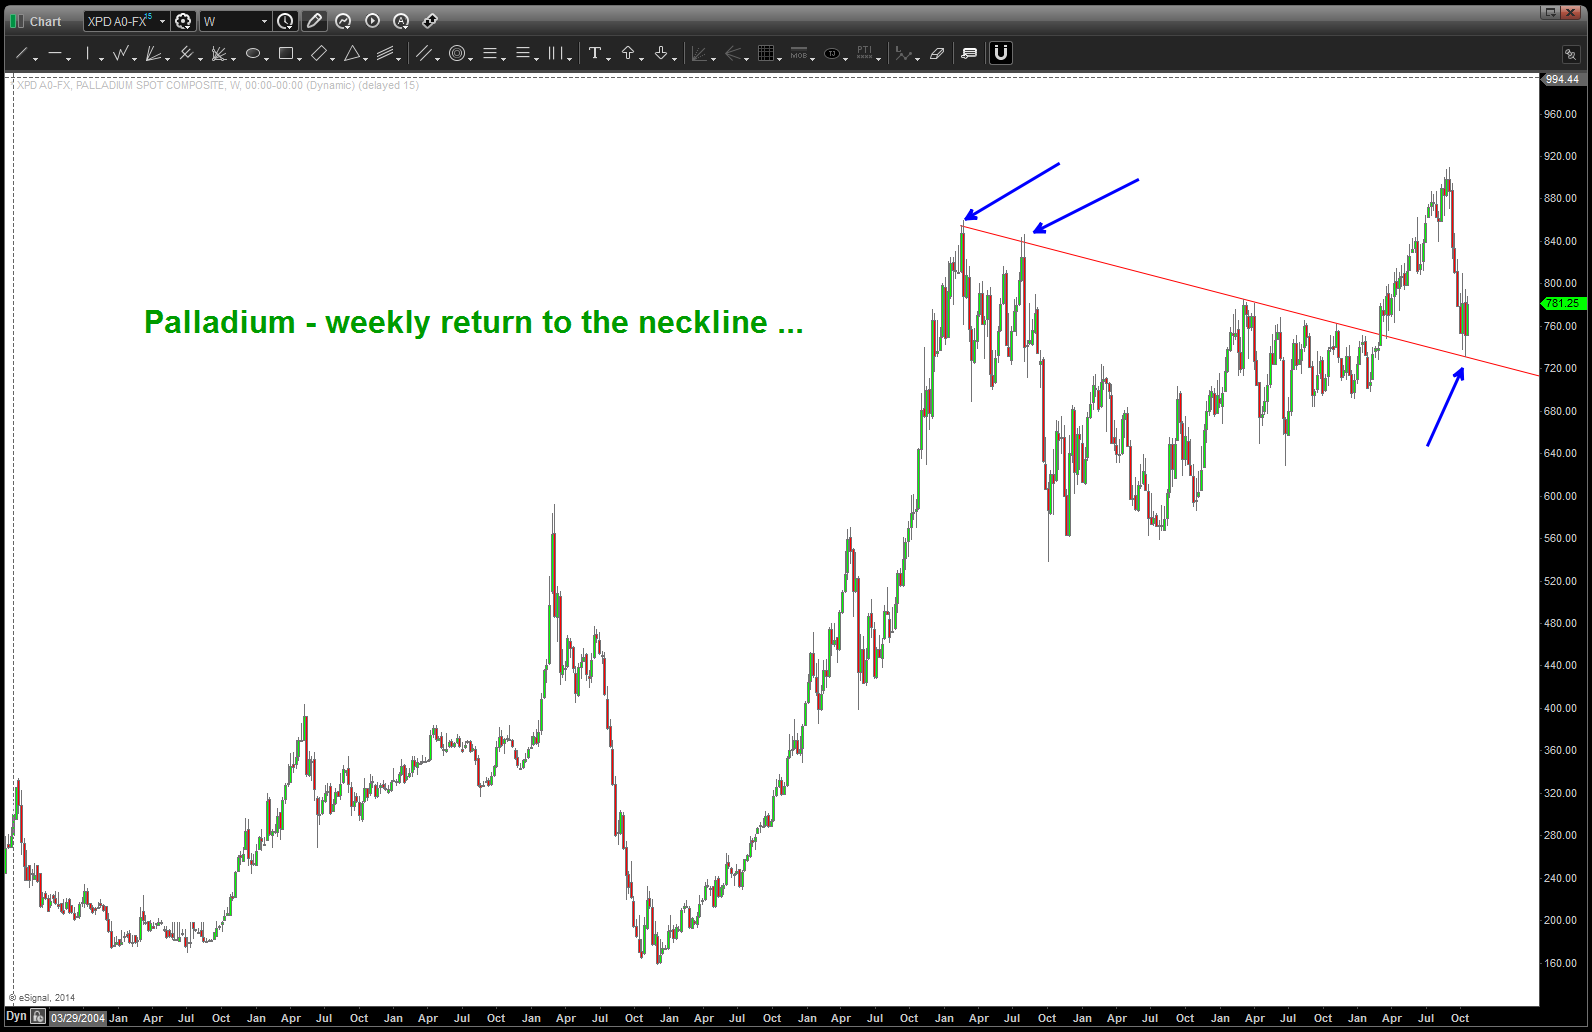
8/24/2014: : Palladium converging into to major resistance. This is important because it’s a nice little commodity to watch w/ regard to the NASDAQ and AAPL. In order to build the pattern we are going to to go step by step this morning into “why” Friday’s high was important from a PATTERN perspective.
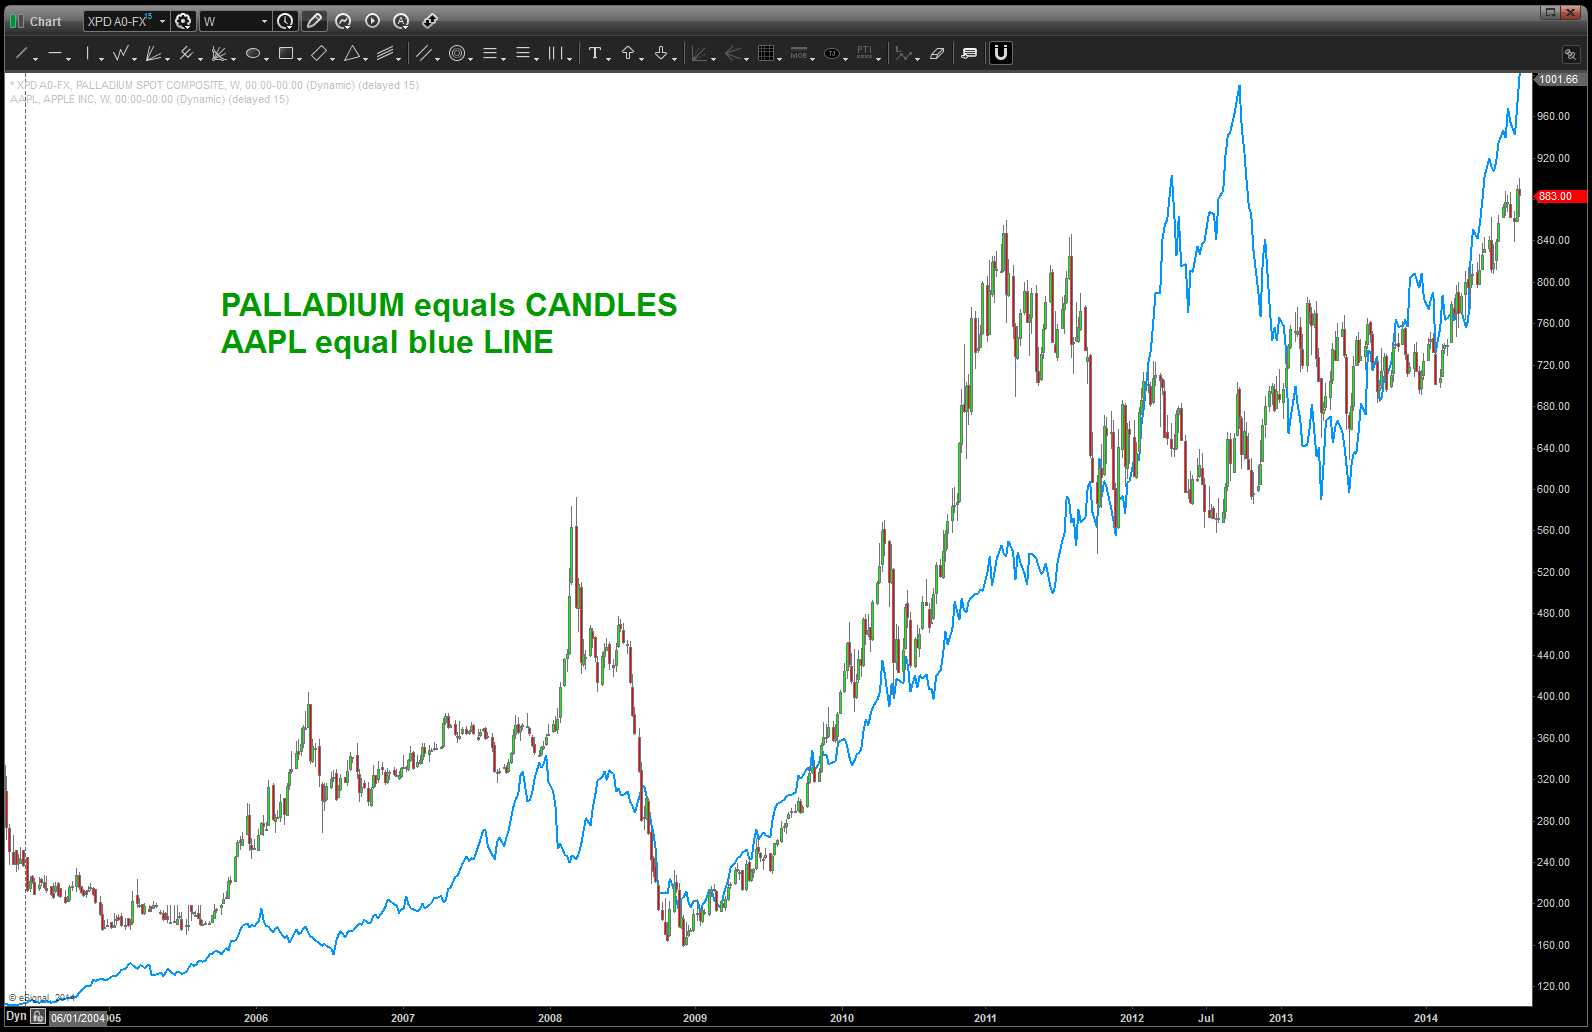
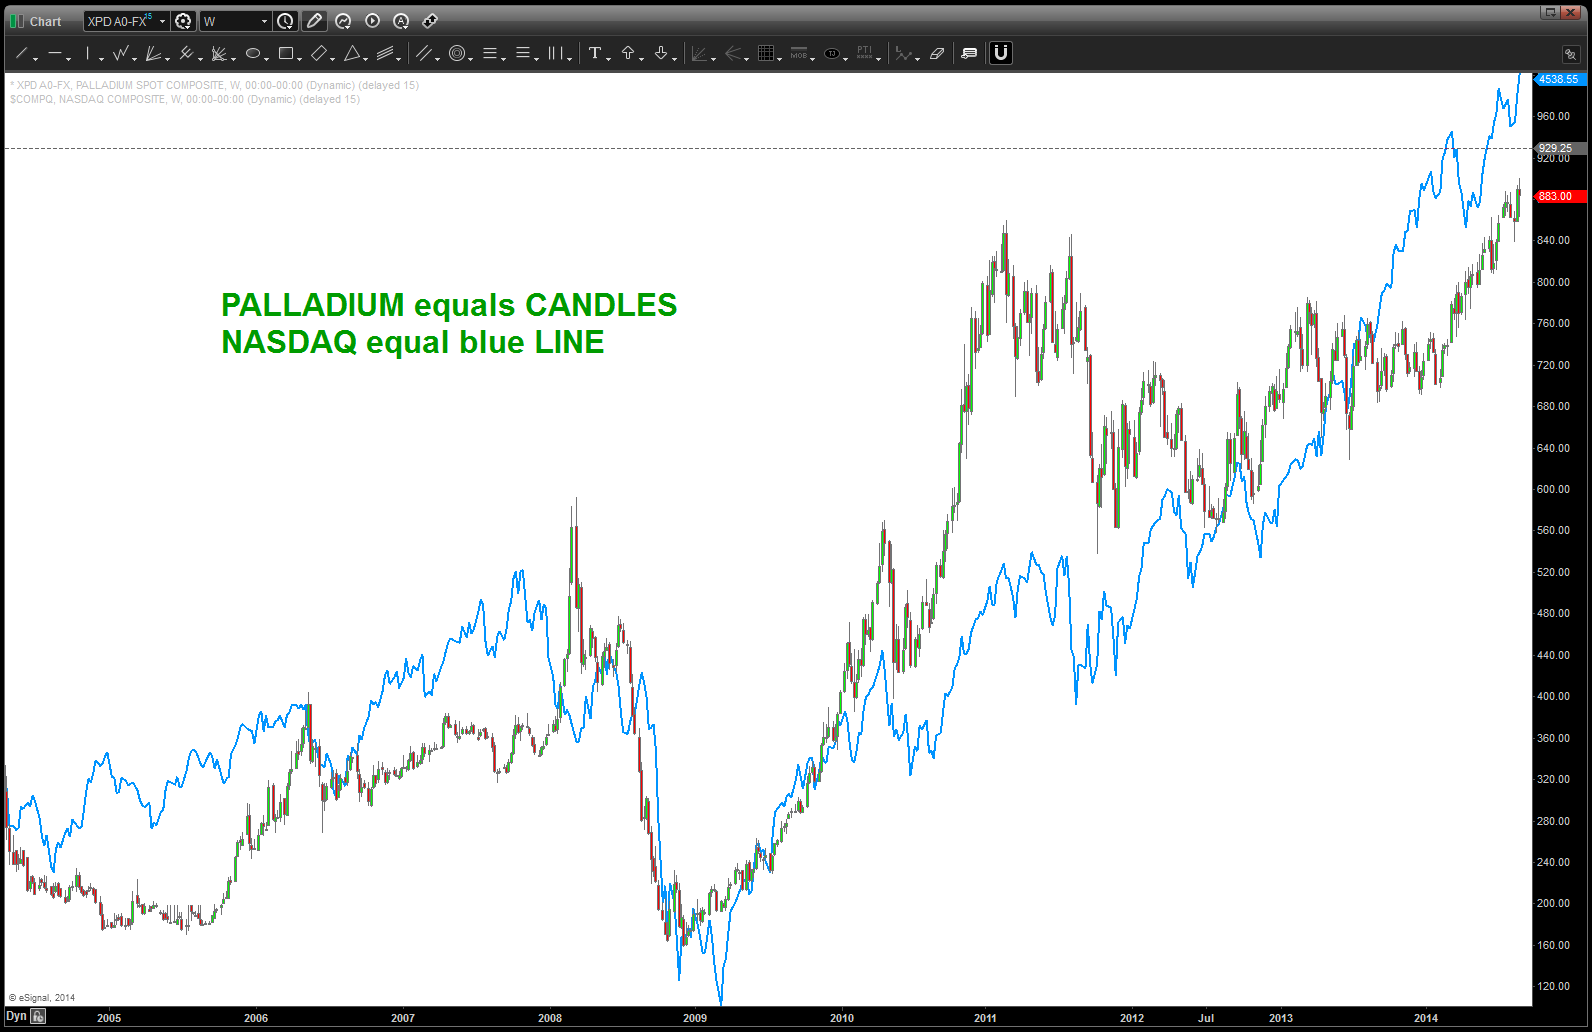
1. First, here’s WEEKLY charts of 1) NASDAQ and Palladium and 2) AAPL and Palladium.
- notice that when palladium broke out of the consolidating triangle, AAPL took off.
- of late there has been a lead/lag relationship at times BUT the overall directional pivot is clear. As Palladium goes, so does NASDAQ and AAPL.
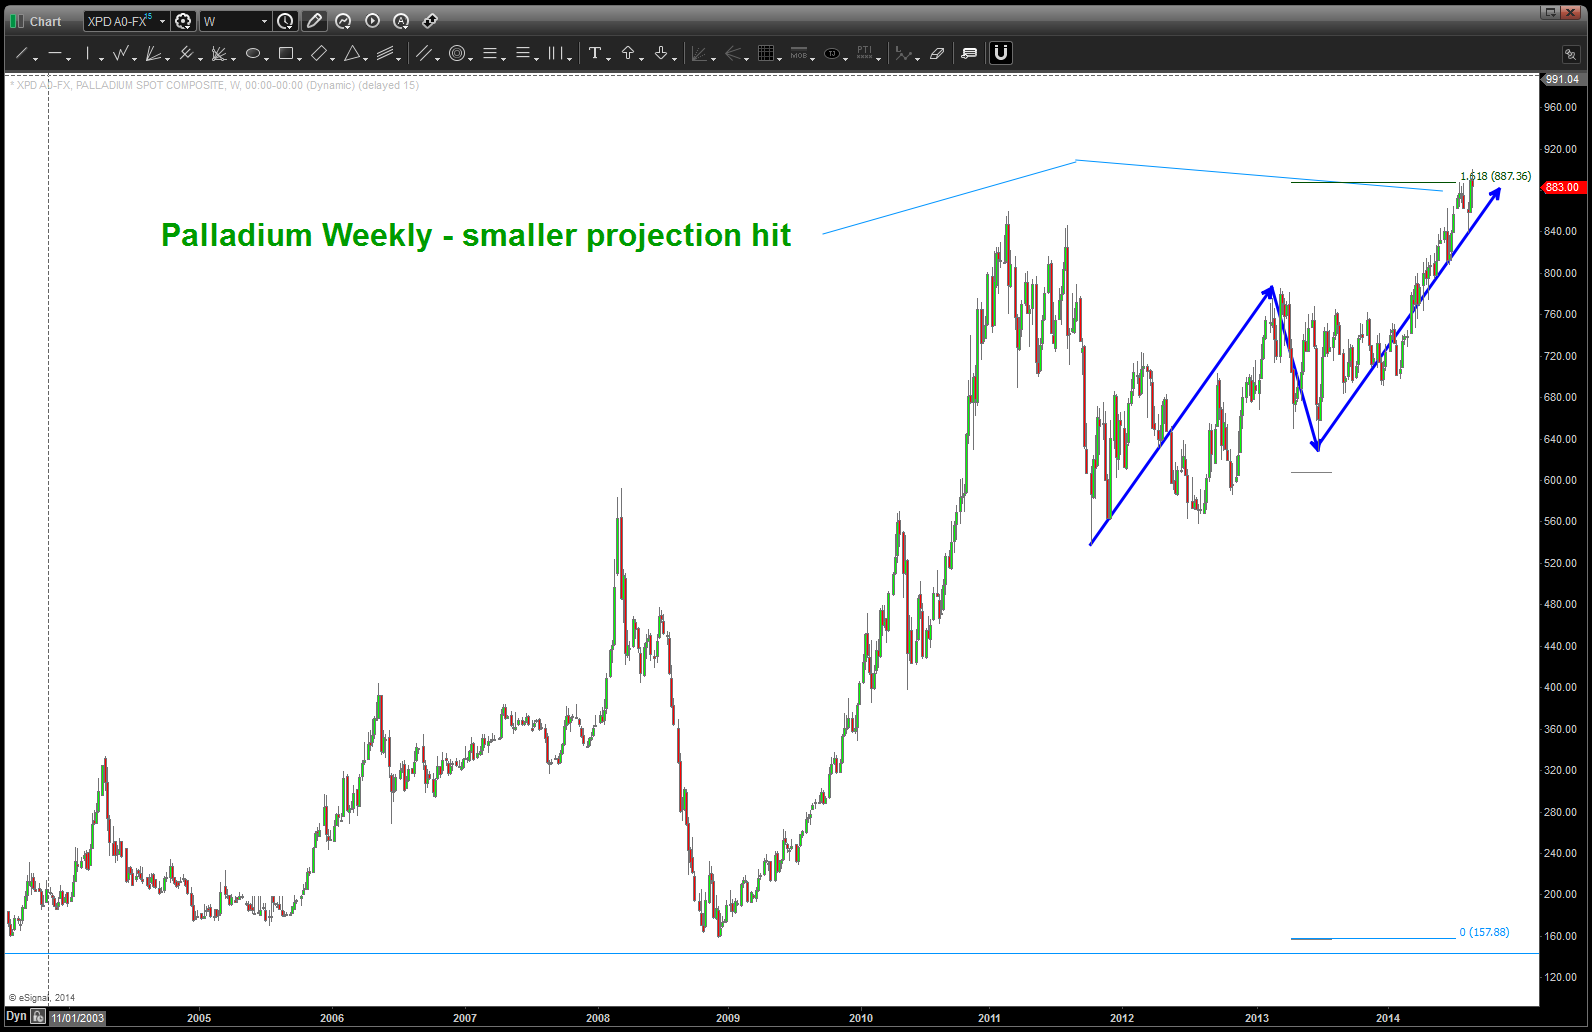
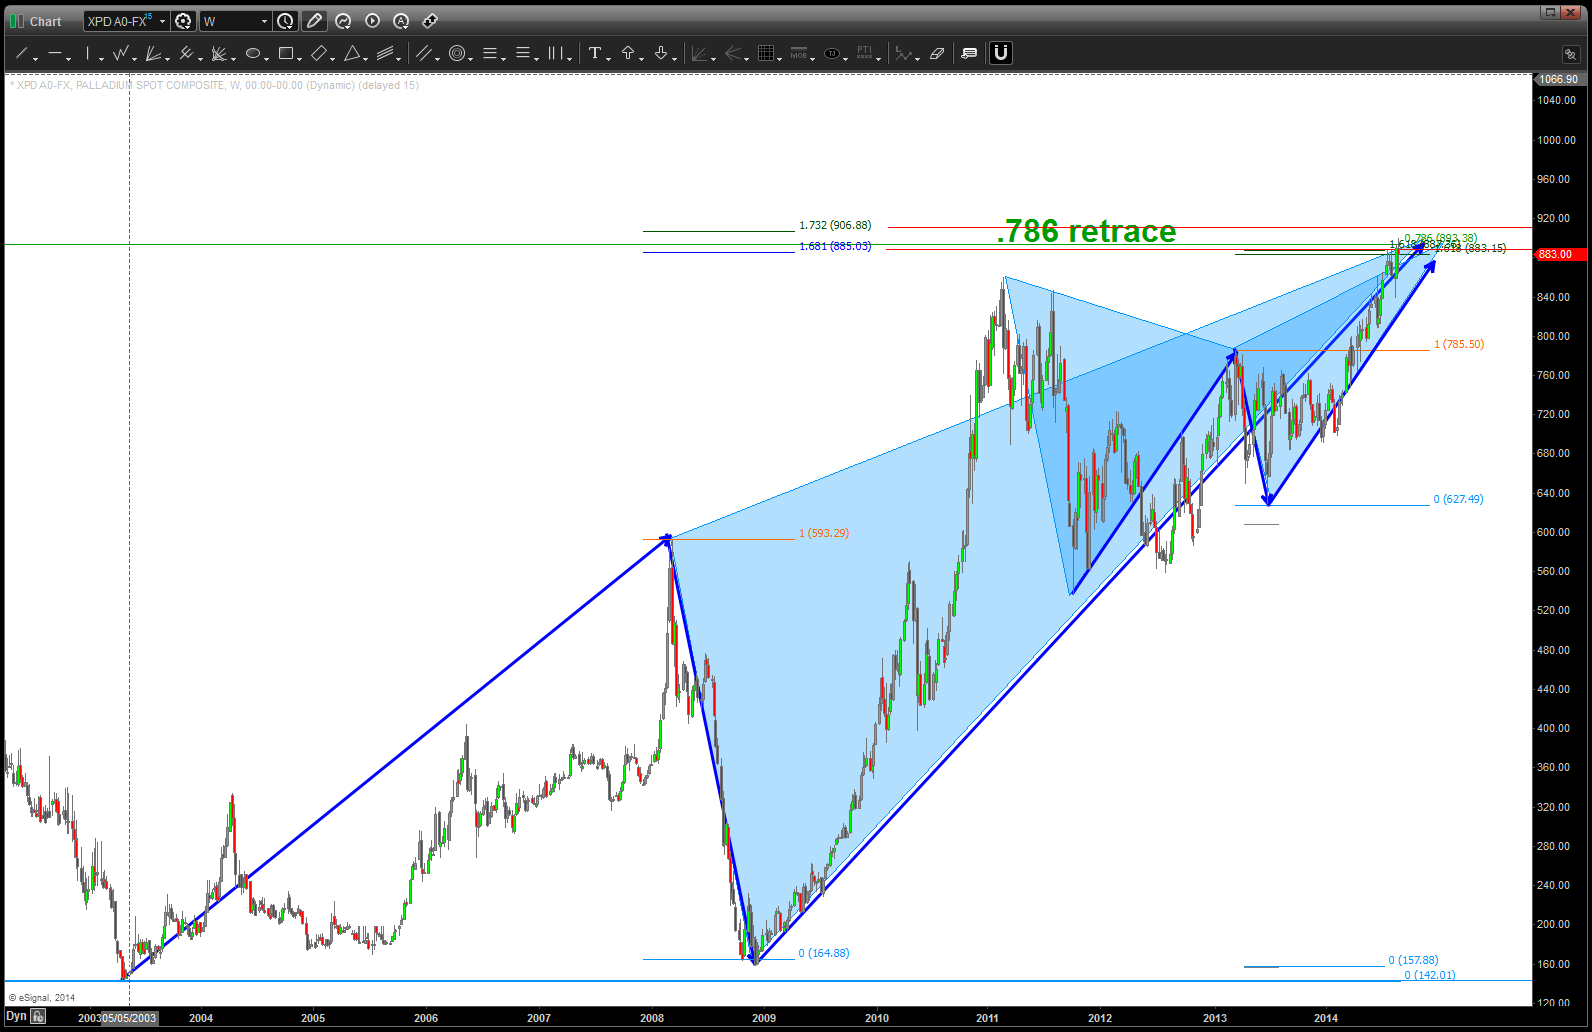
2. When constructing a PATTERN there are three things we do — PROJECT / EXTEND/ RETRACE. In order to keep this post brief I’ll do the basic stuff …
- PROJECT: note in the two charts below we have 2 “basic” projections coming into the same area. That warns of resistance.
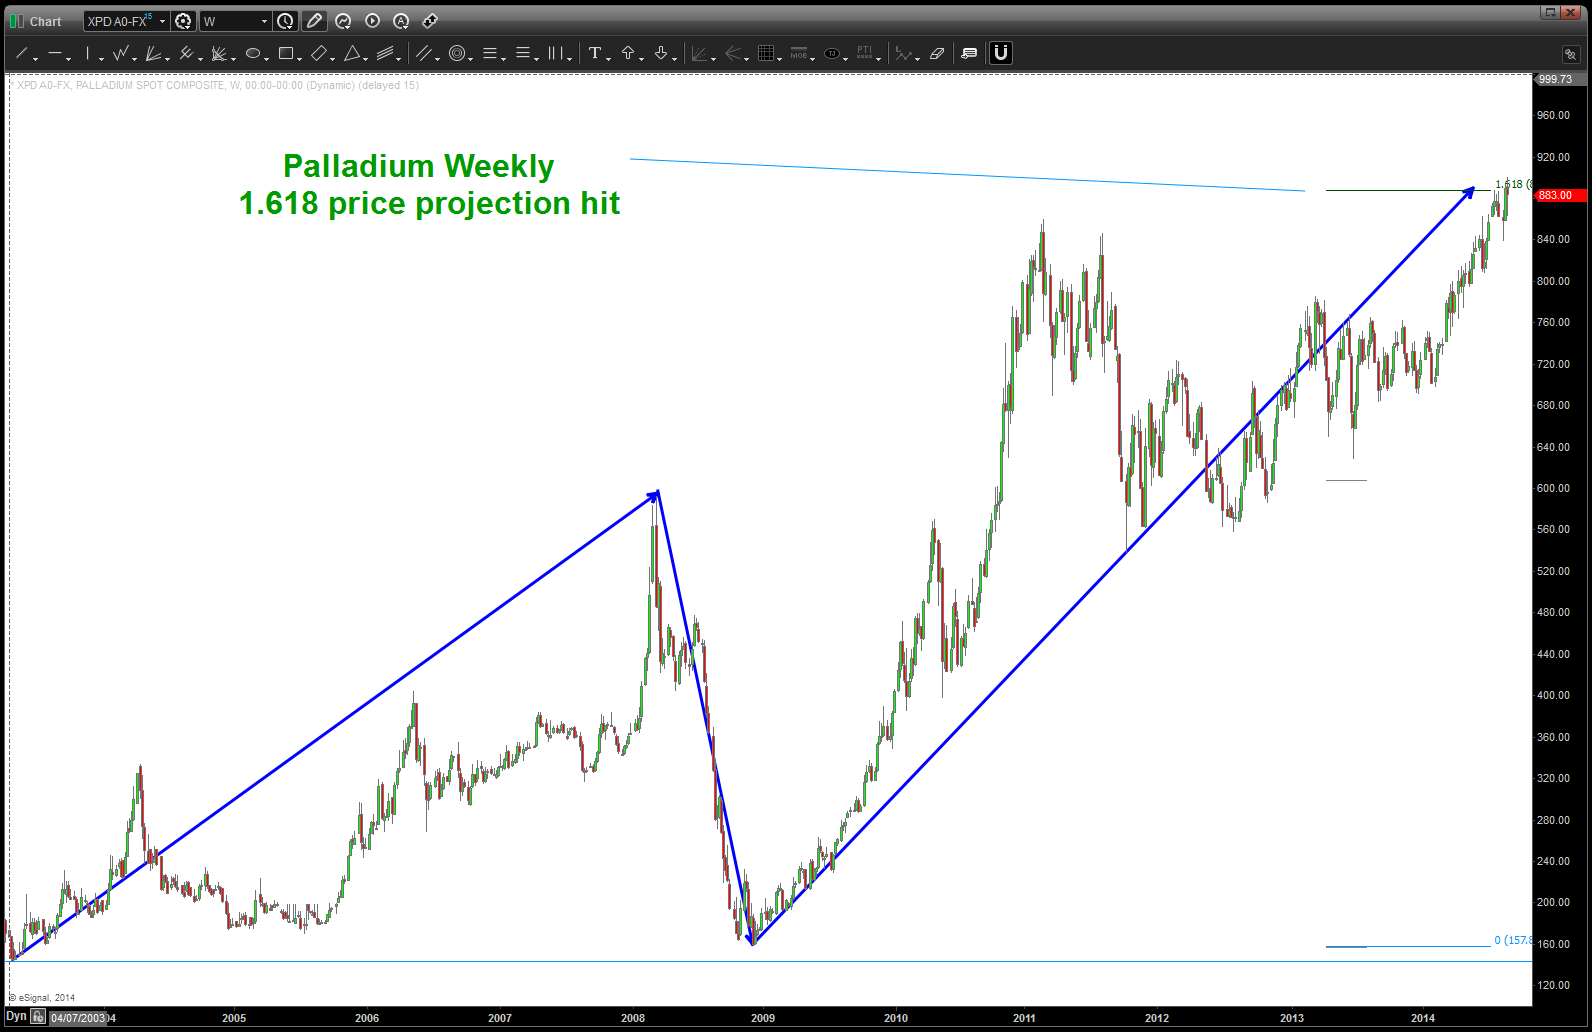
Palladium 1.618 Price Projection
- EXTEND: note, we used the middle point at 593 for the extension pattern. Also, note 1.68179 nd 1.732 are used. musical note and the square root of 3 …
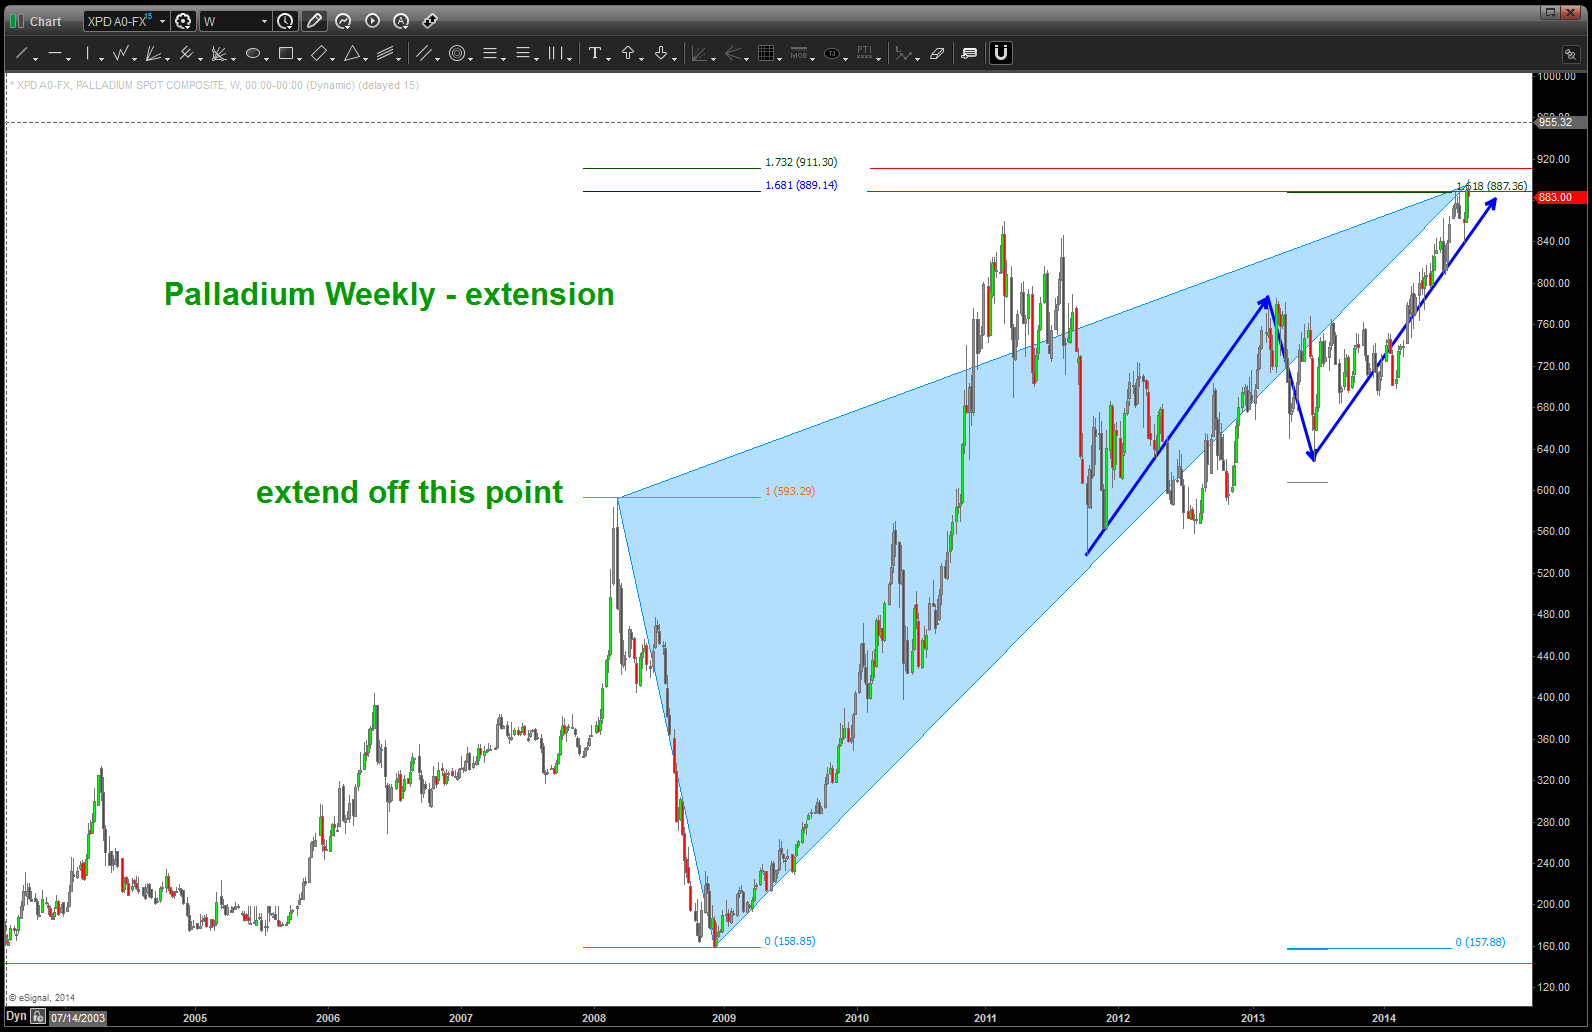
extension from 2008 (shaded light blue triangle)
- RETRACE: from the all time high we have a .786 retracement. This is NOT a fibonacci number. Here’s the math- 1.618/square root is 1.27 and 1/1.27 = .786.
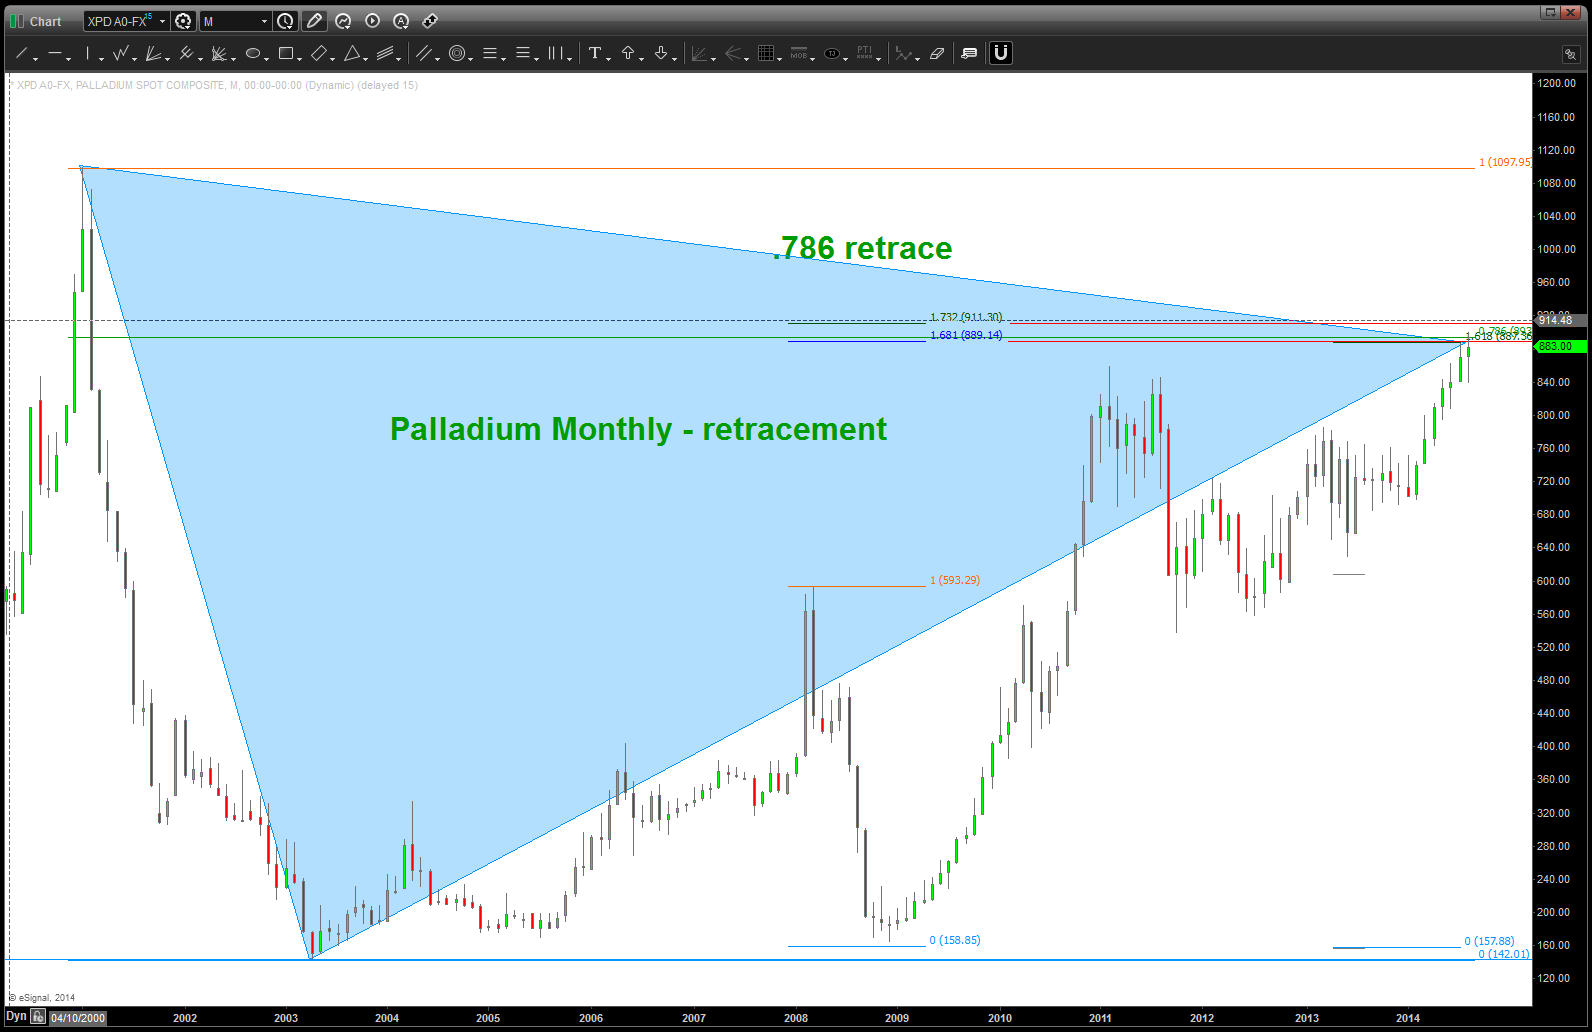
so … as you can see, we have a bunch of NUMBERS adding up to this being a big level for Palladium. And, while a case can be made that, since these are weekly/monthly nodes coming out, it SHOULD be a hefty amount of resistance. That being said, it could also BLOW RIGHT THRU EM’ and rip higher and higher. It’s just a pattern folks.
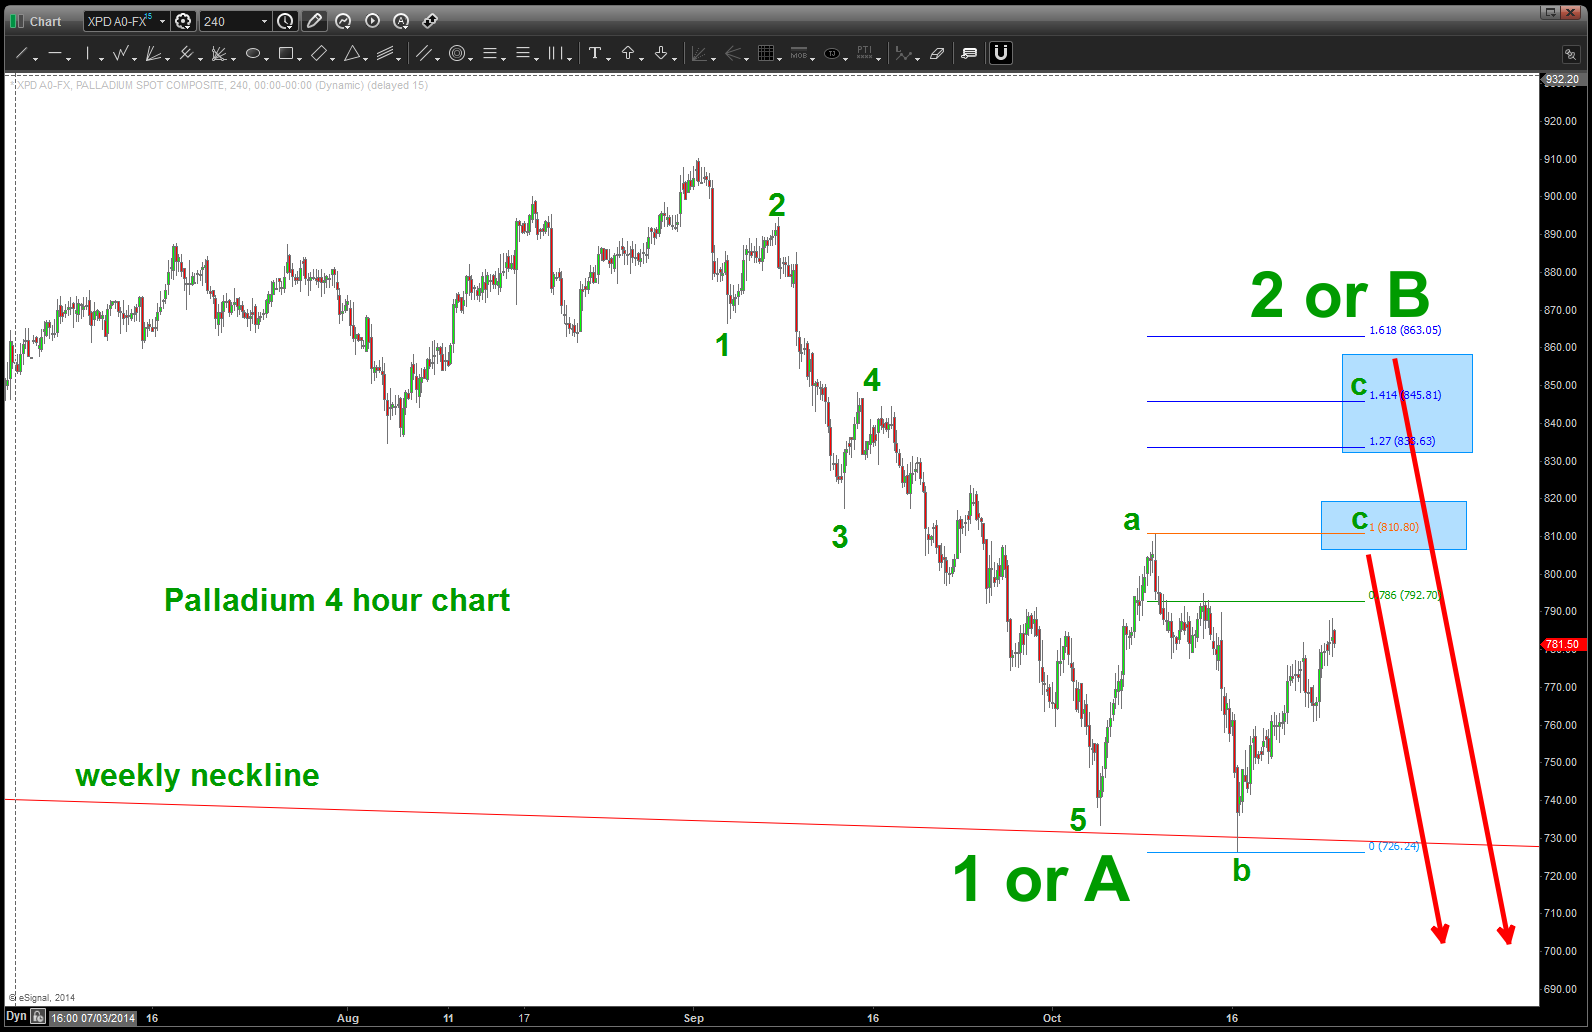
Last – the BUTTERFLY PATTERN is present. Connect two triangles together and that’s the butterfly pattern …
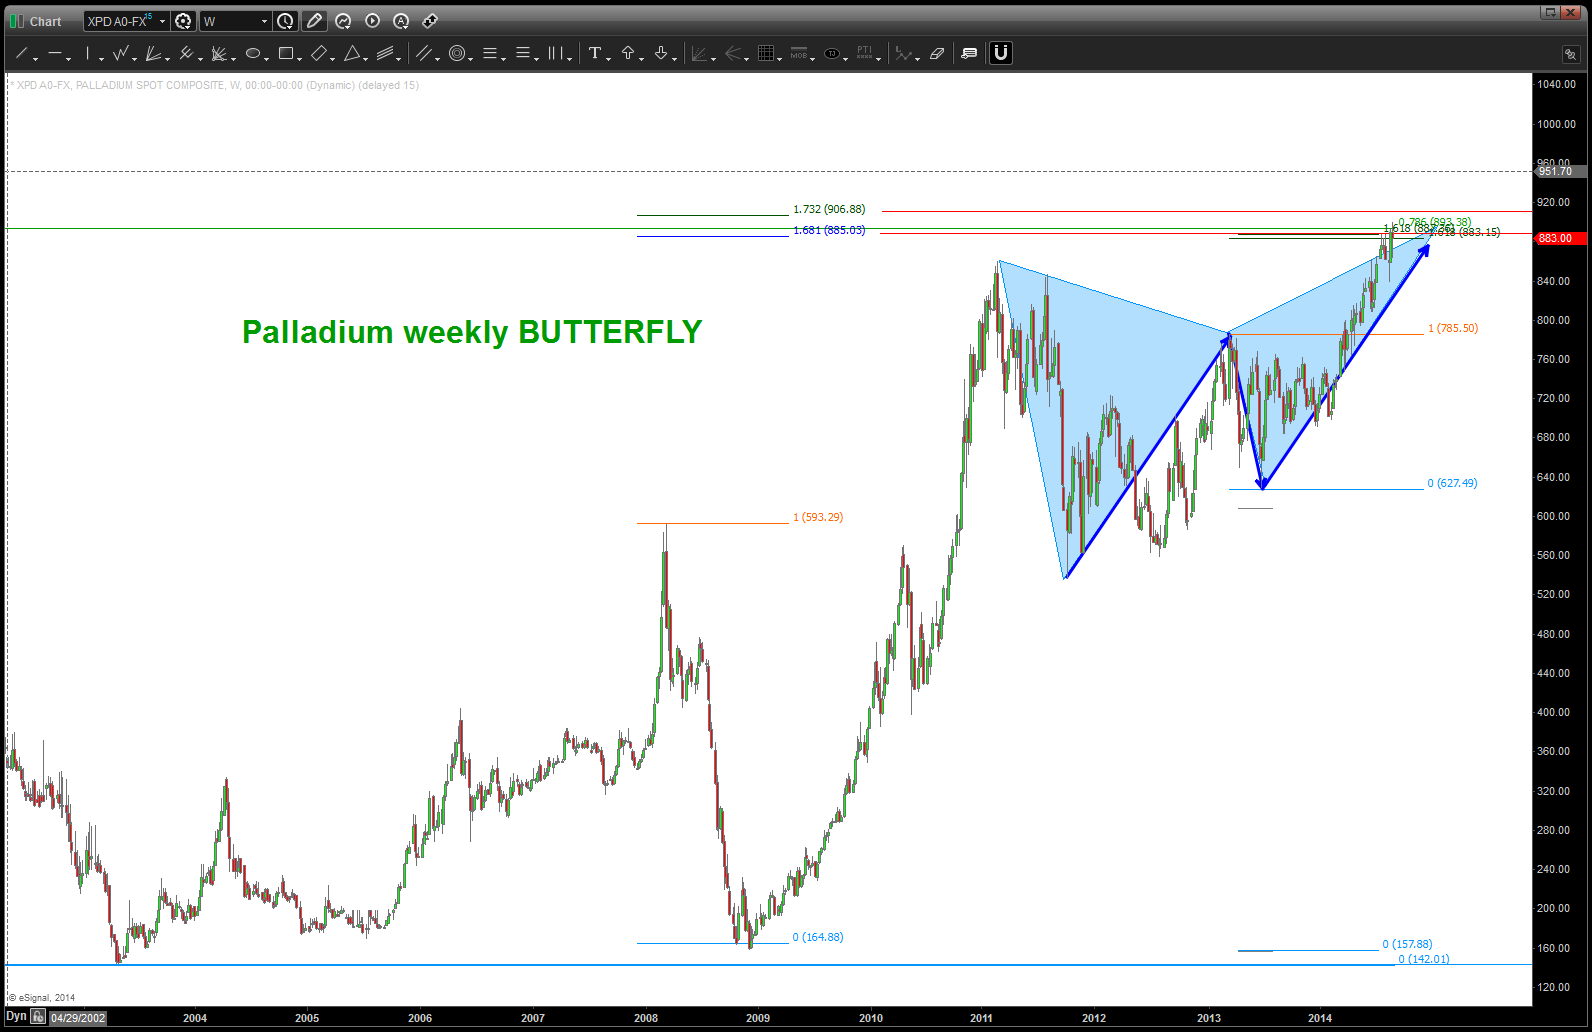
Butterfly SELL pattern
put it all together and here is the picture:
PATTERNS complete on Palladium …
here’s a potential count — note – 4 doesn’t CLOSE below 1 so I say “go for it” w/ regard to the count. Additionally, alternate targets provided at little higher. Sure seems like it wants to head up that way … ?
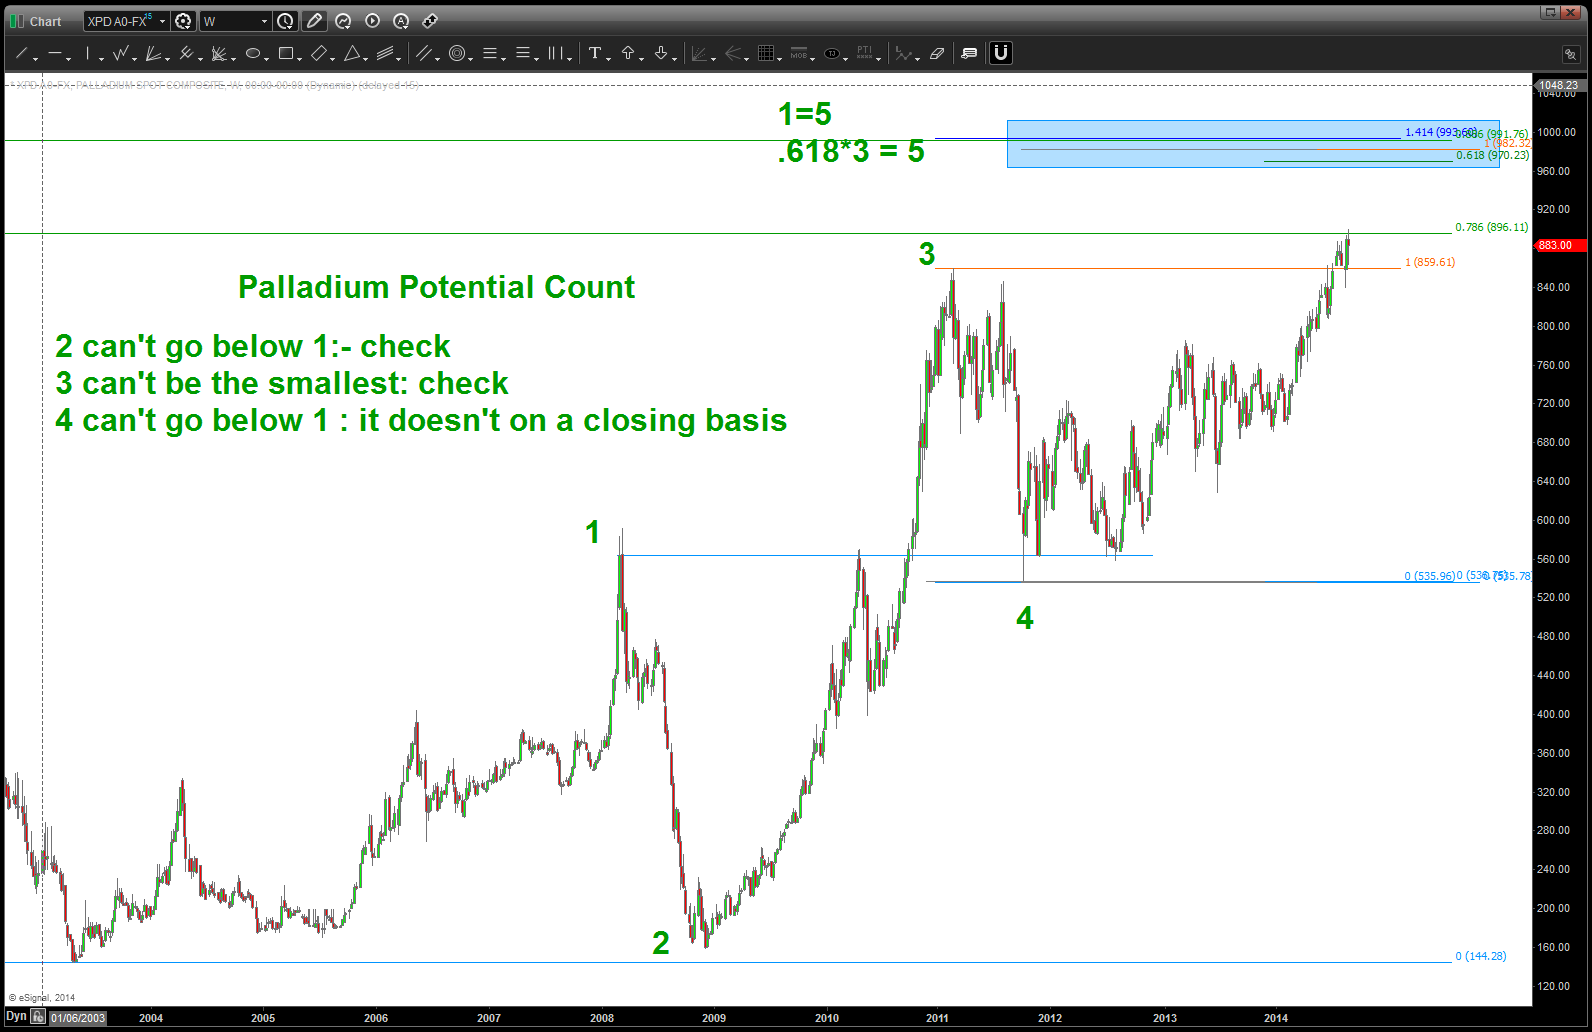
Palladium Count Potential
last thing we check is the “relative strength” using ratio analysis. in this case we have PALLADIUM / GOLD. When we overlay Gold on top of the ration there isn’t that big of a correlation. HOWEVER, when Palladium is overlaid (see below) we can see that this ratio is extremely important. And, what do we have on the ratio – a SELL PATTERN appearing, which, in the past, has caused Palladium to inflect. Stay tuned.
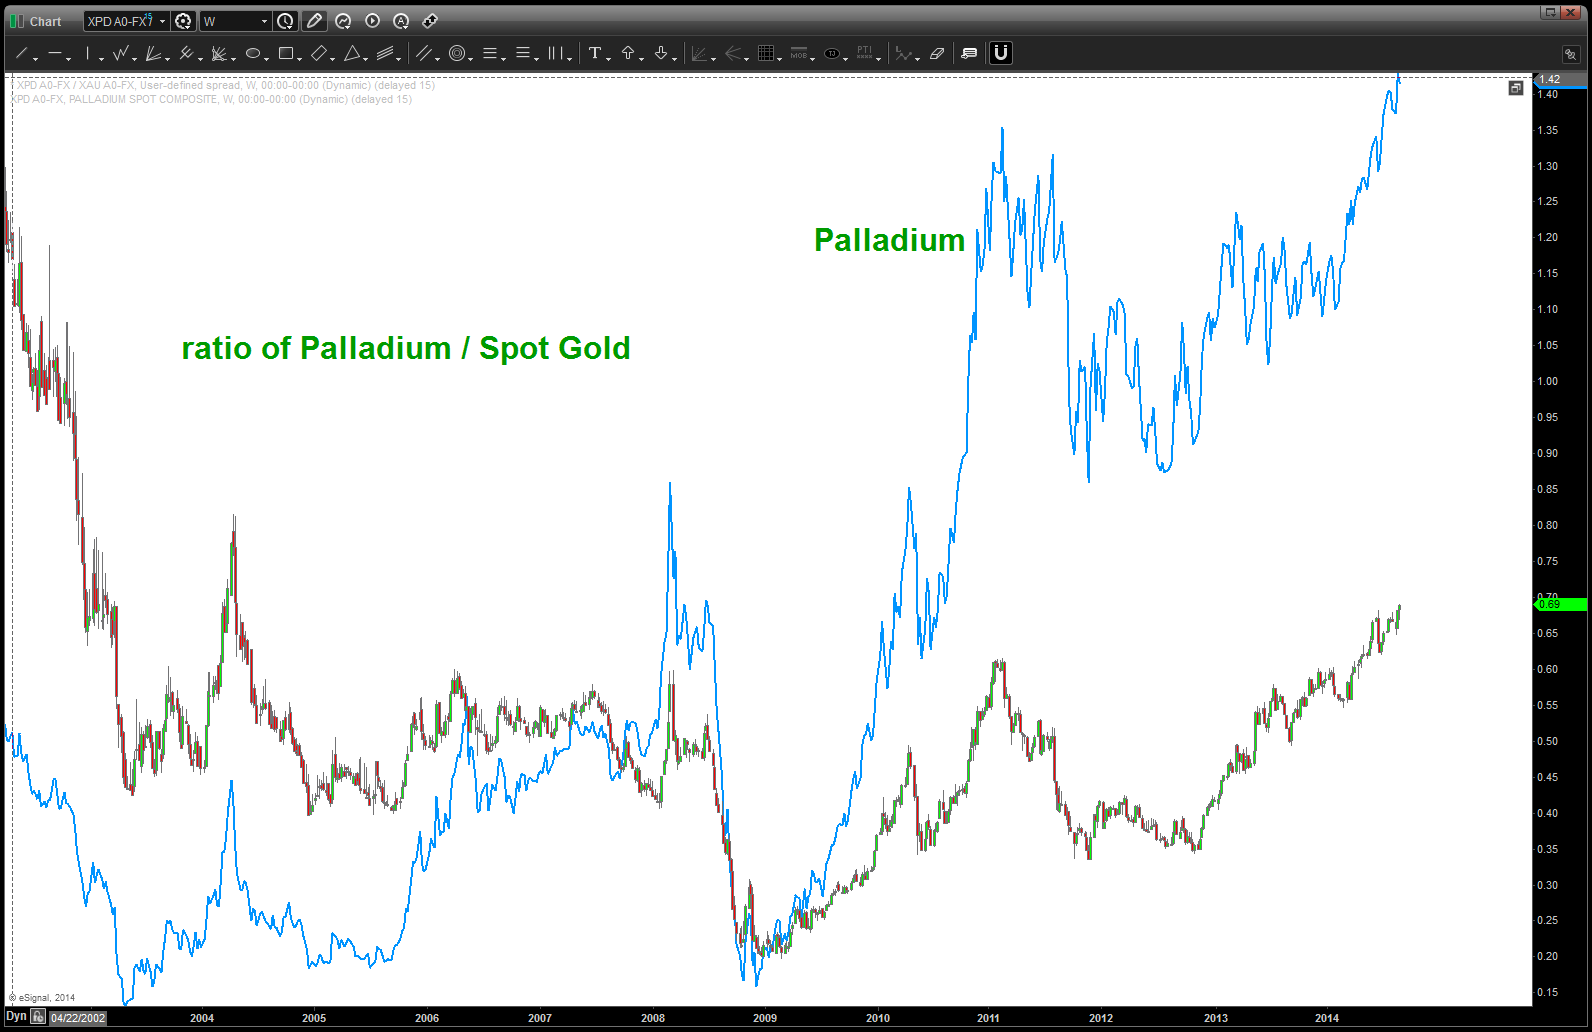
note, palladium prices overlaid and how the ratio is nicely synced w/ the highs and lows.
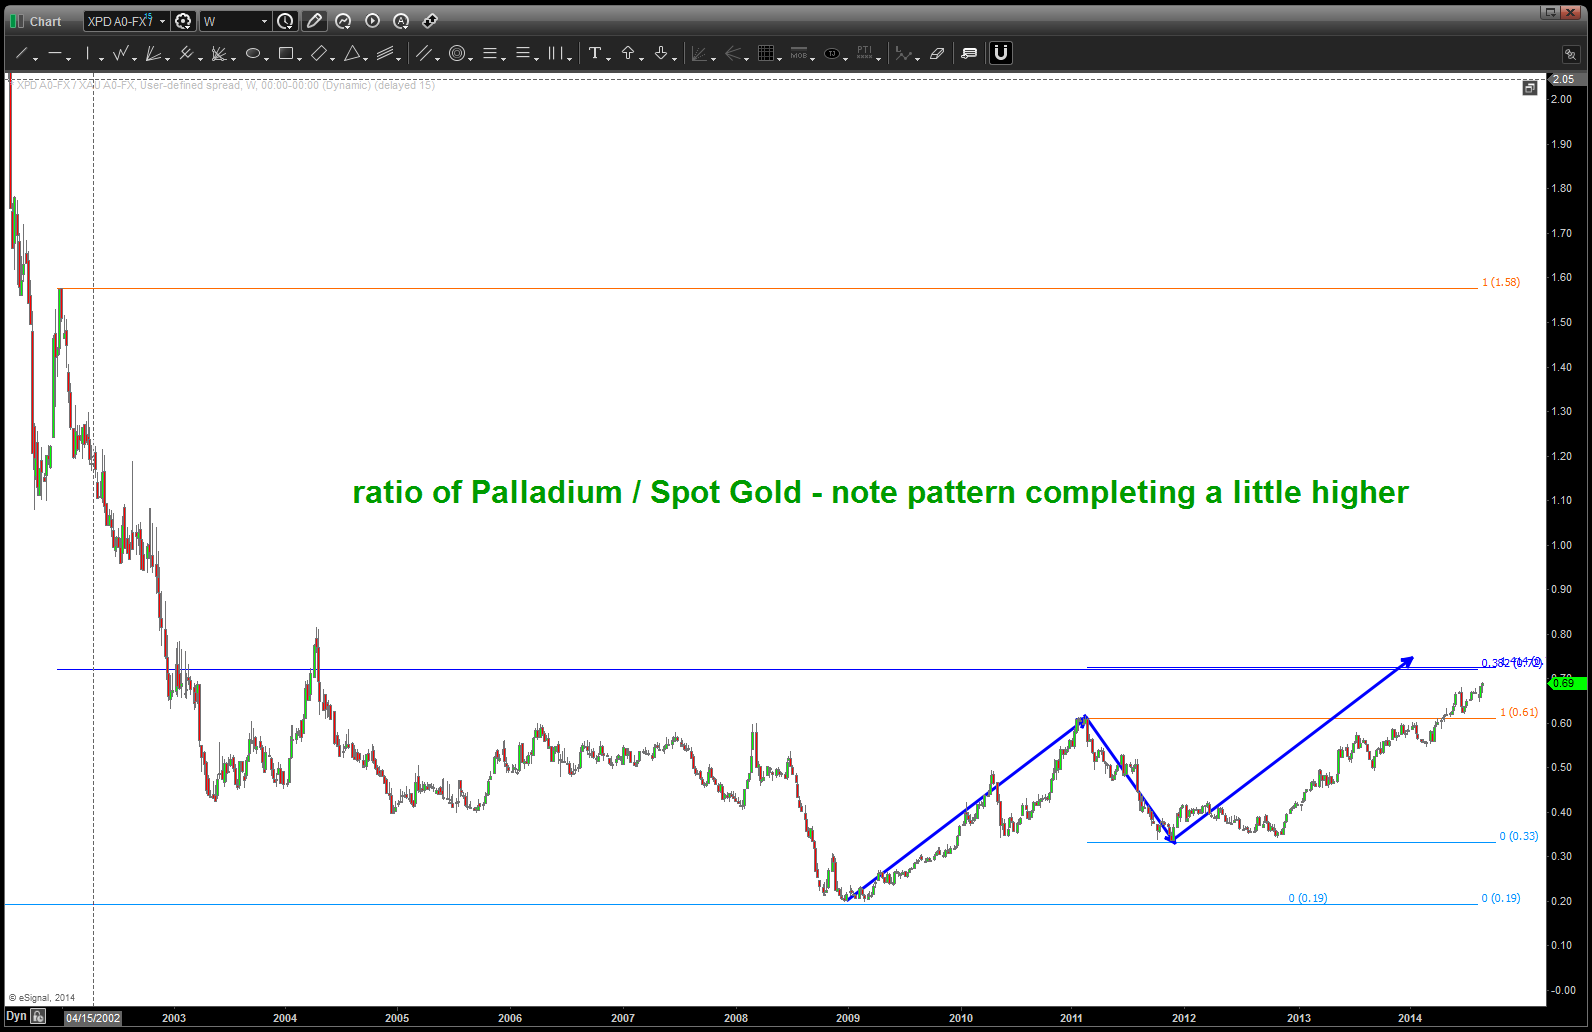
ratio of XPD / XAU – note pattern completing a little higher
So, there you have it … watch this important relationship, closely next week.
BART
