Still the most important chart out there …
Posted on June 9, 2015 Leave a Comment
What is the Chinese Central Bank up to …?

Per Bloomberg.com a couple hours ago:
China’s one-year interest-rate swaps completed the biggest weekly drop in four months after the central bank cut borrowing costs and stopped draining funds in open-market operations.
The People’s Bank of China reduced its benchmark rates for the first time since 2012 a week ago, supporting growth in an economy set for the slowest full-year expansion in two decades. Yesterday’s auction window was the first since July that the monetary authority didn’t offer repurchase agreements at, and maturing contracts added a net 35 billion yuan ($5.7 billion) to the financial system this week, the most since August.
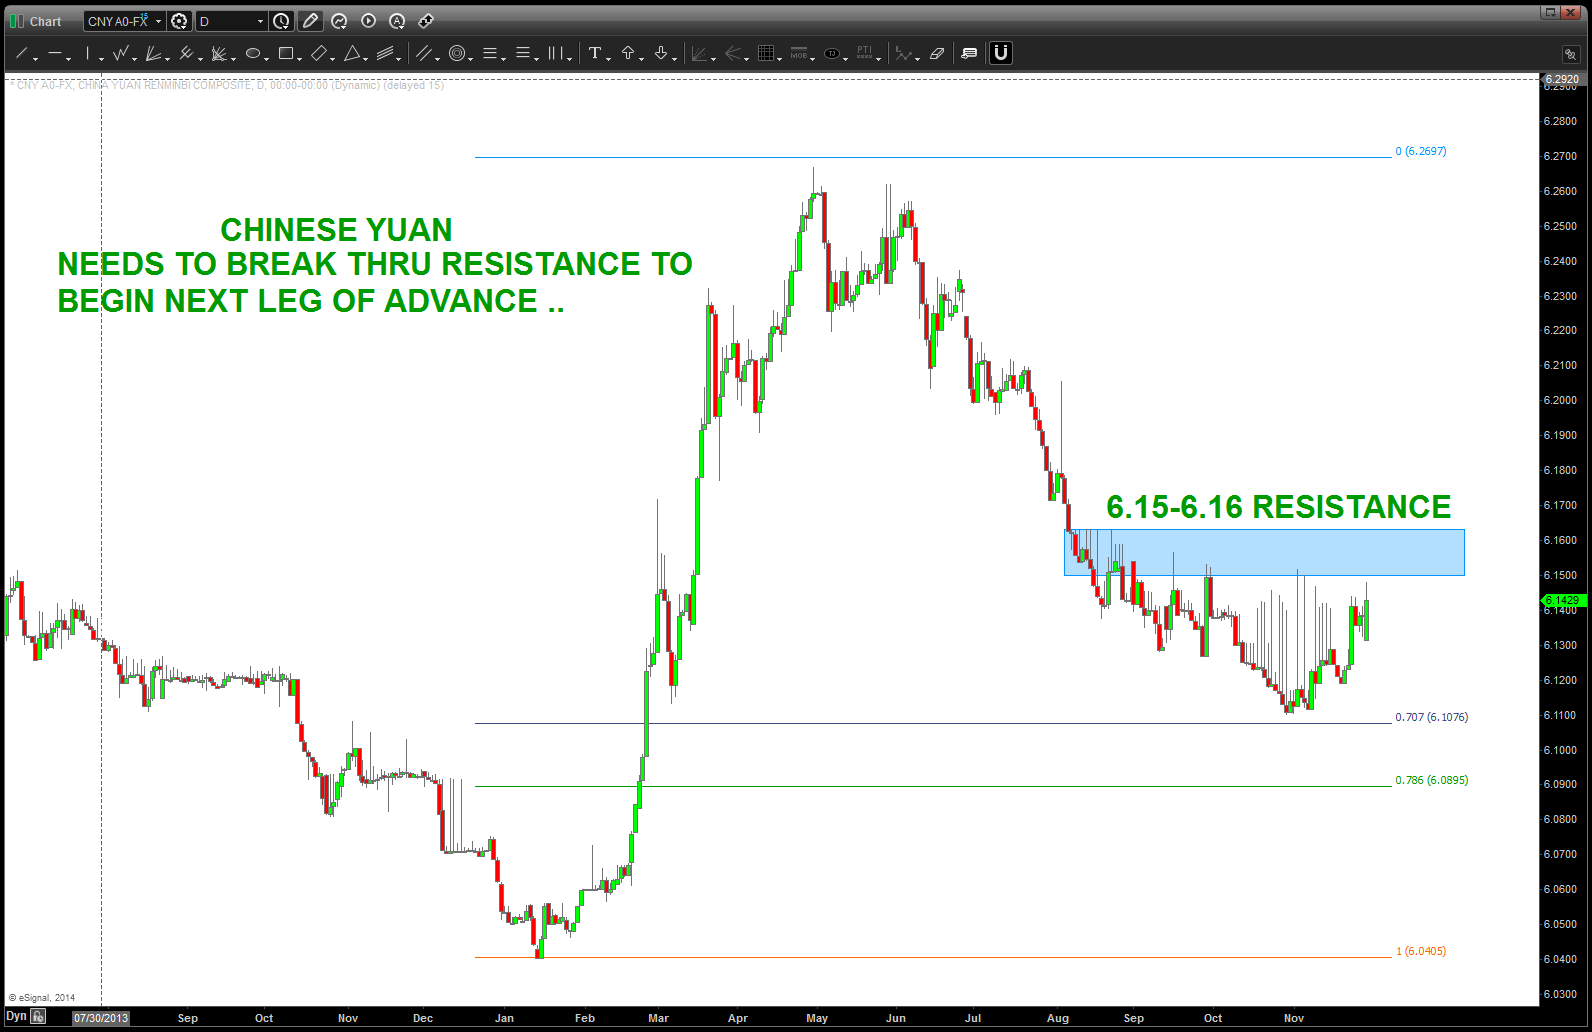
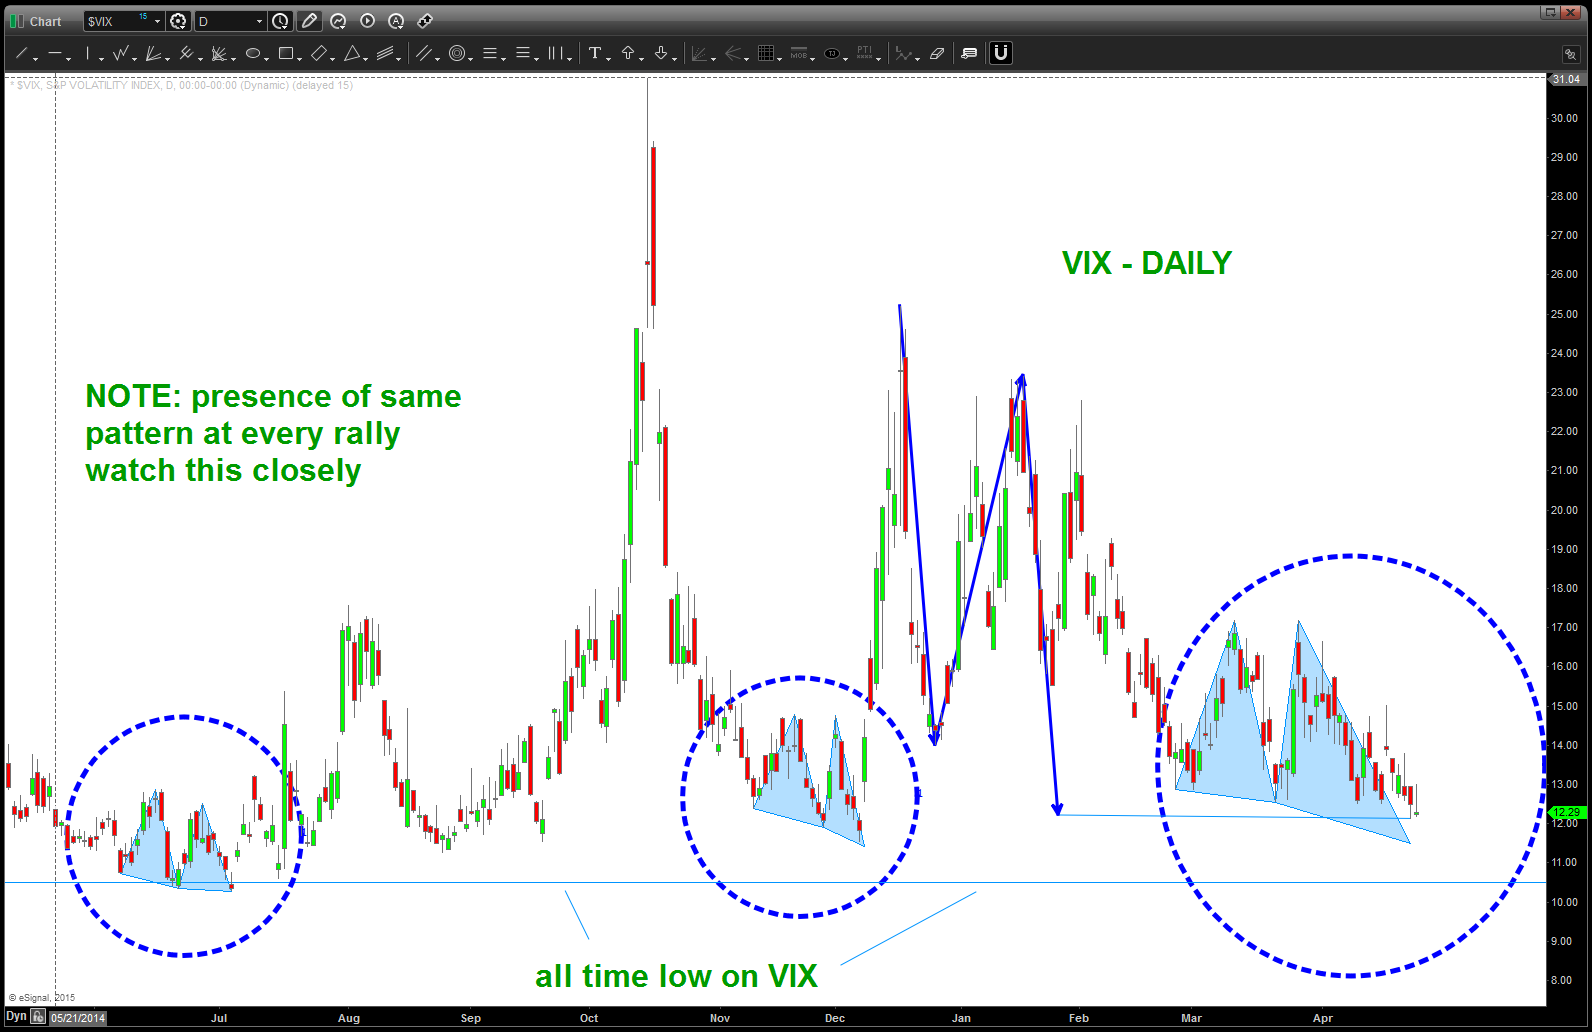
Chinese Yuan Pattern Complete
watch this … closely.
enjoying the amazing work @seeitmarket
Posted on June 2, 2015 Leave a Comment
Did some work on Goldman Sachs …
enjoy and look forward to your feedback!
Bart
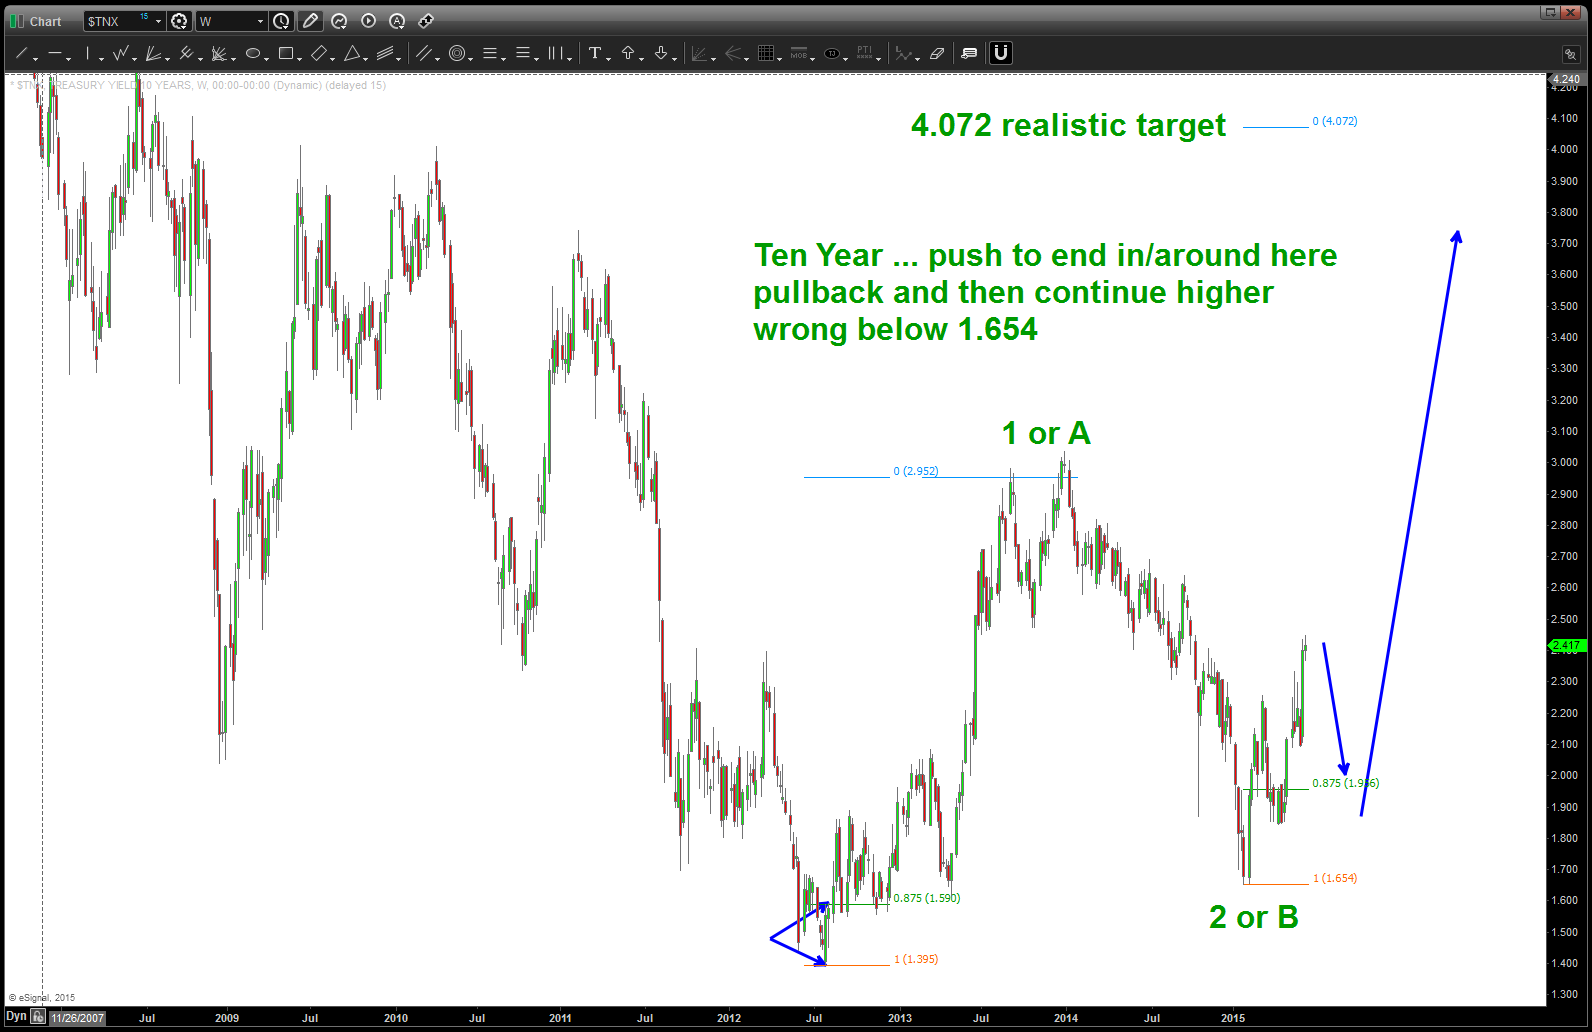
TLT post w/ @seeitmarket
Posted on May 18, 2015 Leave a Comment
Please follow this link to take a look at a potential TLT play … http://www.seeitmarket.com/20-year-treasury-bond-tlt-nearing-price-support-target-14375/
Nike updated … target coming into play
Posted on May 17, 2015 Leave a Comment
Below is a post that I did from November 2014 roughly 7 months ago.
Targets for NIKE are coming into play.
Hope your having a great weekend.
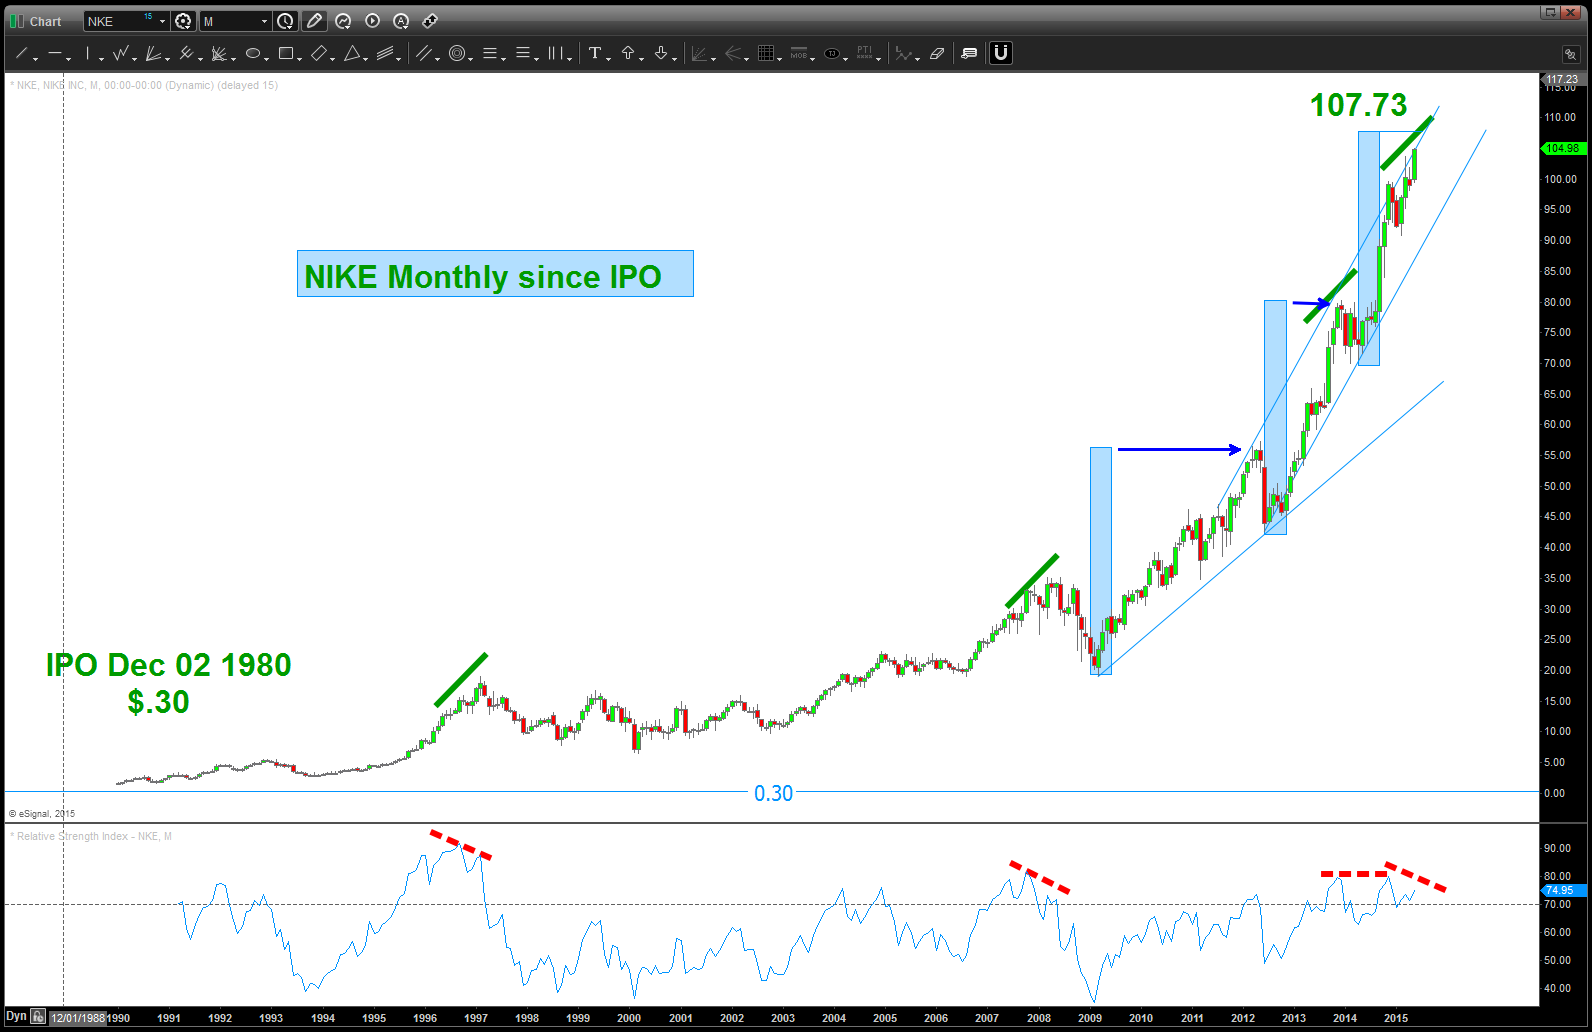
NIKE Monthly Updated
I’ve shown this technique, successfully, on the parabolic run in IBB, AAPL and others. I’m not going to repeat it here – search on this website for IBB or AAPL and Sir Isaac Newton and the APPLE falling from the tree. But what I’m going to do is go chart by chart to TRY and figure out when the Tv=0 (Terminal Velocity) and it falls like a rock, literally. These types of charts scare me …
- I have NEVER seen a parabolic rise that doesn’t swiftly lose 20,30,40,50 % of it’s value .. never.
- I have NEVER done this exercise on Nike (NKE) Fact is I like Nike, just bought a pair of running shoes the other day and they employ my daughter at the local outlet mall. But, shoving that all aside – it’s parabolic and that’s just not good.
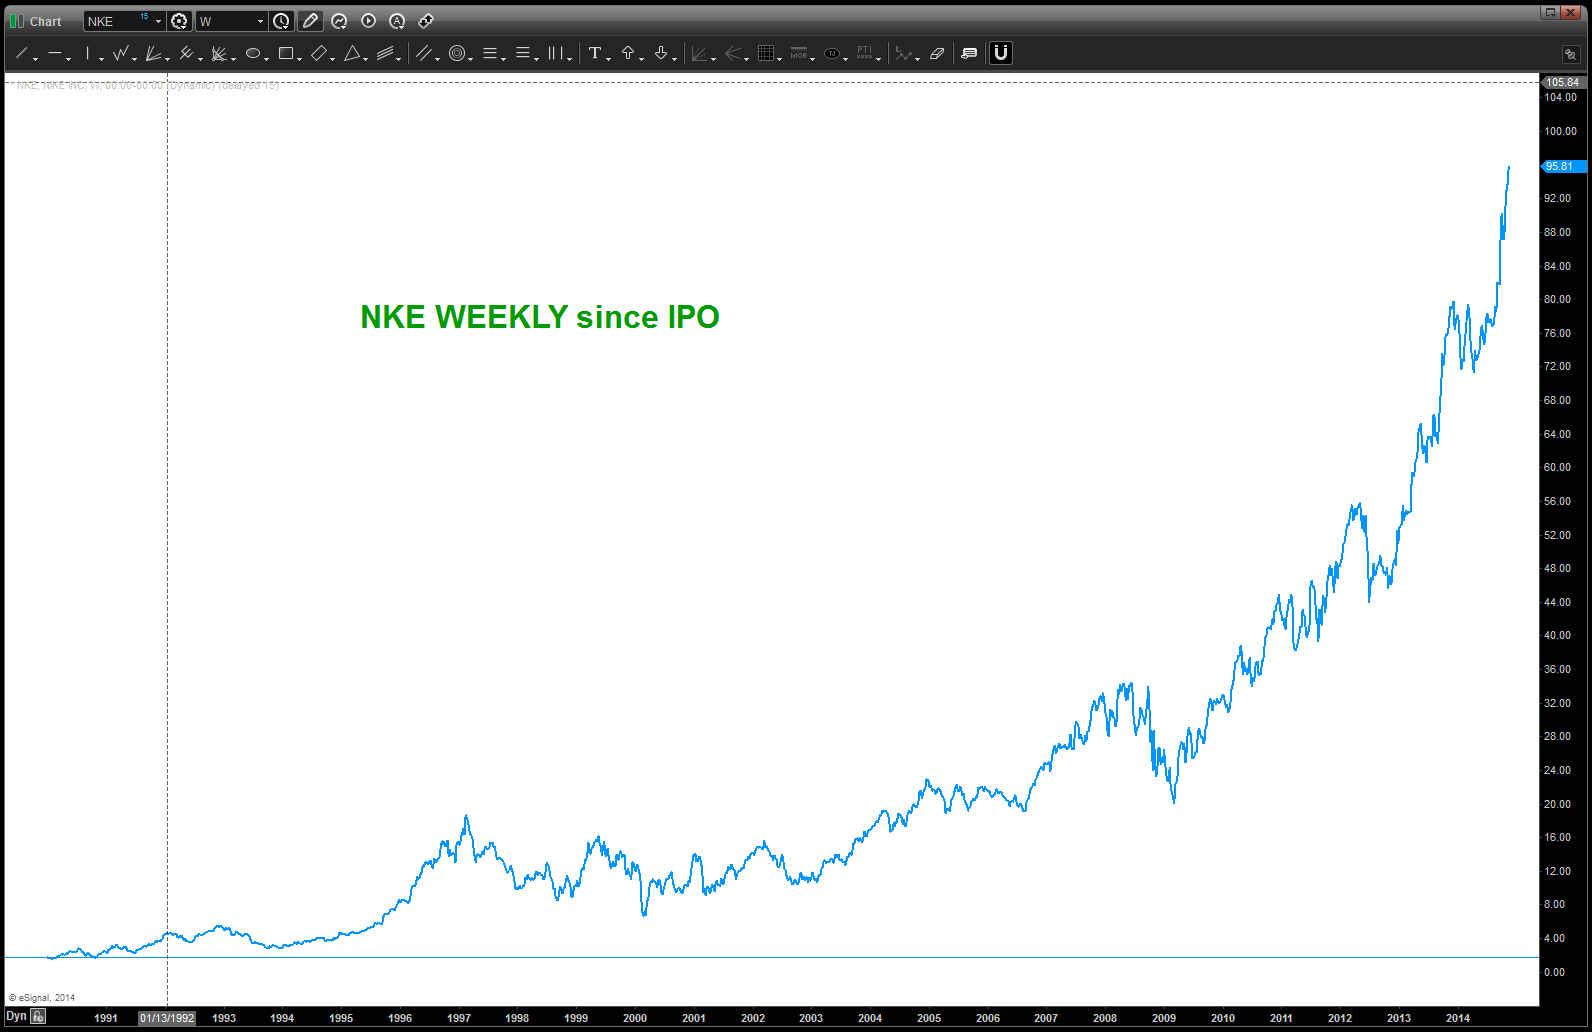
1. Chart of NKE
- note, used the “line chart” so I could fit the history of the stock into the screen and scaled it down considerably. using a line chart helps you.
2. Pick 3 points, that make sense to the eye, and calculate a circle from those 3 points like the dude did in the video link below
- Use this link from geometry we learned in elementary school: http://www.youtube.com/watch?v=GUgMOzwCBEE
- Or “GOOGLE” – “how to make a circle from three points …
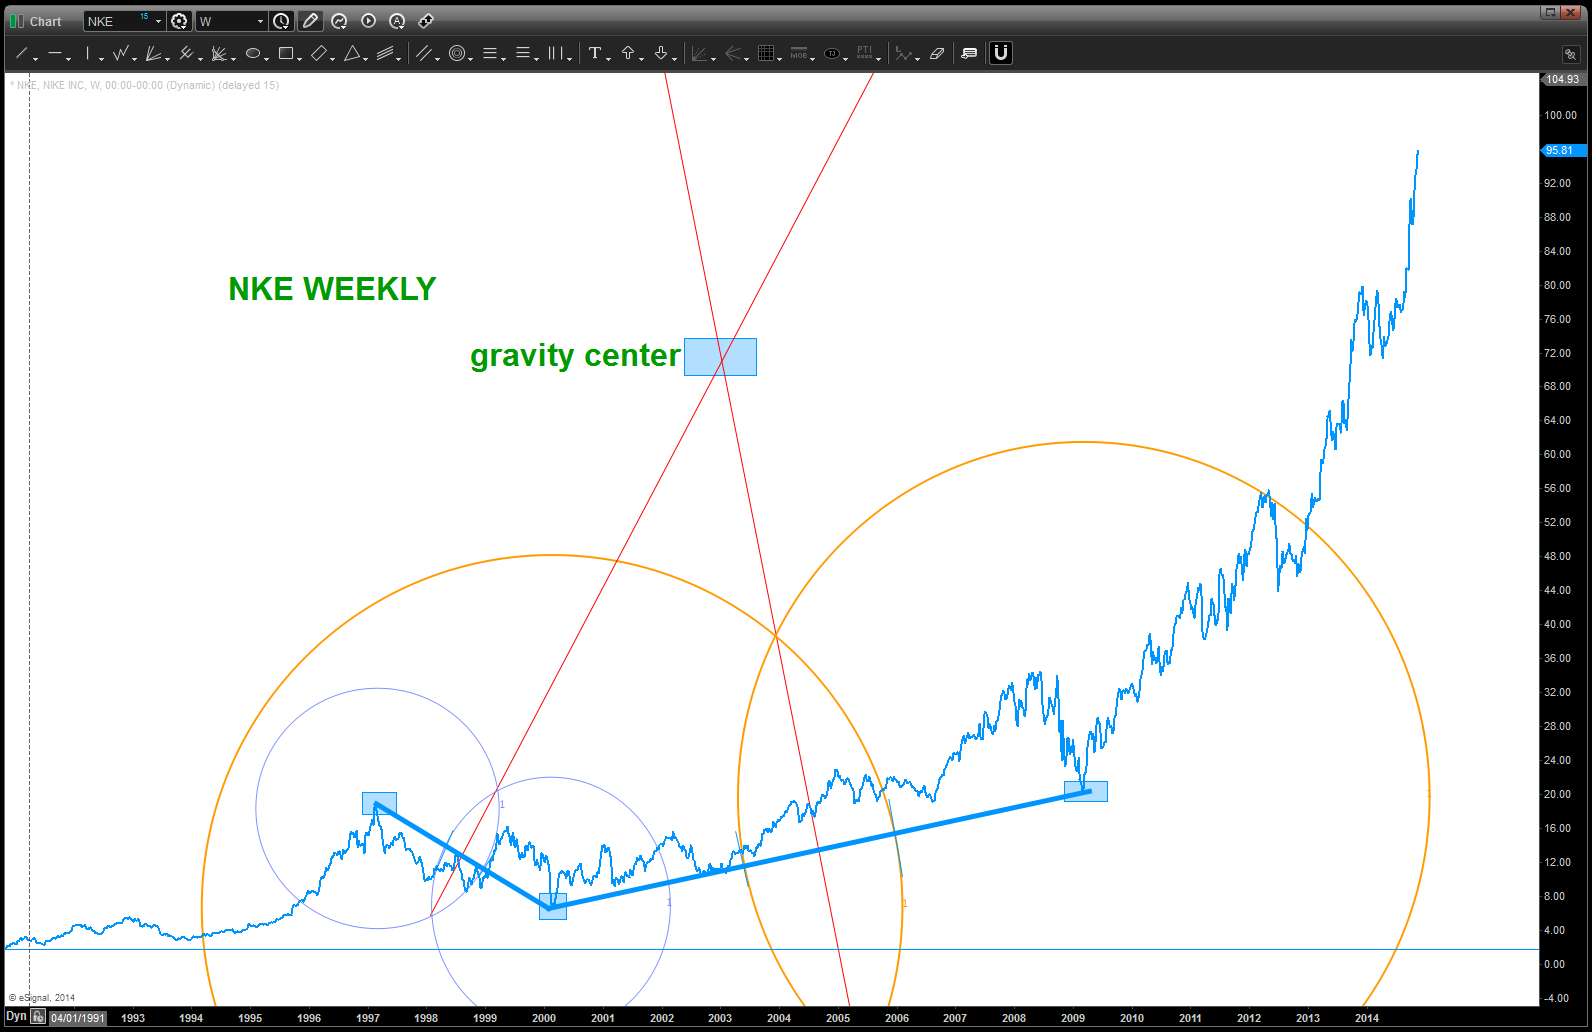
3. Here’s the picture w/ the gravity center and the arc shown. I don’t like it, you’ll see why. So have we done something wrong? No, just not using the right grid. Do you see how the all time lows did their own “mini” parabolic run back in 1997? So, decided to shift up the low horizontal grid line to the “next” low and … look two charts lower. Please pay attention to the annotations on the chart.
Note, by using the all time low to extract the radius from the gravity center it was not a good fit to the eye or thru geometry. Scratch this one …
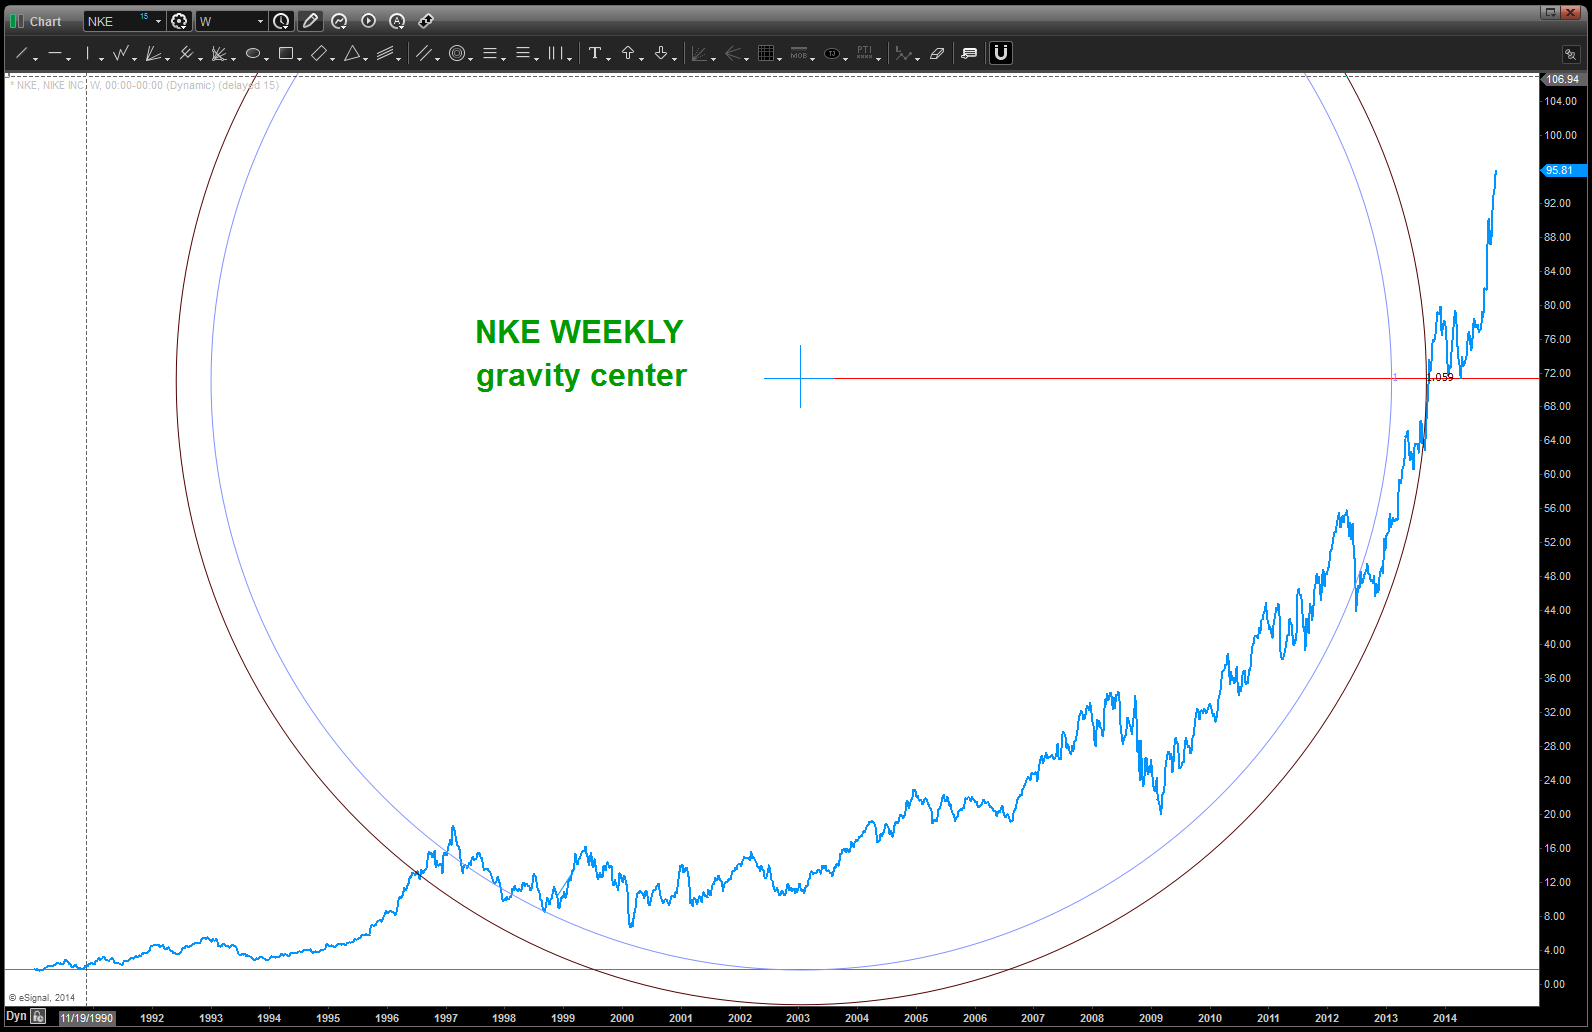
this grid workds
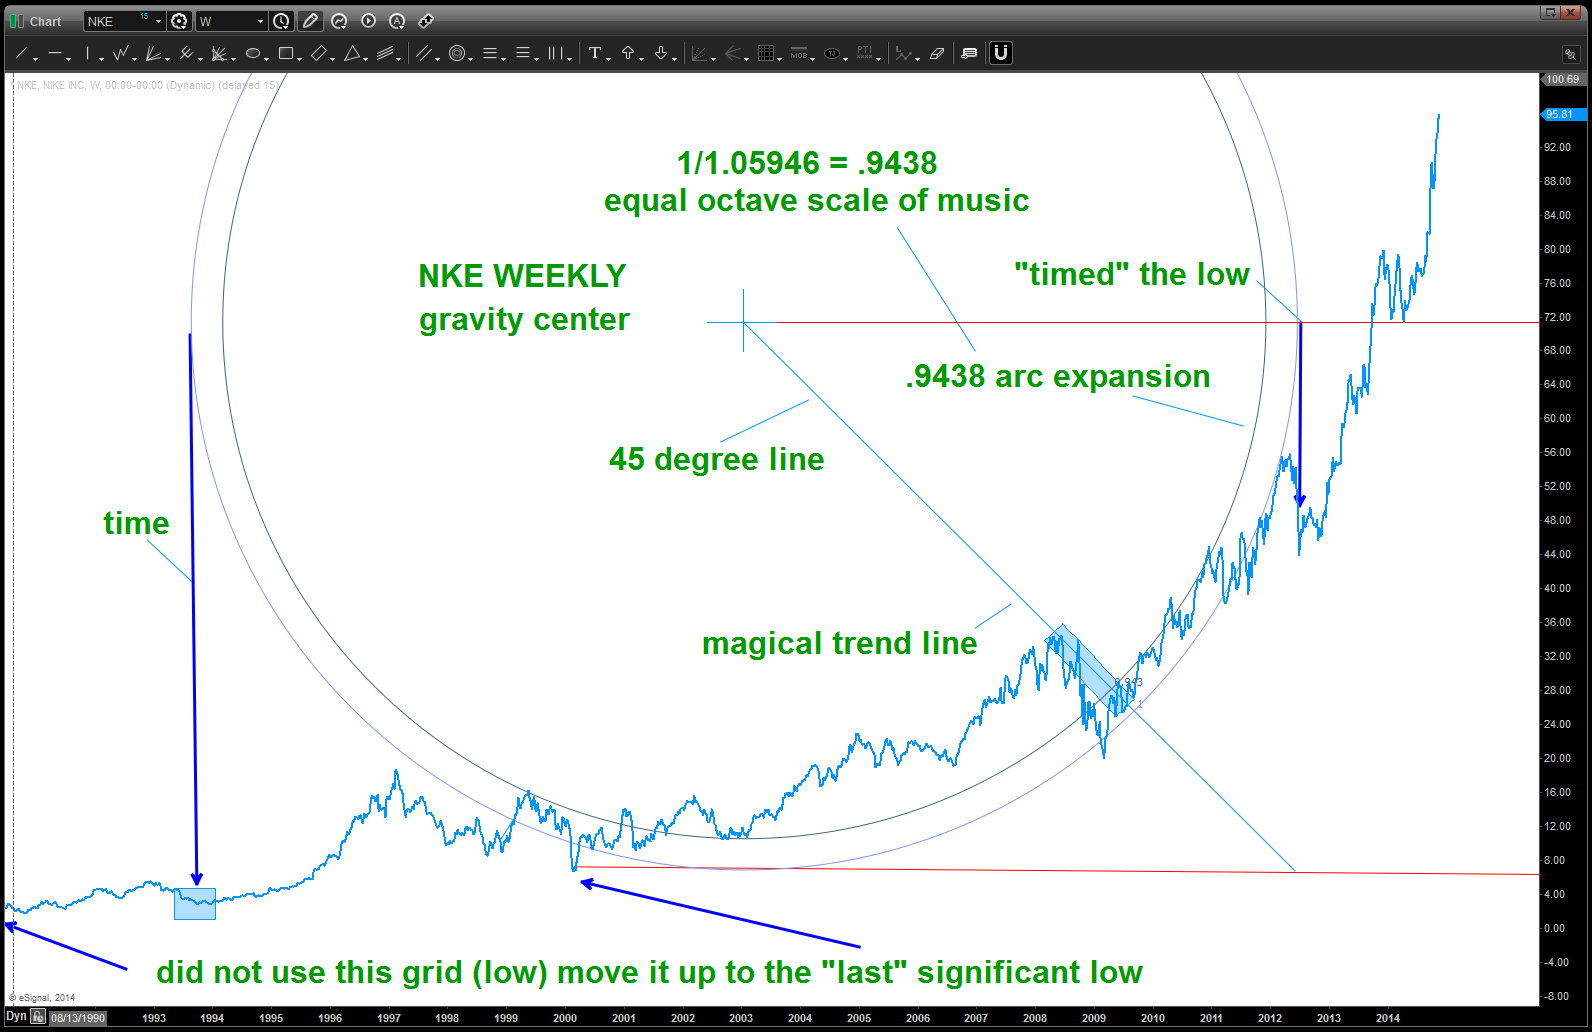
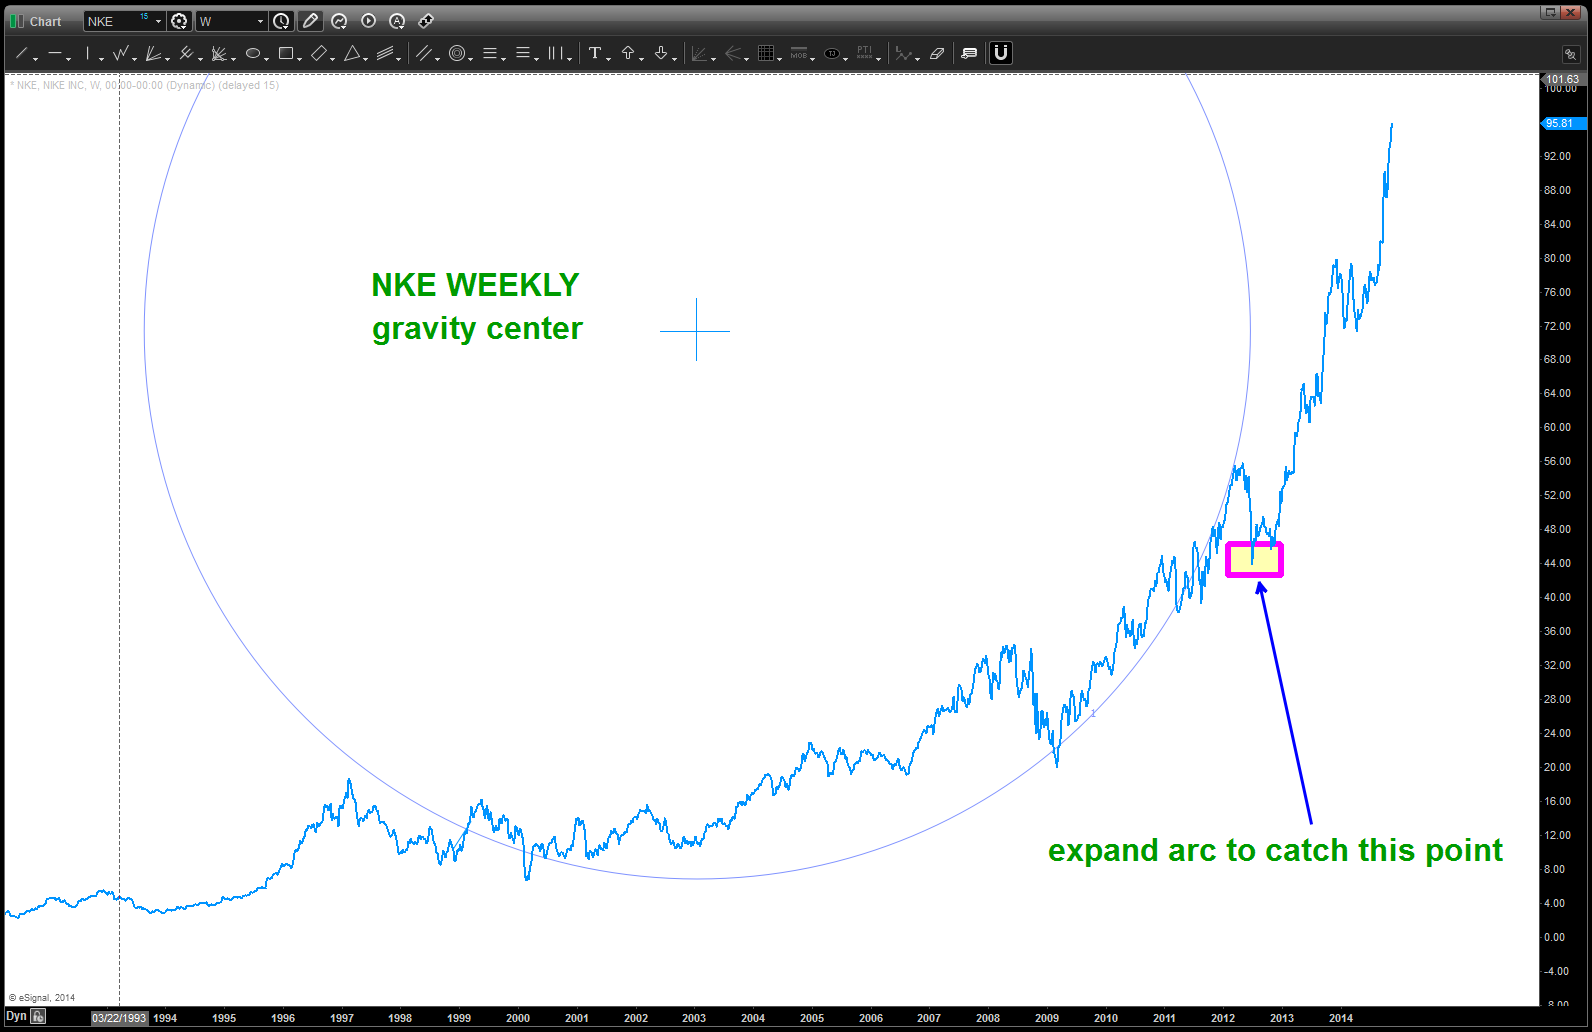
4. Now, we need to catch the highlighted area w/ an expansion of our 1.0 arc. This expansion is not arbitrary .. it will be derived from sacred geometry ratios, equal octave scale of music and Fibonacci. When we catch this point we then look at the parabolic extreme point at 3 o’clock on the arc.
what you’ll see is I used the musical ratios: 1.12248/1.1892/1.2592.
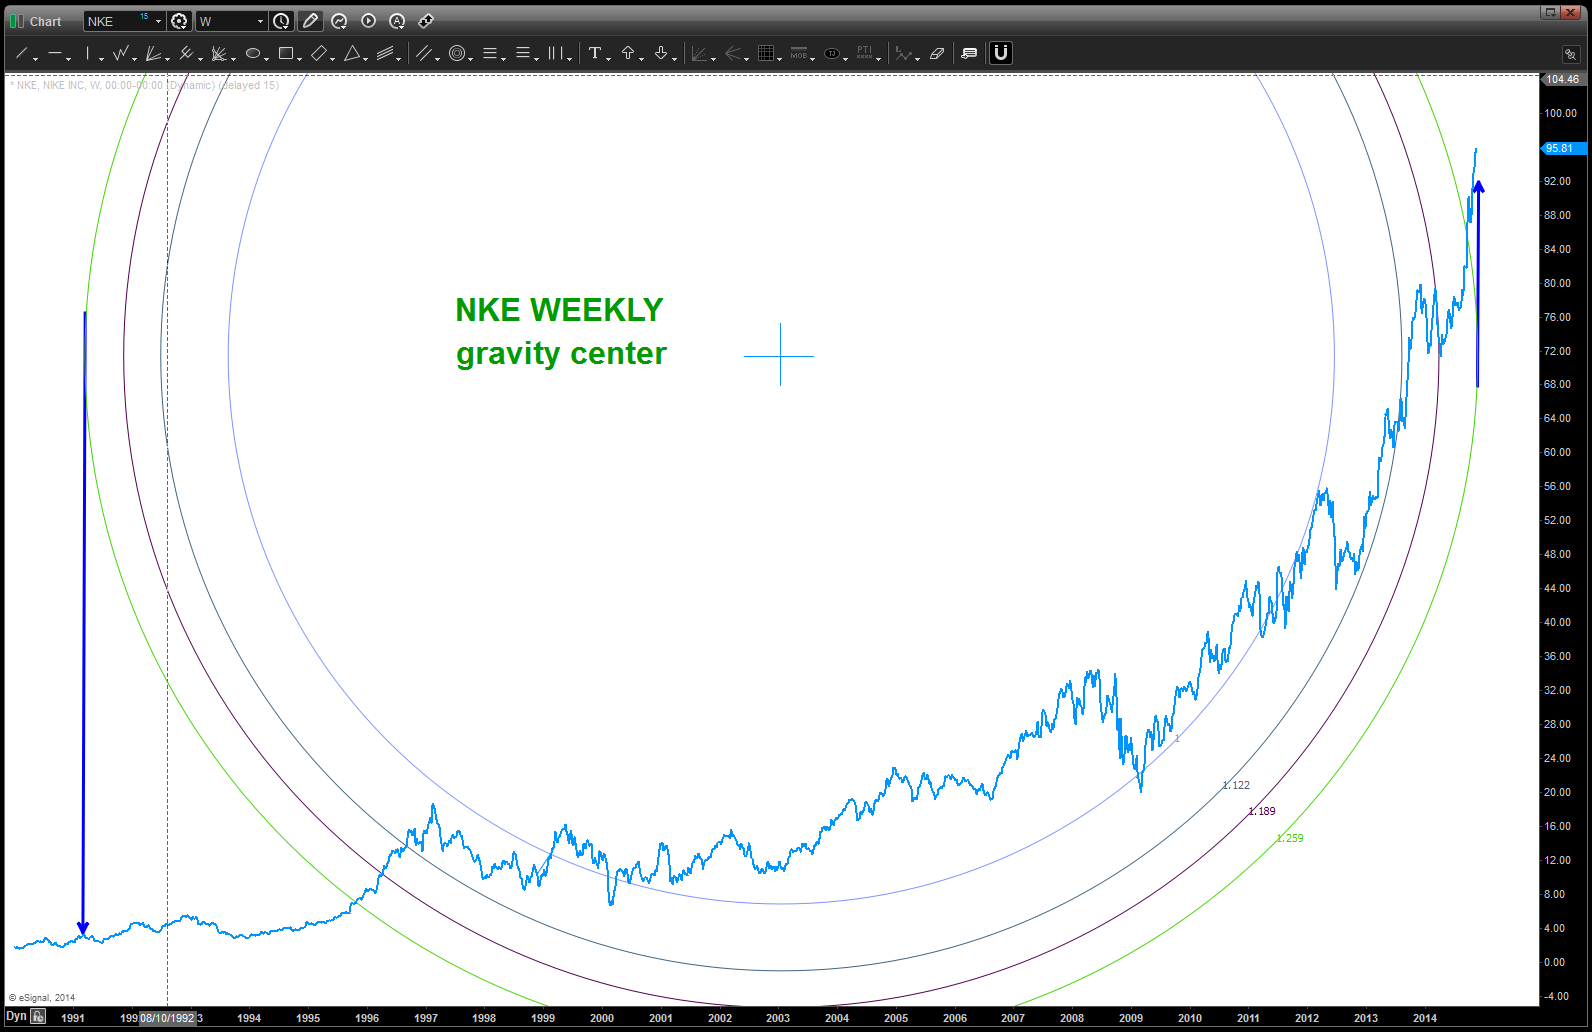
the green ratio could be it … so what else can we try?
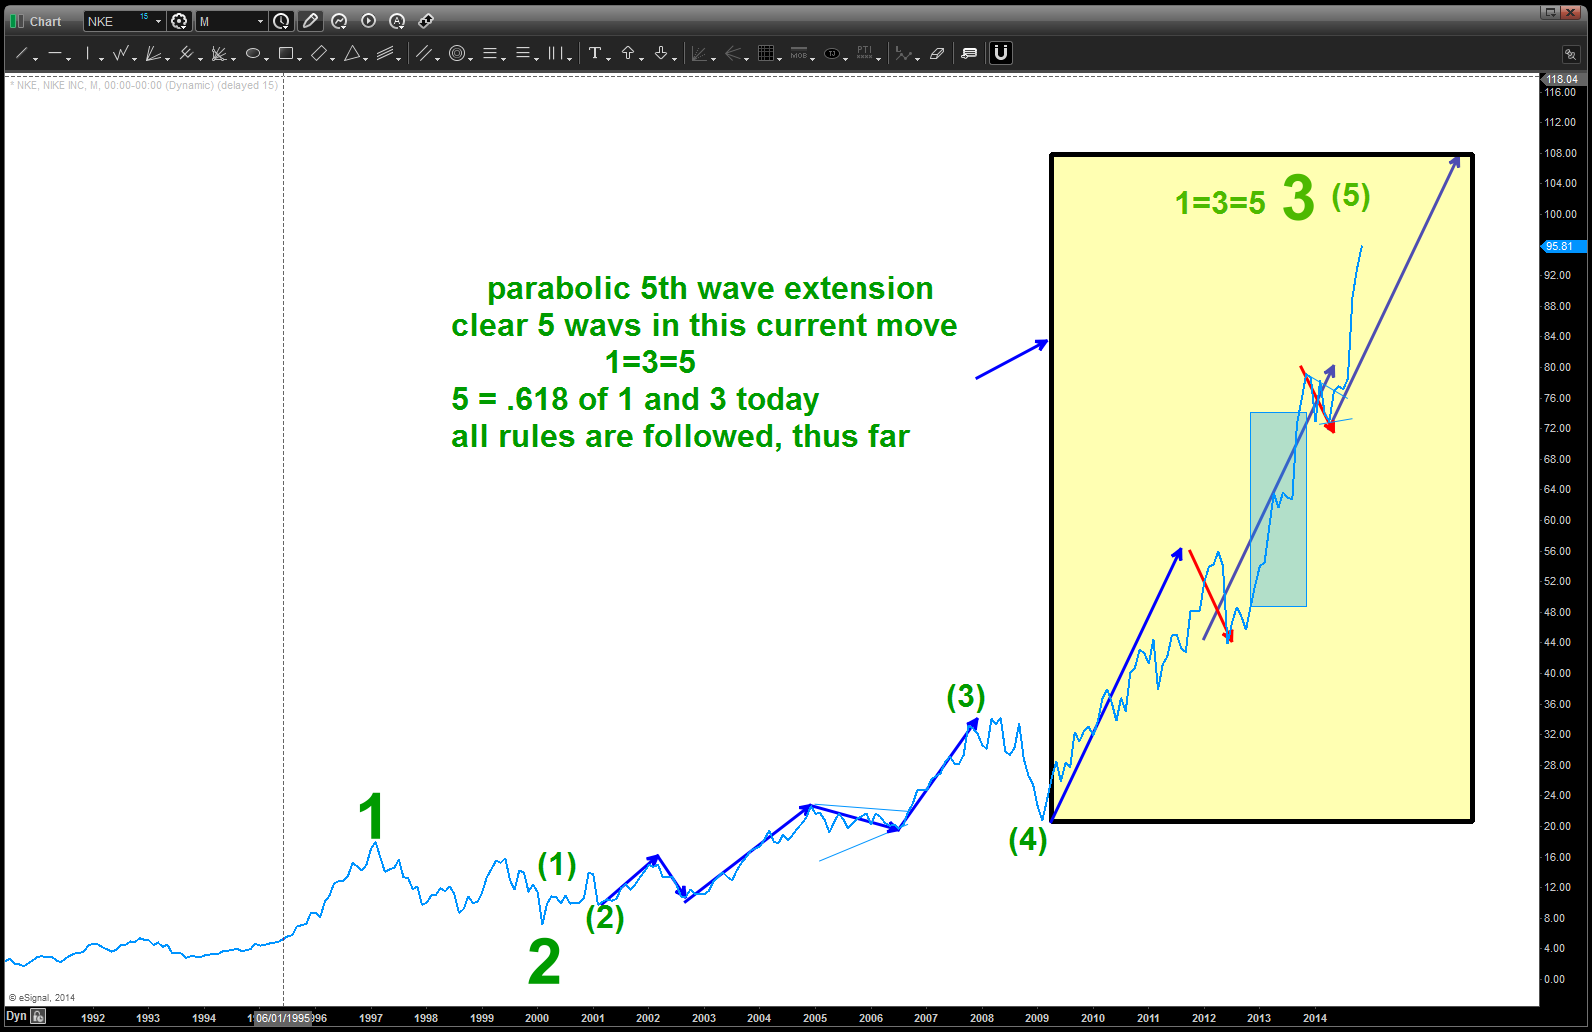
5. Elliott Wave perhaps but in log scale …because that allows us to see long term waves better, that’s and, also, take it out a scale (monthly) to remove most if not all of the noise.
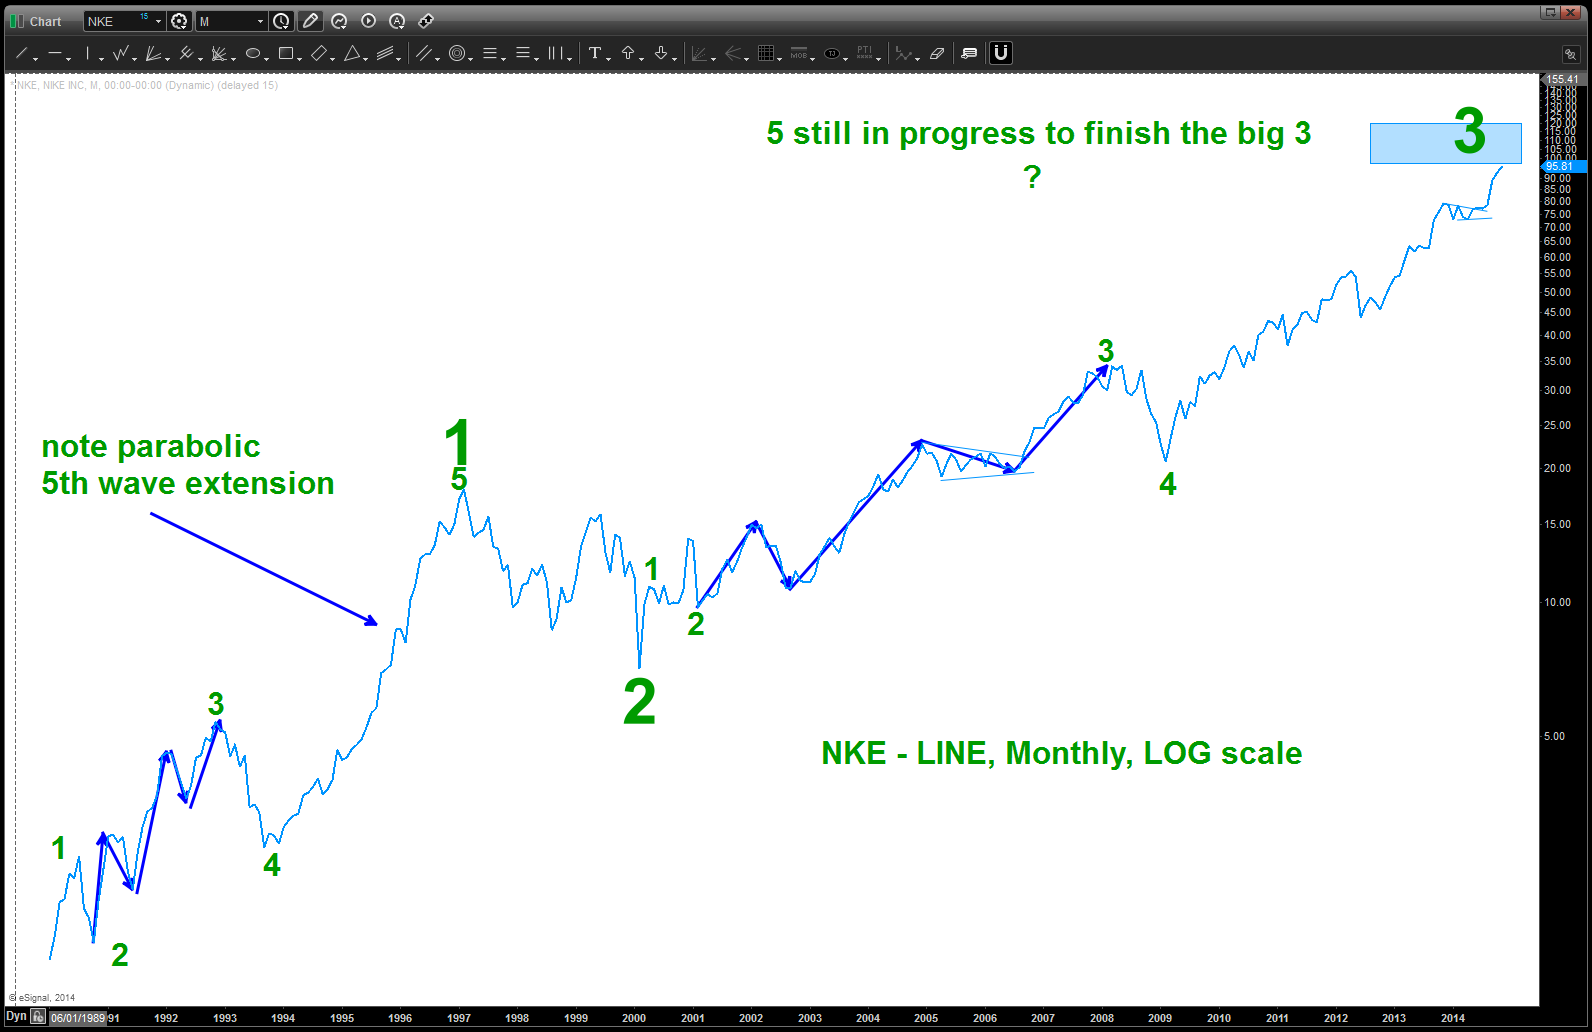
so looks like a nice 3 is in progress perhaps … I’m having a tough time counting the squiggles on this last wave and if that happens I simply WAIT for a form/proportion to show up. Remember, it’s PARABOLIC right now so it is hard to count …but in the context of being on the right side of the market … would definitely look to take profits at the first sign of a weekly signal reversal candle. so, if it’s hard to count then, perhaps go back to the normal scale?
6. How about bearish divergence on ALL of the DAILY, WEEKLY, MONTHLY? (remember his is real time so I’m not sure if it is present or not)
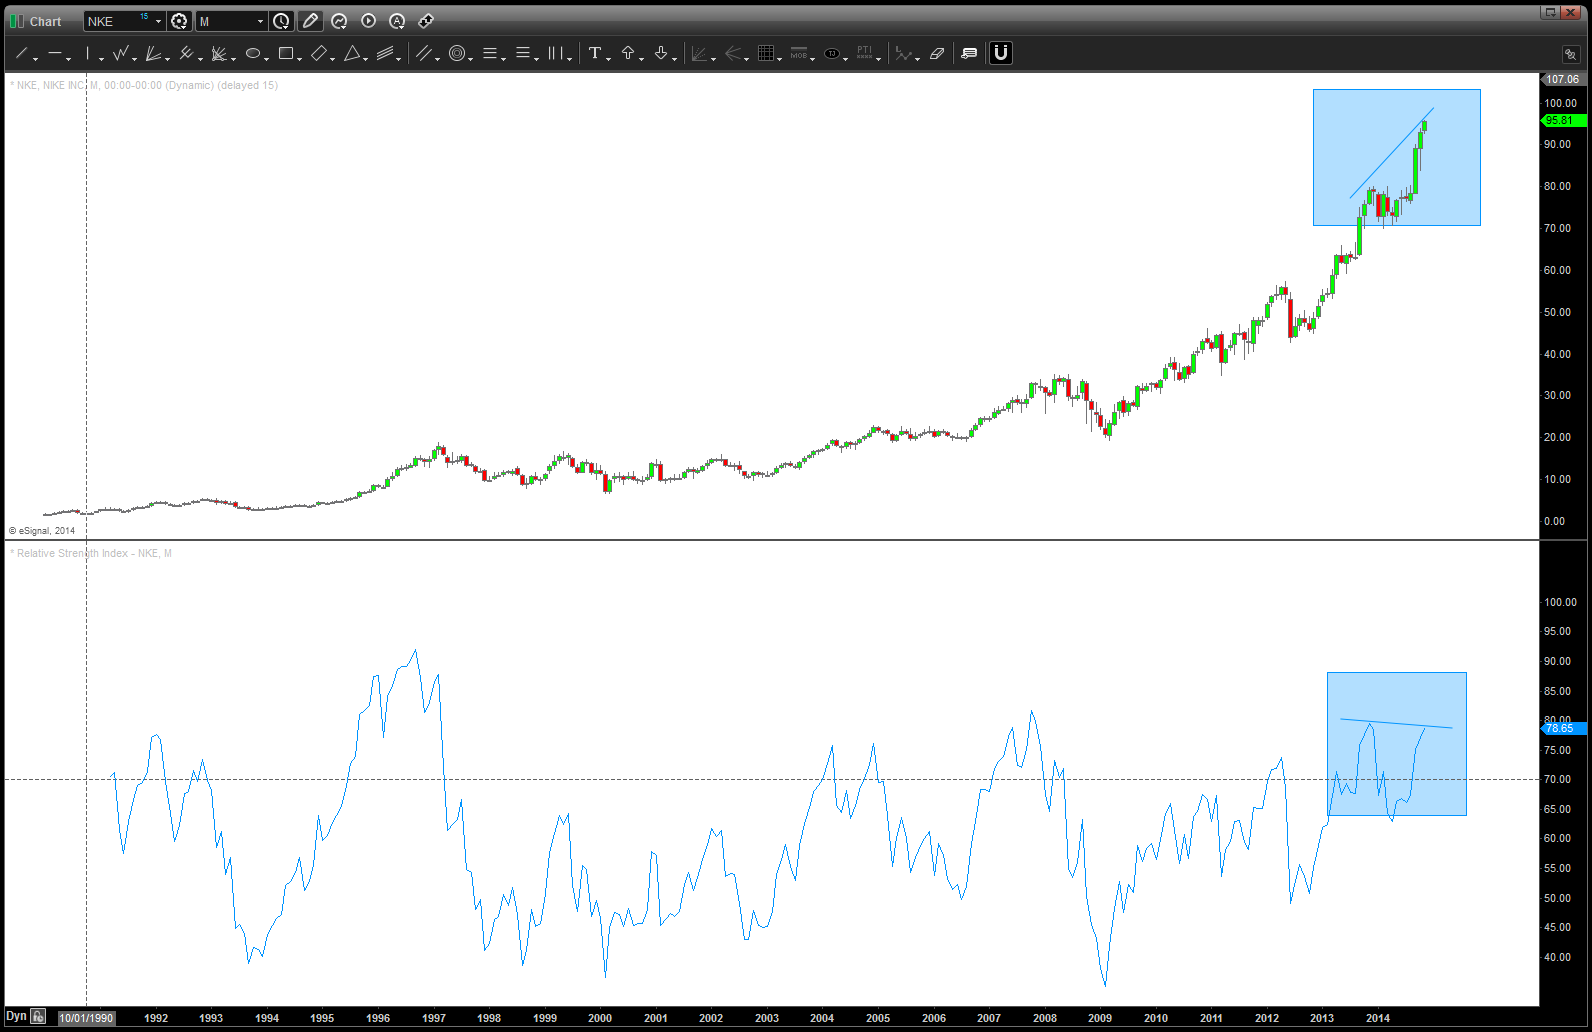
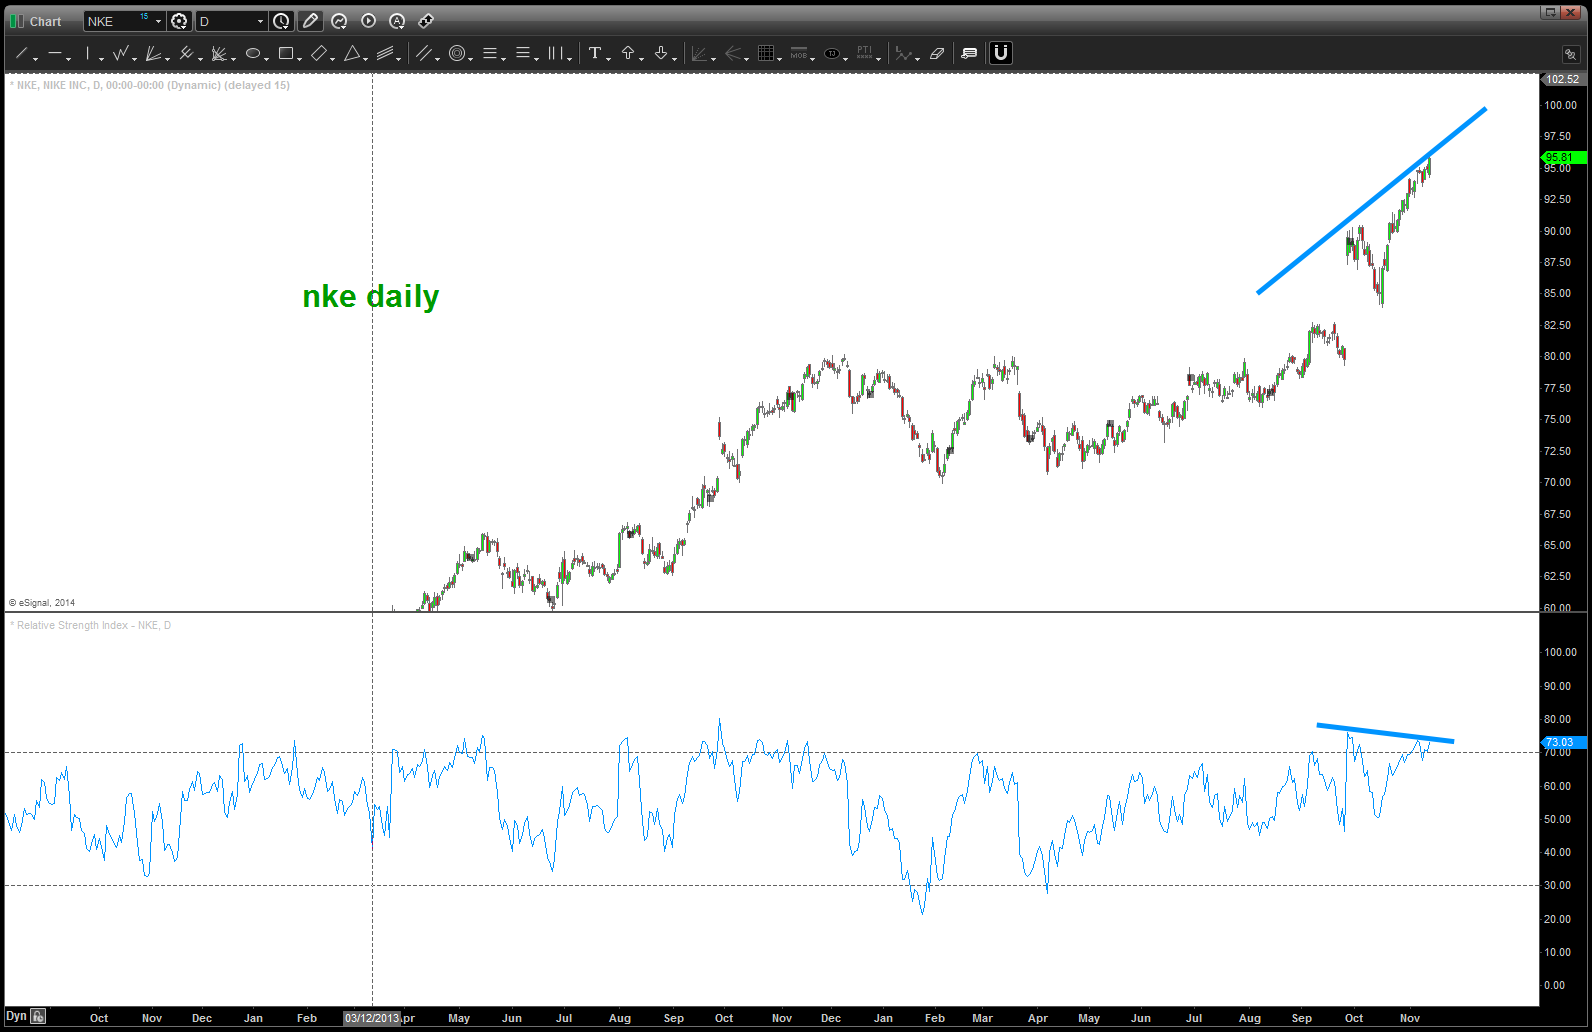
It’s kind of present but not screaming at me ….
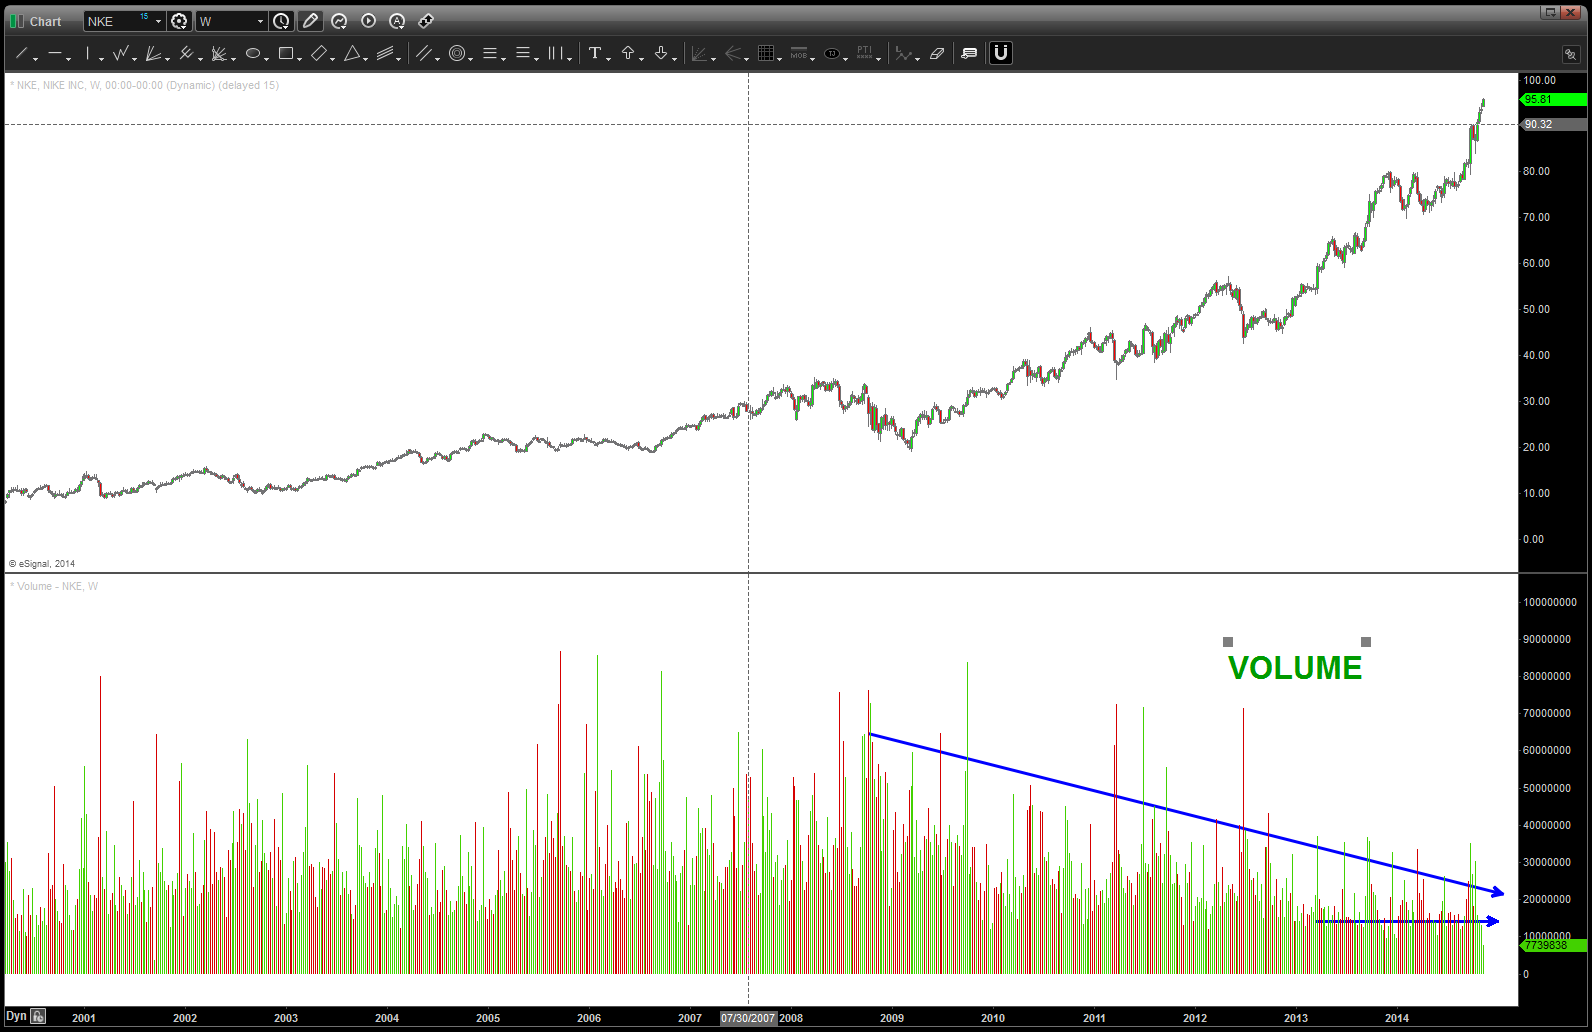
7. take a look at volume – it’s holding in there but note the steep drop off the last 4-6 weeks. hmmmmm
8. one last … threw a 50 day simple moving average on their to look for “reversion to the mean” – basically are we at an extreme from the median of the 50 day? YES ….
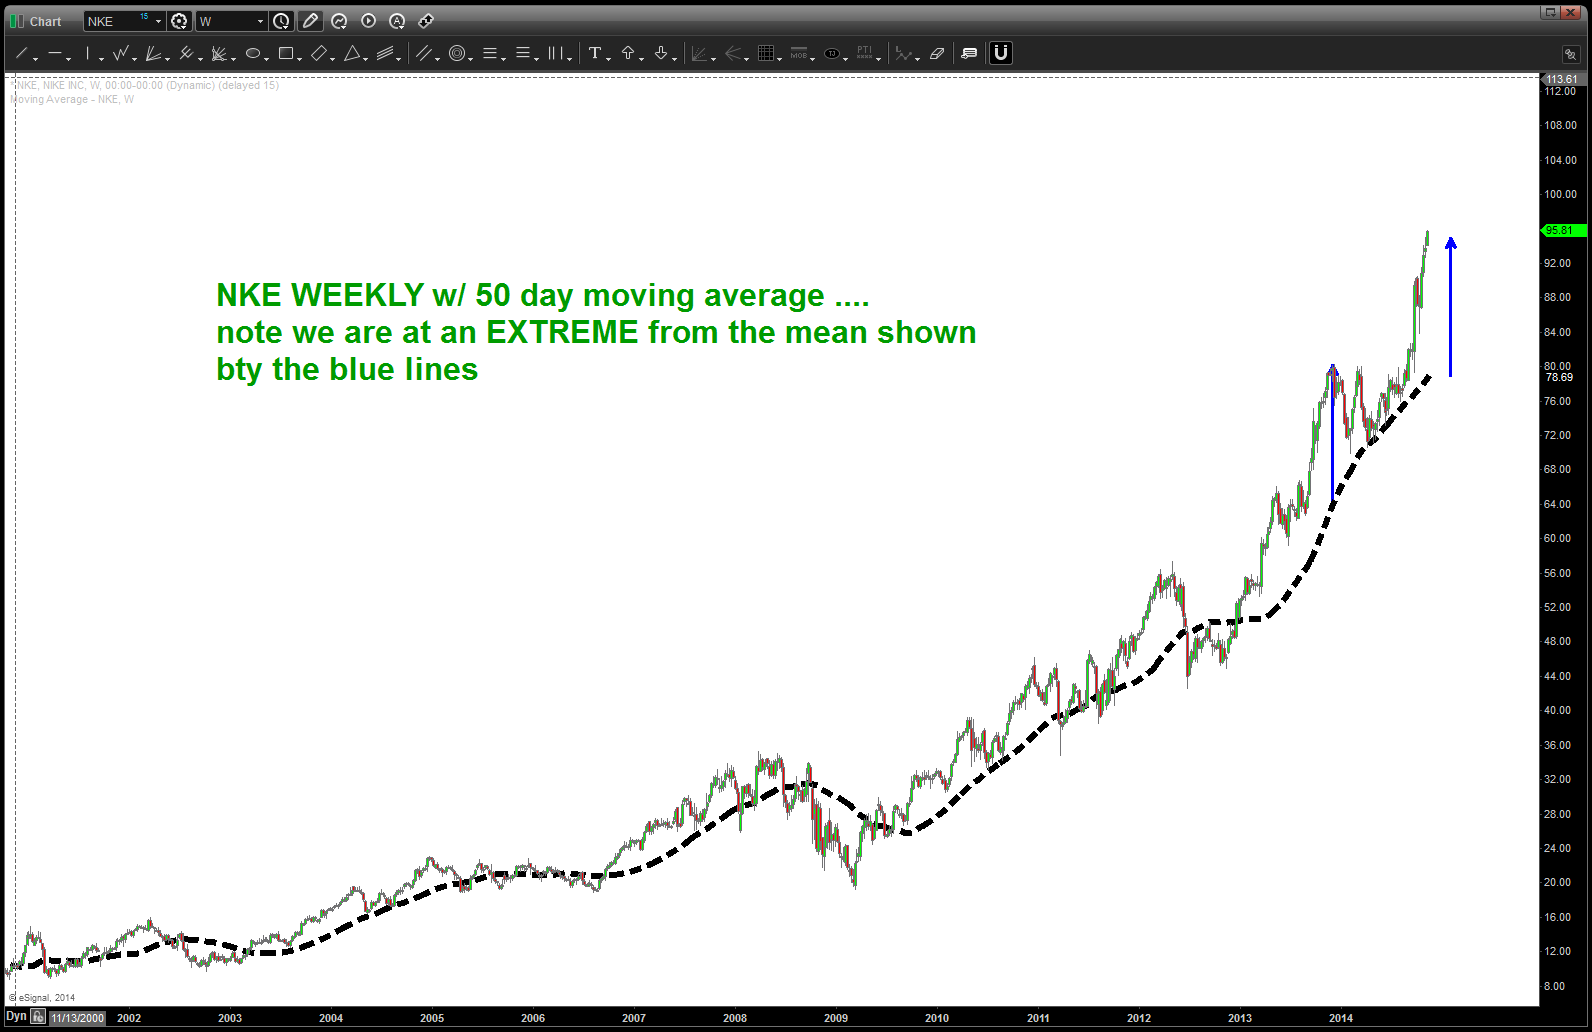
so, in conclusion, we are parabolic and another 10% move up – really quickly – is not out of the question. Believe the first hint of a SIGNAL REVERSAL CANDLE (weekly) would be time to take profits and, remember this is 3 of 5 (if my count is correct) so I will be looking to BUY NKE after the inevitable pull back in any parabolic.
questions to me.
Bart
Dow Jones Transports – almost parabolic UPDATED
Posted on May 14, 2015 Leave a Comment
As is usually the case, the transports are getting a lot of attention, now, and rightly so because they do look heavy and are a key ingredient to this incredible ride up.
I don’t know what makes up the transport index.
I don’t care what makes up the index.
I like geometry.
IN SEPTEMBER OF 2014 THE GEOMETRY SAID THAT THE TRANSPORTS WERE RUNNING OUT OF STEAM (PARDON THE PUN)
Here’s the updated chart:
Dow Jones Transports UPDATED
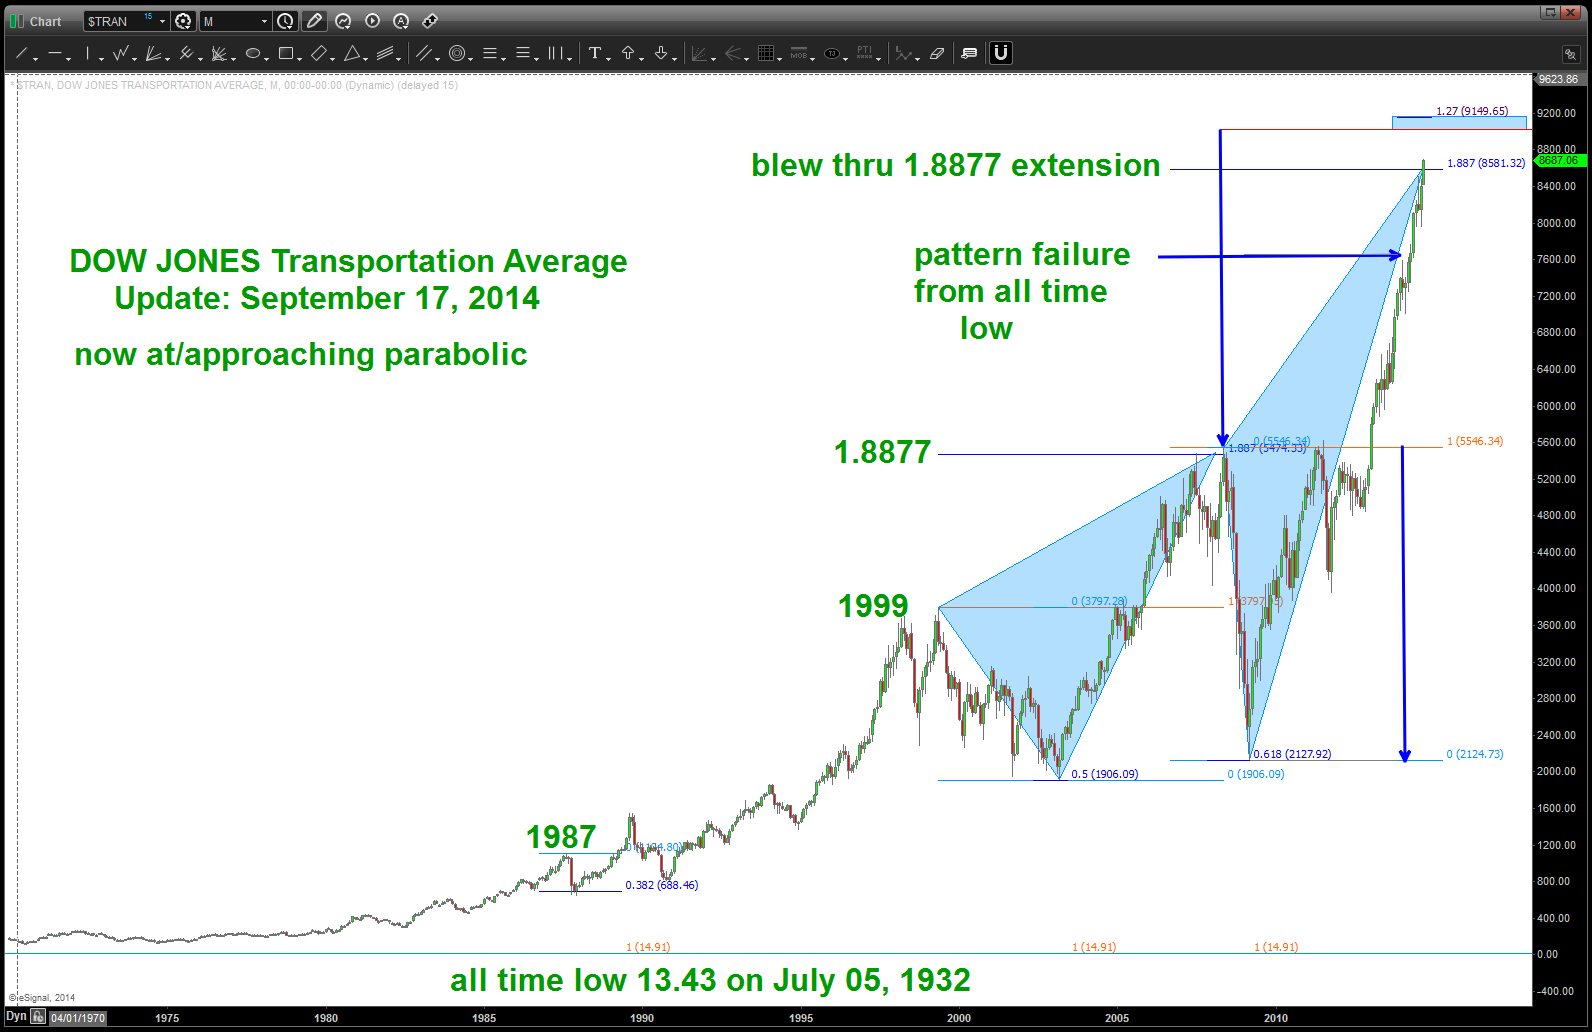
September 17, 2014: below you will see some of the continuing work I have done on the transports. Quite simply, an incredible move …
there are, however, some things we can learn from this from a PATTERN perspective:
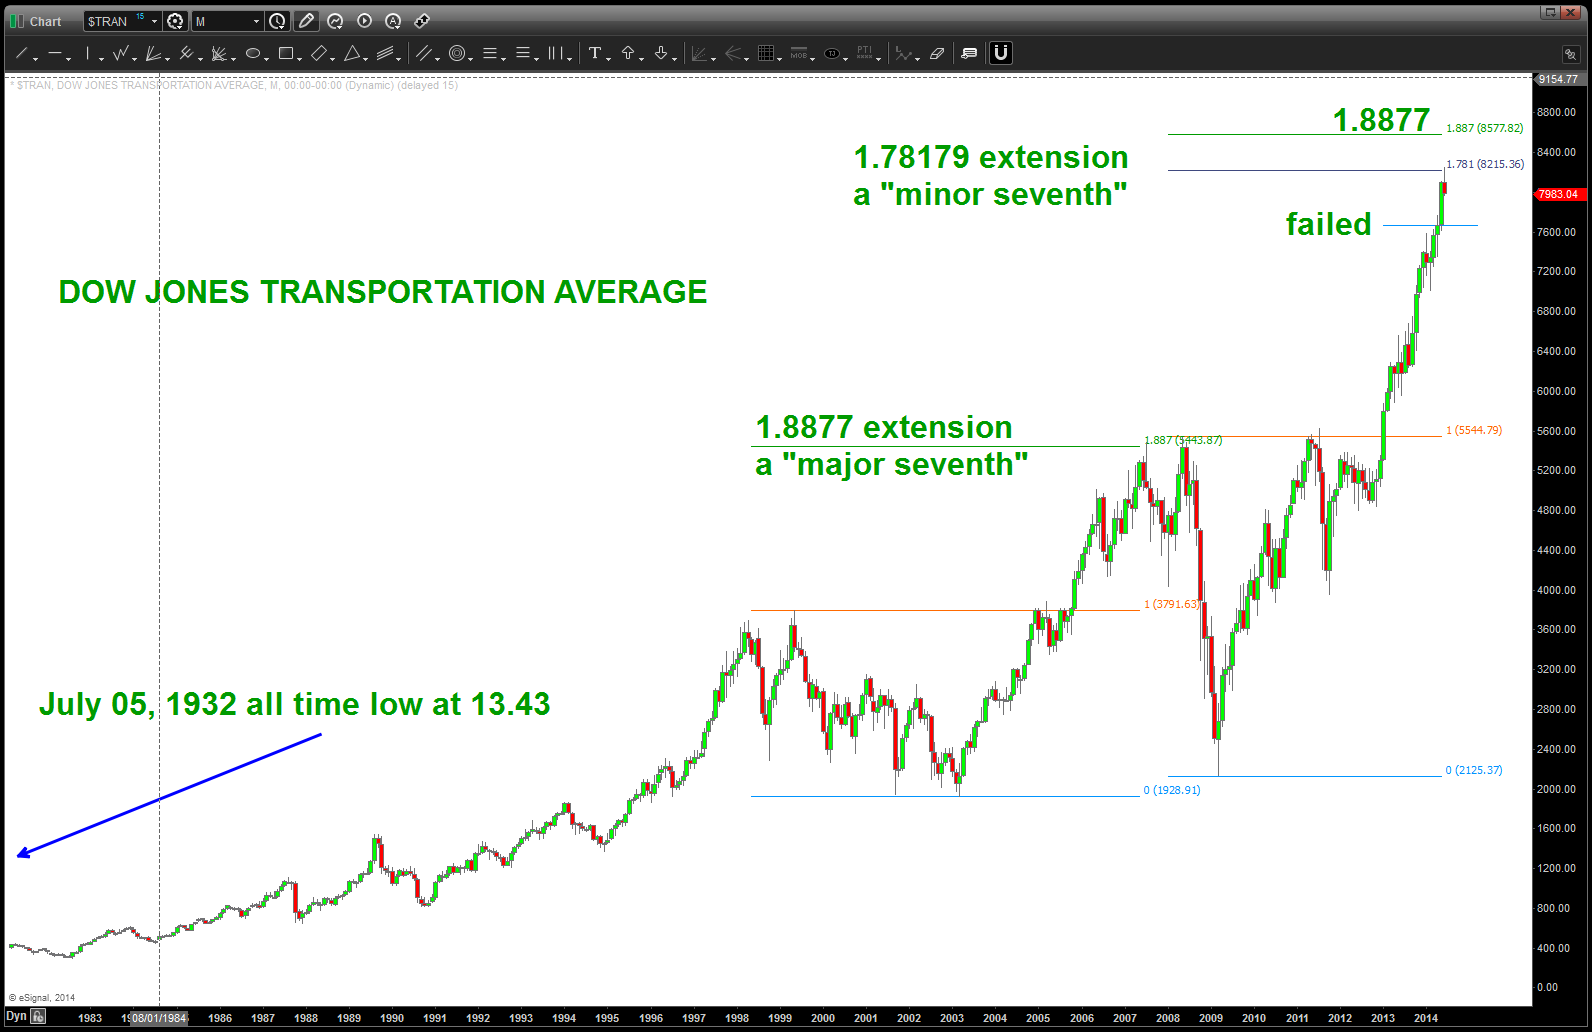
- my “job” as a PATTERN chartist is to do my best to find the patterns and then present them to you, my readers. (thanks for the following also) As a PATTERN chartist you are NEVER wrong. The PATTERN works or it doesn’t it … it has NOTHING to do w/ you. On long term time frames, well, the patterns are “easier” to construct. An all time low to a “former” all time high gives you AMAZING projection capabilities. In fact, it is one of our easiest PATTERNS to form – the “zig zag or AB=CD” PATTERN. Folks this formed on the Transports and got SMOKED … not even a token of resistance. Wow …
- when a “zig-zag” or “AB=CD” PATTERN fails it will usually go to 1.27 or 1.618 of the PATTERN.
- so, what do we have “now”
- note the all time low of 13.43 was on July 05,1932 a mere 30,024 days ago.
- using that low and a 1.27 AB=CD we get a target of 9149
- note, the “old” all time high in 2000 to the 2009 high was a 1.8877 extension (musical note). sometimes, the PATTERNS repeat the same harmonic. NOPE not today … blew threw it.
- also, you can see the blue arrow projections and the “minimum” objective of the head and shoulders BULLISH top that formed comes in around 8880

some other projections shown for the Transports
- note the all time low of 13.43 was on July 05,1932 a mere 30,024 days ago.
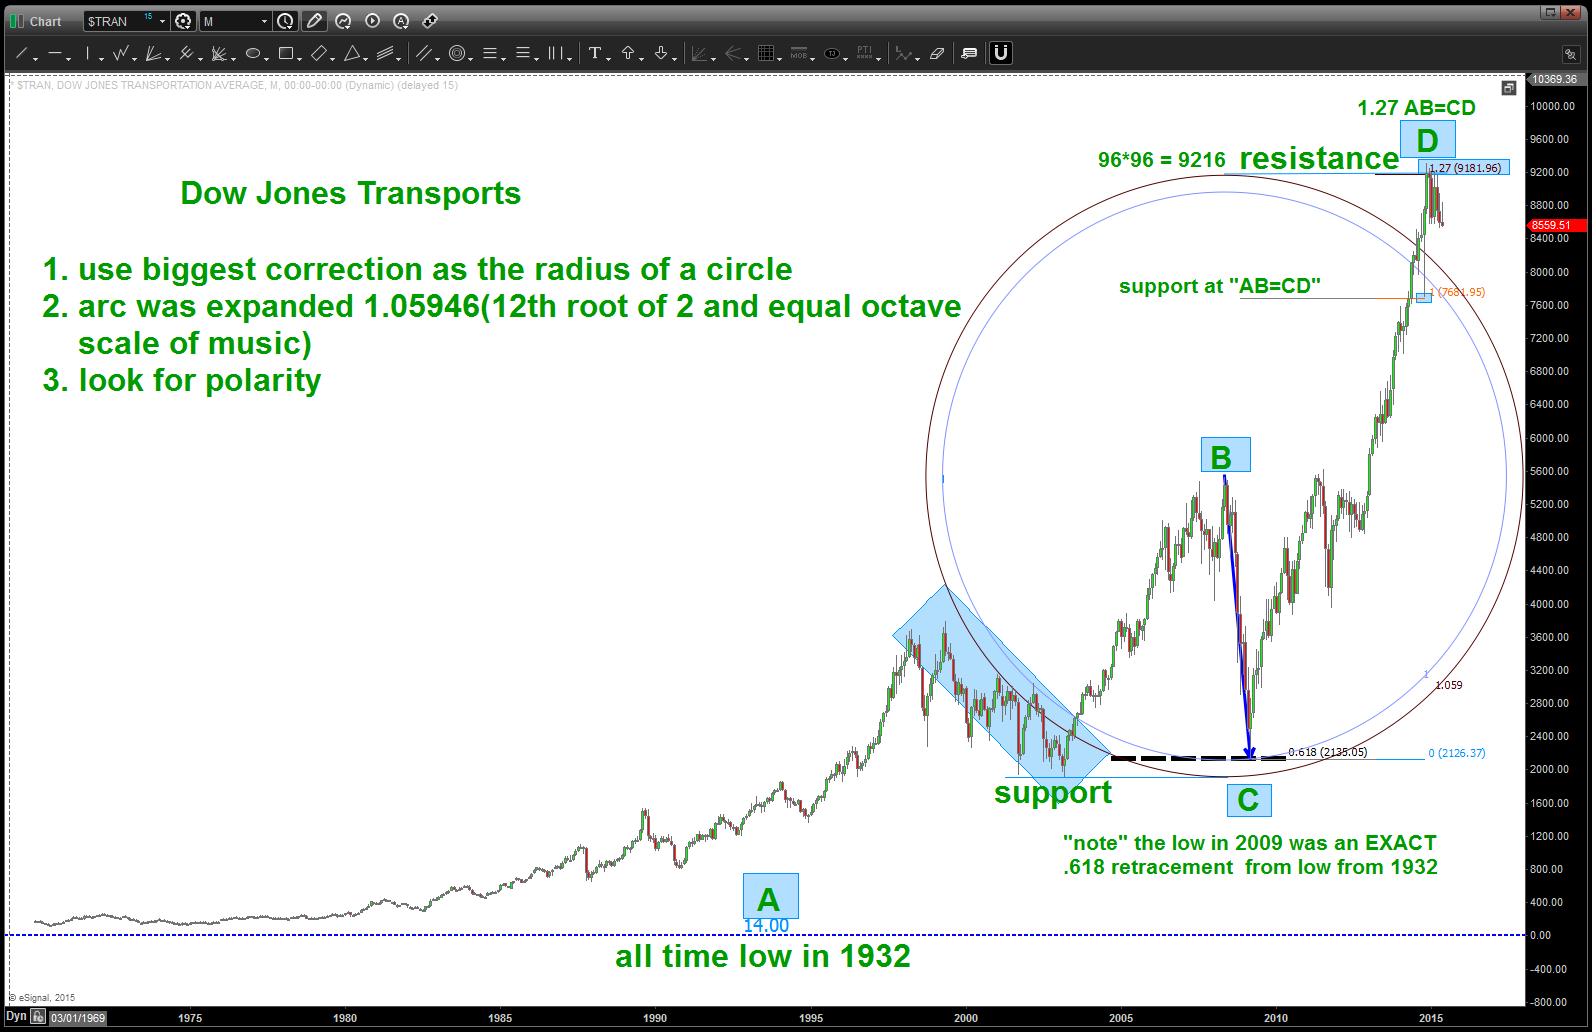
Since this move is going PARABOLIC it’s sometimes helpful to bring out the old geometry … this is simply the technique of how to draw a circle from 3 points. (full disclosure: I have NO IDEA where the GRAVITY CENTER is going to end up.) Note, when using this technique our gravity center is, basically, the zone for the past major top in the Transports.
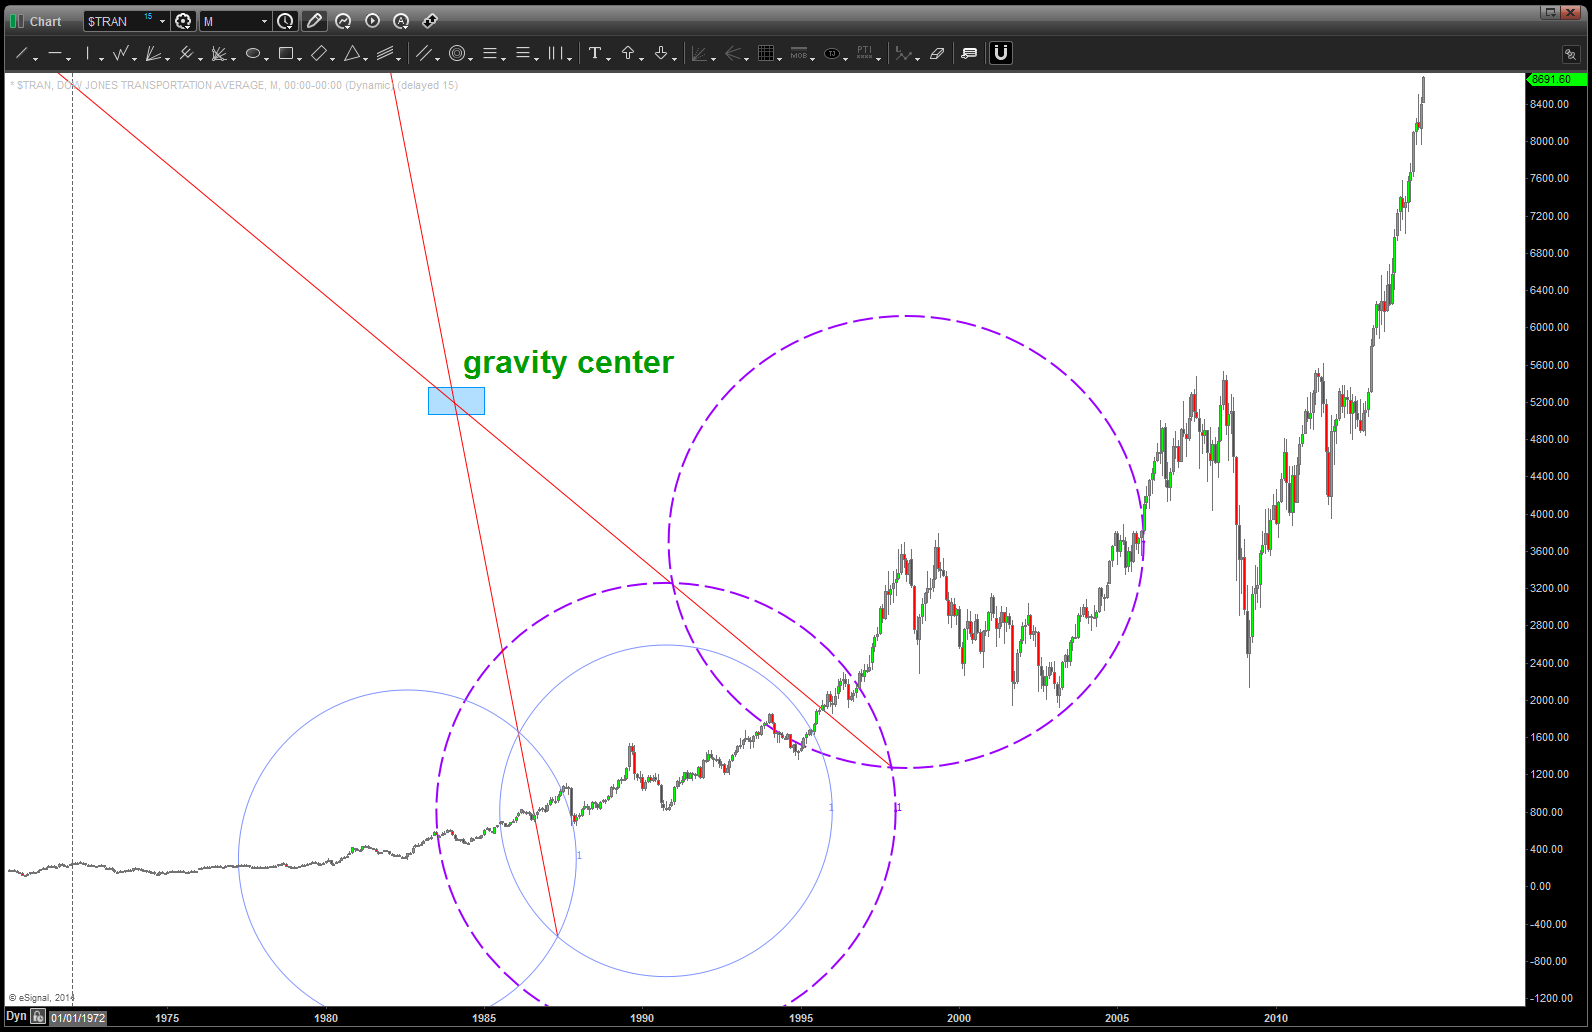
finding the gravity center
now that we have found the gravity center we can get to work ….
- note, the gravity center (blue horizontal line) is the “reason” for the major tops
- note from 1994-1999 price “hugs” and rolls right up into the top. that tells us we have a nice gravity center …
- note also that when we draw, from the gravity center, harmonic trend lines we find the “major reason” for support and resistance …
- when projecting from a neckline, remember, the depth of the neck is how to project UP (in this case) to project a minimum target. (again, it’s minimum target, NOT the target or though it can be)
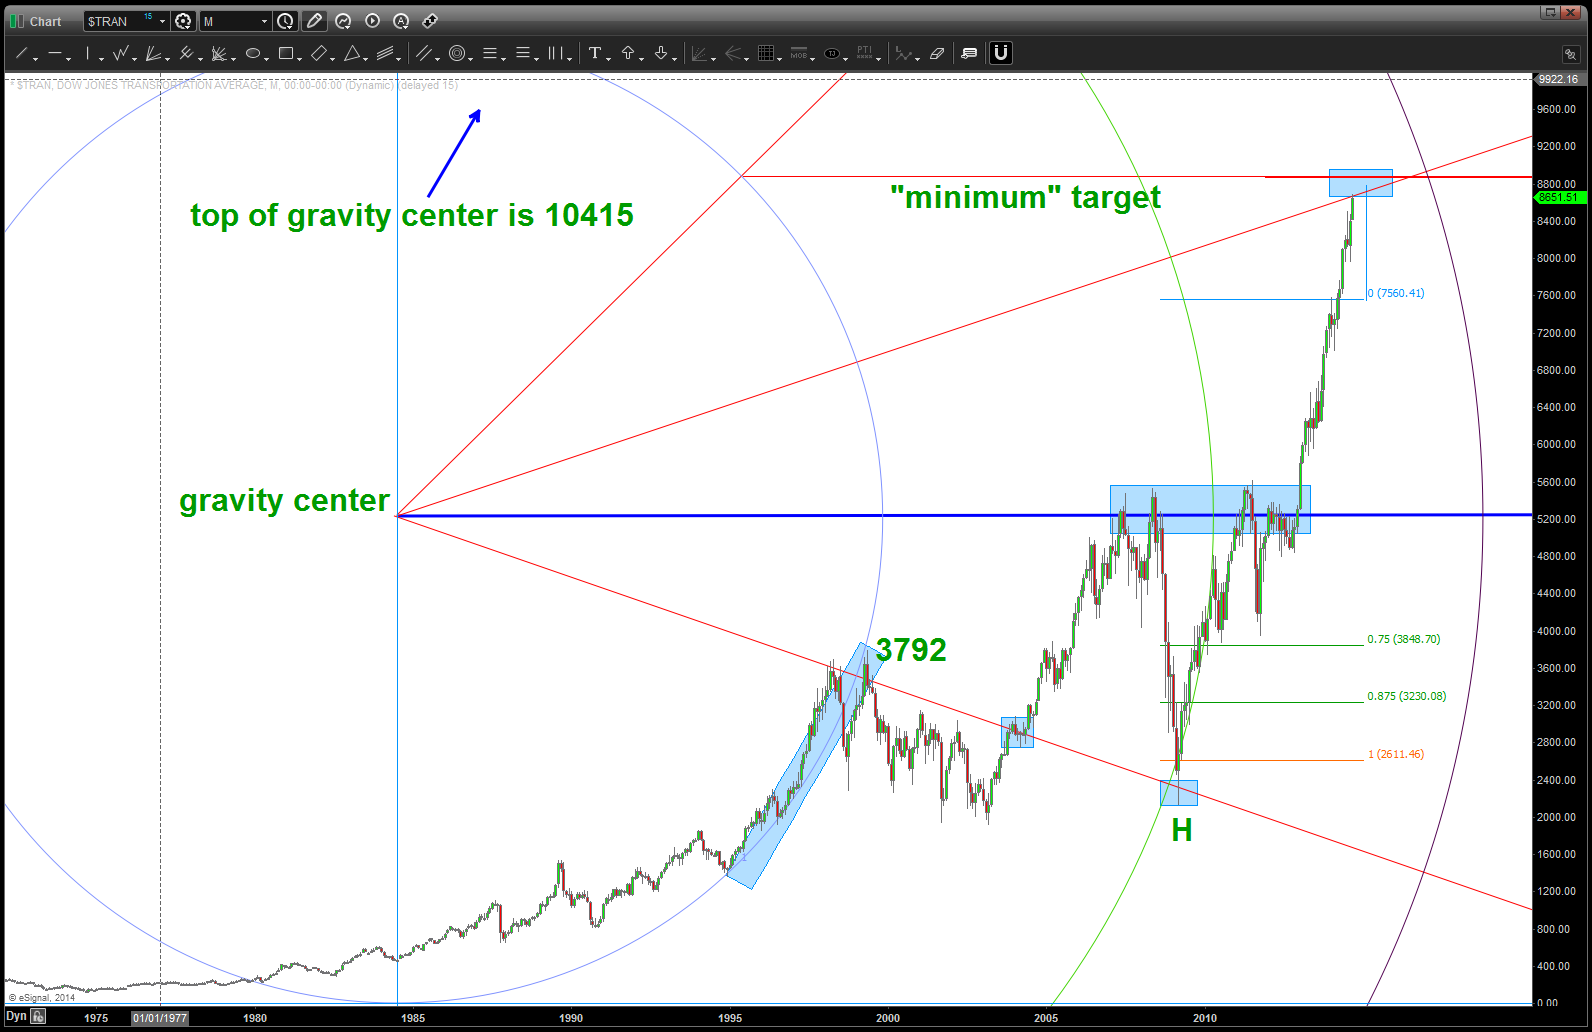
gravity center harmonics
CLIFF NOTES: this is an incredibly powerful move. Some more targets are coming into play as noted above. when the PATTERN around 7600 failed the vacuum up was to be expected.
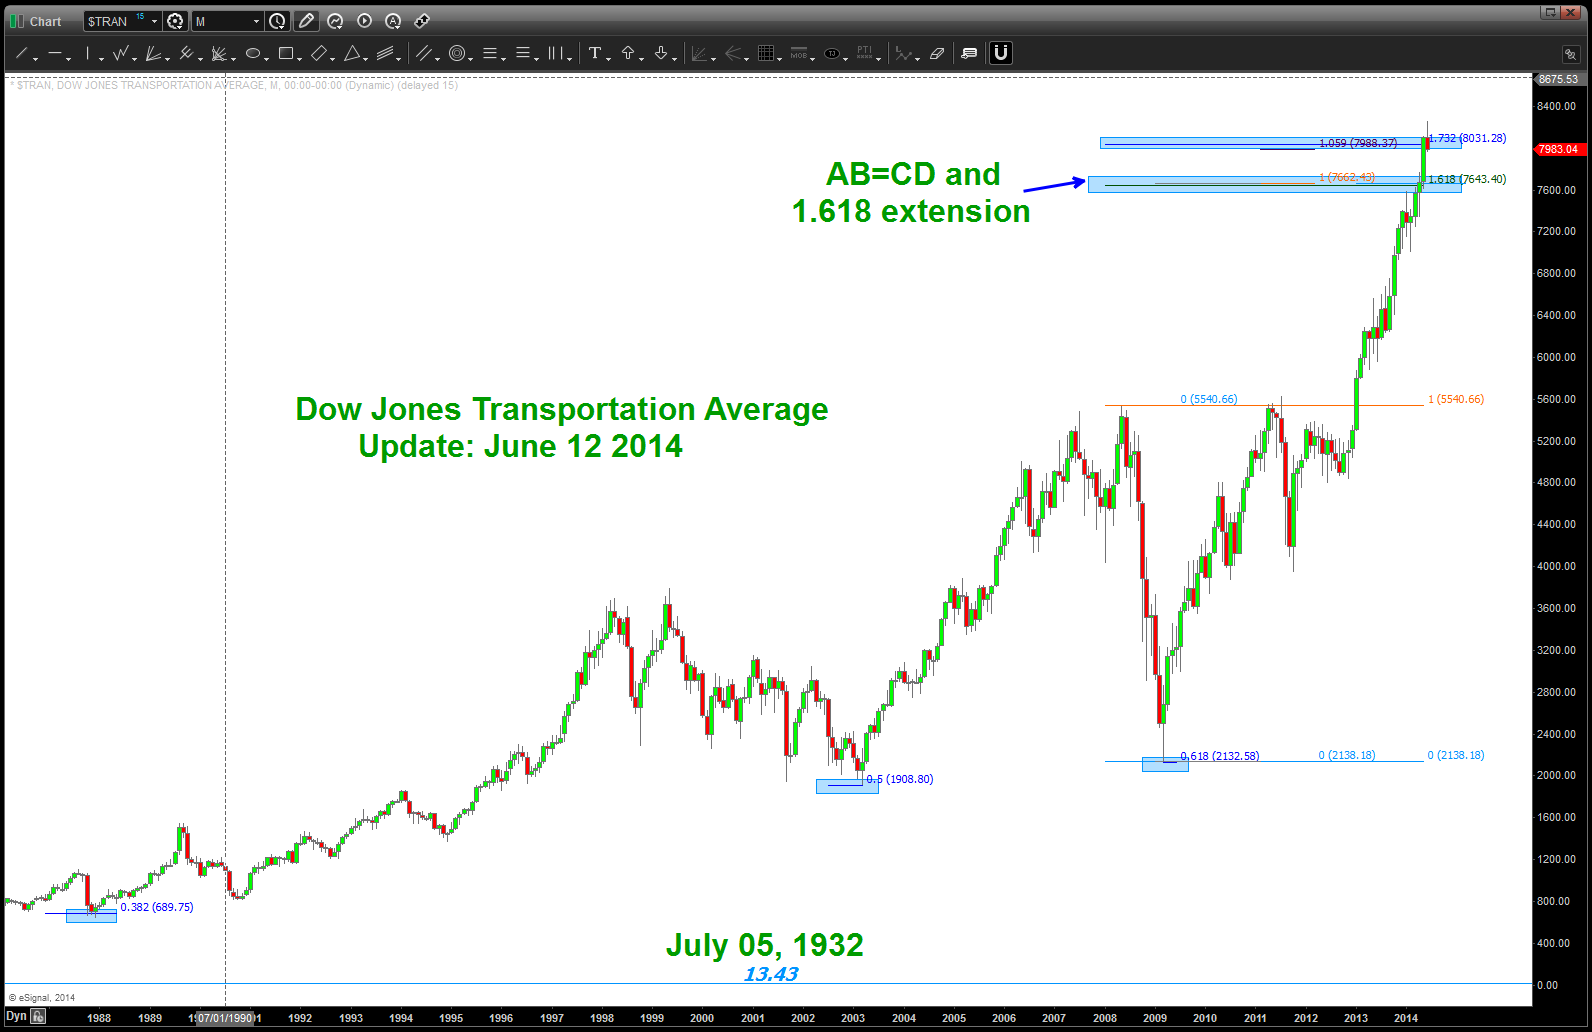
June 12, 2014: more than likely, you saw my long term transports post a couple months ago and as this target got attacked I was truly looking for a “little” resistance. I mean, come on, it was the ALL TIME LOW to the “old” ALL TIME HIGH and we have a 1.618 extension RIGHT ON TOP OF THE LEVEL. As patterns go .. this was a doozie. However, as patterns go, it failed. Folks, it didn’t even put up a fight …
so, I hit “erase all” on the chart and, quite frankly, left it alone. the joy of patterns and charting …
I went back to it tonight and I still think we have a pattern forming so I went back and said “self, what did it do the last time we surged past an old high and into a new high? Well, guess what? It surged thru the 1.618 extension in 2007-2008 an stopped on the 1.8877 extension! TILT … 1.8877? Well, that is exactly a major seventh ration in the equal octave scale of music. So .. perhaps it did that again? Please see below …we smacked into the minor and, quite frankly, the major is still out there. However — this sure looks like a MONTHLY 3 DRIVES TO A TOP pattern.
Keep the mindset (defensive) of ‘breaking a swing low’ …until we do break a weekly or monthly swing low this puppy will still keep running but if we break 2 or more weekly swing lows … we could see this thing drop to the old highs at 5600. Stay tuned …
What a run! Hugh?
Also, please be advised that a reader corrected me on the price and time of the old time low. I did some more research and it appears the low was in the 1930’s around 30 points lower than the one in the late 1800’s. Negligible when we are up at 8000 BUT extremely important.
When you look at the Yahoo Finance Chart below – try to disregard this is the entire life cycle of the Transports – and just look at the symmetry of the 3 drives to a top pattern that is appearing.
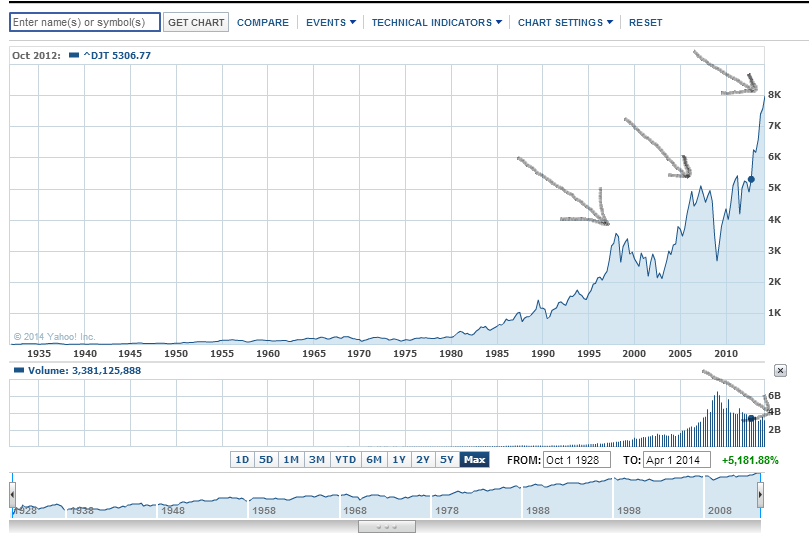
notice the decreasing volume and POTENTIAL 3 drives to a top
Get ready to rumble ..
Posted on April 22, 2015 Leave a Comment
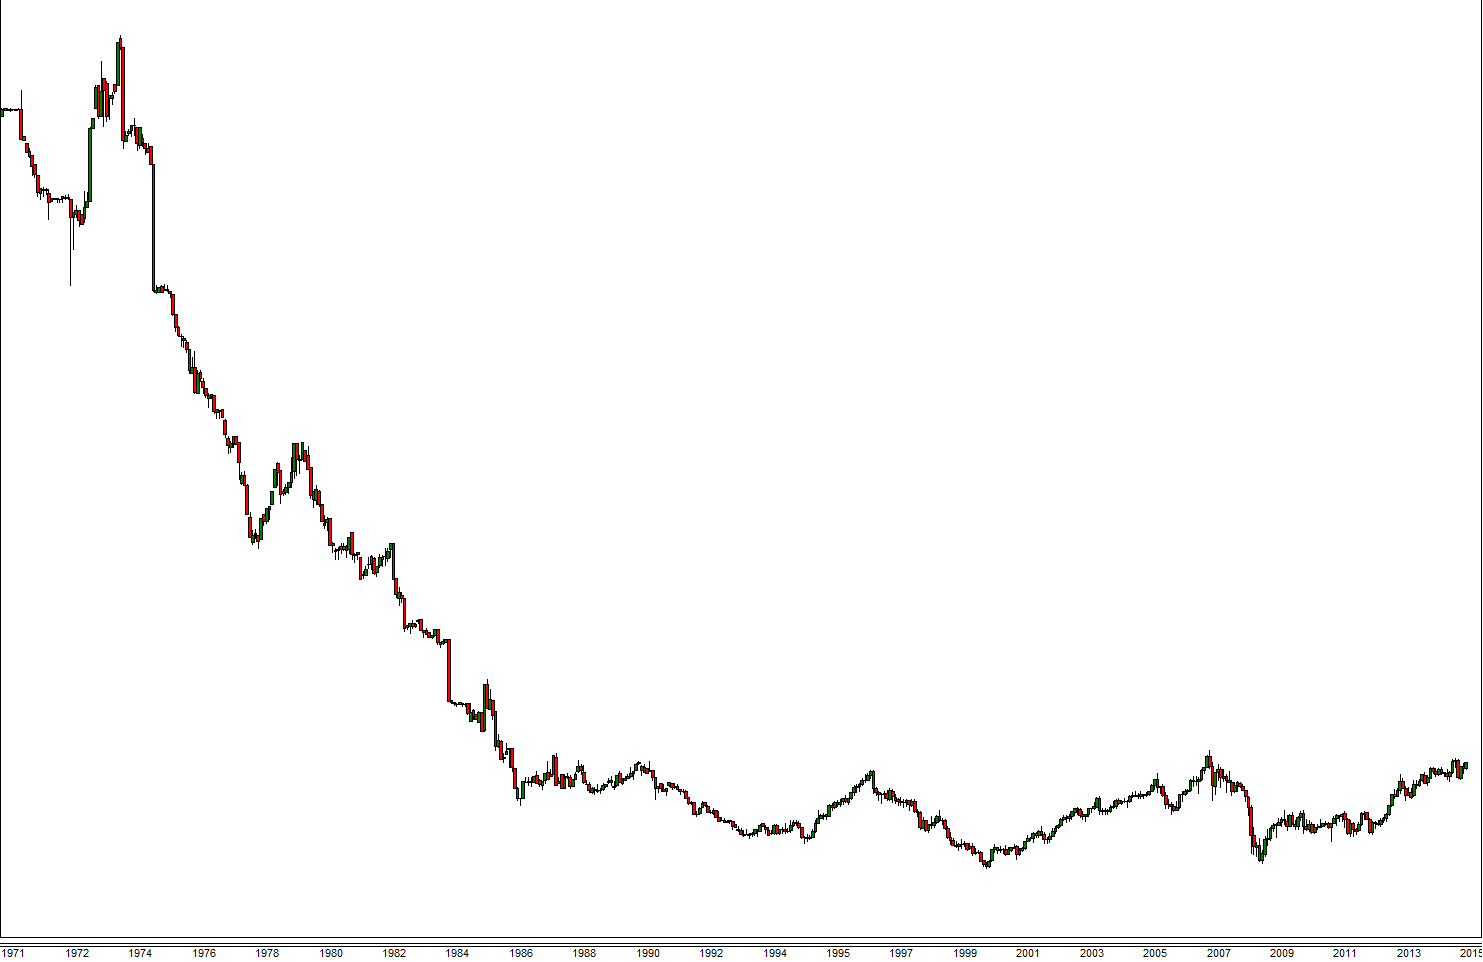
look at this set-up ….
you can tell this is a currency chart by the 1971-1972 period (when “they” started floating exchange rates.
from the high in 1973-1974 this puppy went straight down into 1986 and then built a base of, roughly, 30 years.
when and IF this base blows to the upside – game on.
will update, in the coming days, the currency pair and strategies to employ …
make it a great day.
Bart
Some musings on IBM posted on @seeitmarket
Posted on April 21, 2015 Leave a Comment
enjoy .. this one has been very interesting to watch.
follow the link above:
- note the PATTERN held … again, we know nothing about the fundamentals of IBM. Just numbers …
- note the .618 retrace of the relative strength held .. in the minds of the traders, they shifted to IBM outperforming at the EXACT .618 retrace
- note the BIG GAP that it hit today and fell … it’s going to be tough to overcome a 7 dollar gap but time will tell.
enjoy and let me know if you have any questions.
Bart
