Aussie vs USD bottom in place?
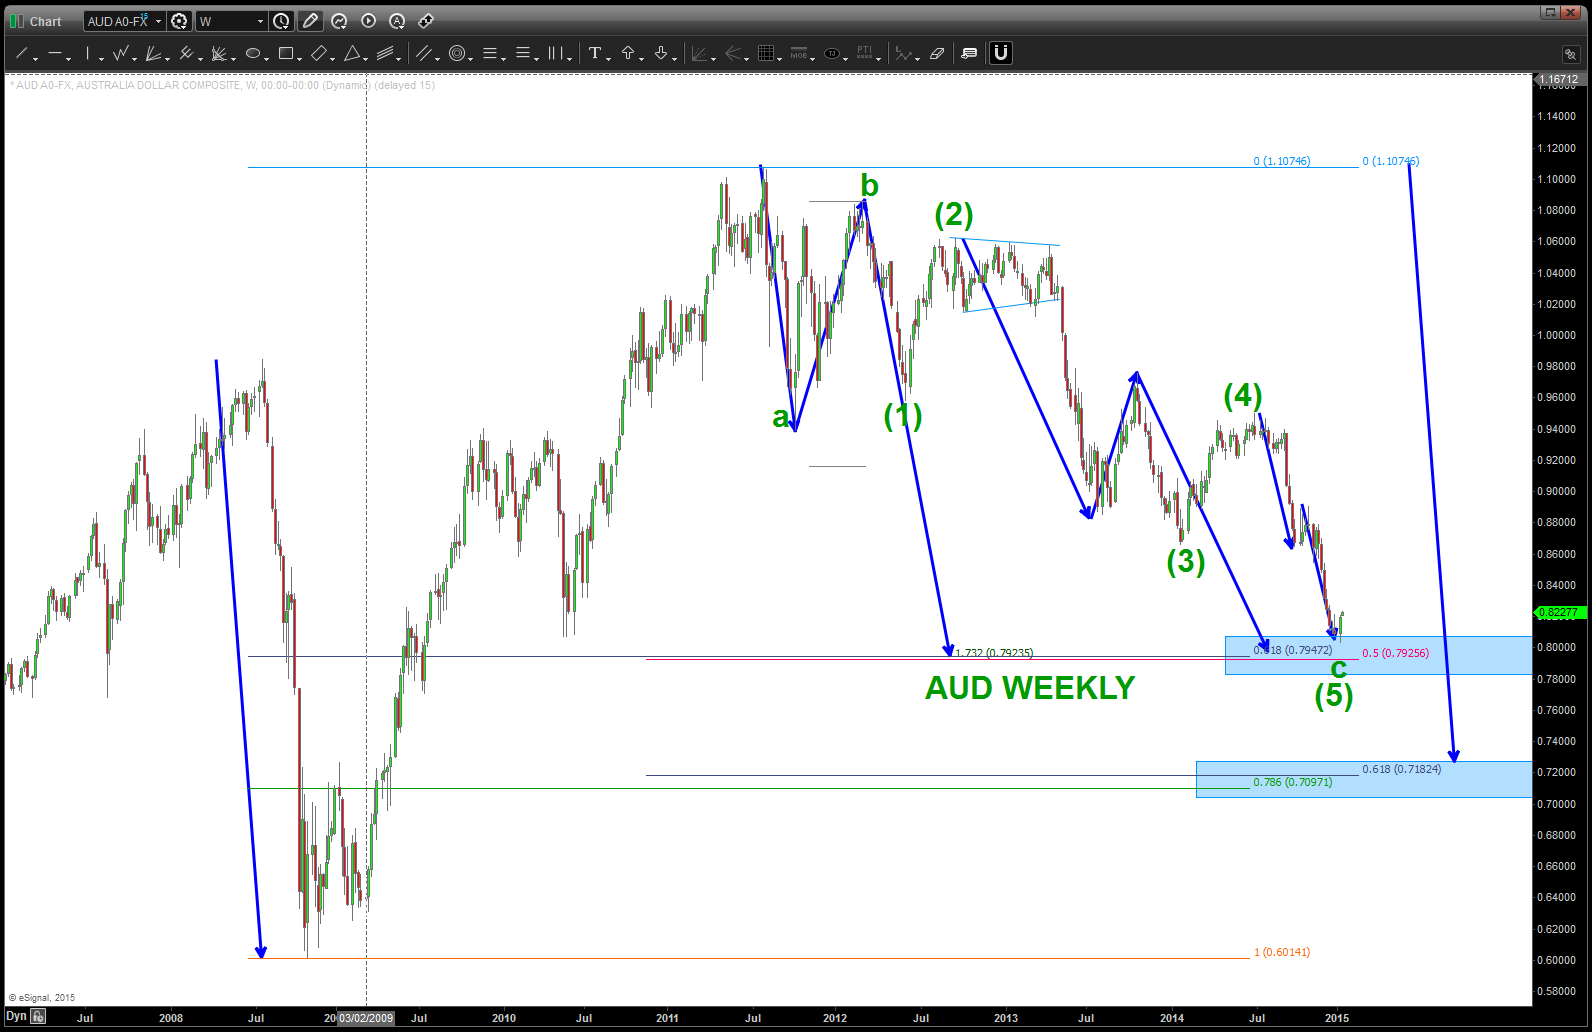
Folks, back in October the post below the two dash lines was searching for a low to be in place on the AUD. The form and proportion were just about right. However, w/ the big move in crude, the interest rate extravaganza and the a whole host of other fundamental reasons the real issue is the PATTERN level didn’t work … it went approximately 300 pips below. HOWEVER, the overall thesis that the Aussie is bottoming versus the dollar still holds true. It’s showing some nice strength tonight …would love to get a very nice pullback to go long in/around these levels.
Updated charts below:
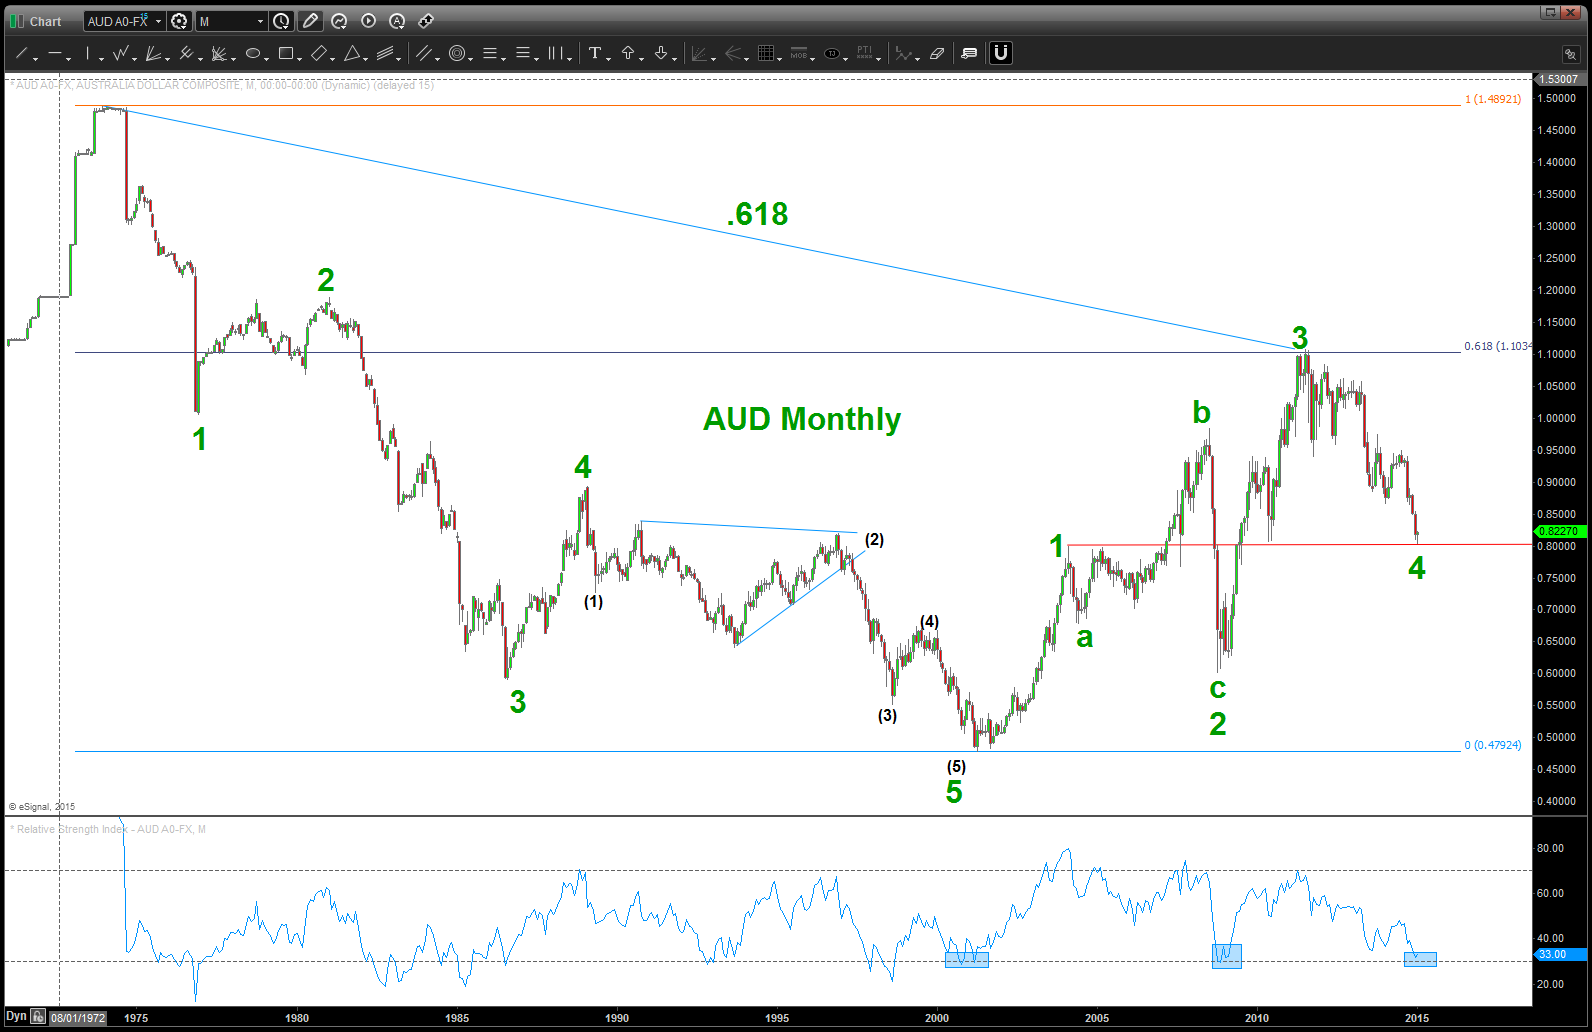
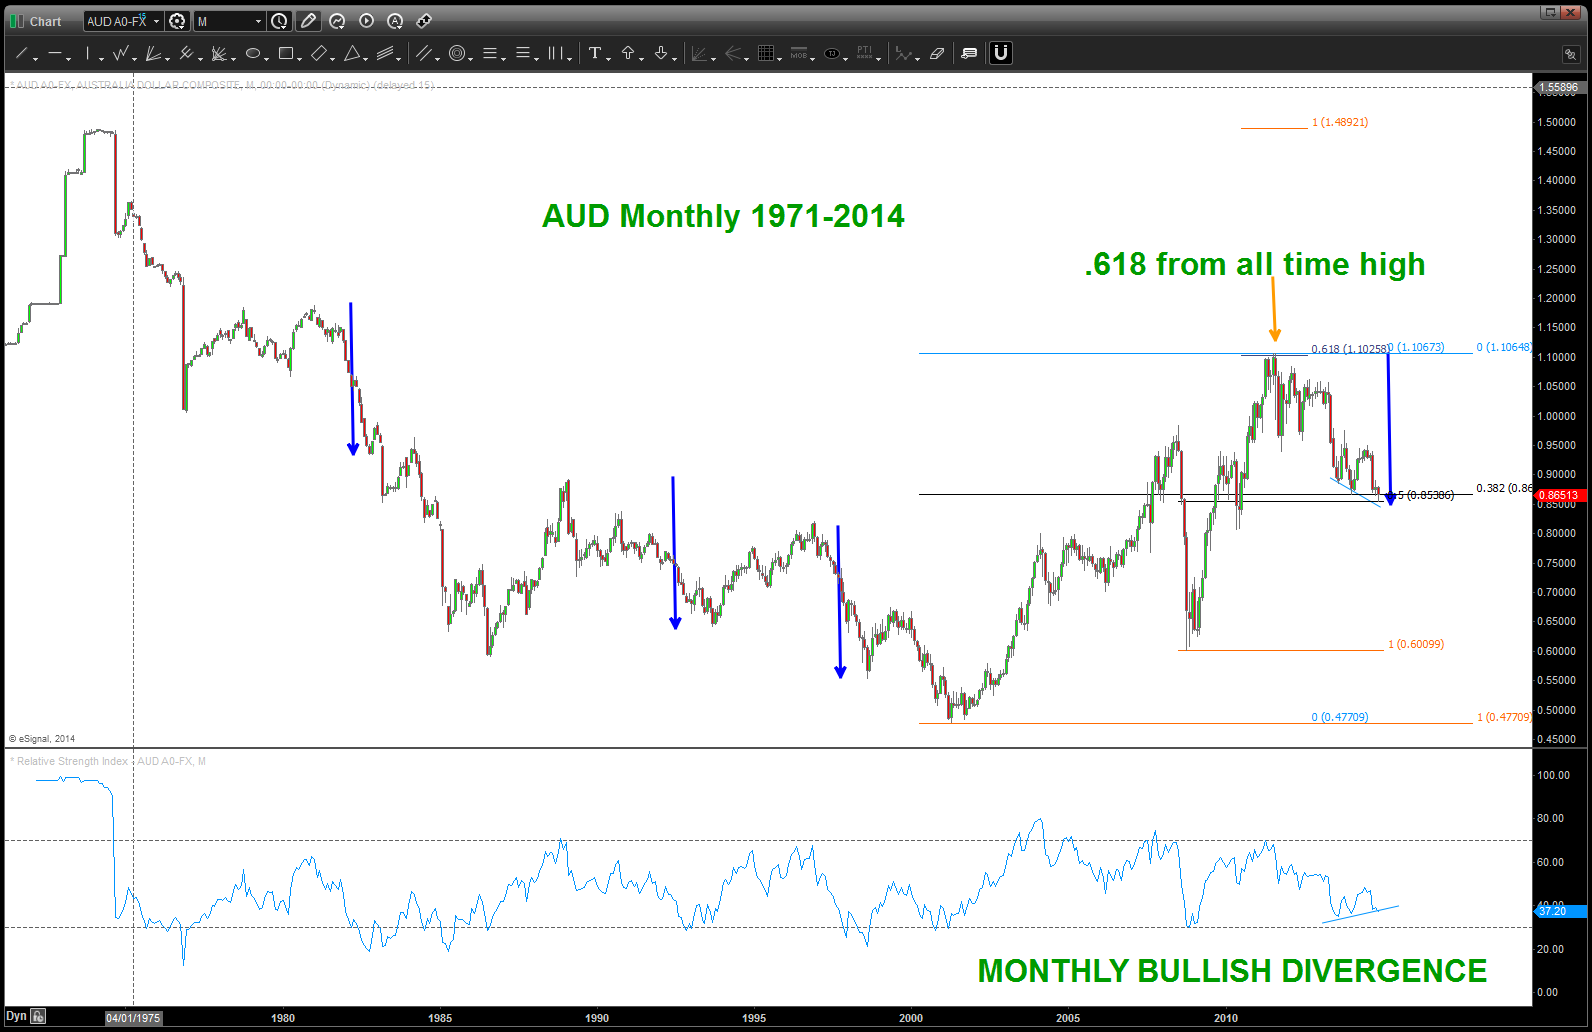
Note the monthly RSI levels … the BIG MOVES UP occurred right where we are sitting. Also, a case can be made that 4 is complete and we are going to new highs …
last time I checked the Aussie wasn’t part of the US Dollar index … so, watch this one closely. At a minimum we are completing/completed an A and a nice B wave up is to occur.
let’s just get on the right side of the trade and right now that looks like bullish entry for the AUD vs USD.
The Aussie has been correcting for a while and, folks, the move down from 1.100 ish certainly appears to be corrective. What does that mean? We are “at” or “near the beginning of a multi year advance that will take out the high July 2011. Here’s the monthly picture …
TILT … everyone is talking about US Dollar strength – yes, but they are talking about the dollar index which the Aussie isn’t even a part of it. Or if it is the weight is negligible so in this case we have to take this pair as a single entity – not a weighted index.
here’s the weekly:
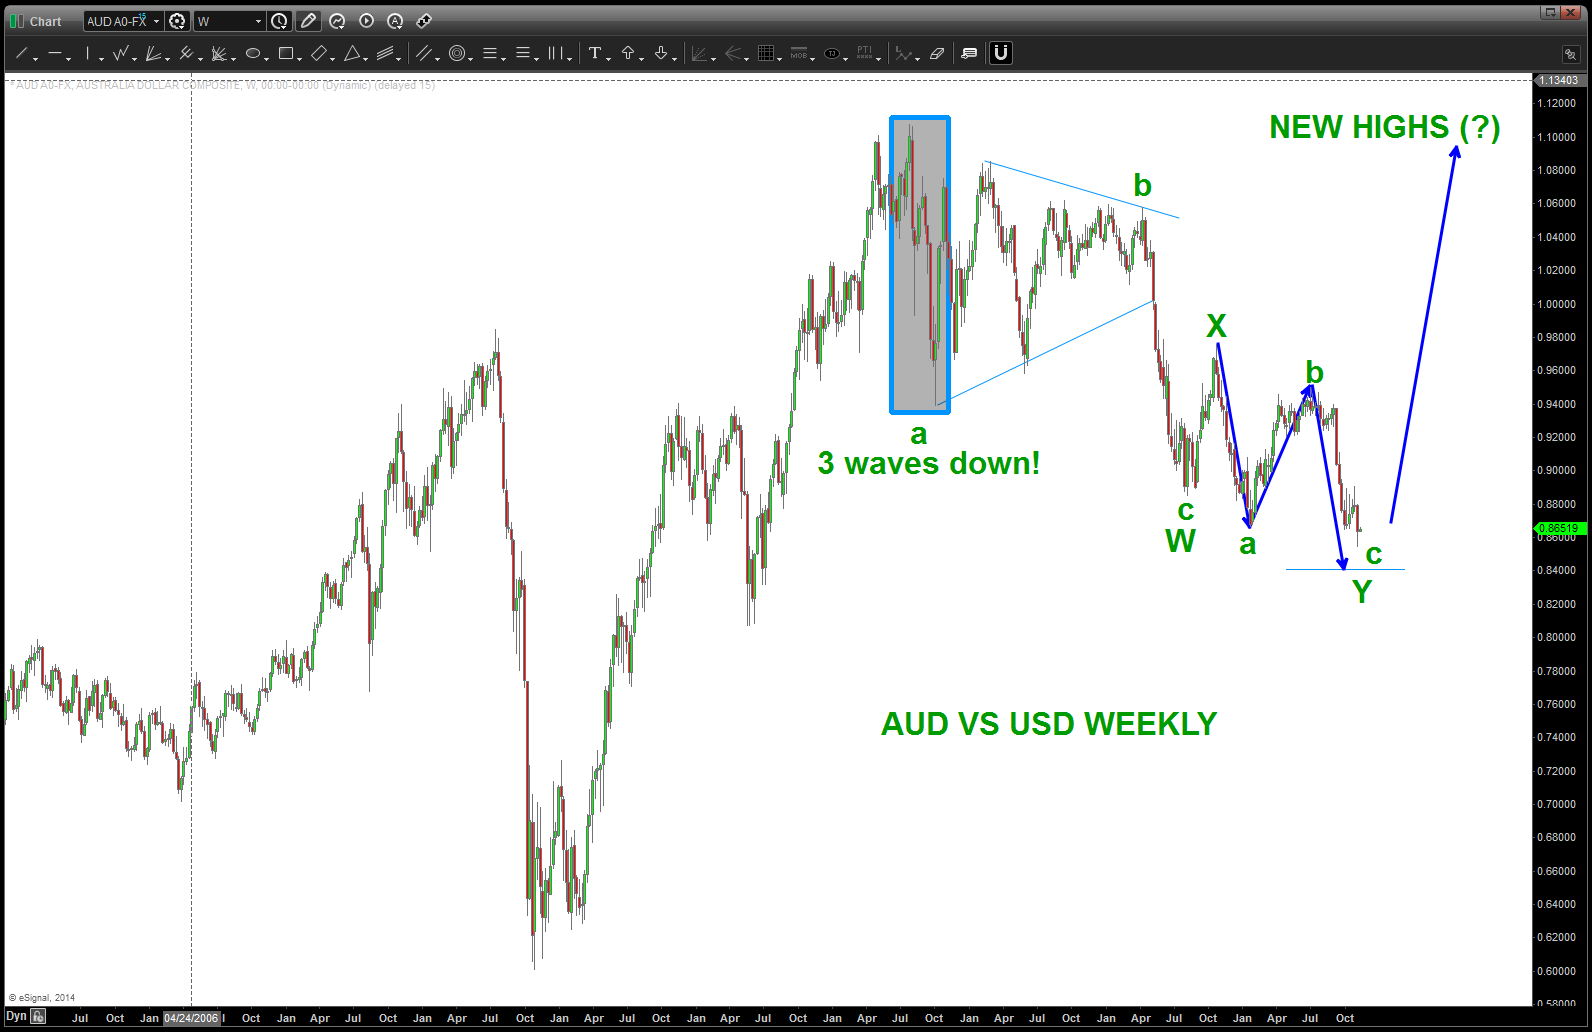
note the 3 waves down … that is the key. it was not a 5 wave movement. has this correction been complex – yes. But it’s falling right in line w/ a double three labeled w,x,y.
and, the daily, shown below, just completed 5 waves down. While it would be perfect symmetrical three drives to a bottom is we go down and attack 8400 – there is a good case to be made that a low is in place. we’ll have to wait for an intraday pattern to appear …
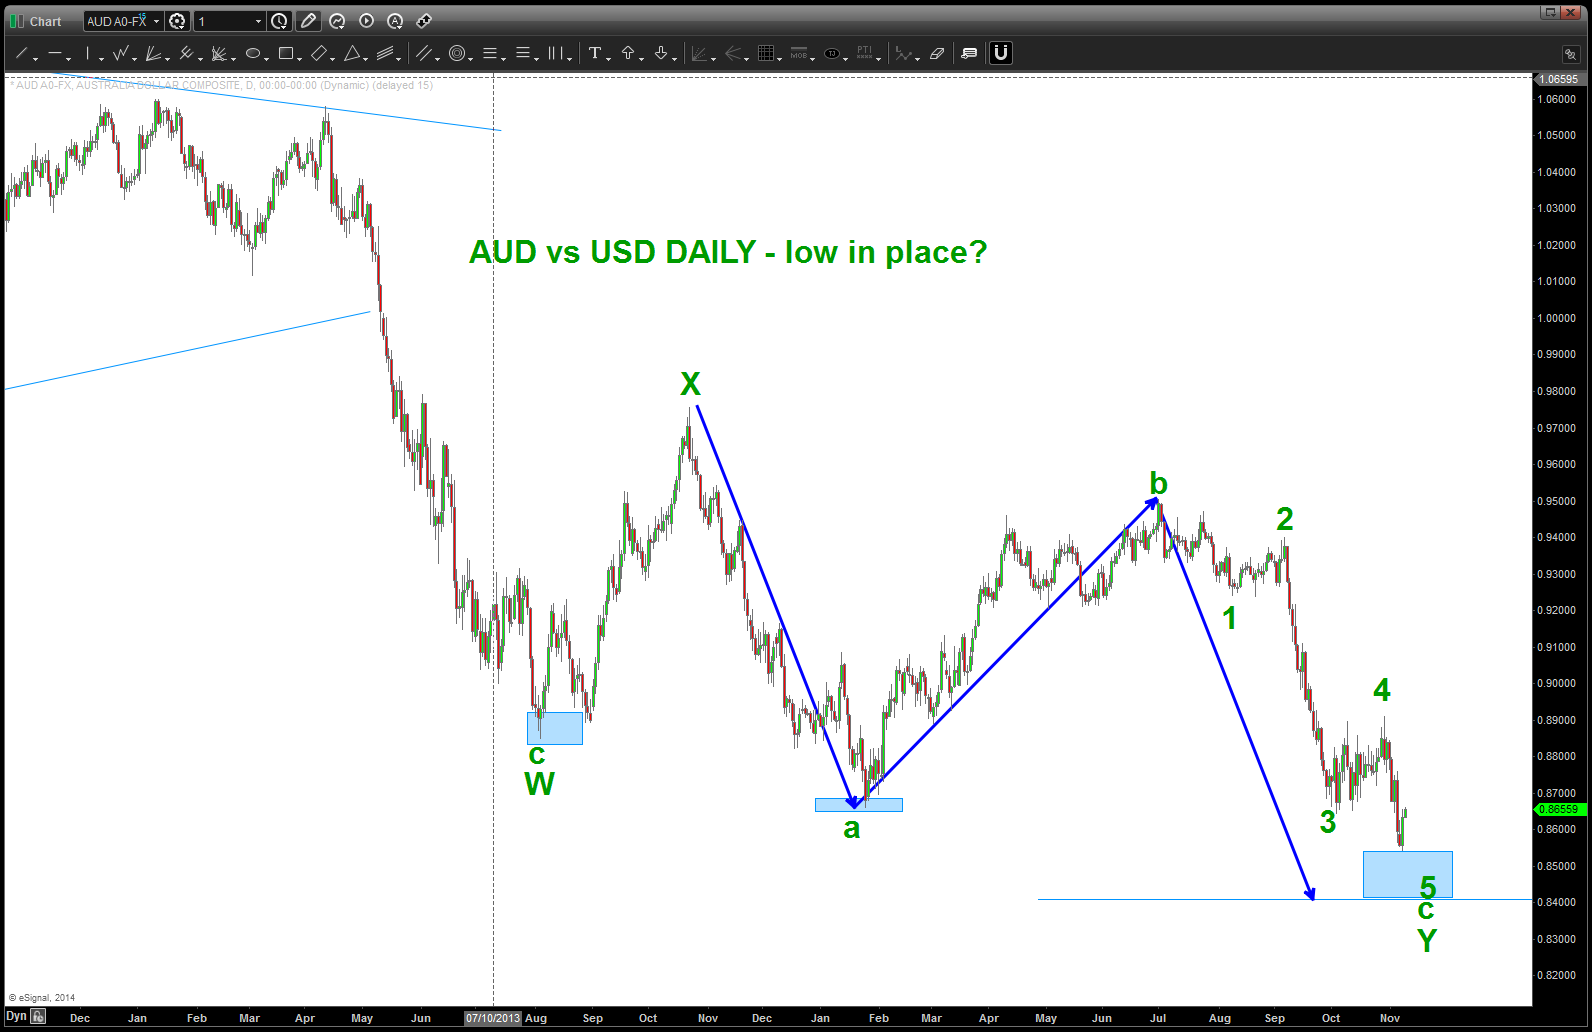
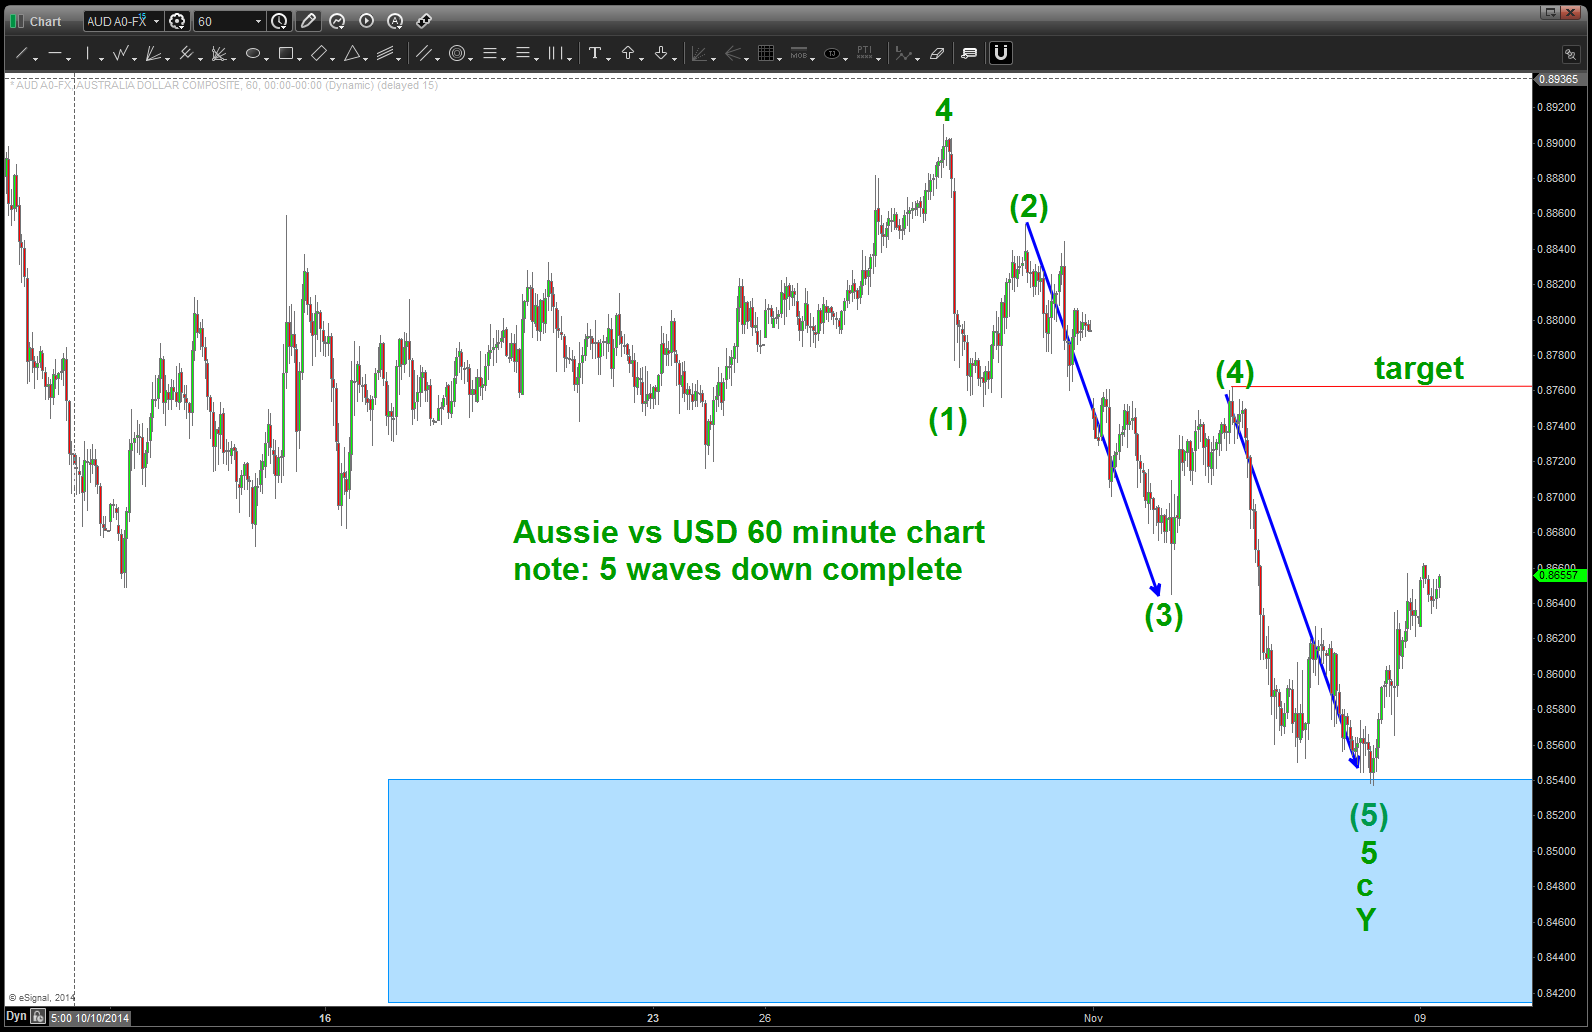
and finally, we’ll see the move down on a 60 minute chart is a clearly defined 5 waves.
so … there ya have it.
what to do? Well, our thesis is we are beginning a multi year move to take out the old highs from 2011. IF THAT IS CORRECT THEN WE ARE IN the first stages of the advance. the first move up (wave 1) will complete and then wave 2 will come and, more than likely, w/ a vengeance because everyone thinks the “old trend” is in play. That’s the BUYING OPPORTUNITY and price should never go below the low that was formed last week.
stay tuned …get ready to rumble.
Bart
